
Do Water and Nitrogen Management Practices Impact Grain Quality in Maize?


1
Throckmorton Plant Sciences Center, Department of Agronomy, Kansas State University, Manhattan, KS 66506, USA
2
Sustainable Intensification Lab, Kansas State University, Manhattan, KS 66506, USA
*
Authors to whom correspondence should be addressed.
Agronomy 2021, 11(9), 1851; https://0-doi-org.brum.beds.ac.uk/10.3390/agronomy11091851
Submission received: 17 August 2021
/
Revised: 8 September 2021
/
Accepted: 13 September 2021
/
Published: 15 September 2021
(This article belongs to the Special Issue Effect of Biotic and Abiotic Factors on Plant Growth and Nutritional Value of Field and Vegetable Crops)
Abstract
:Concomitantly pursuing superior maize (Zea mays L.) productivity with grain quality is essential for food security. Therefore, this study provides a meta-analysis of 21 studies assembled from the scientific literature to tackle the effect of the two most limiting factors for maize production, water and nitrogen (N), and their impacts on grain quality composition, herein focused on protein, oil, and starch concentrations. Water stress levels resulted in erratic responses both in direction and magnitude on all the grain quality components, plausibly linked to a different duration, timing, and intensity of water stress treatments. Nitrogen fertilization more consistently affected the grain protein concentration, with a larger effect size for protein as fertilizer N levels increased (protein change of +14% for low, ≤70 kg N ha−1; +21% for medium, >70–150 kg N ha−1; and +24% for high, >150 kg N ha−1). Both starch and oil grain concentrations presented less variation to fertilizer N levels. The positive protein–oil correlation (r = 0.49) permitted to infer that although the oil concentration may reach a plateau (8%), further increases in protein are still possible. Augmented research on grain quality is warranted to sustain food production but with both high nutritional and energetic value for the global demand.
1. Introduction
The overgrowing demand for an improved quality of agricultural products has stressed the already present need for food, feed, fuel, and fibers. In recent years, there has been greater emphasis on the quality of cereal grain in addition to yield. For this study, we use the term ‘grain quality’ to explore the impacts on the protein, oil, and starch compounds of cereal grains. From the perspective of crop improvement, plant breeders face a dauting task to create more nutritious crops (‘biofortification’) without compromising further yield gains [1,2]. However, the development of nutritious crops requires a joint effort of multiple disciplines, from agronomy to food scientists [3].
Cereals contribute to roughly 60% of the total world food demand [4]. Within the cereals, maize (Zea mays L.) plays a significant role in animal feed and human nutrition, as the main source of both energy and protein for tropical and sub-tropical regions [5]. It is also one of the most important staple food crops for humans and key for global food nutritional security in both developed and developing countries. During the last few decades, it has also gained significance as a source of vegetable oil [6]. In 2019, the global maize harvested area was roughly 197 million ha, with a total production of 1148 million tons and an average yield of 5.8 Mg ha−1 [7]. From a grain composition, the mature grain of dent maize presents 60 to 72% starch, 8 to 11% protein, and 4 to 6% oil [8]. Starch and protein are mainly stored in the endosperm (ca. 90% of the grain weight), while the oil is mainly in the embryo (ca. 10% of the grain weight) [9]. For this study, grain quality is investigated as the grain protein, oil, and starch concentrations change.
Maize grain yield and quality attributes are interrelated and are highly influenced by environmental conditions [10]. One of the major abiotic stresses related to climate change is water stress (drought), adversely impacting the yield and quality of many field crops [11]. It has been demonstrated that drought could decrease the starch concentration and increase the protein concentration in the grains of many crops [12]. Non-limiting water availability during flowering and grain filling periods increased the grain yield and protein concentration in maize [10]. Severe water stress decreased the grain yield and starch but increased the protein concentration in maize relative to no stress conditions [13]. Water stress during grain filling stages decreased the grain yield but may present no major changes in the protein and oil concentration [14]. Drought stress after pollination significantly decreased the grain yield, increased the grain protein concentration but not starch [12], while water stress during the late vegetative stages increased the seed oil concentration in maize [6].
The management practices modifying the availability of resources, especially during critical periods, are also likely to alter the grain components [15], mainly through changes in the source/sink ratios [16]. Among other key practices, such as the sowing date [17], nitrogen (N) management is indisputably one of the most limiting factors, not only for grain productivity but also for the grain quality attributes [18,19]. Besides the well-documented effects of N deficiencies in biomass and grain production, they are also likely to impact the grain quality composition. For instance, [8] reported that high N applications (184 kg N ha−1) not only increased the yield but also the grain quality, mainly due to increments in the concentration of non-essential amino acids. The same authors also observed that more frequent irrigation events (6-day intervals) and a high fertilizer N rate increased the oil and starch concentrations. This emphasizes the existence of interactions of water × N management (and co-limitations, [20]) on grain yield and quality traits, with impacts dependent upon the timing, duration, and intensity of stress. Although few studies have quantified the impacts of water stress and nitrogen fertilization levels on grain quality trains (protein, starch, and oil concentrations) under field and controlled environmental conditions, those investigations were all conducted under different genotype, environment, and management (G × E × M) scenarios. These published data have not been synthesized to better understand generalized effects across all the studies. For this purpose, meta-analysis is a method that can help with integrating knowledge and results from diverse studies and evaluate the impact of treatment on sets of target variables and provides quantitative estimates of effect sizes [21,22,23].
The overall objective of this study was to execute a meta-analysis to evaluate the effects of water and nitrogen levels on the following three main components of maize grains: protein, starch, and oil concentrations. The specific goals of this study were to employ a meta-analytic model to (i) study the effect of water stress levels on grain protein, oil, and starch concentrations; and (ii) investigate the effect of N fertilization and quantify the impact of the N (sub-level of N level) added (low, <70 kg N ha−1, medium, >70–150 kg N ha−1, and high, >150 kg N ha−1) on grain protein, oil, and starch concentrations for maize crop.
2. Materials and Methods
The source of data was only published manuscripts under the peer-review process. Using the Web of Science®, CAB-Abstracts®, and Scopus® search-engines, the following keywords were applied as a filter: corn or maize, and grain quality or grain composition, and nitrogen fertilization or water stress or drought stress. The search was also constrained to journal articles, and to the agricultural and biological sciences areas. Therefore, we also applied the following keywords in the search equation: not fodder, not animal, not soil. After the initial results, a screening of titles was applied in order to reduce the number of candidate studies. A total of 91 manuscripts were downloaded and revised, with only 21 retained based on the following criteria: (i) replicated experiments, (ii) treatments of interest, including either N fertilization (control vs. fertilized) or water management treatment (irrigated as control and water stressed as the treated plot), (iii) variables of interest reported at the treatment level including grain yield, and/or nitrogen (N) concentration, and/or protein, and/or starch, and/or oil concentrations. In addition to the engine search, a set of experiments belonging to a comprehensive database on +30 N trials in maize [24] was included. Although these trials were not particularly designed to evaluate maize grain quality, the database met the criteria. When protein data were not reported, protein was calculated as the grain N concentration multiplied by a factor of 5.6×, following Mariotti et al. (2008), and Sosulski and Imafidon [25,26].
The final database consisted of 21 data sources (92 site-years) comprising experiments published between 1972 and 2019, and distributed across 11 countries (Argentina, Brazil, Canada, China, India, Iran, Pakistan, Serbia, Turkey, United States, and Venezuela) (Table 1). In terms of the factors of interest, a total of 12 studies (75 trials) only evaluated the effect of N on grain quality, 7 studies (15 trials) only evaluated the effect of water stress on grain quality, and 1 study (2 trials) evaluated their interaction. Most of the experiments were performed under field conditions, and one study was carried out under controlled environmental conditions [12]. This controlled study was included as it satisfied our search criteria and to expand the database. In terms of variables of interest, a total of 20 studies accounted for protein concentration, 14 studies evaluated starch concentration, and 14 reported oil concentration.
Grain yields were adjusted to dry basis (0 g moisture kg−1), and protein, starch, and oil were standardized to percentage (%) units. The final database consisted of 510, 570, 279, and 265 data points for grain yield, protein, starch, and oil concentration, respectively.
2.1. Statistical Analysis
2.2. Meta-Analysis
Meta-analysis models are particularly useful for identifying patterns when data from multiple sources are combined and analyzed [23,24,25,26,27,28,29,30,31,32,33,34,35,36,37,38,39,40,41]. Thus, for the comparison of water stress and N fertilization effects on grain quality components, random effects meta-analysis models were fit following the log response ratio (lnRR) approach [42]. This type of meta-analysis allows us to acknowledge that the effect of a single study comes from a distribution of effects rather than considering it as fixed. The meta-analyses were performed with the metafor package [43] in R software [44]. Each model consisted of an evaluation of specific effect sizes of the treatments of interest. The three models to analyze the water stress effect were split into (i) protein concentration, (ii) starch concentration, and (iii) oil concentration. The effect sizes of water stress on these quantities were estimated using the following Equations (1) and (2):
where yi(j) is the water stress effect size for the ith observation nested within the ith study, and zi(j) is the concentration of protein, starch, or oil in the water stressed (zstress) or the water-controlled (zcontrol) treatments. Each yi were subsequently weighted using the inverse sample variance of each case (vi(j)), using the corresponding sample sizes (n) to estimate the weights (wi(j)).
Similarly, for the N models, the effect sizes of N fertilization on the grain quality components were estimated using the following Equations (3) and (4):
where xi(j) is the N fertilization effect size for the ith observation nested within the jth study, and zi(j) is the concentration of protein, starch, or oil in the N-fertilized (zNf) or the control (zN0) treatments. Each xi(j) were subsequently weighted using Equation (4).
Since the studies presented a wide range of N fertilization rates (30 to 280 kg N ha−1, Table 1), a second meta-analysis was fit for the N models in order to assess the effect of the N level as follows: (i) low N (<70 kg N ha−1), (ii) medium N (>70–150 kg N ha−1), and (iii) high N (>150 kg N ha−1). Thus, the effect size of N fertilization (xi) was also assessed at the sub-level of N level within each study.
In order to estimate the confidence intervals (CI, 95%) of the mean effect sizes at the study and overall levels, we used non-parametric bootstrapping stratified by study in order to conserve the original data structure. Thus, at the study level (j), the available observations (i) were resampled with replacement (n = 5000) [45,46] using the boot package [47] in R-software [44]. The heterogeneity between studies was calculated using the I2 statistic to detect whether all of them are assessing the same effect [48].
Forest plots were used to summarize the effects of water and N fertilizer, re-expressing the yj, xj (ln ratios), and their respective confidence intervals (95% CI) to percentage units (%) using the following Equations (5) and (6):
3. Results
The descriptive analysis of the database indicates that the maize grain yield showed a wide range of values, with an average of 8.7 Mg ha−1, ranging from 1.8 to 18 Mg ha−1, and with a standard deviation of 2.8 Mg ha−1 (Table 2). Although only three studies reported yield data on water stress, limiting the comparison, water limited treatments resulted in average yields of 8.4 Mg ha-1, relative to full irrigation with yields of 11.6 Mg ha−1. Similarly, on average, the N-limited yields were 6.4 Mg ha−1, while the N-fertilized were 9.2 Mg ha−1.
The protein concentration varied between 2.8 to 18%, with a mean of 8.0% and a standard deviation of 2.0%. While water stress appears not to exert an effect on maize grain protein, the N-limited scenario resulted in a mean of 7.0%, while the N-fertilized averaged a protein of 8.2%. The starch concentration ranged from 44 to 80%, with a mean of 70% and a standard deviation of 5.4%, but with starch neither affected by water stress nor by N fertilizer. Finally, the oil concentration ranged from 0.6 to 7.9%, with a mean of 4.4% and a standard deviation of 1.3%, but also with the trivial effect of both evaluated factors (Table 2).
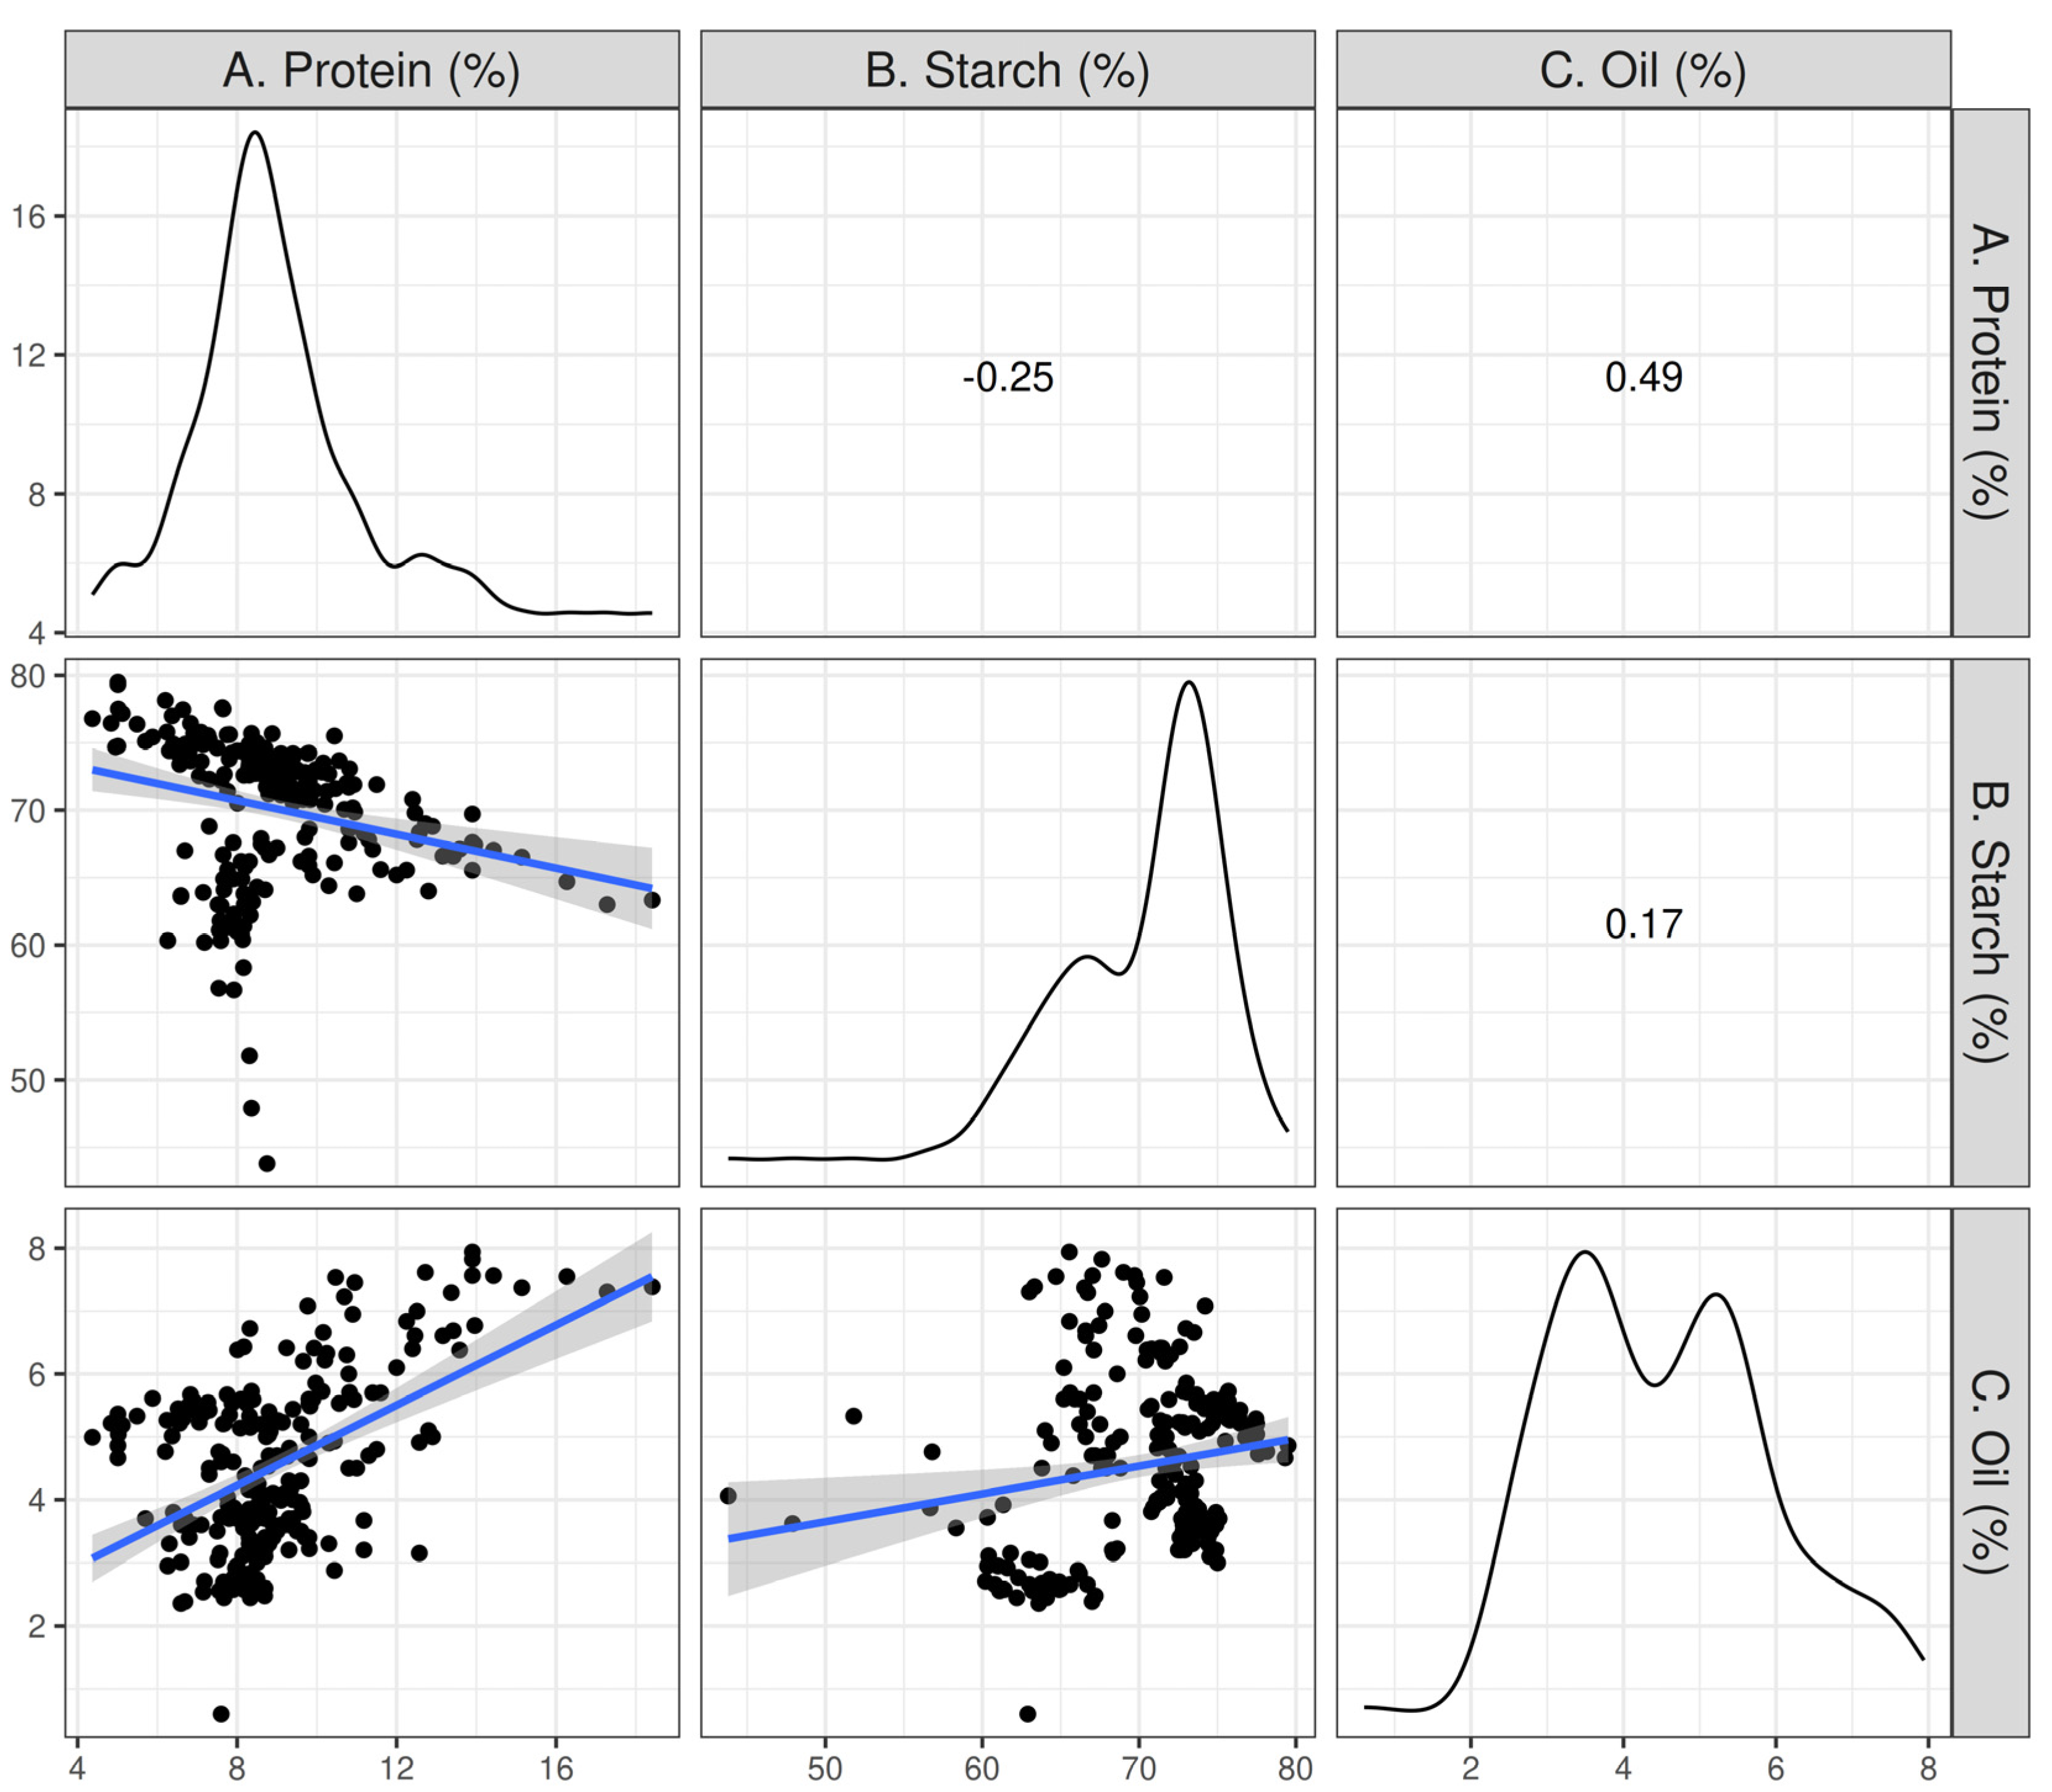
In terms of trade-offs between grain quality components (Figure 1), the protein and oil concentrations displayed an overall moderate positive correlation (r = 0.49), followed by a low but negative correlation between protein and starch (r = −0.25), and low but positive correlation between oil and starch (r = 0.17). A particular remark to the protein–oil relationship (Figure 1) is that the oil concentration seems to reach a plateau about 8%, while it is still possible to achieve further increases in the protein levels. Nonetheless, specific trade-offs were observed at each particular study (Figure S1).
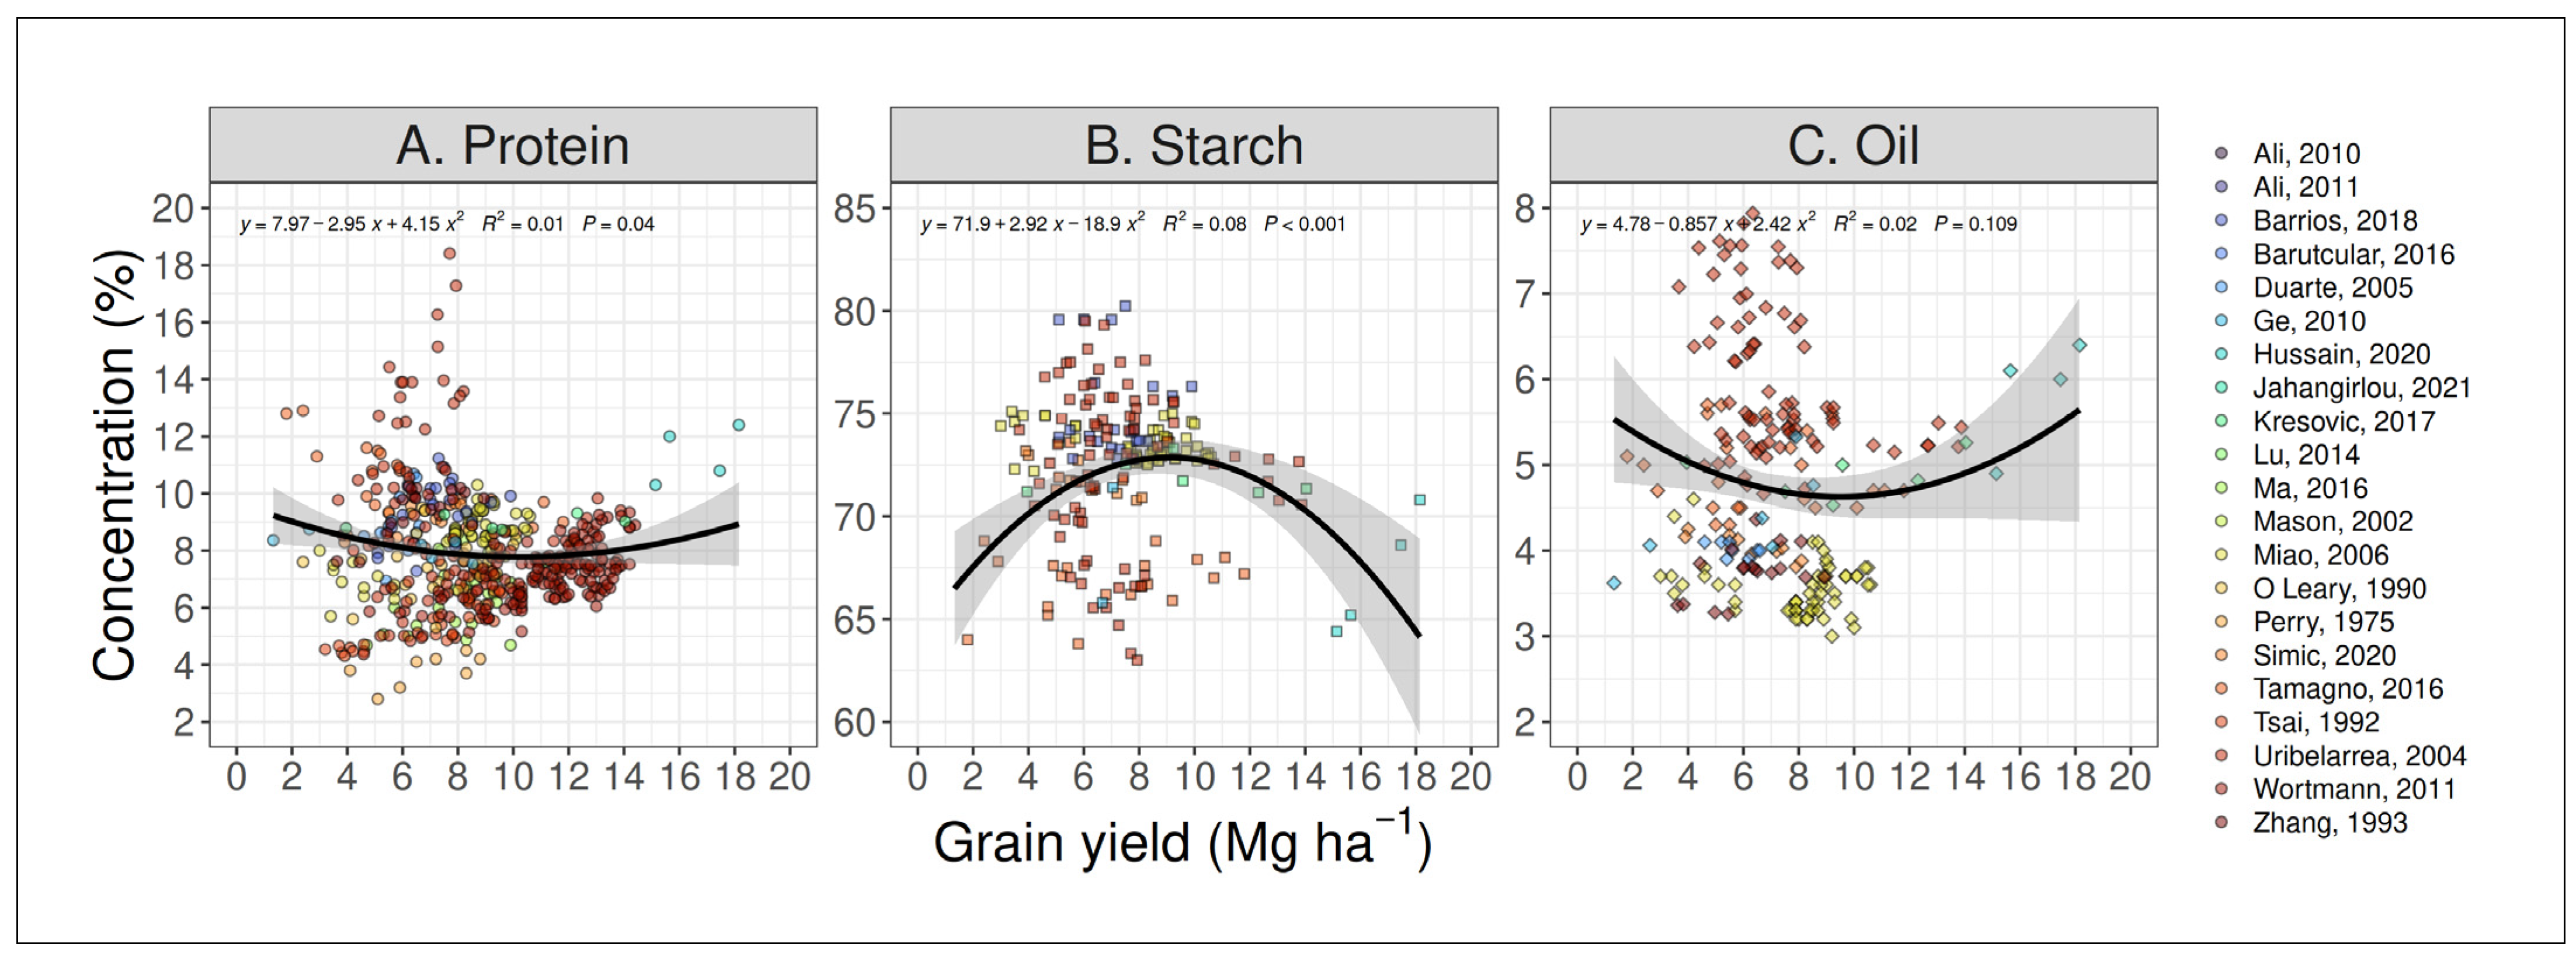
Even though significant relationships were observed between the quality components and grain yield (Figure 2), the strength of associations was characterized by their weakness (R2 <0.1). Besides the weak relationships, it is noteworthy to highlight that all three components presented large variability when the yields were below ca. 10 Mg ha−1. For instance, at a yield level of ca. 4 Mg ha−1, the protein ranged between <4 and ca. 12%. In contrast, the range of protein, starch, and oil concentrations is considerably narrower with yield levels above ca. 10 Mg ha−1 (Figure 2).
3.1. Meta-Analysis Results
3.1.1. Water Stress
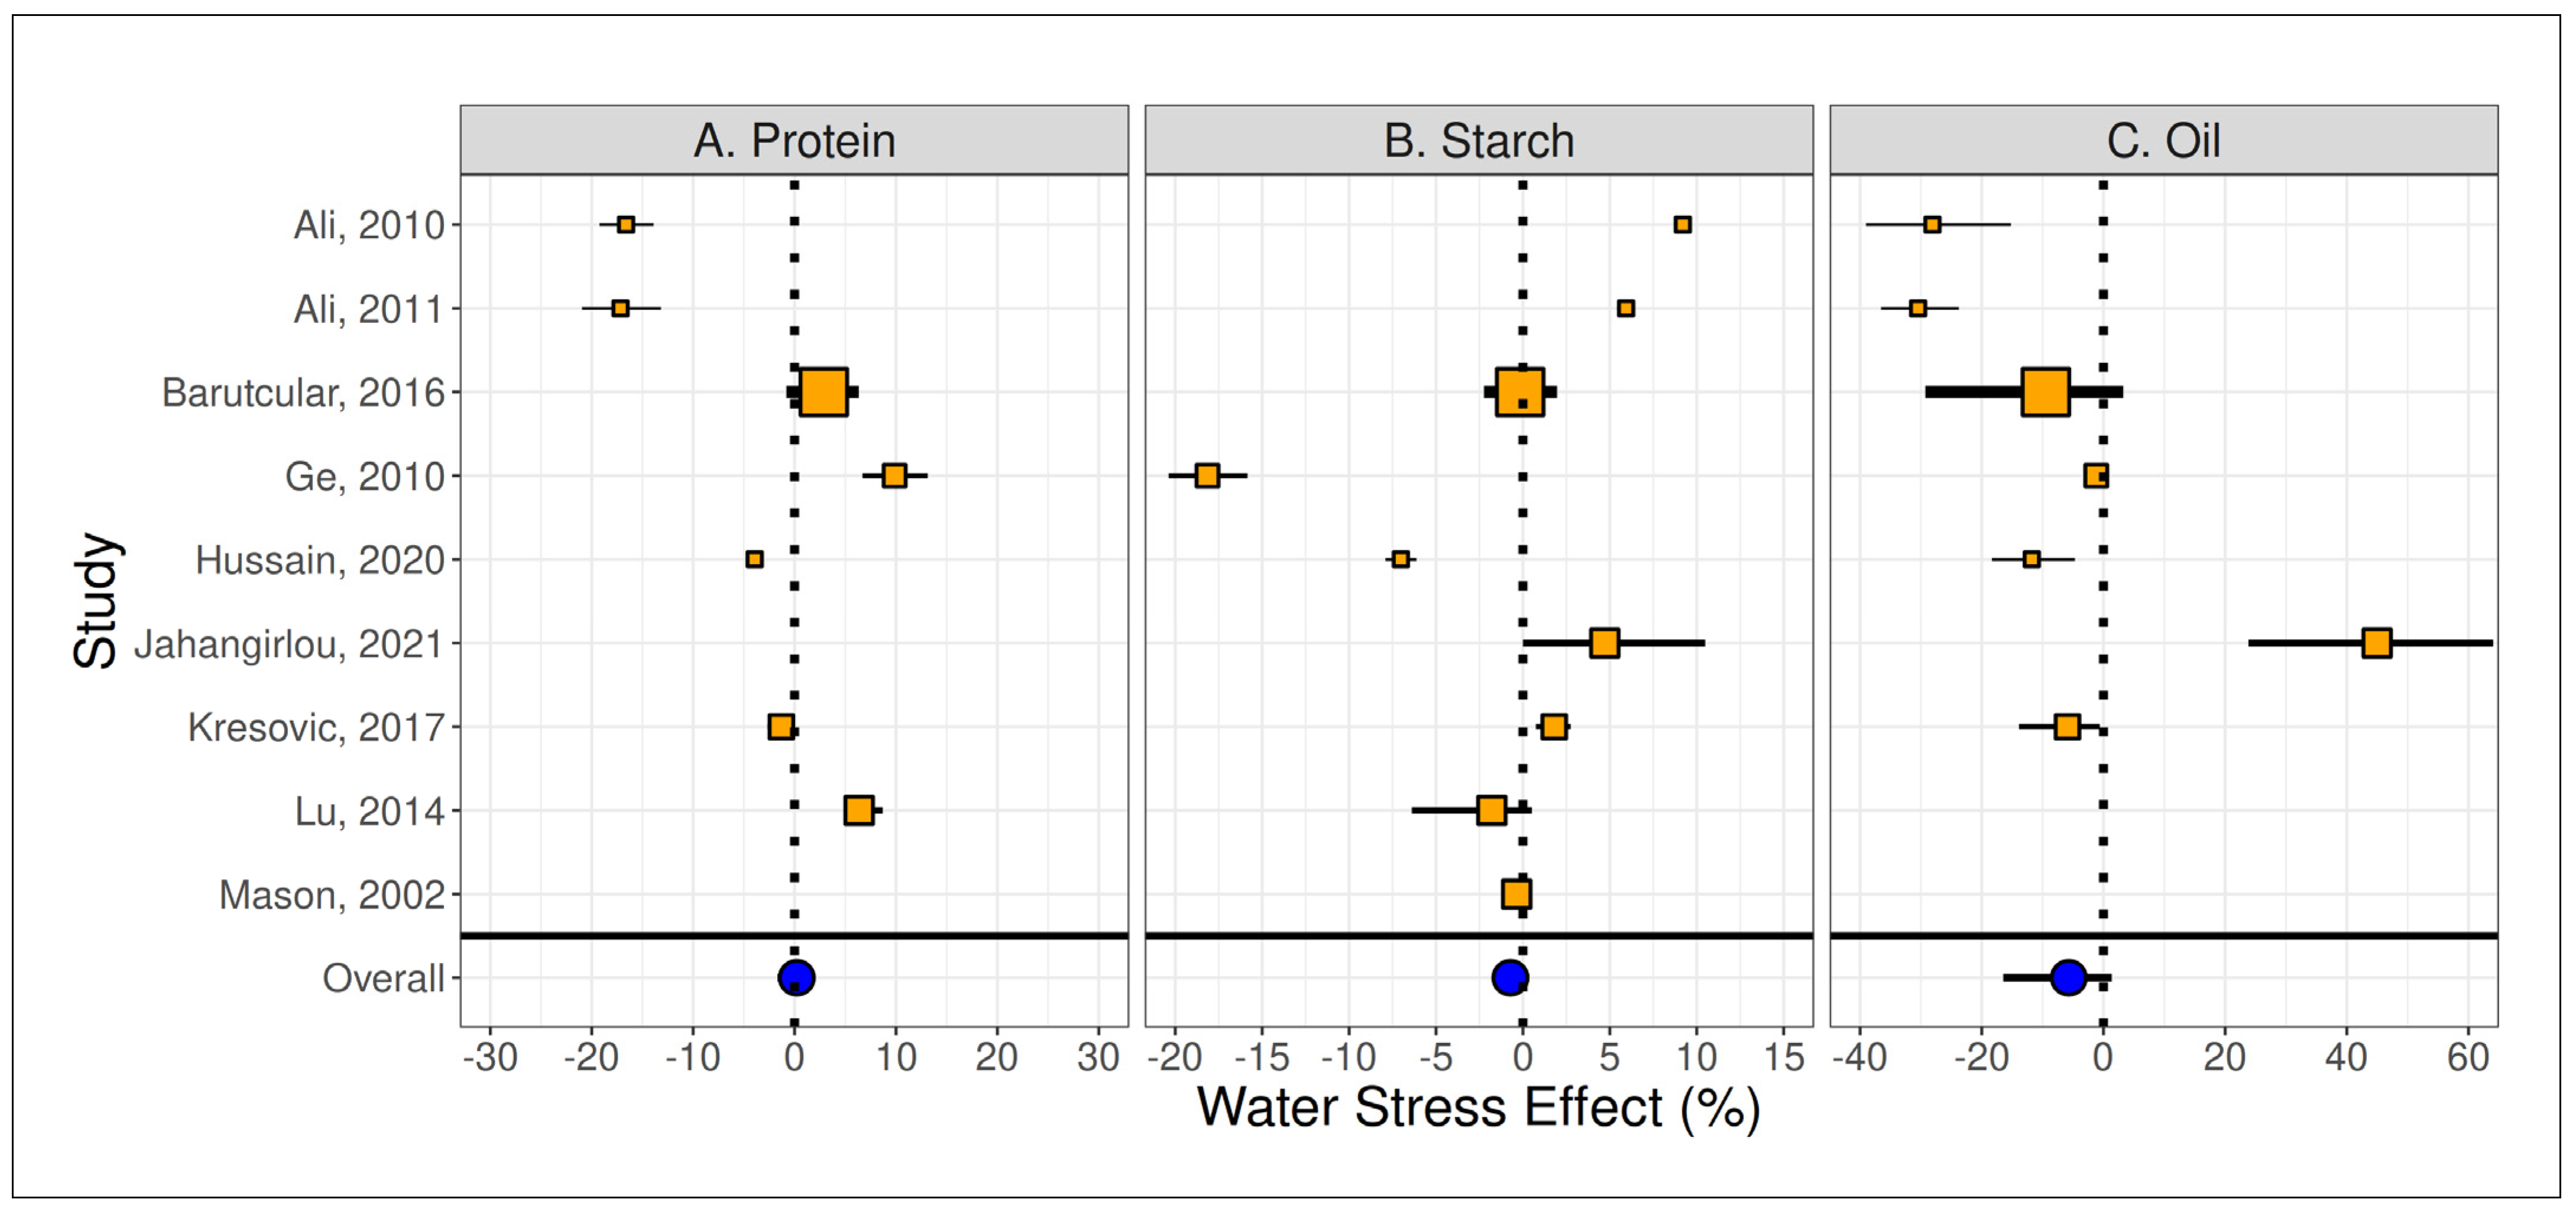
The impact of water stress was contrasting across components and with high heterogeneity among studies (Figure 3). Although an overall null effect is expected, the effect was variable depending on the study and reflected by I2 values of 96, 99, and 93%, for protein, starch, and oil, respectively. Only two out of the eight studies observed a significant reduction in protein (ca. 17%), one showed a small but yet significant reduction (ca. 4%), two showed a non-significant effect, and two studies presented a significant increase (7–10%) (Figure 3A). Three out of the eight studies evaluating starch showed a significant increase under water stress (4.7 to 9.2%), four studies showed no effect, while two presented significant 7.0 and 18% reductions (Figure 3B). Finally, three out of the six studies evaluating oil showed a significant decrease in the oil concentration (12 to 30%), three studies resulted in minor water stress effect, while one study observed a significant ca. 45% increase (Figure 3C).
3.1.2. Nitrogen Fertilizer
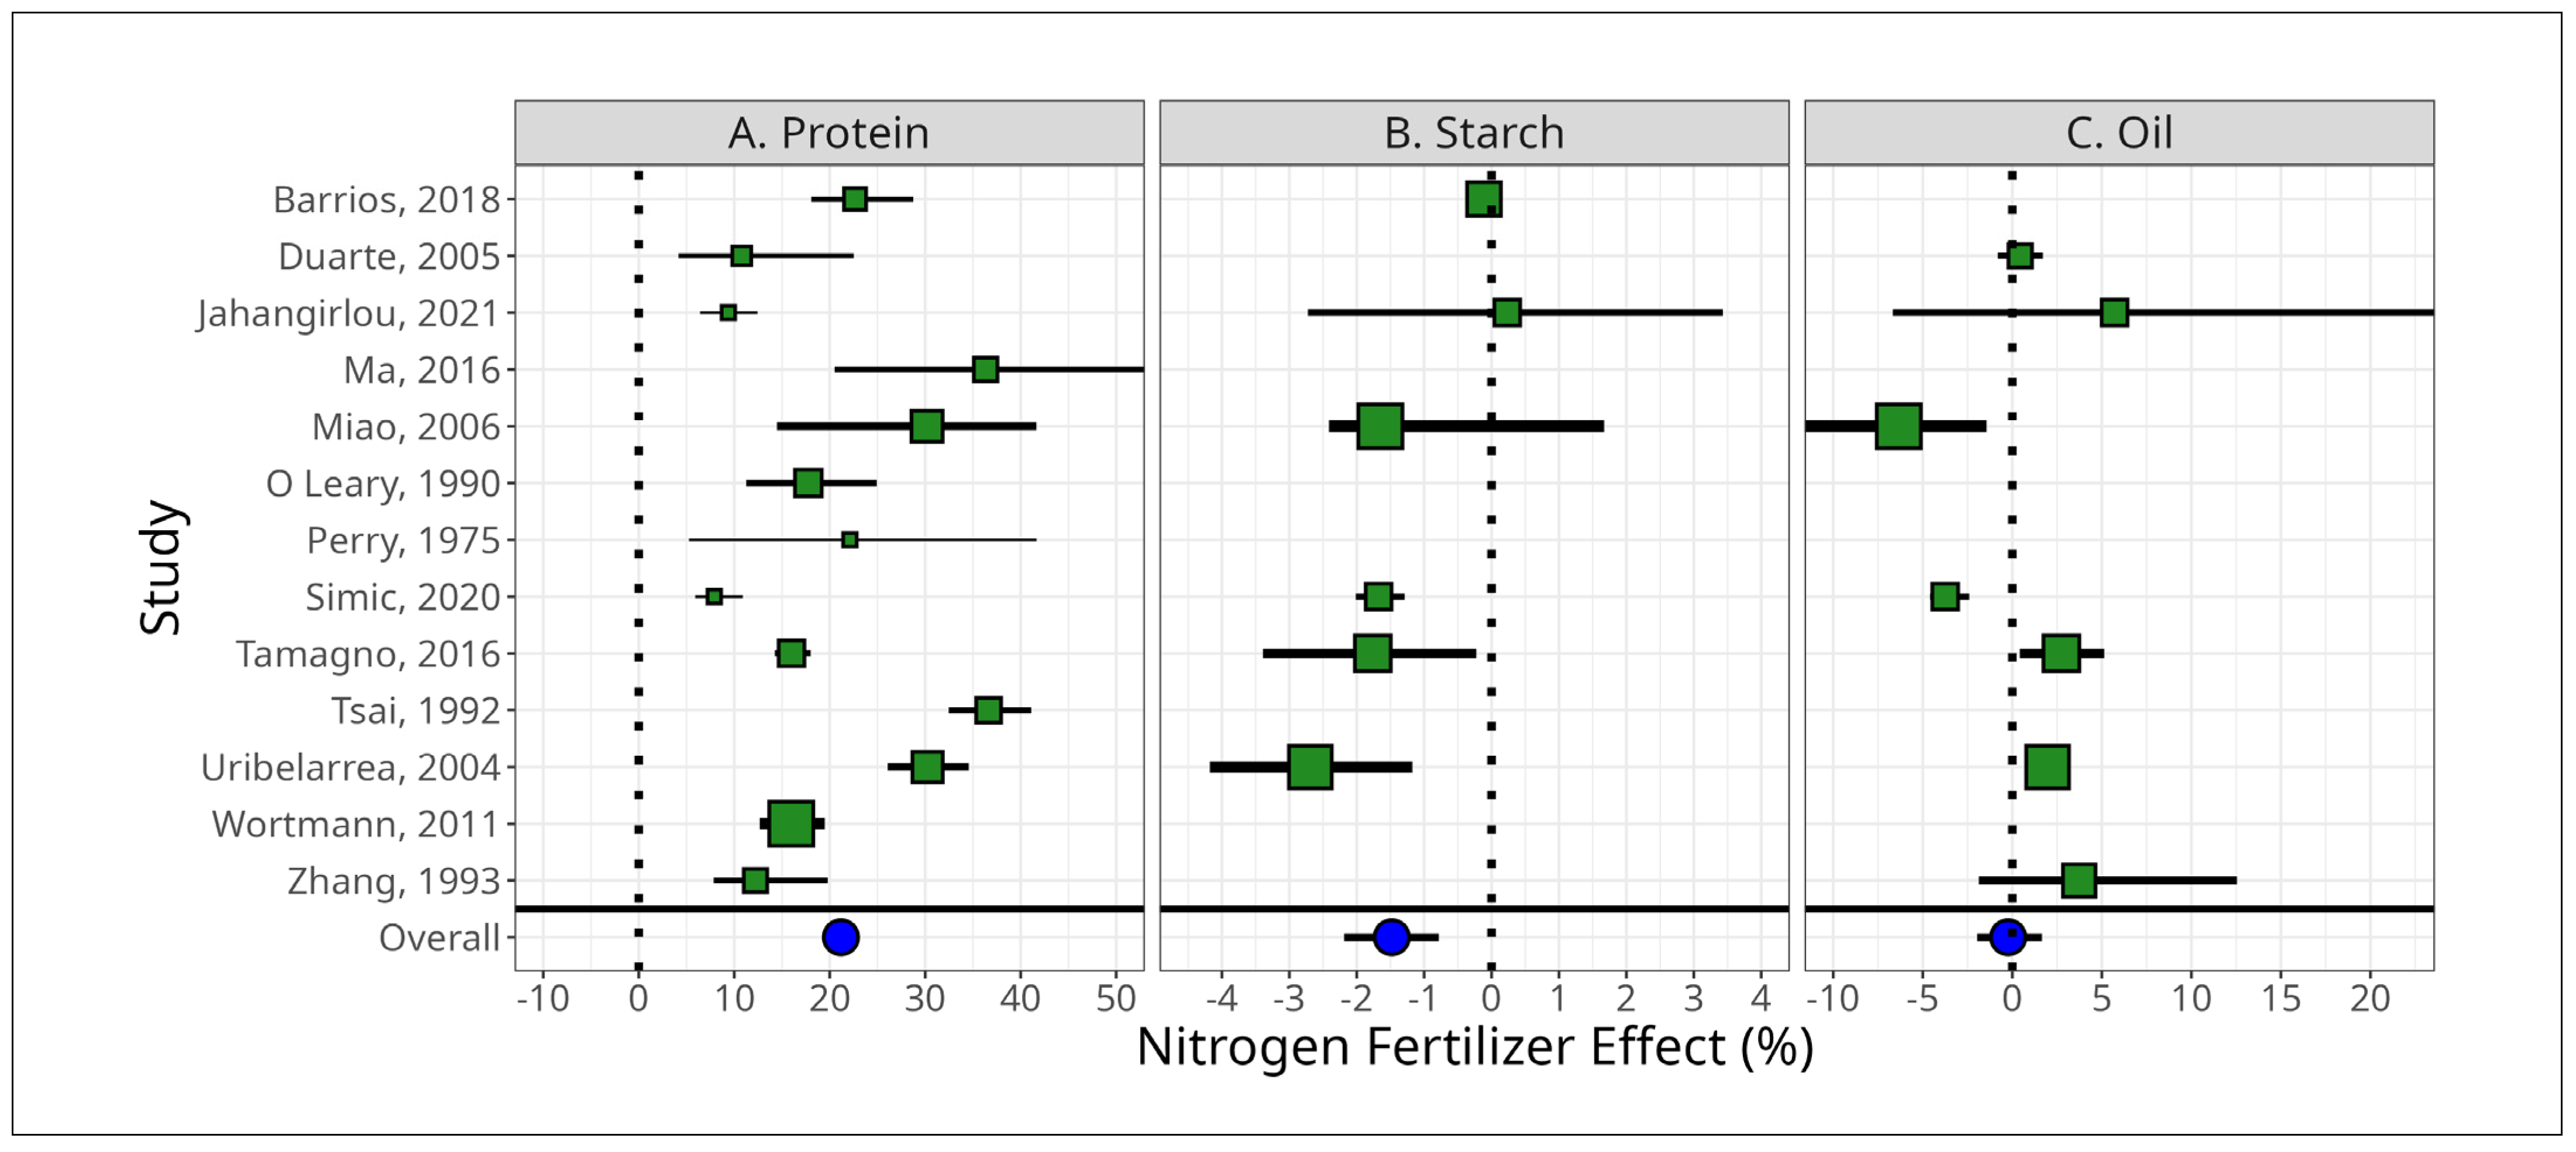
Regarding the N fertilizer effect, its impact on each grain quality component was relatively more consistent as compared to the water stress effect (Figure 4). Still, the effect size was highly heterogeneous across the studies, with I2 values of 90, 91, and 98%, for protein, starch, and oil, respectively. Although an overall positive effect of ca. 21% in protein is expected as a result of N fertilization (Figure 4A), across the studies, the mean effect size varied from ca. +8 to +37%, being significant in the majority of the cases (12 out of 13). An overall small but yet negative N fertilizer effect (−1.5%) is expected in starch concentration (Figure 4B), with an overall null effect on the oil fraction (Figure 4C). Nonetheless, the effect on the two latter components differed across studies. Only three out of the six studies observed a small (ca. −1.7 to −2.7%) but yet significant reduction in starch (Figure 4B), while the remaining expressed a null effect. Out of the seven studies evaluating oil, two showed a decrease in oil (ca. −3.7 to −5.9%), one showed a small positive effect (+2.0%), while there was no significant effect on the remaining (Figure 4C).
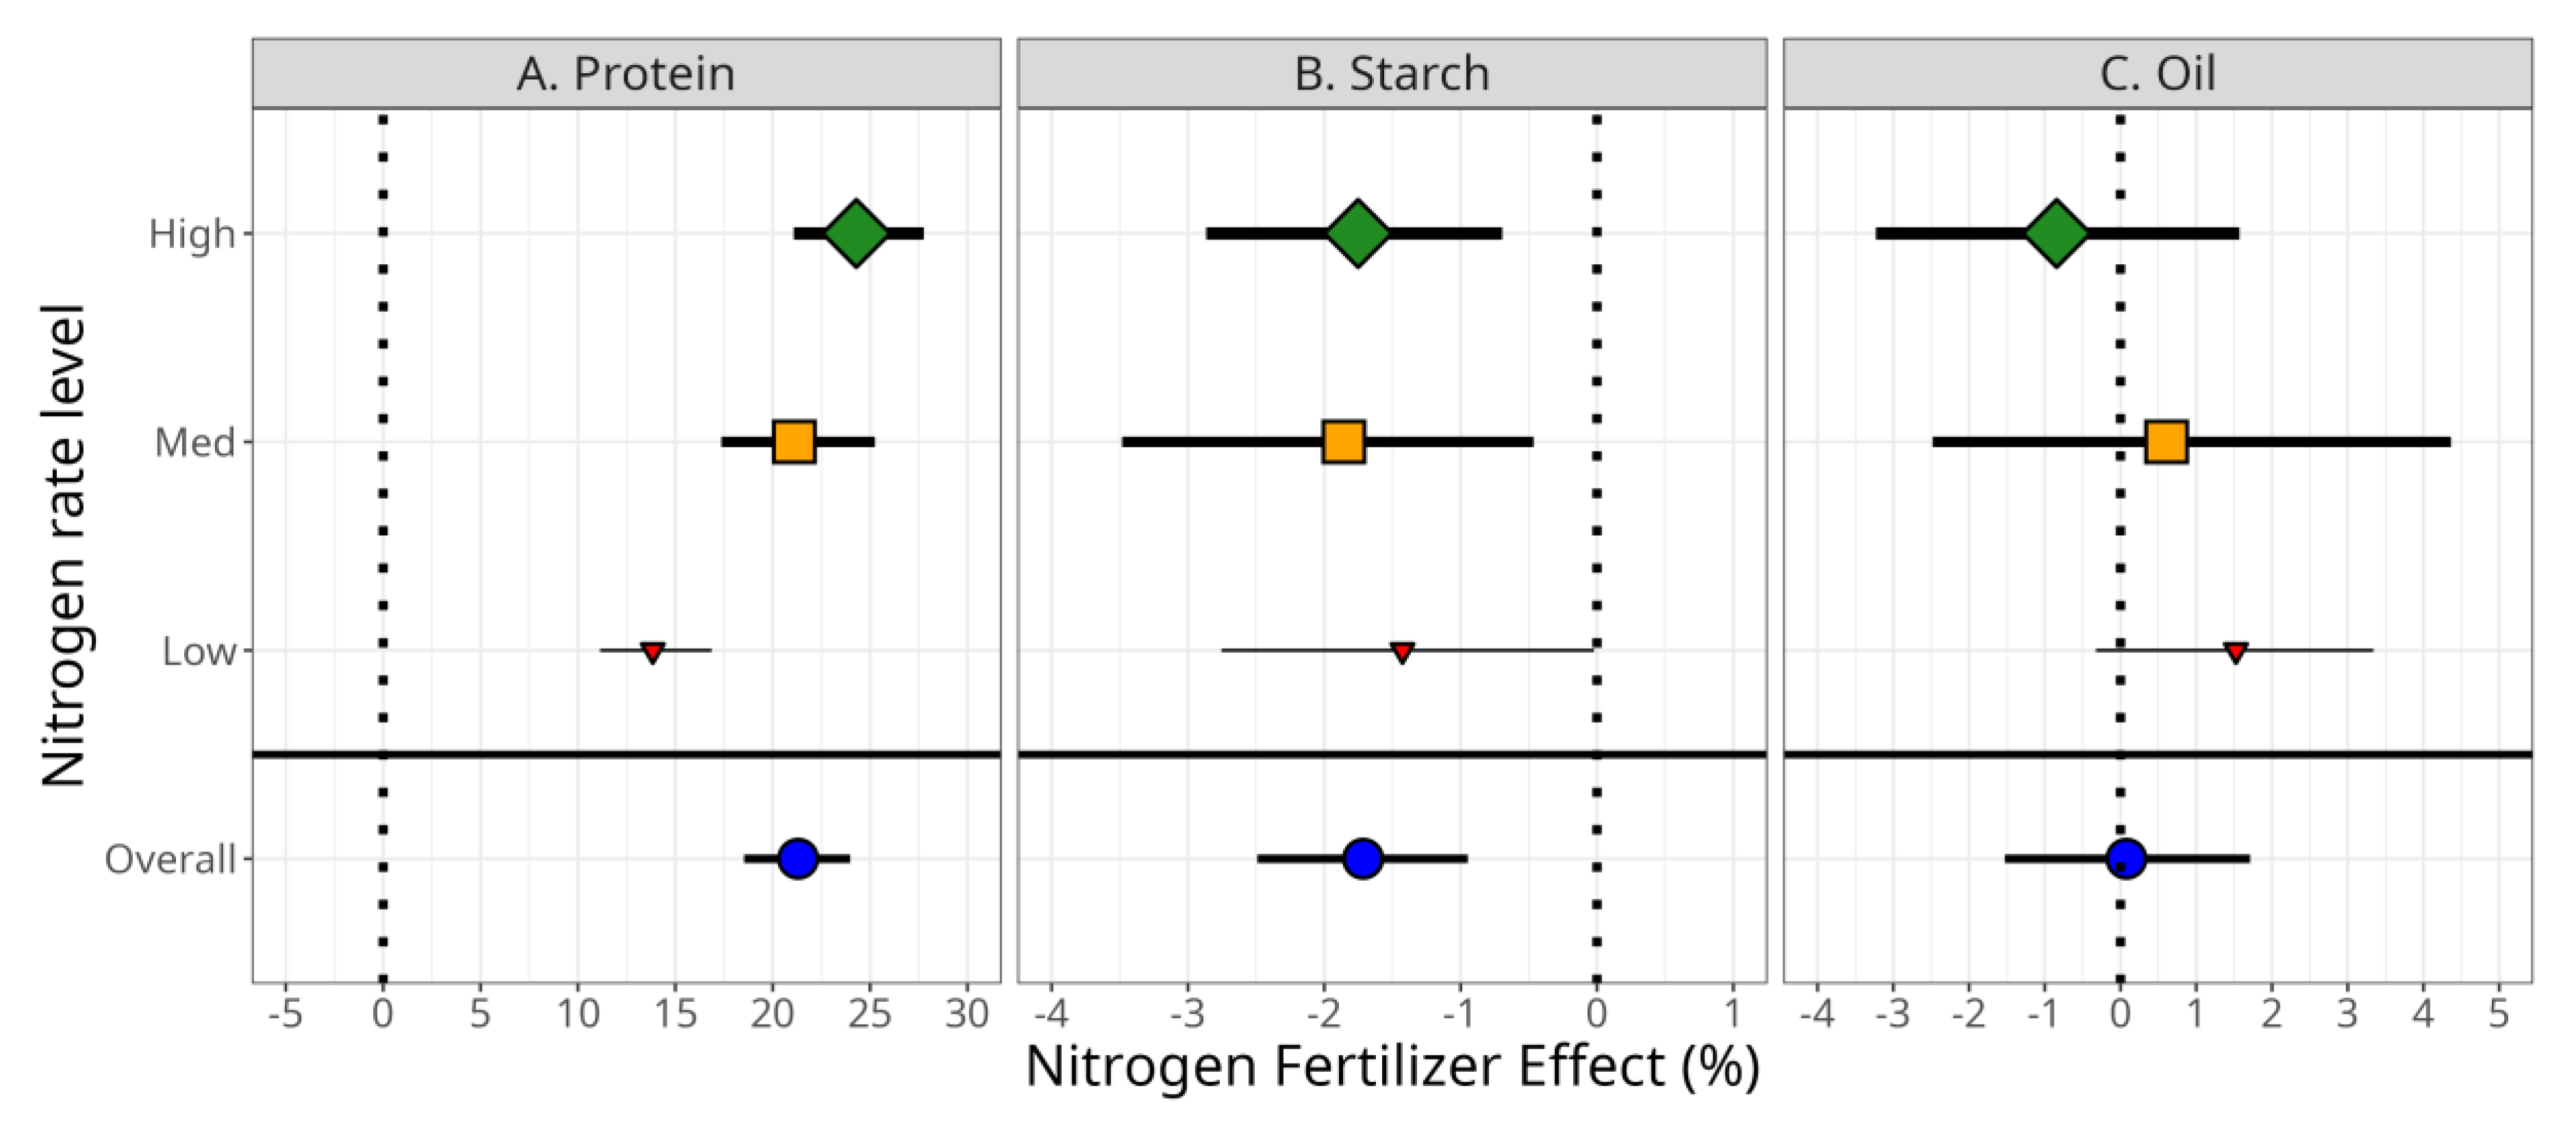
Considering the N fertilizer levels (Figure 5), the low N rates (≤70 kg ha−1) showed a significant mean effect on protein of +13.8%, while the medium (>70–150 kg N ha−1) and high rates (>150 kg N ha−1) showed a similar but significantly greater effects than low N rates, with +21 and +24%, respectively. In terms of starch, all the N fertilizer levels produced a low but yet significant starch reduction, with an overall effect of −1.7%. Finally, none of the N levels produced a significant impact on the oil concentration. Nonetheless, it is important to highlight that the effect on the quality components differed across the studies (Figure S2).
4. Discussion
This meta-analysis offers a novel summary with focus on the effect of the two most limiting factors for maize production, water and N, on grain quality (protein, oil, and starch concentrations). Historically, water and N management studies have mainly focused on yield as the response variable, with less attention paid to the grain quality components [18]. In this regard, combining and weighing the results from multiple studies, our analysis represents a valuable contribution to the literature. This meta-analysis synthesized two-fold more data for protein relative to both starch and oil, highlighting the lack of research studies focused on quality, mainly in non-protein factors.
One of the first lessons is that a not clear trade-off was apparent between the yield levels and the most expensive components in energetic terms (oil > protein > starch). Unexpectedly, we were neither able to confirm a negative association between the most (oil) and the least (starch) expensive components, nor between the protein and starch concentrations [16]. Moreover, the positive association observed between the protein and the oil was somewhat surprising, although the oil concentration remained relative constant at ca. 8%, while the protein levels could still be increased. This scenario remarks the stability of the oil fraction, which is mostly located in the embryo [9], and the possibility of concomitantly high protein levels. Likewise, [40] reported stable oil concentrations across N fertilization levels, also suggesting that an increase in protein could not necessarily imply a decrease in energy concentration.
The water stress effect on maize grain quality was mainly characterized by its inconsistency. Most likely, we could not distinguish noise from signal as the database encompasses stress treatments applied at different timings during the season (e.g., entire season, around flowering, during grain filling), with different intensities and durations, as well as different environments (soil and weather conditions), genetic materials (e.g., dent, semident, flint, wax), and management practices (planting dates, tillage systems, etc.). For example, the severity of the drought impact on crops’ production generally depends on the soil moisture status and nutrients’ availability [49]. As these unaccounted factors were basically pooled in the meta-analysis, there is a risk of obscuring the actual impact of drought stress on the quality components. As water stress remains an undesirable scenario, when irrigation is not possible, the risk of water shortage should be managed with other crop practices such as sowing dates, hybrid selection, among others. We should also consider that the genetics, environment, and management (G × E × M) factors may interact with the response to either water stress or N fertilizer levels [38]. It is also worth remarking that only one study evaluated combinations of water stress and N fertilizer, factors that are largely known for interacting and exerting co-limitations [20,21,50].
The effect of N fertilizer on grain quality showed, in contrast, a more consistent trend across studies, particularly for protein, as this fraction is generally expected to show increments with increasing resources, particularly N availability [18]. Nonetheless, further research is needed regarding the effect not only in the protein concentration but also in its amino acids’ quality [51]. For example, diets with essential amino acids as the only N source are used less efficiently than diets with a better ratio of essential to nonessential amino acids [52], which may ultimately modify the fate of N in animal production [53]. Synergistic applications of N and sulfur (S) cannot only increase the protein concentration but increase the protein quality via increments in the concentration of essential amino acids, such as methionine, tryptophan, and lysine [54].
Our results suggest that N fertilizer rates within a medium range (>70–150 kg N ha−1) may be sufficient to saturate the response on protein (+21% with respect to a control), which will also cover a wide range of economic optimum N recommendations [55]. However, more accurate interpretations on the effect of N on grain quality present the same challenge as research on grain yield [55]: more accurate estimations of the soil N supply [56,57]. Improved estimations of the quantity (and timing) of soil N supply will help producers reducing the risk of losing efficiency with either an N deficiency or an N surplus. Other N sources such as mineralization and carryover from the previous year [58] may exert a significant influence on both grain yield and quality. In that regard, research on splitting the N fertilizer should expand the current focus on yield and efficiency improvements [23] to explore the role of late N applications on improving grain quality components as well.
Increases in protein may be concomitant with decreases in starch and/or in oil [18,37,59]. However, we found an overall small reduction in starch due to N fertilizer, and oil resulted in a stable fraction against changes in either the water or N availability. In the scientific literature, a negative trade-off between protein and starch is generally reported for specific conditions [10,16,59,60], while the maize oil concentration is normally found as the most stable grain compound under varying environmental conditions [16,40,59,61].
Future research steps should seek to overcome certain limitations encountered in our work. A first shortcoming was related to very limited number of cases (11) reporting all three grain quality components and grain yield, constraining the evaluation and inference about potential trade-offs. A second deficiency was linked to the lack of studies reporting more detailed grain traits such as test weight and other quality compounds such as amino- and fatty-acids, in order to expand our database and synthesis analysis inference. Prospective research should also explore the effect of heat stress on grain quality [10], either isolated or in combination with water and N management. Similarly, the effect of other nutrients besides N and their interactions (co-limitations) is a relevant topic that warrants further investigation. Moreover, the explored literature presents a lack of standard practices reporting the laboratory protocols used to determine protein, starch, and oil concentrations (e.g., chemical extraction procedures, near-infrared spectroscopy). Finally, from a methodological standpoint, the lack of presentation of measures of variation at the treatment level in the studies gathered by this meta-analysis restricted the possibilities regarding the weighing procedures of the effect sizes [62].
5. Conclusions
The accompanying maize grain productivity increases with a high nutritional quality are essential toward the main goal of global food security. This meta-analysis reported that (i) water stress resulted in an erratic direction of the grain quality response, plausible to changes in the timing, intensity, and duration of the stress; and (ii) N fertilization not only increases yields but also the grain protein concentration, while both starch and oil remained relatively stable under contrasting N levels. In the current context of an emerging food crisis, this study documented a remarkably important scenario for maintaining oil concentration while increasing the protein fraction. Under an adequate management of N fertilizer, this represents a unique opportunity of producing maize crops with both higher quality and energetic value.
Supplementary Materials
The following are available online at https://0-www-mdpi-com.brum.beds.ac.uk/article/10.3390/agronomy11091851/s1, This section contains Figure S1: By-study correlation matrix between grain quality components, and Figure S2: By-study summary of N fertilizer rate level effect (%) on maize grain quality components.
Author Contributions
Conceptualization, A.A.C., P.V.V.P. and I.A.C.; methodology, A.A.C., J.A.F. and I.A.C.; formal analysis, A.A.C. and J.A.F.; data curation, A.A.C. and J.A.F.; writing—original draft, A.A.C.; writing—reviewing and editing, J.A.F., P.V.V.P. and I.A.C.; visualization, A.A.C.; supervision, project administration, and funding acquisition, I.A.C. All authors have read and agreed to the published version of the manuscript.
Funding
Authors give special thanks to the Feed the Future Sustainable Intensification Innovation Lab funded by the United States Agency for International Development (grant number AID-OAA-L-14-00006) for the financial support to P.V.V.P and I.A.C.’s research programs and for providing the funds for this open-access publication.
Acknowledgments
Authors express their gratitude to the financial support provided by the Fulbright Program (Argentina), Kansas State University, the Kansas Corn Commission, and Corteva Agriscience for sponsoring A.A.C.’s Ph.D., J.A.F.’s Ph.D., and I.A.C.’s research program. This is contribution no. 22-083-J from the Kansas Agricultural Experiment Station.
Conflicts of Interest
The authors declare no conflict of interest.
References
- Vyn, T.J.; Tollenaar, M. Changes in chemical and physical quality parameters of maize grain during three decades of yield improvement. Field Crops Res. 1998, 59, 135–140. [Google Scholar] [CrossRef]
- Morris, C.E.; Sands, D.C. The breeder’s dilemma—Yield or nutrition? Nat. Biotechnol. 2006, 24, 1078–1080. [Google Scholar] [CrossRef]
- Diepenbrock, C.H.; Gore, M.A. Closing the Divide between Human Nutrition and Plant Breeding. Crop. Sci. 2015, 55, 1437–1448. [Google Scholar] [CrossRef]
- Darrah, L.; McMullen, M.; Zuber, M. Breeding, Genetics and Seed Corn Production; Elsevier: Amsterdam, The Netherlands, 2018; pp. 19–41. [Google Scholar]
- Motukuri, S.K. Quality Protein Maize: An Alternative Food to Mitigate Protein Deficiency in Developing Countries. In Maize—Production and Use; Intech Open: London, UK, 2019; pp. 45–72. [Google Scholar] [CrossRef] [Green Version]
- Ali, Q.; Ashraf, M.; Anwar, F. Seed Composition and Seed Oil Antioxidant Activity of Maize Under Water Stress. J. Am. Oil Chem. Soc. 2010, 87, 1179–1187. [Google Scholar] [CrossRef]
- FAO. FAOSTAT Statistical Database; Food and Agriculture Organization of the United Nations (FAO): Rome, Italy, 2021; Available online: http://www.fao.org/faostat/ (accessed on 16 August 2021).
- Jahangirlou, M.; Akbari, G.; Alahdadi, I.; Soufizadeh, S.; Parsons, D. Grain Quality of Maize Cultivars as a Function of Planting Dates, Irrigation and Nitrogen Stress: A Case Study from Semiarid Conditions of Iran. Agriculture 2020, 11, 11. [Google Scholar] [CrossRef]
- Flint-Garcia, S.A.; Bodnar, A.; Scott, M.P. Wide variability in kernel composition, seed characteristics, and zein profiles among diverse maize inbreds, landraces, and teosinte. Theor. Appl. Genet. 2009, 119, 1129–1142. [Google Scholar] [CrossRef] [PubMed] [Green Version]
- Butts-Wilmsmeyer, C.J.; Seebauer, J.R.; Singleton, L.; Below, F.E. Weather During Key Growth Stages Explains Grain Quality and Yield of Maize. Agronomy 2019, 9, 16. [Google Scholar] [CrossRef] [Green Version]
- Alqudah, A.M.; Samarah, N.H.; Mullen, R.E. Drought Stress Effect on Crop Pollination, Seed Set, Yield and Quality. In Alternative Farming Systems, Biotechnology, Drought Stress and Ecological Fertilisation; Springer Science and Business Media LLC: Dordrecht, The Netherlands, 2011; pp. 193–213. [Google Scholar]
- Lu, D.; Cai, X.; Zhao, J.; Shen, X.; Lu, W. Effects of drought after pollination on grain yield and quality of fresh waxy maize. J. Sci. Food Agric. 2014, 95, 210–215. [Google Scholar] [CrossRef]
- Da Ge, T.; Sui, F.G.; Nie, S.; Sun, N.B.; Xiao, H.; Tong, C.L. Differential responses of yield and selected nutritional compositions to drought stress in summer maize grains. J. Plant Nutr. 2010, 33, 1811–1818. [Google Scholar] [CrossRef]
- Barutçular, C.; Dizlek, H.; El-Sabagh, A.; Sahin, T.; Elsabagh, M.; Islam, M.S. Nutritional quality of maize in response to drought stress during grain-filling stages in mediterranean climate condition. J. Exp. Biol. Agric. Sci. 2016, 4, 644–652. [Google Scholar] [CrossRef]
- Martínez, R.; Cirilo, A.; Cerrudo, A.; Andrade, F.; Izquierdo, N. Discriminating post-silking environmental effects on starch composition in maize kernels. J. Cereal Sci. 2019, 87, 150–156. [Google Scholar] [CrossRef]
- Borrás, L.; Curá, J.A.; Otegui, M.E. Maize Kernel Composition and Post-Flowering Source-Sink Ratio. Crop. Sci. 2002, 42, 781–790. [Google Scholar] [CrossRef]
- Abdala, L.J.; Gambin, B.L.; Borrás, L. Sowing date and maize grain quality for dry milling. Eur. J. Agron. 2018, 92, 1–8. [Google Scholar] [CrossRef]
- Miao, Y.; Mulla, D.J.; Robert, P.C.; Hernandez, J.A. Within-Field Variation in Corn Yield and Grain Quality Responses to Nitrogen Fertilization and Hybrid Selection. Agron. J. 2006, 98, 129–140. [Google Scholar] [CrossRef]
- Cirilo, A.; Actis, M.; Andrade, F.; Valentinuz, O. Crop management affects dry-milling quality of flint maize kernels. Field Crop. Res. 2011, 122, 140–150. [Google Scholar] [CrossRef]
- Sadras, V.O. A quantitative top-down view of interactions between stresses: Theory and analysis of nitrogen - water co-limitation in Mediterranean agro-ecosystems. Aust. J. Agric. Res. 2005, 56, 1151–1157. [Google Scholar] [CrossRef]
- Tremblay, N.; Bouroubi, Y.M.; Bélec, C.; Mullen, R.W.; Kitchen, N.R.; Thomason, W.E.; Ebelhar, S.; Mengel, D.B.; Raun, W.; Francis, D.D.; et al. Corn Response to Nitrogen is Influenced by Soil Texture and Weather. Agron. J. 2012, 104, 1658–1671. [Google Scholar] [CrossRef] [Green Version]
- Laurent, A.; Miguez, F.; Kyveryga, P.; Makowski, D. Going beyond mean effect size: Presenting prediction intervals for on-farm network trial analyses. Eur. J. Agron. 2020, 120, 126127. [Google Scholar] [CrossRef]
- Fernandez, J.A.; DeBruin, J.; Messina, C.D.; Ciampitti, I. Late-season nitrogen fertilization on maize yield: A meta-analysis. Field Crop. Res. 2020, 247, 107586. [Google Scholar] [CrossRef]
- Wortmann, C.S.; Tarkalson, D.D.; Shapiro, C.A.; Dobermann, A.R.; Ferguson, R.B.; Hergert, G.W.; Walters, D. Nitrogen Use Efficiency of Irrigated Corn for Three Cropping Systems in Nebraska. Agron. J. 2011, 103, 76–84. [Google Scholar] [CrossRef] [Green Version]
- Mariotti, F.; Tomé, D.; Mirand, P.P. Converting Nitrogen into Protein—Beyond 6.25 and Jones’ Factors. Crit. Rev. Food Sci. Nutr. 2008, 48, 177–184. [Google Scholar] [CrossRef] [PubMed]
- Sosulski, F.W.; Imafidon, G.I. Amino acid composition and nitrogen-to-protein conversion factors for animal and plant foods. J. Agric. Food Chem. 1990, 38, 1351–1356. [Google Scholar] [CrossRef]
- Ali, Q.; Ashraf, M. Exogenously applied glycinebetaine enhances seed and seed oil quality of maize (Zea mays L.) under water deficit conditions. Environ. Exp. Bot. 2011, 71, 249–259. [Google Scholar] [CrossRef]
- Hussain, S.; Maqsood, M.; Ijaz, M.; Ul-Allah, S.; Sattar, A.; Sher, A.; Nawaz, A. Combined Application of Potassium and Zinc Improves Water Relations, Stay Green, Irrigation Water Use Efficiency, and Grain Quality of Maize under Drought Stress. J. Plant Nutr. 2020, 43, 2214–2225. [Google Scholar] [CrossRef]
- Kresović, B.; Gajić, B.; Tapanarova, A.; Dugalić, G. How Irrigation Water Affects the Yield and Nutritional Quality of Maize (Zea mays L.) in a Temperate Climate. Pol. J. Environ. Stud. 2018, 27, 1123–1131. [Google Scholar] [CrossRef]
- Mason, S.C.; D’Croz-Mason, N.E. Agronomic Practices Influence Maize Grain Quality. J. Crop. Prod. 2002, 5, 75–91. [Google Scholar] [CrossRef]
- Barrios, M.; Basso, C. Efecto de la fertilizacion nitrogenada sobre componentes del rendimiento y calidad nutricional del grano de seis hibridos de maiz. Bioagro 2018, 30, 39–48. [Google Scholar]
- Duarte, A.P.; Mason, S.C.; Jackson, D.S.; Kiehl, J.D.C. Grain Quality of Brazilian Maize Genotypes as Influenced by Nitrogen Level. Crop. Sci. 2005, 45, 1958–1964. [Google Scholar] [CrossRef] [Green Version]
- Ma, B.L.; Biswas, D.K. Field-Level Comparison of Nitrogen Rates and Application Methods on Maize Yield, Grain Quality and Nitrogen Use Efficiency in a Humid Environment. J. Plant Nutr. 2015, 39, 727–741. [Google Scholar] [CrossRef]
- O’Leary, M.J.; Rehm, G.W. Nitrogen and Sulfur Effects on the Yield and Quality of Corn Grown for Grain and Silage. J. Prod. Agric. 1990, 3, 135–140. [Google Scholar] [CrossRef]
- Perry, L.J.; Olson, R.A. Yield and Quality of Corn and Grain Sorghum Grain and Residues as Influenced by N Fertilization 1. Agron. J. 1975, 67, 816–818. [Google Scholar] [CrossRef]
- Simić, M.; Dragičević, V.; Drinić, S.M.; Vukadinovic, J.; Kresović, B.; Tabaković, M.; Brankov, M. The Contribution of Soil Tillage and Nitrogen Rate to the Quality of Maize Grain. Agronomy 2020, 10, 976. [Google Scholar] [CrossRef]
- Tamagno, S.; Greco, I.A.; Almeida, H.; Di Paola, J.C.; Ribes, F.M.; Borrás, L. Crop Management Options for Maximizing Maize Kernel Hardness. Agron. J. 2016, 108, 1561–1570. [Google Scholar] [CrossRef]
- Tsai, C.Y.; Dweikat, I.; Huber, D.M.; Warren, H.L. Inter-relationship of nitrogen nutrition with maize (Zea mays) grain yield, nitrogen use efficiency and grain quality. J. Sci. Food Agric. 1992, 58, 1–8. [Google Scholar] [CrossRef]
- Uribelarrea, M.; Below, F.E.; Moose, S.P. Grain Composition and Productivity of Maize Hybrids Derived from the Illinois Protein Strains in Response to Variable Nitrogen Supply. Crop. Sci. 2004, 44, 1593–1600. [Google Scholar] [CrossRef]
- Zhang, F.; Mackenzie, A.F.; Smith, D.L. Corn yield and shifts among corn quality constituents following application of different nitrogen fertilizer sources at several times during corn development. J. Plant Nutr. 1993, 16, 1317–1337. [Google Scholar] [CrossRef]
- Philibert, A.; Loyce, C.; Makowski, D. Assessment of the quality of meta-analysis in agronomy. Agric. Ecosyst. Environ. 2012, 148, 72–82. [Google Scholar] [CrossRef]
- Hedges, L.V.; Gurevitch, J.; Curtis, P.S. The Meta-Analysis of Response Ratios in Ecology. Ecology 1999, 80, 1150–1156. [Google Scholar] [CrossRef]
- Viechtbauer, W. Conducting Meta-Analyses inRwith themetaforPackage. J. Stat. Softw. 2010, 36, 1–48. [Google Scholar] [CrossRef] [Green Version]
- R Core Team. R: A Language and Environment for Statistical Computing; R Foundation for Statistical Computing: Vienna, Austria, 2020; Available online: http://www.R.-project.org/ (accessed on 17 August 2021).
- Adams, D.C.; Gurevitch, J.; Rosenberg, M.S. Resampling tests for meta-analysis of ecological data. Ecology 1997, 78, 1277–1283. [Google Scholar] [CrossRef]
- Noortgate, W.V.D.; Onghena, P. Parametric and nonparametric bootstrap methods for meta-analysis. Behav. Res. Methods 2005, 37, 11–22. [Google Scholar] [CrossRef] [PubMed]
- Canty, A.; Ripley, B. Boot: Bootstrap R (S-Plus) Functions. 2021. R Package Version 1. pp. 3–27. Available online: https://cran.r-project.org/web/packages/boot/boot.pdf (accessed on 17 August 2021).
- Borenstein, C.; Hedges, L.V.; Higgins, J.P.T.; Rothstein, H.R. Random-effects model. In Introduction to Meta-Analysis; John Wiley & Sons, Ltd: Padstow, UK, 2009; Chapter 12; pp. 69–75. [Google Scholar] [CrossRef]
- Gandah, M.; Bouma, J.; Brouwer, J.; Hiernaux, P.; Van Duivenbooden, N. Strategies to optimize allocation of limited nutrients to sandy soils of the Sahel: A case study from Niger, west Africa. Agric. Ecosyst. Environ. 2003, 94, 311–319. [Google Scholar] [CrossRef]
- Lemaire, G.; Ciampitti, I. Crop Mass and N Status as Prerequisite Covariables for Unraveling Nitrogen Use Efficiency across Genotype-by-Environment-by-Management Scenarios: A Review. Plants 2020, 9, 1309. [Google Scholar] [CrossRef] [PubMed]
- Zhang, P.; Ma, G.; Wang, C.; Lu, H.; Li, S.; Xie, Y.; Ma, D.; Zhu, Y.; Guo, T. Effect of irrigation and nitrogen application on grain amino acid composition and protein quality in winter wheat. PLOS ONE 2017, 12, e0178494. [Google Scholar] [CrossRef]
- Allen, N.K.; Baker, D.H. Quantitative Evaluation of Nonspecific Nitrogen Sources for the Growing Chick. Poult. Sci. 1974, 53, 258–264. [Google Scholar] [CrossRef]
- Lenis, N.P.; Van Diepen, H.T.M.; Bikker, P.; Jongbloed, A.W.; Van Der Meulen, J. Effect of the ratio between essential and nonessential amino acids in the diet on utilization of nitrogen and amino acids by growing pigs. J. Anim. Sci. 1999, 77, 1777–1787. [Google Scholar] [CrossRef]
- Liu, S.; Cui, S.; Zhang, X.; Wang, Y.; Mi, G.; Gao, Q. Synergistic Regulation of Nitrogen and Sulfur on Redox Balance of Maize Leaves and Amino Acids Balance of Grains. Front.Plant Sci. 2020, 11, 576718. [Google Scholar] [CrossRef]
- Morris, T.F.; Murrell, T.S.; Beegle, D.B.; Camberato, J.J.; Ferguson, R.B.; Grove, J.; Ketterings, Q.; Kyveryga, P.M.; Laboski, C.A.M.; McGrath, J.M.; et al. Strengths and Limitations of Nitrogen Rate Recommendations for Corn and Opportunities for Improvement. Agron. J. 2018, 110, 1–37. [Google Scholar] [CrossRef] [Green Version]
- Raun, W.R.; Dhillon, J.; Aula, L.; Eickhoff, E.; Weymeyer, G.; Figueirdeo, B.; Lynch, T.; Omara, P.; Nambi, E.; Oyebiyi, F.; et al. Unpredictable Nature of Environment on Nitrogen Supply and Demand. Agron. J. 2019, 111, 2786–2791. [Google Scholar] [CrossRef] [Green Version]
- Correndo, A.A.; Rotundo, J.L.; Tremblay, N.; Archontoulis, S.; Coulter, J.A.; Ruiz-Diaz, D.; Franzen, D.; Franzluebbers, A.J.; Nafziger, E.; Schwalbert, R.; et al. Assessing the uncertainty of maize yield without nitrogen fertilization. Field Crop. Res. 2021, 260, 107985. [Google Scholar] [CrossRef]
- Dhakal, C.; Lange, K.; Parajulee, M.N.; Segarra, E. Dynamic Optimization of Nitrogen in Plateau Cotton Yield Functions with Nitrogen Carryover Considerations. J. Agric. Appl. Econ. 2019, 51, 385–401. [Google Scholar] [CrossRef] [Green Version]
- Singh, M.; Paulsen, M.R.; Tian, L.; Yao, H. Site-Specific Study of Corn Protein, Oil, and Extractable Starch Variability Using NIT Spectroscopy; ASAE Meeting Paper; 02–1111; ASAE: St. Joseph, MI, USA, 2002. [Google Scholar]
- Seebauer, J.R.; Singletary, G.W.; Krumpelman, P.M.; Ruffo, M.L.; Below, F.E. Relationship of source and sink in determining kernel composition of maize. J. Exp. Bot. 2010, 61, 511–519. [Google Scholar] [CrossRef] [Green Version]
- Genter, C.F.; Eheart, J.F.; Linkous, W.N. Effects of Location, Hybrid, Fertilizer, and Rate of Planting on the Oil and Protein Contents of Corn Grain 1. Agron. J. 1956, 48, 63–67. [Google Scholar] [CrossRef]
- Weir, C.J.; Butcher, I.; Assi, V.; Lewis, S.C.; Murray, G.D.; Langhorne, P.; Brady, M.C. Dealing with missing standard deviation and mean values in meta-analysis of continuous outcomes: A systematic review. BMC Med Res. Methodol. 2018, 18, 1–14. [Google Scholar] [CrossRef] [PubMed]
Figure 1.
Correlation matrix between protein ((A), %), starch ((B), %), and oil ((C), %), all expressed in concentration (%), considering a subset of studies (11) where the three variables were quantified (n = 239) (Table 1).
Figure 1.
Correlation matrix between protein ((A), %), starch ((B), %), and oil ((C), %), all expressed in concentration (%), considering a subset of studies (11) where the three variables were quantified (n = 239) (Table 1).

Figure 2.
Simple relationships between grain yield (Mg ha−1, expressed in dry basis) and grain concentration (%) of protein (A), starch (B), and oil (C) (all adjusted to dry basis). For each component, data points belong to multiple studies where both grain yield and the component of interest were quantified.

Figure 3.
Summary of water stress effect (%) on maize grain quality components ((A)—Protein, (B)—Starch, and (C)—Oil, all expressed in concentrations, %). Effect sizes and 95% confidence intervals (CI) were transformed from lnRR into percentage [(exp(lnRR)−1)*100], as the concentration variation in water-stressed with respect to well-watered control. Within each variable, orange square symbols represent the mean effect per study, while shape size and whiskers represent their respective weights, and uncertainties, respectively. Blue circles represent the overall random effects model with their respective uncertainties.

Figure 4.
Summary of N fertilizer effect (%) on maize grain quality components ((A)—Protein, (B)—Starch, and (C)—Oil). Effect sizes and 95% confidence intervals (CI) were transformed from lnRR into percentage [(exp(lnRR)−1)*100], as the concentration variation in water-stressed with respect to well-watered control. Within each variable, green square symbols represent the mean effect per study, while shape size and whiskers their represent respective weights and uncertainties, respectively. Blue circles represent the overall random effects model with their respective uncertainties.

Figure 5.
Summary of N fertilizer effect (%) on maize grain quality components ((A)—Protein, (B)—Starch, and (C)—Oil) pooled by the N fertilizer rate level (low ≤70 kg N ha−1, medium >70–150 kg N ha−1, and high >150 kg N ha−1) vs. their respective control. Within each variable, symbols represent the mean effect per study, while size and whiskers represent their respective weights and uncertainties, respectively. Blue circles represent the overall random effects model with their respective uncertainties.


Table 1.
Data sources, measured grain quality variables, country, number of site-years per study (SY), water or nitrogen treatments, and other factors evaluated. PRO = protein, STA = starch, OIL = oil, FC = field capacity, RSMC = relative soil moisture content. * Performed under controlled conditions.
| No. | Authors | Variables | Country | Years | SY (#) | Treatments | +Factors |
|---|---|---|---|---|---|---|---|
| Water | |||||||
| 1 | Ali et al., 2010 [6] | PRO, STA, OIL | Turkey | 2007 | 1 | Irrigated (15d intervals), Water stress (21d intervals) | Hybrid |
| 2 | Ali et al., 2011 [27] | PRO, STA, OIL | Turkey | - | 1 | Irrigated (15d intervals), Water stress (21d intervals) | Hybrid, Hormones |
| 3 | Barutcular et al., 2016 [14] | PRO, STA, OIL | Turkey | 2014–2015 | 2 | Irrigated (full), Water stress (reproductive) | Hybrid |
| 4 | Ge et al., 2020 [13] | PRO, STA, OIL | China | 2002–2003 | 2 | Irrigated (full), Water stress (mild-severe, 3rd leaf to maturity-) | - |
| 5 | Hussain et al., 2020 [28] | PRO, STA, OIL | Pakistan | 2013–2014 | 2 | Irrigated (full), Water stress (mild-severe) | - |
| 6 | Kresovic et al., 2007 [29] | PRO, STA, OIL | Serbia | 2012–2014 | 3 | Irrigated (full), Water stress (75% FC–50% FC–rainfed) | - |
| 7 | * Lu et al., 2014 [12] | PRO, STA | China | 2011–2012 | 2 | Irrigated (75% RSMC), Water stress (60% RSMC, flowering to harvest) | Hybrid (wax) |
| 8 | Mason and Mason, 2002 [30] | STA | United States | 1991–1994 | 4 | Irrigated, rainfed | Hybrid, Plant density |
| 9 | Jahangirlou et al., 2021 [8] | STA, OIL | Iran | 2018–2019 | 2 | Irrigated (6d intervals), Water stress (12d intervals) | N |
| Nitrogen | |||||||
| 9 | Jahangirlou et al., 2021 [8] | PRO, STA, OIL | Iran | 2018–2019 | 2 | 0, 184 | Water Stress |
| 10 | Barrios and Basso, 2018 [31] | PRO, STA | Venezuela | 2013 | 1 | 0, 100, 150, 200 | Hybrid |
| 11 | Duarte et al., 2005 [32] | PRO, OIL | Brazil | 2000–2001 | 3 | 0, 60, 120, 240 | - |
| 12 | Ma and Biswas, 2016 [33] | PRO | Canada | 2006–2010 | 5 | 0, 30,60,90,120,150,180 | - |
| 13 | Miao et al., [18] | PRO, STA, OIL | United States | 2001–2003 | 6 | 0, 112, 168, 224, 336 | Hybrid |
| 14 | O’Leary and Rehm, 1990 [34] | PRO | United States | 1984–1986 | 8 | 0, 75, 150, 225 | - |
| 15 | Perry and Olson, 1975 [35] | PRO | United States | 1972–1973 | 2 | 0, 90, 180, 270 | - |
| 16 | Simić et al., 2020 [36] | PRO, STA, OIL | Serbia | 2016–2018 | 3 | 0, 180, 240 | Tillage |
| 17 | Tamagno et al., 2016 [37] | PRO, STA, OIL | Argentina | 2012–2013 | 2 | 0, 70, 165 | Hybrid |
| 18 | Tsai et al., 1992 [38] | PRO | United States | 1984–1986 | 3 | 0, 67, 134, 201, 268 | Hybrid |
| 19 | Uribelarrea et al., 2004 [39] | PRO, STA, OIL | United States | 2001–2002 | 2 | 0, 30, 60, 90, 120, 160, 200, 240 | Hybrid |
| 20 | Wortmann et al., 2011 [24] | PRO | United States | 2002–2004 | 32 | 0, 84, 140, 196, 280 | - |
| 21 | Zhang et al., 1993 [40] | PRO, OIL | Canada | 1989–1991 | 6 | 0, 90, 180 | N timing |
Table 2.
Descriptive statistics of the reported data on maize grain yield (dry basis), protein, starch, and oil concentration split by the treatments of interest (water and nitrogen fertilizer). Main statistics are sample size (n), mean, median, minimum (min), maximum (max), standard deviation (sd), and coefficient of variation (%).
| Variable | n | Mean | Median | Min | Max | sd | cv (%) |
|---|---|---|---|---|---|---|---|
| Grain yield, Mg ha−1 | 510 | 8.7 | 8.4 | 1.3 | 18.1 | 2.8 | 32 |
| Water, Control | 7 | 11.6 | 12 | 3.9 | 18.1 | 5.3 | 46 |
| Water, Stress | 9 | 8.4 | 7.9 | 1.3 | 15.7 | 4.8 | 58 |
| N, Control | 103 | 6.4 | 5.7 | 2.4 | 13.1 | 2.3 | 36 |
| N, Fertilized | 391 | 9.2 | 8.9 | 1.8 | 14.4 | 2.5 | 27 |
| Protein, % | 562 | 8.990 | 7.79 | 2.8 | 18.4 | 2.0 | 24.5 |
| Water, Control | 29 | 8.1 | 7.80 | 5.75 | 12.4 | 1.2 | 14.9 |
| Water, Stress | 31 | 8.1 | 8.17 | 6.24 | 12.0 | 1.1 | 14.3 |
| N, Control | 107 | 7.0 | 6.8 | 2.8 | 11.3 | 1.7 | 24.7 |
| N, Fertilized | 395 | 8.2 | 8.05 | 3.2 | 18.4 | 2.0 | 24.6 |
| Starch, % | 279 | 70.2 | 72.2 | 43.8 | 80.2 | 5.3 | 7.6 |
| Water, Control | 37 | 64.7 | 64.1 | 56.7 | 71.4 | 3.9 | 6.1 |
| Water, Stress | 39 | 63.9 | 64.1 | 43.8 | 75.5 | 6.1 | 9.5 |
| N, Control | 43 | 72.7 | 73.6 | 65.2 | 78.6 | 3.2 | 4.4 |
| N, Fertilized | 160 | 72.3 | 72.9 | 63.0 | 80.2 | 3.5 | 4.8 |
| Oil, % | 265 | 4.4 | 4.1 | 0.6 | 7.9 | 1.3 | 30.0 |
| Water, Control | 29 | 3.5 | 3.1 | 2.5 | 6.4 | 1.1 | 31.5 |
| Water, Stress | 31 | 3.5 | 3.0 | 0.6 | 6.1 | 1.2 | 34.9 |
| N, Control | 45 | 4.4 | 4.1 | 3.2 | 7.2 | 1.0 | 23.2 |
| N, Fertilized | 160 | 4.8 | 4.7 | 2.9 | 7.9 | 1.3 | 26.9 |
Publisher’s Note: MDPI stays neutral with regard to jurisdictional claims in published maps and institutional affiliations. |
© 2021 by the authors. Licensee MDPI, Basel, Switzerland. This article is an open access article distributed under the terms and conditions of the Creative Commons Attribution (CC BY) license (https://creativecommons.org/licenses/by/4.0/).
Share and Cite
MDPI and ACS Style
Correndo, A.A.; Fernandez, J.A.; Vara Prasad, P.V.; Ciampitti, I.A. Do Water and Nitrogen Management Practices Impact Grain Quality in Maize? Agronomy 2021, 11, 1851. https://0-doi-org.brum.beds.ac.uk/10.3390/agronomy11091851
AMA Style
Correndo AA, Fernandez JA, Vara Prasad PV, Ciampitti IA. Do Water and Nitrogen Management Practices Impact Grain Quality in Maize? Agronomy. 2021; 11(9):1851. https://0-doi-org.brum.beds.ac.uk/10.3390/agronomy11091851
Chicago/Turabian StyleCorrendo, Adrian A., Javier A. Fernandez, P.V. Vara Prasad, and Ignacio A. Ciampitti. 2021. "Do Water and Nitrogen Management Practices Impact Grain Quality in Maize?" Agronomy 11, no. 9: 1851. https://0-doi-org.brum.beds.ac.uk/10.3390/agronomy11091851
Note that from the first issue of 2016, this journal uses article numbers instead of page numbers. See further details here.