Article

Grass–Legume Mixtures Show Potential to Increase Above- and Belowground Biomass Production for Andean Forage-Based Fallows

1
Department of Soil and Crop Sciences, Colorado State University, Fort Collins, CO 80523, USA
2
Grupo Yanapai, Concepción, Junín 12126, Peru
3
Facultad de Ciencia Agrarias, Escuela Profesional de Agronomía, Universidad Nacional de Huancavelica, Acobamba, Huancavelica 09381, Peru
*
Author to whom correspondence should be addressed.
Submission received: 23 November 2021 / Revised: 14 December 2021 / Accepted: 4 January 2022 / Published: 7 January 2022

Abstract

:
Soils of the Andean highlands are under threat from cropping system intensification. Improved forage-based fallows offer great promise to address this issue, but research is needed to better understand the potential of species mixtures vs. monocultures to support multiple farmer objectives, especially forage production and soil conservation. We used a pot study to quantify above- and belowground biomass production as well as the total N uptake of grass–legume pairs between five grasses: (1) oat (Avena sativa), (2) ryegrass (Lolium multiflorum), (3) festulolium (Lolium × Festuca genera), (4) brome grass (Bromus catharticus), and (5) orchard grass (Dactylis glomerata), and four legumes: (1) vetch (Vicia dasycarpa), (2) red clover (Trifolium pratense), (3) black medic (Medicago lupulina), and (4) alfalfa (Medicago sativa) relative to the performance of each species in monoculture within two soils from the central Peruvian Andes. Grass–legume bicultures demonstrated significant overyielding, producing 65% and 28% more total dry biomass and total N uptake on average than monocultures. Aboveground biomass of bicultures was significantly influenced by the species of legume present, while belowground biomass was more affected by the grass species in the mixture. When evaluating the growth of each species separately, our findings indicate that overyielding was driven more by the enhanced growth of grasses relative to legumes. Our findings indicate that combining key functional groups (e.g., grass and legume, annual and perennial) offers great promise for developing improved fallows for supporting soil health and productivity in Andean agroecosystems.

1. Introduction

Vegetated fallows represent a traditional soil management strategy to regenerate soils in smallholder cropping systems around the world. In the high Andes of Peru, these fallows generally involve re-establishing native vegetation cover (mainly grasses, forbs, and shrubs) within an extended crop rotation involving multiple crops (e.g., tubers, legumes, grains, and forages) [1,2]. The fallow portion of the rotation typically lasts from 2 to 15 years, largely depending on altitude and land availability. These fallows play multiple agroecological roles. They provide a grazing resource for livestock and organic inputs in the form of plant residues and manure that contribute to soil organic matter (SOM) and the long-term productivity of soils [3,4]. At the same time, by maintaining soil cover, these fallows support soil conservation and improve water dynamics in these mountainous landscapes [3,5]. Despite the benefits of traditional fallows, population pressures and agriculture modernization are leading to the shortening of fallows or their disappearance in some highland areas [6]. This trend is especially notable in agricultural communities located near urban areas and large agricultural markets. The shortening of fallow periods between more extractive crops such as potatoes not only diminishes already scarce forage resources in these mixed crop–livestock systems but also threatens the long-term maintenance of soil fertility [6].
To address these concerns, “improved fallows” refer to the introduction of cultivated plant species in the fallow stage of a crop rotation and have been proposed as a means to accelerate the recovery of soil fertility and other key agroecosystem functions [7]. Improved fallows often include well-adapted, fast-growing species to rapidly cover soils and protect against erosion as well as legumes to support N accumulation for building SOM and overall soil fertility, but they can also include species that contribute much needed fuel or fodder during the fallow stage. This strategy has been tested widely in the tropics of Africa and Asia [8,9], and it fits well within the framework of agroecological intensification [10], but it has received less attention in other smallholder environments such as the Andean highlands. In the tropical Andes of Venezuela, the intentional seeding of native legumes (e.g., Lupinus meridanus) has been suggested as a promising strategy to build soil N pools and address shortening fallow periods [11]. Similarly, in the Peruvian highlands, planting perennial grass–legume mixtures has been shown to enhance the regeneration of soil nutrient pools and soil physical conditions [2]. Vanek et al. [1], also working in Peru, tested different improved fallow options together with farmers and found that improved fallows, especially those with alfalfa (Medicago sativa), supported subsequent potato productivity and quality (considered as a proxy for soil health), while also providing additional forage for livestock needs. However, information about which plant species associations can optimize aboveground resources (i.e., forage) and belowground organic inputs to support soil fertility and SOM restoration within the context of improved fallows is lacking.
Plant diversity is typically high in traditional Andean fallows, which are often dominated by a complex mixture of native grasses and forbs from multiple functional groups [12,13]. This diversity helps ensure the multifunctionality (capacity of ecosystems to provide multiple ecosystem functions and services at the same time [14]), resilience (socio-ecological capacity for adaptation and transformation [15]), and productivity of Andean cropping systems. Carefully selecting species for mixed systems, such as associations of legume and non-legumes, can foster synergistic interactions to increase biomass production and yield [16]. Beneficial interactions often involve complementarity between plant species, or the more effective use of the resources due to different species (or functional groups) filling different niches in the ecosystem [17]. Interspecific facilitation can also drive positive interactions, where one plant species creates favorable conditions for another, mediated by nutrient supply, physical support, or other mechanisms (e.g., improved water availability, pest control) [18]. Both complementarity and facilitation can act to increase water use efficiency and the total nutrient supply available to plant associations, thus supporting greater productivity. Previous studies have shown that having key plant functional groups can increase overall productivity but also provide key agroecological benefits (e.g., weed and pest suppression, increasing plant residues, and supporting beneficial insect populations), thus enhancing the overall functionality of agroecosystems [19,20].
These positive interactive effects of functional species mixtures also have implications for soil functioning. For example, legumes fix N, which then can be transferred to non-legume species allowing for an increase in the total N cycling, a key limitation in many agriculture systems [21]. Similarly, mixtures of fast-growing species such as annual grasses and legumes can deliver early benefits when N fixed by legumes supports the establishment of slower-growing mixture components that contribute to long-term soil and agroecosystem functioning [22].
Root growth of different species and their interactions play an important role in determining mixture performance and their potential to benefit SOM and nutrient pools [23]. For example, perennial mixtures with legumes have been shown to allocate substantially more C and N belowground than their respective monocultures, which is mainly due to an increase in root biomass accumulation throughout the soil profile [24]. Species mixtures can also support belowground biodiversity and activity in the soil, with implications for multiple soil functions [25]. Thus, many authors have suggested that roots and associated rhizodeposits represent key organic inputs that contribute disproportionately to the building of SOM and the restoration of soil health and productivity [26,27].
In spite of the great potential of plant species mixtures to support multiple ecosystem functions, highly diverse mixtures are not always practical, and similar benefits can often be achieved with simple associations of just two or three species from different functional groups [28]. In addition, species interactions are likely environment specific, and more information is needed to determine the optimal species combinations in high Andean contexts. This study builds on the potential of species mixtures to support key ecosystem services, and it is part of a wider effort to develop forage-based fallows in the Peruvian highlands that can maintain soil health and address critical shortages in forage [1]. Specifically, we sought to address the following questions:
1.
To what extent do species mixtures (or bicultures) promote above- and belowground biomass production relative to monocultures across differing soil conditions?
2.
Are there specific bicultures (or component species) that are especially promising for supporting aboveground vs. belowground biomass production (and associated implications for forage vs. soil improvement)?
We hypothesized that mixtures would generally perform better (including root biomass production and whole plant N uptake) than monocultures. Additionally, we hypothesized that promising species mixtures respond consistently across soils with contrasting fertility levels. To address these questions, we used a pot study to quantify the above- and belowground production of forage bicultures vs. monocultures within two soils from the central Peruvian Andes. We note that this pot study was used as a pilot study to inform subsequent research with farmers, where mixtures could be tested under field conditions during a full 3-year fallow phase.

2. Materials and Methods

2.1. Study Site and Soil Collection

The experiment was established in a protected outdoor location in the district of Quilcas, which is located in the Junín region of Peru (−11.922 S, −75.247 W). At an altitude of 3506 m, the average monthly temperature varies from 12 to 16 °C, and the average rainfall is 700 mm yr−1, occurring mainly in the growing season from October through April [29].
In mid-November of 2014, soils were collected from farmers’ fields in two agricultural communities of the central Andean region. The first soil was collected from a field adjacent to the study site in the district of Quilcas, while the other soil came from the community of Castillapata (−12.734 S, −74.815 W) located in the Huancavelica Region, at an altitude of 3930 m. This site has an annual precipitation of ≈703 mm yr−1, again with most rainfall occurring from October to April, and average annual temperature that varies from 6 to 9 °C [30]. Both sites are characterized by rugged topography and high susceptibility to erosion and largely dominated by Inceptisols (USDA soil taxonomy), with pH conditions ranging from acidic to very acidic. The soils collected from Quilcas have low to moderate SOM, with a clay loam texture, while the lower temperatures in Castillapata result in greater accumulation of SOM and with sandy loam texture (Table 1).
Both soils came from fields in the first year of traditional fallow, after a 3–5-year crop sequence. Soils were collected approximately 4 months after the last crop was harvested. These rotations typically involve potato (Solanum tuberosum), other Andean tubers (e.g., Oxalis tuberosa), legumes (e.g., Vicia faba), and corn (Zea mays) followed by a 2–3-year traditional fallow at the Quilcas site, while in Castillapata, the crop rotation usually includes potato (Solanum tuberosum and S. andigena), and annual forages (barley (Hordeum vulgare) or oats (Avena sativa)) followed by a 3–7-year fallow.

2.2. Experimental Design and Establishment

Soils from each site were collected (≈400 kg per site) to a depth of 20 cm and passed through a 5 mm sieve to remove rocks and large organic debris. Soils were thoroughly mixed to homogenize material separately for each site. A representative subsample (≈2 kg) of each soil was collected, air-dried, passed through a 2 mm sieve, and sent to the Soil and Plant Nutrition Lab at La Molina University (Lima, Peru) for analysis of physical and chemical properties (Table 1). For establishment of the pot study, soils were mixed with sand (3:1 soil:sand ratio by volume) in order to ensure adequate drainage. Pots were constructed from 10 cm diameter PVC pipe cut into 40 cm long sections, with a cap affixed to the bottom. Each pot was filled with approximately 3 kg of the soil–sand mixture, with six drainage holes at the base (≈3 mm in diameter). In order to help regulate temperature and humidity, the pots were placed in four separate trenches (≈5 m long, with a rock layer at the bottom for drainage), and the trenches were backfilled, such that the soil surface in each pot was level with the surrounding ground.
Forage species from two plant functional groups (legumes and grasses) were selected based on consultation with local farmers and a preliminary pot trial, which evaluated the productivity of approximately 60 different species (or varieties) of cultivated and native plant species under conditions similar to this study (data not presented here). A total of five grasses, including one annual species (oats) and four perennials, were selected: oats (Avena sativa cv. Mantaro 15M; OATS), ryegrass (Lolium multiflorum cv. Tama; RYEG), Festulolium (Lolium × Festuca genera; FELO), brome grass (Bromus catharticus; BROM), and orchardgrass (Dactylis glomerata; ORCH). Four legumes, including one annual (vetch) and three perennials were selected: vetch (Vicia dasycarpa; VETCH), red clover (Trifolium pratense; REDC), black medic (Medicago lupulina; MELU), and alfalfa (Medicago sativa; cv. Ranger; ALFA). In December 2014, treatments were established using all possible pair-wise combinations of the two functional groups (grass–legume) as well as each species planted in monoculture. These 29 treatments were planted within both soil types resulting in a total of 58 treatments. Each plant treatment and soil combination were present in four replicate blocks in a randomized complete block design for a total of 232 experimental units. The density of seeds planted in each pot was selected based on the seed size and anticipated growth rate of each species allowing plants to fill the area of the pots to a similar degree. Monocultures were always seeded at double the rate of individual species in bicultures (Table 2). Seeds were sown into the pots at slightly higher densities than needed, covered with a thin layer of sand, and treatments were thinned to the desired densities two weeks after emergence. In several cases of poor germination, a separate set of seeds were pre-germinated with gibberellic acid (1 mL L−1) and maintained in a moist paper towel at ≈25 °C to break dormancy. These seedlings were used as needed in the first few weeks of the experiment to achieve the desired densities in several pots with missing plants. Given that the pots were located outside, each block was covered with a removable plastic cover on a wooden frame to protect against hail damage during severe storms. The experiment was watered weekly when there was insufficient rainfall. Pots received no fertilizer or pesticide inputs and were weeded regularly to limit the growth of undesired species.

2.3. Plant Harvest and Data Collection

Pots in all treatments were harvested 141 days after sowing, in April 2015 (end of the rainy season), when 75% of the vetch reached the flowering stage, based on the typical timing and average growing season length for fodder crops in the region. At harvest, pots were destructively sampled to assess above and belowground biomass production and total N content. Plants and soil were removed from the pots and deposited onto a tray. Soil was removed from plant roots by gently breaking apart large aggregates, and the plants were sorted by functional group. Then, roots were separated from the aboveground portion of each plant (stems, leaves, and flowers) using scissors and rinsed with water on top of three sieves of sizes 2 mm, 1 mm, and 0.5 mm to capture the roots that were broken during root washing. All plant components were placed in separate paper bags, dried at 60 °C, and weighed. To determine the N content of the biomass, a subsample of the dried plant components from each pot were combined in their relative proportions (according to the biomass of each component) for a single composite sample (≈1 g). Then, these subsamples were ground and sent to the Soil and Plant Nutrition Lab at La Molina University for analysis of total N using the Micro-Kjeldahl Method.

2.4. Calculating the Relative Yield Total

The total dry biomass of the mixtures and monocultures were used to calculate the Relative Yield Total (RYT) for each mixture. RYT is defined as the sum of the relative yield components of each crop. An RYT > 1 indicates that polycultures are more productive than their respective monocultures [16]. The RYT was calculated using the equation:
RYT = ( P L M L ) + ( P G M G )
where PL and PG are the dry biomass for the legume and grass, respectively, under polyculture conditions, and ML and MG represent the biomass of the legume and grass, respectively, when grown as a monocrop. For this calculation, ML and MG were represented by a pooled average of yield across all replicates of the component monoculture, while PL and PG were based on individual replicates of each treatment, so that RYT was calculated for each experimental unit. We also considered the relative yield (RY) components for each treatment (PL/ML and PG/MG), which assess the relative contribution of each species to any observed overyielding.

2.5. Statistical Approach

To examine plant treatment and soil effects on total plant biomass, root biomass, shoot biomass, and total plant N content (roots + shoots), we used two-way ANOVA with plant treatments (29 levels) and soil type (2 levels), and their interaction was considered as a fixed effect and block (or replication) was considered as a random effect. Due to the strong interest in developing perennial forage mixtures and the relatively high productivity of the annual species (oats and vetch), the above analyses were also conducted using only the treatments with perennial species. Additionally, contrasts were used to compare plant species in biculture vs. monoculture, for both sets of analyses, with and without annuals.
A second model was used to compare plant bicultures using RYT as the main response variable, with RYT calculated separately for total biomass as well as root and shoot biomass. This model considered grass species (5 levels), legume species (4 levels), and soil type (2 levels) and all possible two and three-way interactions as fixed effects, while block was considered as a random effect. Similar to the two-way ANOVA mentioned above, the analyses were conducted both with and without annual species.
For all analyses, estimated means were compared using Tukey tests. In addition, 95% confidence intervals drawn from the Tukey test were used to test if RYTs were significantly different from 1.0. Meanwhile, a Bonferroni correction was used for specific comparisons, such as statistical contrasts between biculture vs. monocultures. To meet ANOVA assumptions of homoscedasticity and normality, square root transformations were applied to all response variables except for several variables (total biomass, shoot biomass, root RYT), where natural log transformations were applied. All analyses were carried out with R statistical software [33], using the lme4 [34], lmerTest [35], and emmeans [36] packages, with a significance criterion set at α = 0.05.

3. Results

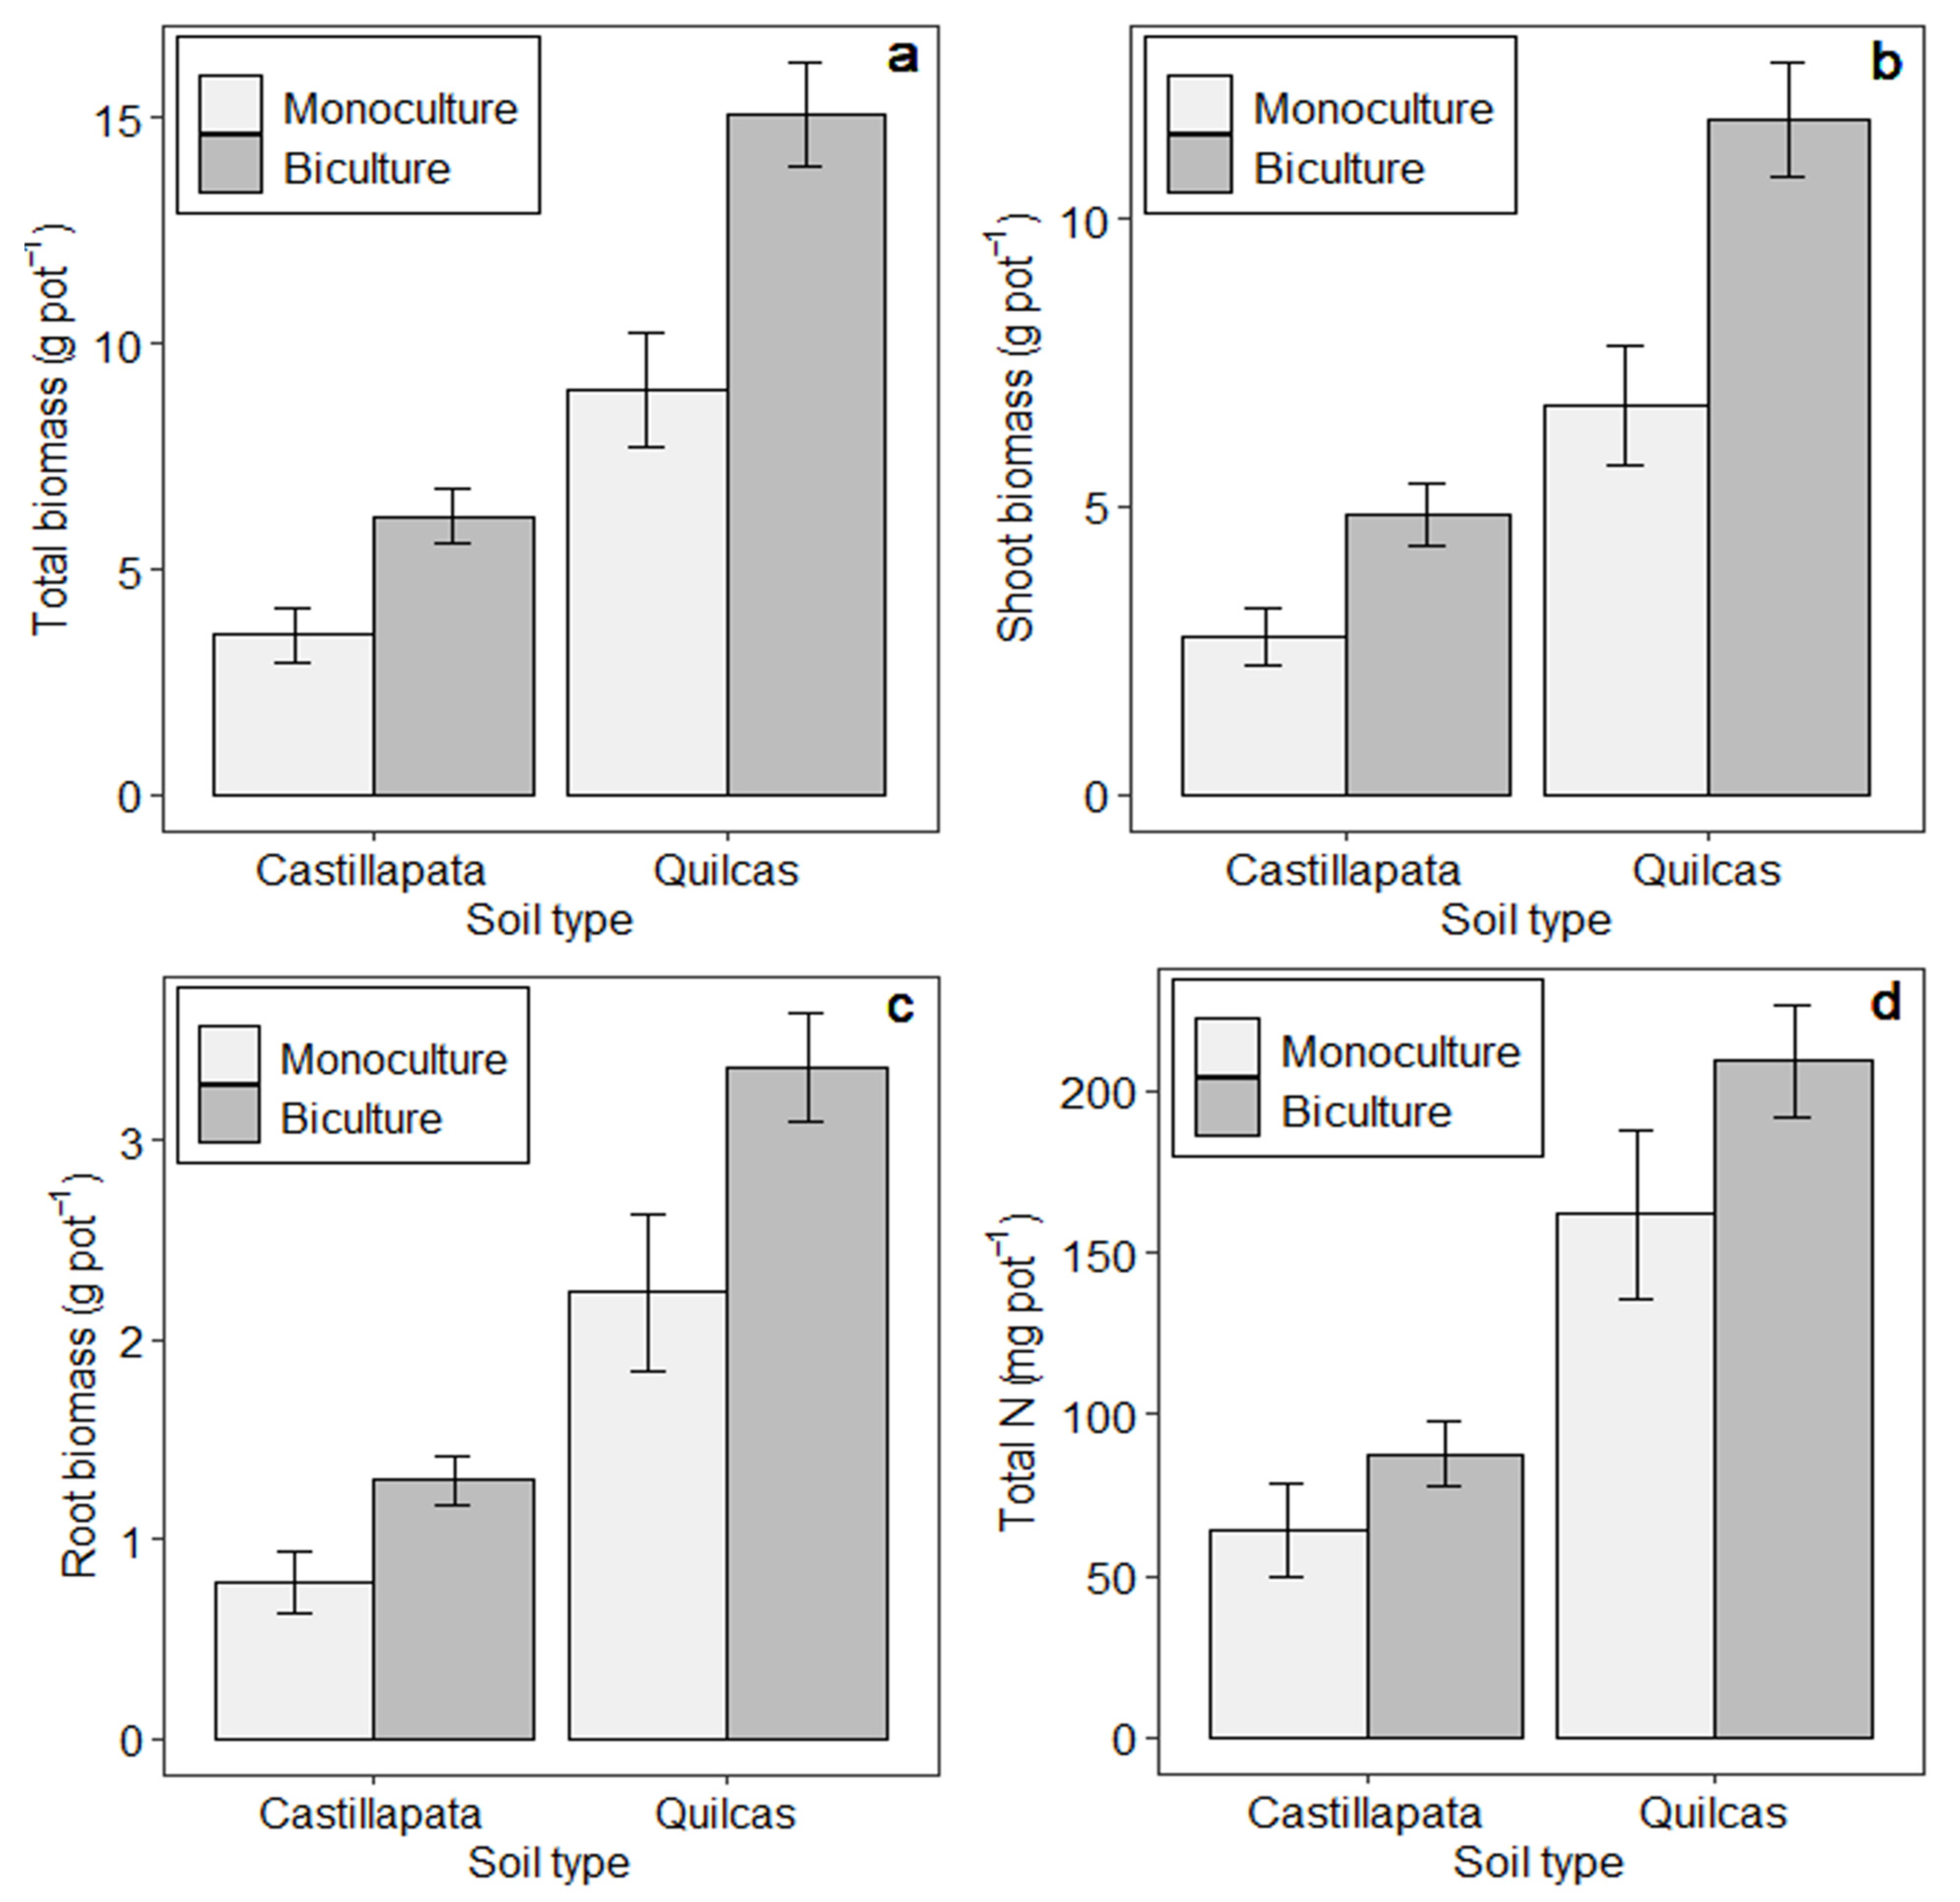
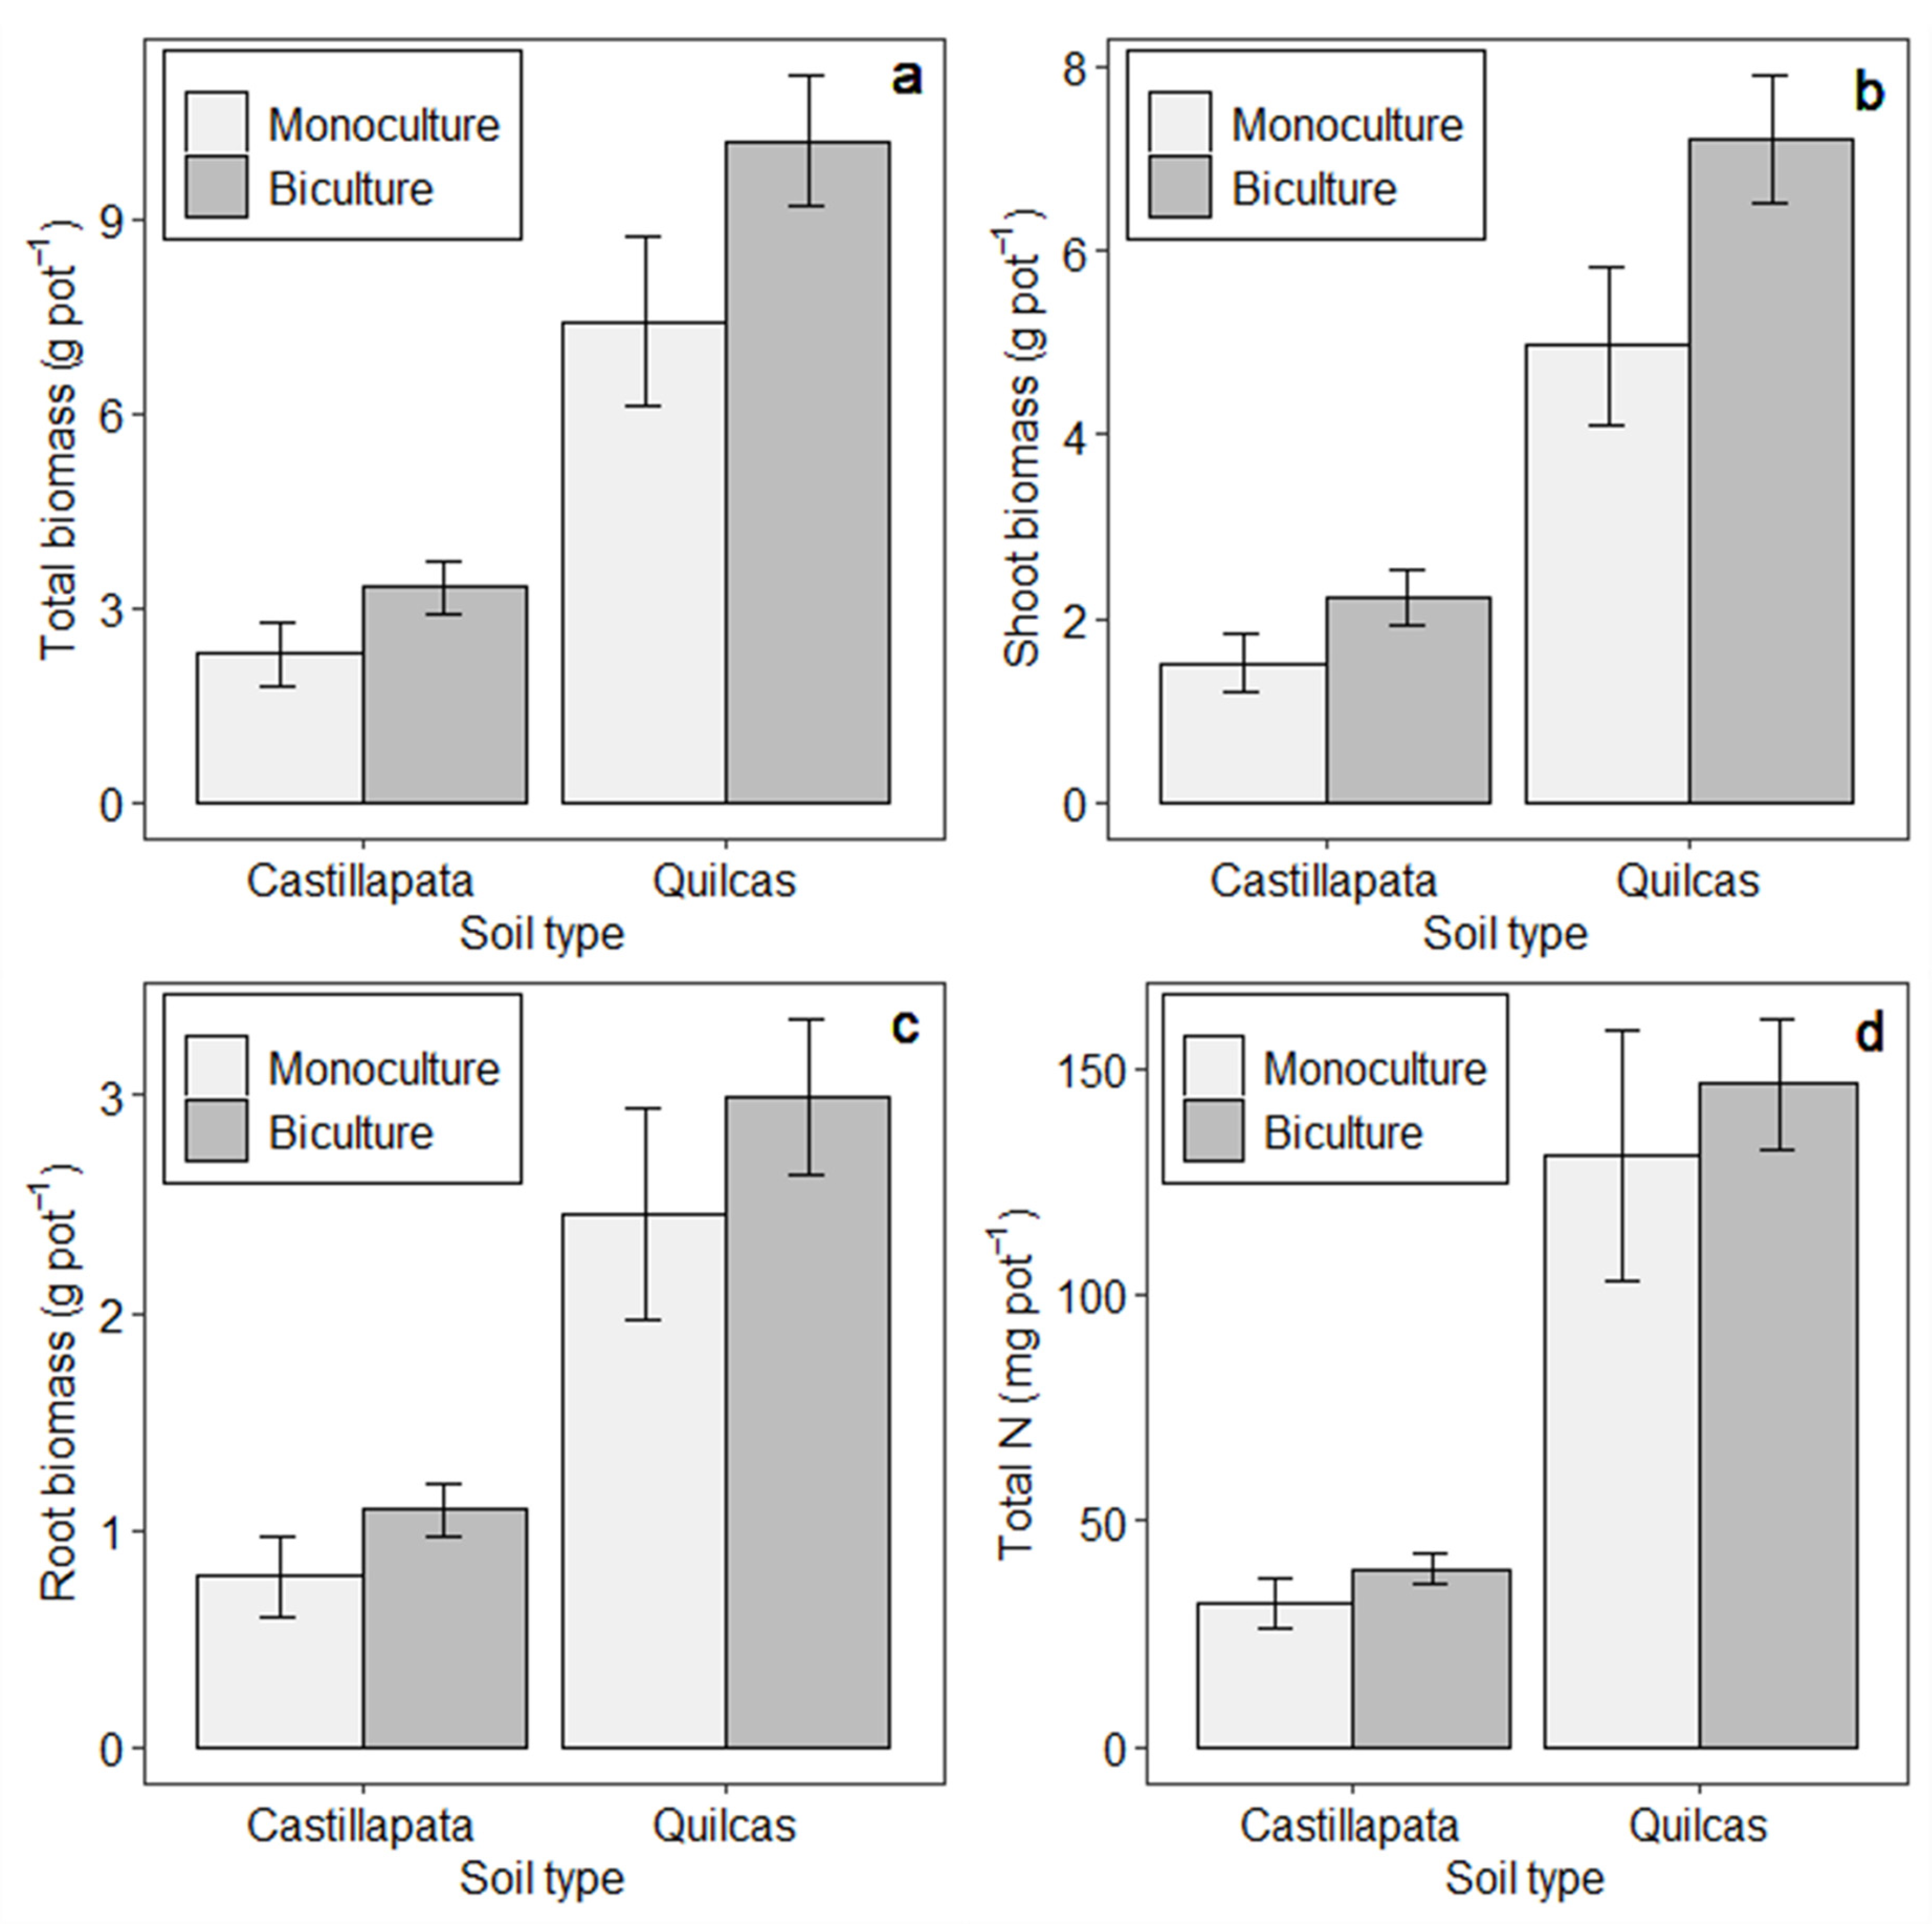
3.1. Treatment and Soil Effects on Biomass Production and N Uptake

Overall, 92% of pots maintained the desired treatments and were harvested as planned. There was a small amount of loss of experimental units in the trial, where one or both of the component species died before harvest. Losses were not associated with any particular treatment and were excluded from the analysis (Table 2).
Total plant biomass, aboveground biomass, root biomass, and total N uptake were influenced by both treatment and soil type (p < 0.001; Table 3 and Table 4). Plant treatments that included the annual oat and vetch species resulted in the highest productivity based on total biomass, while the lowest biomass across all treatments corresponded to the perennial legume monocultures (Table 3; Figure S1). For soils, total plant biomass was nearly 2.5 times higher in the Quilcas soil than in soil from Castillapata (Figure 1), while the general lack of significant interactions between soil and plant treatments showed that differences in plant treatment were largely consistent across soil types. One exception is noted for root biomass (interaction p = 0.018); in this case, although most treatments produced more root biomass in the Quilcas soil, there were some treatments, such as festulolium-vetch, brome-vetch, and vetch monoculture, that had similar root biomass across the two soils (Table 4; Table S2). Perennial treatments with high productivity included ryegrass and festulolium, either in biculture or monoculture.
Statistical contrasts comparing bicultures vs. monocultures, in terms of biomass and N uptake averaged across the two soils, indicated that bicultures had 65% higher total biomass and 28% greater total N uptake than monocultures (p < 0.001; Figure 1). Consideration of only the treatments with perennial species showed that the bicultures, on average, yielded 36% and 13% more than monocultures in terms of total biomass and total N uptake, respectively (p < 0.001; Figure 2).

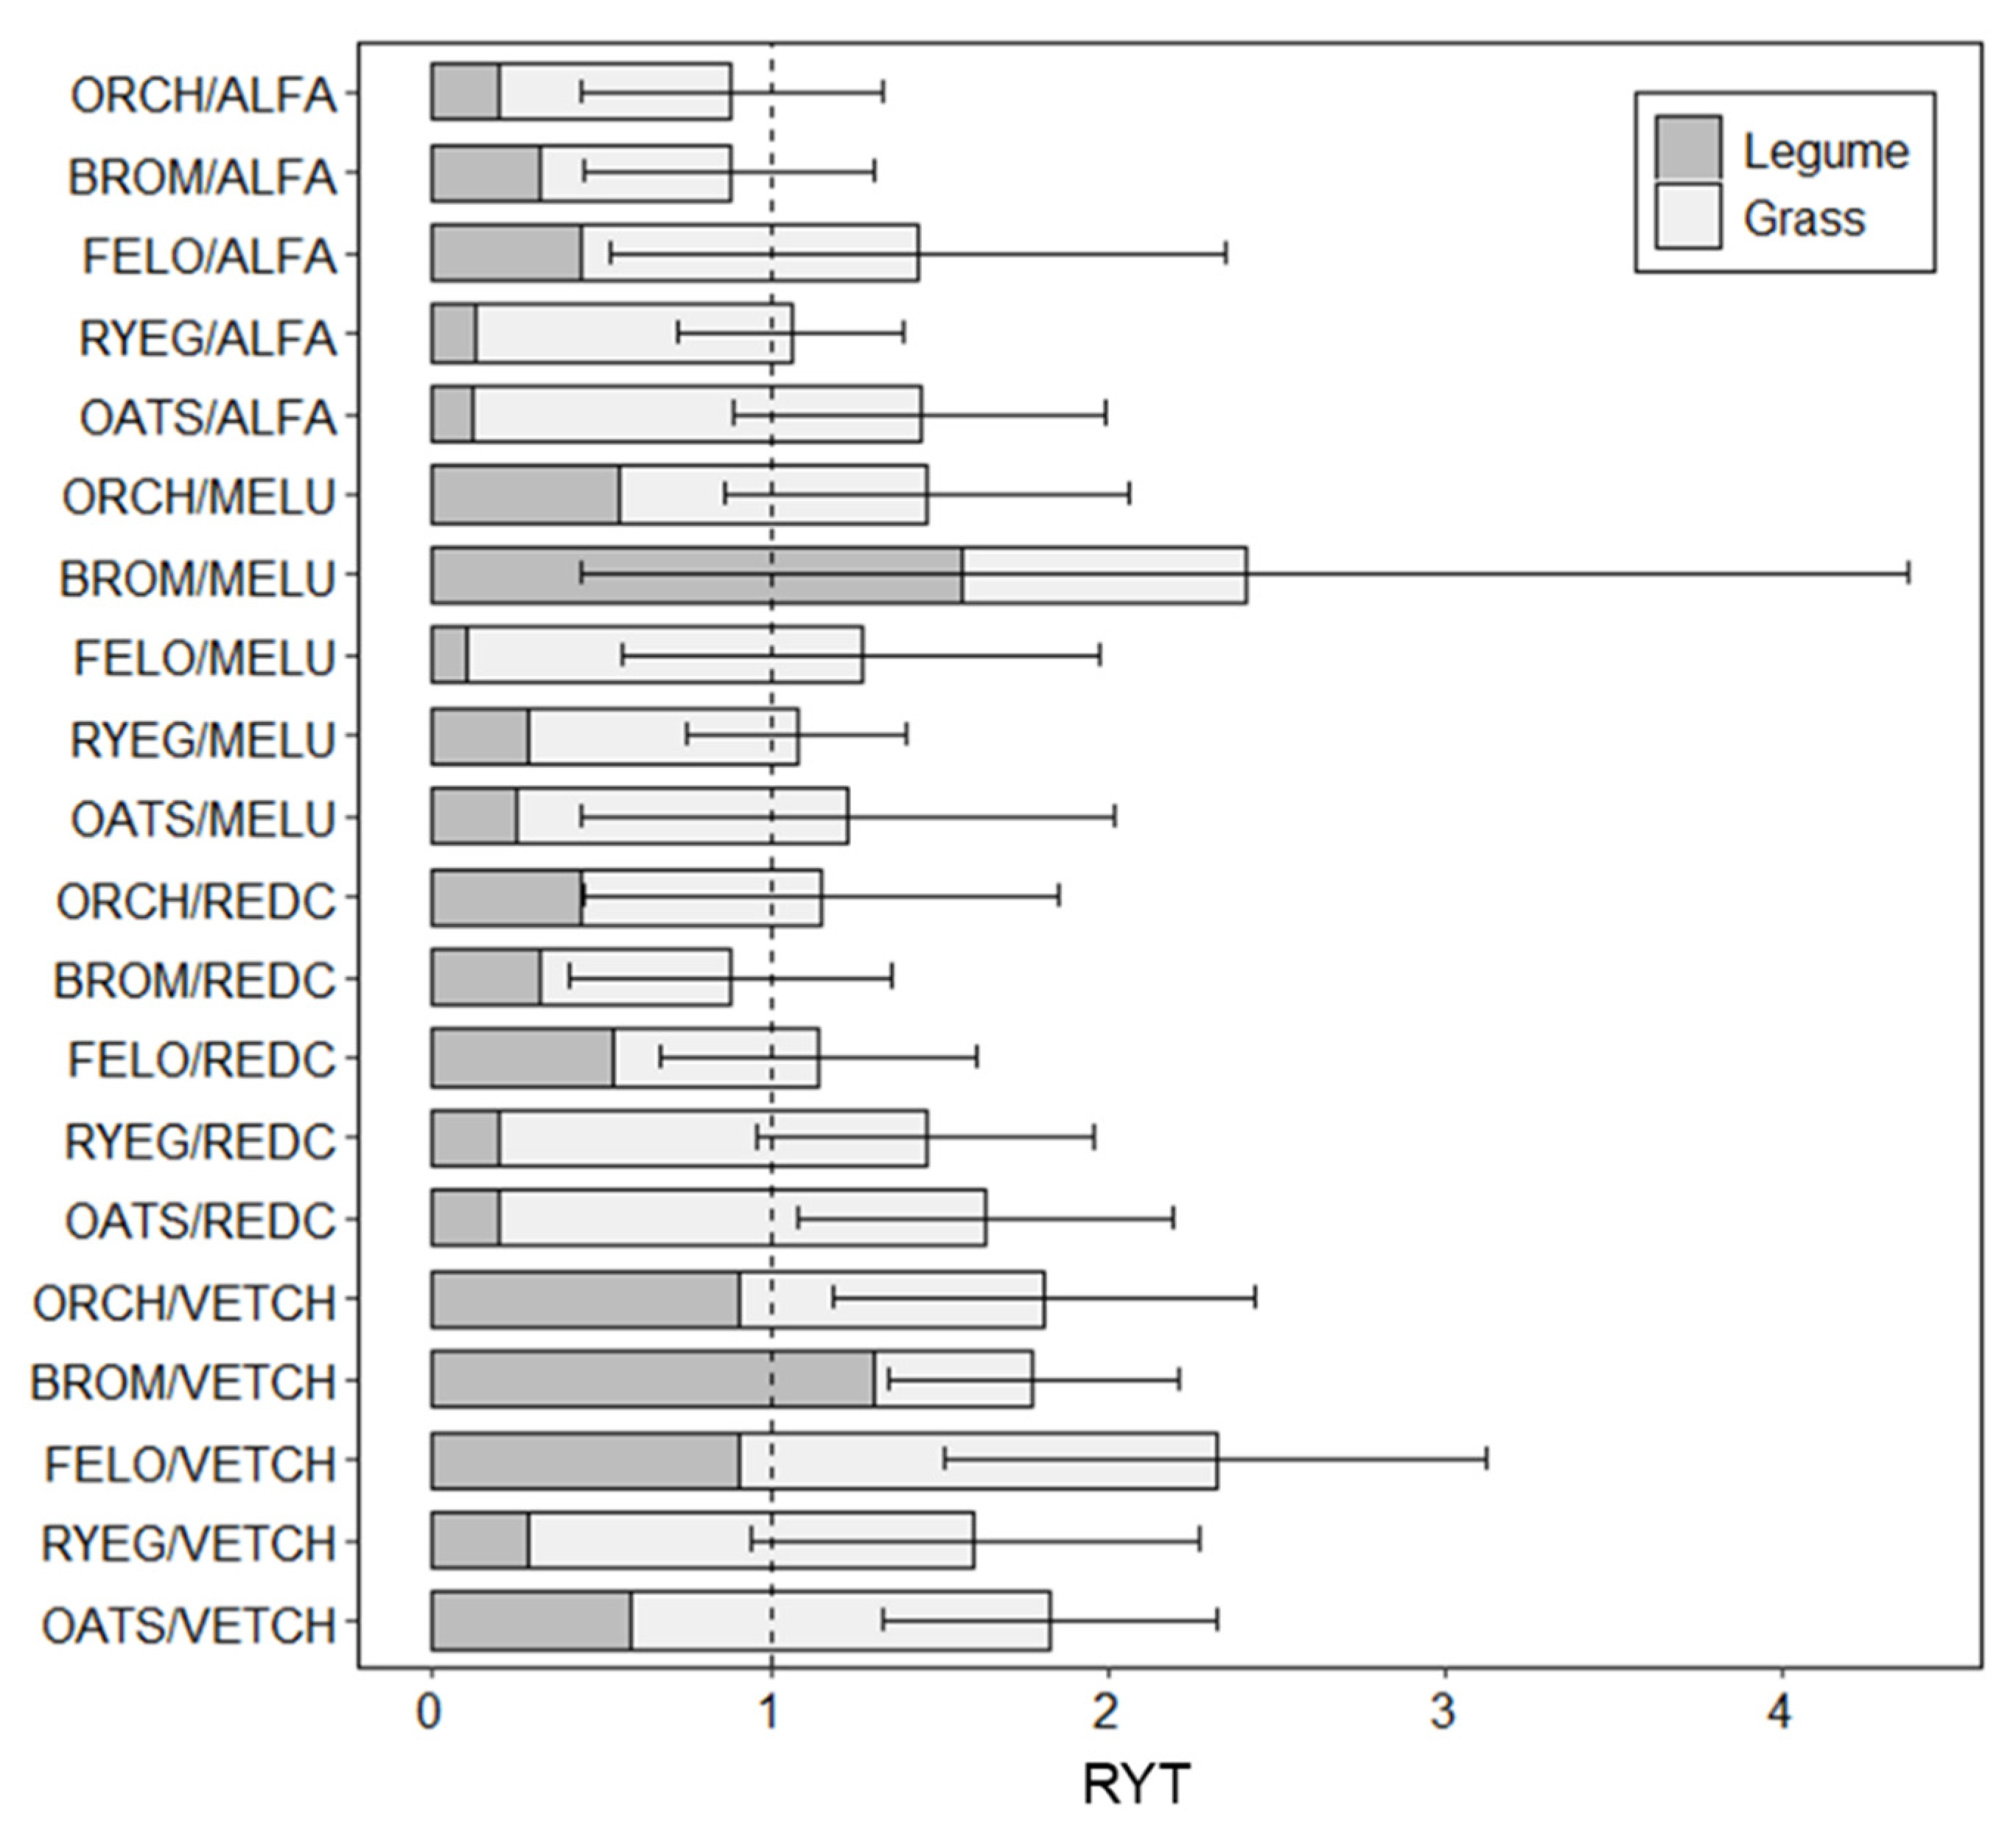
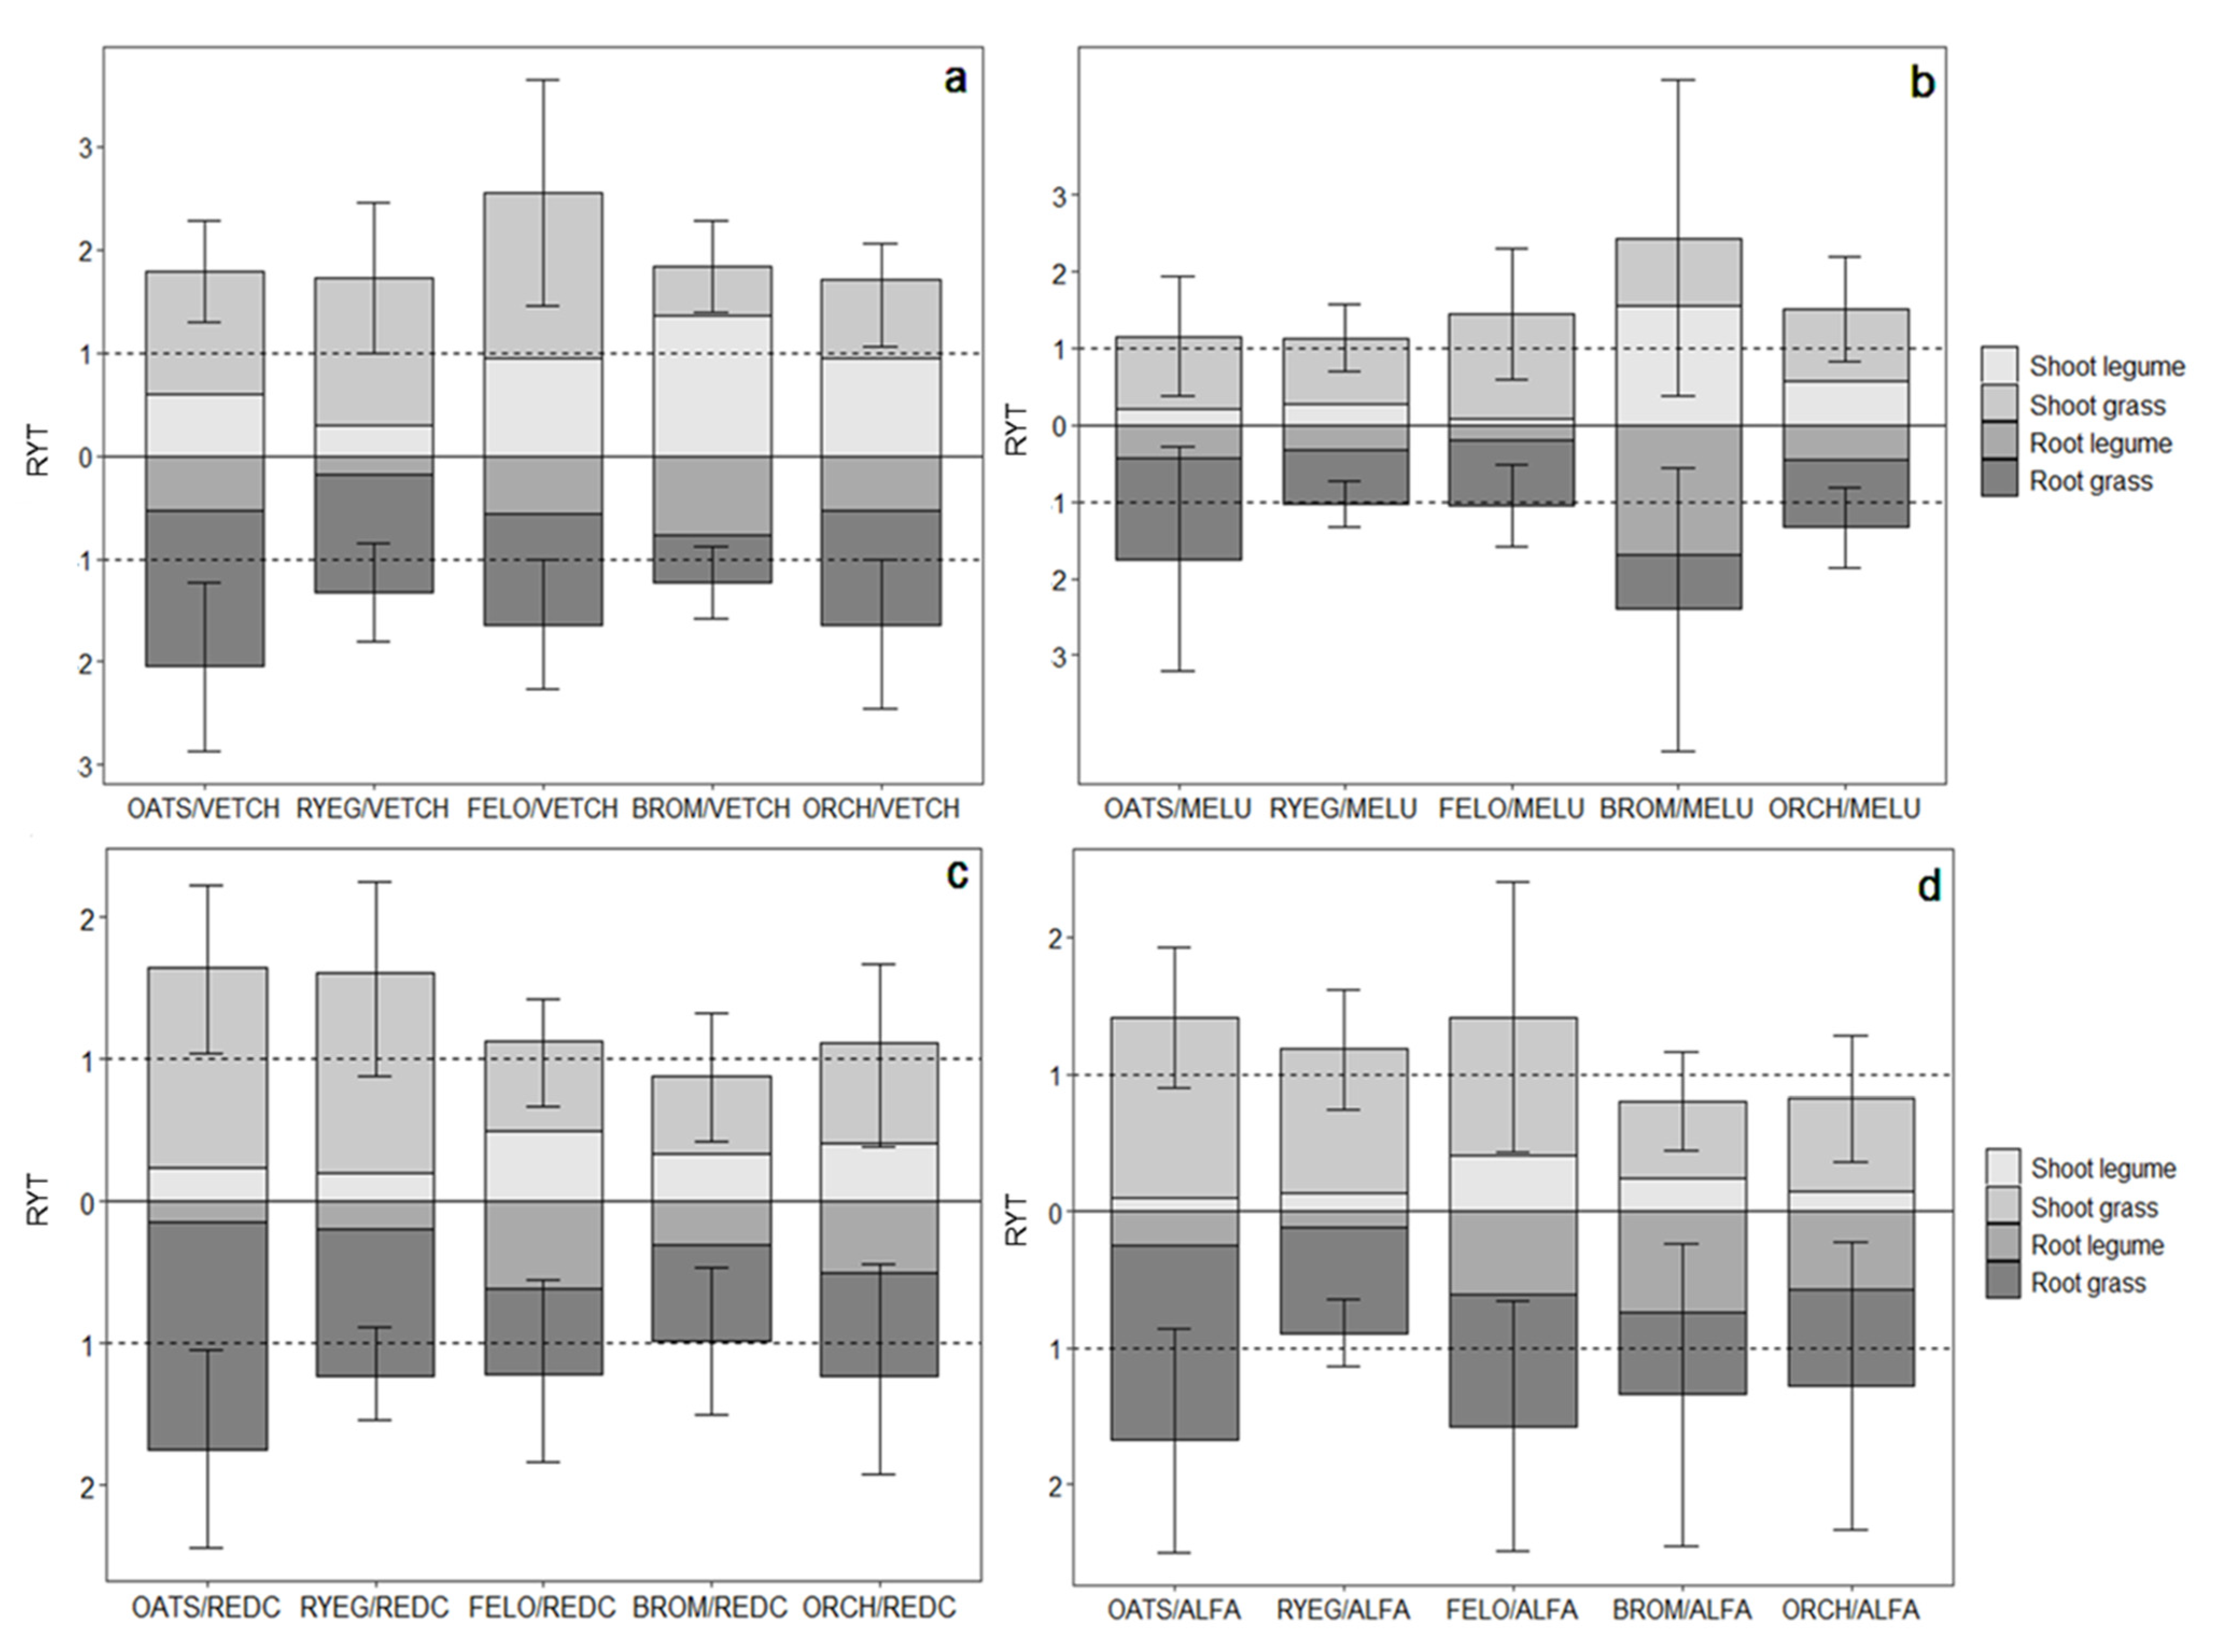
3.2. Comparing RYT across Mixtures

When considering total biomass production across the grass–legume bicultures, vetch paired with festulolium, orchardgrass, oat, brome, and ryegrass as well as red clover paired with oats demonstrated overyielding with RYT values significantly greater than 1.0 (p < 0.05; Figure 3). While mean RYT values for many other treatments were greater than 1.0 (Figure 3), high variability in many treatments led to the inclusion of the overyielding threshold (RYT = 1.0) within their 95% confidence intervals for biomass, thus indicating less confidence in their ability to consistently overyield.
The RYT for total biomass was influenced by the type of legume in the mixture (p = 0.001, Table S1), such that mixtures including vetch had an average RYT for total biomass of 1.87, whereas average RYT values for red clover (1.25) and alfalfa (1.14) were lower. When examining RYT values for above- and belowground plant components separately, the aboveground biomass followed the same trend as total biomass, such that RYT values were significantly influenced by the type of legume (p < 0.001, Table S1), with no significant interactions with other factors. Meanwhile, the variation in RYT values corresponding to belowground biomass was influenced by the grass species present (p = 0.049, Table S1). This is largely explained by mixtures with oats having higher RYT values for root biomass when averaged across soils.
When only considering treatments with perennial species, RYT values for total biomass and belowground did not show significant differences between treatments (Table S1). RYT for aboveground biomass was significantly influenced by the type of legume present (p = 0.028, Table S1), such that treatments with black medic in association with any grass seem to have higher RYT. However, it should be noted that black medic had relatively low performance in monoculture (Figure S1, Table 3 and Table 4).
The RYs (calculated as each species’ term in the summation defining RYT; see Equation (1) in Methods) were examined to understand how different species behaved in biculture. The RYs indicated that although the legume type present explained differences in RYT across the various bicultures (Table S1), the grass component of each biculture appeared to be the main driver for higher or lower RYT (Figure 3). This was clearly seen in that the RY for the grass component across all bicultures and soil type was 0.97, while the RY for legumes averaged 0.48. Among the most productive bicultures, vetch–oat, vetch–ryegrass, and red clover–oat all had high aboveground RYT values (Figure 4). The grasses within these bicultures had RYs of 1.20, 1.43, and 1.38, meaning that with just half of the density of plants present in their monoculture, the grasses in biculture produced more biomass. At the same time, the legume component in these bicultures achieved 0.60, 0.30, and 0.22 RY, respectively. In the case of vetch–festulolium, vetch–orchard grass, and vetch–brome bicultures, grasses had shoot RYs of 1.61, 0.80 and 0.53, respectively, while vetch in these bicultures had RY values of 0.94, 0.97, and 1.28, respectively (Figure 4).
When examining RYs for belowground biomass, grass roots largely explained the variation in RYT between treatments. Vetch–oat, vetch–orchardgrass, red clover–oat, and vetch–festulolium had the highest RYT for roots. When oat was present in these mixtures, it had generally high RY values for roots (on average 1.6) across all oat–legume combinations (Figure 4). Legume type appeared to influence the RY of grasses; for instance, black medic led to overall lower RYs for grasses (Figure 4b) in comparison to red clover and alfalfa (Figure 4c,d).

4. Discussion

Our results broadly support our hypothesis that mixtures of distinct plant functional types can enhance above- and belowground biomass production relative to monocultures, with important implications for forage production and other ecosystem services.

4.1. Overall Performance of Bicultures vs. Monocultures

Our findings indicate that combining grass and legume forage species increased the total biomass production relative to the same species grown in monoculture (Table 3; Figure 2 and Figure 3). Average RYT values of ≈1.4 suggest that ≈40% more area would be needed to produce the same amount of biomass under monoculture, on average, than with the two-species mixtures tested here. The RYT achieved in our study is in line with the average RYT of 1.22 reported in a meta-analysis by Yu et al. [37] that compared 189 experiments across five continents, with roughly 85% of the studies looking specifically at intercropping systems based on grass–legume mixtures. In our study, trends for aboveground biomass were similar to results for total biomass, where bicultures overyielded by 67% compared to their respective monocultures (Figure 1b). This result is consistent with other studies, where more diverse species mixtures have been shown to exceed the average biomass yield of their component monocultures by 70% to 200% [38,39]. Furthermore, our results suggest that the mixture benefits from these tested species are similar across two soils with widely differing chemical properties and productivity, indicating that these sorts of mixtures may be applicable across a range of different soil types in Andean agricultural landscapes.
In agricultural systems, the beneficial effects of plant diversification on productivity are not simply due to increased species diversity per se but more often to interactions between key functional groups (e.g., legumes and grasses) that allow mixtures to be more productive [40]. An example of this sort of functional interaction has been reported previously for legumes growing with other plant functional groups, especially grasses [41,42,43]. Including legumes in mixtures often leads to increased N uptake and total biomass production relative to monocultures [44]. This same trend was observed in our study, where grass–legume mixtures had 28% greater N in their biomass than their respective monocultures, and this was associated with 65% higher total biomass production compared to monocultures (Figure 1a,d). This phenomenon can be due to a variety of mechanisms; however, we suspect that enhanced N cycling due to the facilitation of N fixation is at least partly responsible for the trends observed. Grasses can effectively compete for available soil N, thus forcing legumes to meet their N demand through N fixation [45]. This situation increases the overall input of N into the soil–plant system, and the legume N then eventually becomes available to the grasses through a variety of different means (e.g., decaying of senescent roots/nodules, release in exudates, mycorrhizal mediated transfer), thus enhancing the productivity of the system. In one example from the tropics, Eaglesham et al. [46] reported that maize N uptake increased by roughly 90% when grown in association with cowpea compared to maize grown in monoculture; they also used 15N isotopes to show that most of the N increase was from atmospherically derived N fixed by the cowpea at their physiological maturity (≈85 days after seeding). In our study, such facilitation of N is evidenced by the positive response of grasses to the biculture conditions, with an average component RY of 0.96 (where 0.5 indicates no change between mixture and monoculture), whereas legumes on average had a RY of 0.48. The increase in total N uptake in these unfertilized soils and the fact that legumes did thrive to the same extent as grasses in biculture suggest that the legumes were able to fix additional N but that most of this N may have been utilized by the grasses.
Interspecies complementarity exists as another possible mechanism to explain the general increase in biomass and N uptake in mixtures vs. monocultures. Along with the observed effects on overall productivity, the root biomass of the bicultures yielded 58% more than monocultures (Table 3; Figure 1c and Figure 2c). This general increase in root biomass suggests that mixtures were more effectively exploiting soil resources in the pots and provides evidence of complementarity. Our results are consistent with a global metanalysis that includes results from multiple experimental set-ups (e.g., small plots, greenhouse), where they found that plant mixtures, on average, produced ≈29% more fine root biomass and ≈45% higher total root annual biomass than plants grown in monoculture [47]. This result may be due to differences in root architecture or other root traits that allow for improved resource extraction [48]. Beyond supporting improved resource acquisition and overall plant productivity, enhanced root growth under mixtures likely increases the direct deposition of root residues in the soil, which has important implications for SOM building and soil C storage [26], and a range of other important ecosystem functions.

4.2. Comparing the Performance of Different Bicultures

Along with considering the general effects of mixtures vs. monocultures on biomass and N uptake, it is important to examine the differences in productivity (above- and belowground) between mixtures and the effects of different component species. Among the twenty grass–legume combinations studied, the mixture with two annual species (i.e., oat–vetch) resulted in the highest above and belowground biomass across sites (Figure S1). Oat–vetch mixtures are widely known for forage production and quality across a range of agroecosystems and have been used as an agroecological option similar to the improved fallows of interest here, mainly as short-term cover crops with fallow-type benefits [49,50]. We suspect that the greater oat–vetch performance observed here largely corresponds to their faster growth rate, which is common among annual species. This trait likely translated into an ability to take up nutrients and rapidly invest energy to increase unit leaf area and biomass shortly after emergence and during early growth stages. In contrast, perennial grasses (e.g., Dactylis glomerata, Bromus sp.) tend to invest more energy to form multiple leaf sheaths in preparation for growth over a longer life cycle [51]. While the oat–vetch mixture may seem promising, it is important to note that this finding is partly due to the relatively short duration of this study, and that over time, perennial species would be expected to catch up and provide cover, C inputs, and forage for multiple years, and likely exceed the lifetime productivity of the annuals. Supporting this notion, the findings of Vanek et al. [1] in the same region showed that oat–vetch mixtures in managed fallows may be associated with greater soil C decline relative to perennial mixtures after 3 years of forage-based fallow. They attributed this to reduced root growth and residue return, since mixtures were only planted in the first year of a three-year fallow and plots with vetch and oat mixtures had low productivity in years 2 and 3 of the fallow. Thus, this strategy may need to be improved with the integration/association of perennial species, seeded together with annuals, to maintain growth beyond the first year.
Faced with the need for multi-year improved fallows that can protect the soil surface following the cropping phase of a rotation and beyond, the association of annual and perennial species offers a promising strategy to support high productivity in the first year, with continued above- and belowground biomass production in subsequent years [22]. This is further supported by the idea that perennial species provide a constant input of organic matter over time, thus contributing to soil restoration and the multifunctionality of fallows [52,53]. However, such a mixture would depend on the ability of perennials to compete and fully establish in the first year. While we did not consider more complex mixtures that include both annual and perennial grasses and legumes in this study, our results suggest that the perennial species studied here can effectively compete, and in some cases thrive, in the presence of annuals. This was especially true for perennial grasses growing in mixtures with vetch. For example, we note that most of the perennial grasses combined with vetch had RYTs greater than 1.0 (Figure 3). High RYs (i.e., values > 0.5) were observed for festulolium (1.61), ryegrass (1.43), and orchardgrass (0.80; Figure 4a). At the same time, we note that perennial legumes grown in combination with oats were less successful, and all displayed RYs that were less than 0.5, indicating that they were not able to effectively compete with the annual grass (Figure 4b–d). However, the fact that these perennial legumes were in most cases able to establish and survive in the presence of a fast-growing annual grass indicates promise, since these slower-growing legumes would be released from the intense competition in the second year of growth once the oats are harvested and die.
Given the goal of optimizing the long-term performance of fallows, it is important to consider perennial mixtures that will survive beyond the first year after establishment. The treatments with ryegrass–red clover, festulolium–alfalfa, and brome–black medic all displayed moderately high RYT values and were consistently supported by the relatively higher biomass of the grass species. However, it should be noted that brome–black medic and festulolium–alfalfa had greater variability within treatments and, thus, may have less reliable performance (Figure 3). In addition, brome–black medic, which appears quite promising based on RYT alone (Figure 3), had quite low total monoculture biomass for black medic (0.74 g pot−1; Figure S1; Table 3), thus inflating the RYT value and bringing into question the viability of this mixture. Meanwhile, the ryegrass–red clover mixture achieved one of the highest RYTs for a perennial mixture (Figure 3) and had relatively high overall biomass (Figure S1); this mixture also achieved the highest N content across perennial treatments (0.17 g pot−1). This result suggests that even though red clover seemed to not perform well by itself (Figure 4c), it substantially promoted grass productivity in mixture. Dahlin and Stenberg [54] showed that ≈44% of the ryegrass N was derived from red clover while contributing considerably to forage provision and overall crop rotation productivity [55,56,57]. Improved fallows with the optimal mixtures of perennial species may be a way of reconciling current mixed-agricultural systems (agriculture and livestock) with the ecological benefits provided by traditional practices. However, this needs to be assessed beyond just the early stages of growth considered in this study and include other forage quality analyses (besides N) to better understand their potential contribution as livestock feed and ecological processes over the course of a multi-year fallow.
While the artificial conditions used in this study (i.e., pots) limit our ability to generalize about forage/fallow performance at the field scale, our approach allowed us to assess species-specific root biomass production for species planted under mixed and monoculture conditions, which is typically quite challenging in the field. This approach provided important insights about how roots interact belowground. For example, for the oat–vetch, festulolium–vetch, orchardgrass–vetch, oat–red clover, and ryegrass–red clover (Table S2), the actual belowground biomass of grass components were found to be higher than the corresponding monoculture root biomass. We suspect that this may be associated with the complementarity and facilitation mechanisms discussed above, where interspecific root interactions allow the grass roots to grow better and more fully explore the soil volume for resources [23]. Others have shown that grass (barley) roots grow deeper and enhance their lateral root development when paired with leguminous pea [58]. Generally, we suspect that grasses performed better because of their root architecture; for example, oats, orchardgrass, and festulolium have a dense fibrous root system that might offer a competitive advantage for the proliferation of roots in the soil profile compared to tap-rooted species (e.g., legumes). Our findings along with those from other studies suggest that grasses have intrinsic characteristics that give them greater plasticity in interactions with specific legumes (i.e., capacity of N fixation), giving better possibilities for spatial and temporal exploitation of soil resources, which can allow higher growth rates and subsequently support higher yields. However, this work requires further exploration under field conditions to understand what are the suitable mixtures and mechanisms that contribute to root growth in the Andes and other agroecosystems systems generally.

4.3. Implications for Smallholder Agriculture Systems

We evaluated a wide range of grass–legume forage mixtures based on their RYT and actual productivity. This work included the testing of species that are currently managed and others that are not yet well integrated (e.g., Festulolium, and Vicia dasycarpa) within the complex and fragile Andean agricultural systems. As noted earlier, supporting adequate fallow productivity, both above- and belowground are critical for and range of ecosystem services including C sequestration, improved weed suppression, forage provision, and reduced nutrient loss, among others [59]. This perspective reinforces the idea of designing multifunctional fallow systems that include more than two functional species in the mixture [1,60]. Specifically, we suggest that a successful forage-based fallow in the Andes should integrate not just grasses and legumes but also consider annual and perennial species to optimize interactions between these functional groups for multiple years. In the first stage of the fallow period, vetch and oat may play a significant role, covering the soil and providing early growth, which would result in protection against soil erosion in the often steep and highly vulnerable soils of the Andean region.
Our finding that grass–legume mixtures can enhance root production more than monocultures is significant. The importance of higher root biomass lies with the ability of roots to contribute more to C stabilization than aboveground residues and implications for the restoration of SOM [26]. Increasing SOM through root accumulation would positively affect soil health by improving soil physical conditions and ensuring the availability of various limiting nutrients [22,61,62]. We suspect that integrating a cocktail of species with varied root traits (regarding morphology, residue quality, life cycle) may help to foster these goals of improved soil health and resilience [63] of the multifunctional Andean agroecosystem.

5. Conclusions

The findings from this study show that the association of annual and perennial forage grasses and legumes generally increases shoot and root biomass production, as well as total N uptake relative to the same species planted in monoculture, and that this trend is consistent across two distinct soil types. While the legume present seems to be an important factor in determining RYT, it is noteworthy that the changes in RYT appear to be more driven by the growth of the associated grasses. Annual species tended to be the most productive in the short timeframe considered here, but the establishment of perennials mixed with annual species offers a promising strategy to ensure the continued productivity and multifunctionality of improved fallows beyond the first year; thus, these results were preliminarily used in the field study of forage-based fallows for a period of three years in the same site and region [1]. Species mixtures with perennials are likely to increase the provision of higher quality forage and organic inputs (above and belowground) that will best support the restoration of soil health and overall agroecosystem productivity.

Supplementary Materials

The following supporting information can be downloaded at: https://0-www-mdpi-com.brum.beds.ac.uk/article/10.3390/agronomy12010142/s1, Figure S1: Mean total biomass production by treatment averaged across soil types. Error bars present the standard error of the mean and correspond to the original data (without transformation), Table S1: Relative Yield Total (RYT) for bicultures based on total biomass, roots, and shoots. ANOVA results for each major factor (grasses, legume, and soil) with their corresponding interactions are presented at the bottom, with significant values in bold (p-value < 0.05). Mean LER values are presented with their corresponding standard errors (SE) to the right of each mean. and Table S2: Root and shoot biomass of separate grass and legume components in each treatment.

Author Contributions

K.M.: Investigation, Formal analysis, Data curation, Writing—Original draft preparation, and Visualization. S.J.V.: Investigation, Formal analysis, Writing—review and editing, Project administration, and Funding acquisition. M.S.: Investigation and Writing—review and editing. E.O.: Investigation and Conceptualization. R.C.: Investigation and Conceptualization. Y.S.: Investigation and Data curation. S.J.F.: Investigation, Conceptualization, Formal analysis, Writing—review and editing, Visualization, Project administration, and Funding acquisition. All authors have read and agreed to the published version of the manuscript.

Funding

This research was funded by the McKnight Foundation’s Collaborative Crop Research Program (Grants 13-305 and 16-095).

Institutional Review Board Statement

Not applicable.

Informed Consent Statement

Not applicable.

Data Availability Statement

Data is available upon request.

Acknowledgments

We would like to thank students from the Universidad del Centro del Peru and Universidad Nacional de Huancavelica for their participation in data collection, and Dionisio Barrientos and Cecinio Cripin for their work and commitment during the whole experiment. We also thank Meagan Schipanski and Jessica Davis for their comments and suggestions of an earlier version of this manuscript, as well as Ann Hess for advice on the statistical analyses. Additionally, we thank the anonymous reviewers who provide helpful comments to improve our manuscript. Lastly, we thank the Andean communities and farmers for their inspiration and collaboration with the development of this project.

Conflicts of Interest

The authors declare no conflict of interest. The founder had no role in the design of the study; in the collection, analyses, or interpretation of data; in the writing of the manuscript, or in the decision to publish the results.

References

  1. Vanek, S.J.; Meza, K.; Ccanto, R.; Olivera, E.; Scurrah, M.; Fonte, S.J. Participatory design of improved forage/fallow options across soil gradients with farmers of the Central Peruvian Andes. Agric. Ecosyst. Environ. 2020, 300, 106933. [Google Scholar] [CrossRef]
  2. Rolando, J.L.; Dubeux, J.C.B.; Ramirez, D.A.; Ruiz-Moreno, M.; Turin, C.; Mares, V.; Lynn, E.; Sollenberger; Quiroz, R. Land Use effects on soil fertility and nutrient cycling in the Peruvian High-Andean puna grasslands. Soil Sci. Soc. Am. J. 2018, 82, 463–474. [Google Scholar] [CrossRef]
  3. Pestalozzi, H. Sectoral fallow systems and the management of soil fertility: The rationality of indigenous knowledge in the High Andes of Bolivia. Mt. Res. Dev. 2000, 20, 64–71. [Google Scholar] [CrossRef] [Green Version]
  4. Abadín, J.; González-Prieto, S.J.; Sarmiento, L.; Villar, M.C.; Carballas, T. Successional dynamics of soil characteristics in a long fallow agricultural system of the high tropical Andes. Soil Biol. Biochem. 2002, 34, 1739–1748. [Google Scholar] [CrossRef] [Green Version]
  5. Sarmiento, L. Water balance and soil loss under long fallow agriculture in the Venezuelan Andes. Mt. Res. Dev. 2000, 20, 246–253. [Google Scholar] [CrossRef] [Green Version]
  6. Fonte, S.J.; Vanek, S.J.; Oyarzun, P.; Parsa, S.; Quintero, D.C.; Rao, I.M.; Lavelle, P. Pathways to Agroecological Intensification of Soil Fertility Management by Smallholder Farmers in the Andean Highlands; Elsevier Inc.: Amsterdam, The Netherlands, 2012; p. 116. [Google Scholar] [CrossRef]
  7. Sanchez, P.A. Improved fallows come of age in the tropics. Agrofor. Syst. 1999, 47, 3–12. [Google Scholar] [CrossRef]
  8. Nyamadzawo, G.; Chikowo, R.; Nyamugafata, P.; Nyamangara, J.; Giller, K.E. Soil organic carbon dynamics of improved fallow-maize rotation systems under conventional and no-tillage in Central Zimbabwe. Nutr. Cycl. Agroecosyst. 2008, 81, 85–93. [Google Scholar] [CrossRef]
  9. Qingjie, W.; Hao, C.; Hongwen, L.; Wenying, L.; Xiaoyan, W.; McHugh, A.D.; He, J.; Huanwen, G. Controlled traffic farming with no tillage for improved fallow water storage and crop yield on the Chinese Loess Plateau. Soil Tillage Res. 2009, 104, 192–197. [Google Scholar] [CrossRef]
  10. Wezel, A.; Soboksa, G.; McClelland, S.; Delespesse, F.; Boissau, A. The blurred boundaries of ecological, sustainable, and agroecological intensification: A review. Agron. Sustain. Dev. 2015, 35, 1283–1295. [Google Scholar] [CrossRef]
  11. Sarmiento, L.; Abadín, J.; González-Prieto, S.; Carballas, T. Assessing and modeling the role of the native legume Lupinus meridanus in fertility restoration in a heterogeneous mountain environment of the tropical Andes. Agric. Ecosyst. Environ. 2012, 159, 29–39. [Google Scholar] [CrossRef]
  12. Sarmiento, L.; Llambí, L.D.; Escalona, A.; Marquez, N. Vegetation patterns, regeneration rates and divergence in an old-field succession of the high tropical Andes. Plant Ecol. 2003, 166, 145–156. [Google Scholar] [CrossRef]
  13. de Valença, A.W.; Vanek, S.J.; Meza, K.; Ccanto, R.; Olivera, E.; Scurrah, M.; Lantinga, E.A.; Fonte, S.J. Land use as a driver of soil fertility and biodiversity across an agricultural landscape in the Central Peruvian Andes. Ecol. Appl. 2017, 27, 1138–1154. [Google Scholar] [CrossRef] [PubMed]
  14. Manning, P.; Van Der Plas, F.; Soliveres, S.; Allan, E.; Maestre, F.T.; Mace, G.; Whittingham, M.J.; Fischer, M. Redefining ecosystem multifunctionality. Nat. Ecol. Evol. 2018, 2, 427–436. [Google Scholar] [CrossRef] [PubMed]
  15. Cabel, J.F.; Oelofse, M. An indicator framework for assessing agroecosystem resilience. Ecol. Soc. 2012, 17. [Google Scholar] [CrossRef]
  16. Vandermeer, J.H. The Ecology of Intercropping; Cambridge University Press: Cambridge, UK, 1989. [Google Scholar]
  17. Kahmen, A.; Renker, C.; Unsicker, S.B.; Buchmann, N. Niche complementarity for nitrogen: An explanation for the biodiversity and ecosystem functioning relationship? Ecology 2006, 87, 1244–1255. [Google Scholar] [CrossRef]
  18. Brooker, R.W.; Bennett, A.E.; Cong, W.F.; Daniell, T.J.; George, T.S.; Hallett, P.D.; White, W.J.; Hawes, C. Improving intercropping: A synthesis of research in agronomy, plant physiology and ecology. New Phytologist. 2015, 206, 107–117. [Google Scholar] [CrossRef]
  19. Blesh, J. Functional traits in cover crop mixtures: Biological nitrogen fixation and multifunctionality. J. Appl. Ecol. 2017, 55, 38–48. [Google Scholar] [CrossRef] [Green Version]
  20. Isbell, F.; Adler, P.R.; Eisenhauer, N.; Fornara, D.; Kimmel, K.; Kremen, C.; Letourneau, D.K.; Liebman, M.; Polley, H.W.; Quijas, S.; et al. Benefits of increasing plant diversity in sustainable agroecosystems. J. Ecol. 2017, 105, 871–879. [Google Scholar] [CrossRef] [Green Version]
  21. Schipanski, M.E.; Drinkwater, L.E. Nitrogen fixation in annual and perennial legume-grass mixtures across a fertility gradient. Plant Soil. 2012, 357, 147–159. [Google Scholar] [CrossRef]
  22. Wick, A.; Berti, M.; Lawley, Y.; Liebig, M. Integration of Annual and Perennial Cover Crops for Improving Soil Health; Elsevier Inc.: Amsterdam, The Netherlands, 2017. [Google Scholar] [CrossRef]
  23. Li, L.; Zhang, L.; Zhang, F. Crop Mixtures and the Mechanisms of Overyielding. Encycl. Biodivers. 2013, 2, 382–395. [Google Scholar] [CrossRef]
  24. Fornara, D.A.; Tilman, D. Plant functional composition influences rates of soil carbon and nitrogen accumulation. J. Ecol. 2008, 96, 314–322. [Google Scholar] [CrossRef]
  25. Marshall, A.H.; Collins, R.P.; Humphreys, M.W.; Scullion, J. A new emphasis on root traits for perennial grass and legume varieties with environmental and ecological benefits. Food Energy Secur. 2016, 5, 26–39. [Google Scholar] [CrossRef] [Green Version]
  26. Rasse, D.P.; Rumpel, C.; Dignac, M.F. Is soil carbon mostly root carbon? Mechanisms for a specific stabilisation. Plant Soil 2005, 269, 341–356. [Google Scholar] [CrossRef]
  27. Schmidt, M.W.I.; Torn, M.S.; Abiven, S.; Dittmar, T.; Guggenberger, G.; Janssens, I.A.; Trumbore, S.E. Persistence of soil organic matter as an ecosystem property. Nature 2011, 478, 49–56. [Google Scholar] [CrossRef] [PubMed] [Green Version]
  28. DeHaan, L.R.; Weisberg, S.; Tilman, D.; Fornara, D. Agricultural and biofuel implications of a species diversity experiment with native perennial grassland plants. Agric. Ecosyst. Environ. 2010, 137, 33–38. [Google Scholar] [CrossRef]
  29. García, S. Evaluating the Resource Management Strategies of the Agro-Ecosystems in Farm Communities of the Mantaro Valley, Central Andes of Peru. Ph.D. Dissertation, Katholieke Universiteit Lueven, Lueven, Belgium, 2011. [Google Scholar]
  30. Acker, J.; Leptoukh, G. Online Analysis Enhances Use of NASA Earth Science Data. Eos Trans. Am. Geophys. Union 2007, 88, 14–17. Available online: https://giovanni.gsfc.nasa.gov/giovanni/ (accessed on 21 November 2021). [CrossRef]
  31. Bouyoucos, G.J. Hydrometer Method Improved for Making Particle Size Analyses of Soils 1. Agron. J. 1962, 54, 464–465. [Google Scholar] [CrossRef]
  32. Weil, R.R.; Islam, K.R.; Stine, M.A.; Gruver, J.B.; Samson-Liebig, S.E. Estimating active carbon for soil quality assessment: A simplified method for laboratory and field use. Am. J. Altern. Agric. 2003, 18, 3–17. [Google Scholar] [CrossRef]
  33. R Core Team. R: A Language and Environment for Statistical Computing; R Core Team: Vienna, Australia, 2021. [Google Scholar]
  34. Bates, D.; Mächler, M.; Bolker, B.M.; Walker, S.C. Fitting linear mixed-effects models using lme4. J. Stat. Softw. 2015, 67. [Google Scholar] [CrossRef]
  35. Kuznetsova, A.; Brockhoff, P.B.; Christensen, R.H.B. lmerTest Package: Tests in Linear Mixed Effects Models. J. Stat. Softw. 2017, 82. [Google Scholar] [CrossRef] [Green Version]
  36. Lenth, R.; Singmann, H.; Love, J.; Buerkner, P.; Herve, M. Estimated Marginal Means, Aka Least-Squares Means. R Package Version 2019, 1.3. 2. Available online: https://cran.r-project.org/web/packages/emmeans/index.html (accessed on 6 December 2021).
  37. Yu, Y.; Stomph, T.J.; Makowski, D.; Van der Werf, W. Temporal niche differentiation increases the land equivalent ratio of annual intercrops: A meta-analysis. Field Crop. Res. 2015, 184, 133–144. [Google Scholar] [CrossRef]
  38. Cardinale, B.J.; Wright, J.P.; Cadotte, M.W.; Carroll, I.T.; Hector, A.; Srivastava, D.S.; Loreau, M.; Weis, J.J. Impacts of plant diversity on biomass production increase through time because of species complementarity. Proc. Natl. Acad. Sci. USA 2007, 104, 18123–18128. [Google Scholar] [CrossRef] [Green Version]
  39. Tilman, D.; Isbell, F.; Cowles, J.M. Biodiversity and ecosystem functioning. Annu. Rev. Ecol. Evol. Syst. 2014, 45, 471–493. [Google Scholar] [CrossRef]
  40. Ren, W.; Hu, L.; Zhang, J.; Sun, C.; Tang, J.; Yuan, Y.; Chen, X. Can positive interactions between cultivated species help to sustain modern agriculture? Front. Ecol. Environ. 2014, 12, 507–514. [Google Scholar] [CrossRef]
  41. Hooper, D.U.; Dukes, J.S. Overyielding among plant functional groups in a long-term experiment. Ecol. Lett. 2004, 7, 95–105. [Google Scholar] [CrossRef]
  42. Fornara, D.A.; Tilman, D. Ecological mechanisms associated with the positive diversity-productivity relationship in an N-limited grassland. Ecology 2009, 90, 408–418. [Google Scholar] [CrossRef] [PubMed]
  43. Faucon, M.P.; Houben, D.; Lambers, H. Plant Functional Traits: Soil and Ecosystem Services. Trends Plant Sci. 2017, 22, 385–394. [Google Scholar] [CrossRef] [PubMed]
  44. Sainju, U.M.; Singh, B.P.; Whitehead, W.F. Tillage, cover crops, and nitrogen fertilization effects on cotton and sorghum root biomass, carbon, and nitrogen. Agron. J. 2005, 97, 1279–1290. [Google Scholar] [CrossRef] [Green Version]
  45. Nyfeler, D.; Huguenin-Elie, O.; Suter, M.; Frossard, E.; Lüscher, A. Grass-legume mixtures can yield more nitrogen than legume pure stands due to mutual stimulation of nitrogen uptake from symbiotic and non-symbiotic sources. Agric. Ecosyst. Environ. 2011, 140, 155–163. [Google Scholar] [CrossRef]
  46. Eaglesham, A.R.J.; Ayanaba, A.; Rao, V.R.; Eskew, D.L. Improving the nitrogen nutrition of maize by intercropping with cowpea. Soil Biol. Biochem. 1981, 13, 169–171. [Google Scholar] [CrossRef]
  47. Ma, Z.; Chen, H.Y.H. Effects of species diversity on fine root productivity in diverse ecosystems: A global meta-analysis. Glob. Ecol. Biogeogr. 2016, 25, 1387–1396. [Google Scholar] [CrossRef]
  48. Mueller, K.E.; Tilman, D.; Fornara, D.A.; Hobbie, S.E. Root depth distribution and the diversity-productivity relationship in a long-term grassland experiment. Ecology 2013, 94, 787–793. [Google Scholar] [CrossRef] [Green Version]
  49. Dhima, K.V.; Lithourgidis, A.S.; Vasilakoglou, I.B.; Dordas, C.A. Competition indices of common vetch and cereal intercrops in two seeding ratio. Field Crop. Res. 2007, 100, 249–256. [Google Scholar] [CrossRef]
  50. Finney, D.M.; Kaye, J.P. Functional diversity in cover crop polycultures increases multifunctionality of an agricultural system. J. Appl. Ecol. 2017, 54, 509–517. [Google Scholar] [CrossRef]
  51. Garnier, E. Growth Analysis of Congeneric Annual and Perennial Grass Species. J. Ecol. 1992, 80, 665–675. [Google Scholar] [CrossRef]
  52. Franzluebbers, A.J. Farming strategies to fuel bioenergy demands and facilitate essential soil services. Geoderma 2015, 259, 251–258. [Google Scholar] [CrossRef]
  53. King, A.J.; Blesh, J. Crop rotations for increased soil carbon: Perenniality as a guiding principle. Ecol. Appl. 2018, 28, 249–261. [Google Scholar] [CrossRef]
  54. Dahlin, A.S.; Stenberg, M. Transfer of N from red clover to perennial ryegrass in mixed stands under different cutting strategies. Eur. J. Agron. 2010, 33, 149–156. [Google Scholar] [CrossRef]
  55. Entz, M.H.; Baron, V.S.; Carr, P.M.; Meyer, D.W.; Smith, S.R.; McCaughey, W.P. Potential of forages to diversify cropping systems in the northern Great Plains. Agron. J. 2002, 94, 240–250. [Google Scholar] [CrossRef]
  56. Thilakarathna, M.S.; Papadopoulos, Y.A.; Rodd, A.V.; Grimmett, M.; Fillmor, S.A.E.; Crouse, M.; Prithiviraj, B. Nitrogen fixation and transfer of red clover genotypes under legume–grass forage-based production systems. Nutr. Cycl. Agroecosyst. 2016, 106, 233–247. [Google Scholar] [CrossRef]
  57. Yuan, Z.Q.; Yu, K.L.; Guan, X.; Fang, C.; Li, M.; Sh, X.Y.; Li, F. Medicago sativa improves soil carbon sequestration following revegetation of degraded arable land in a semi-arid environment on the Loess Plateau, China. Agric. Ecosyst. Environ. 2016, 232, 93–100. [Google Scholar] [CrossRef]
  58. Hauggaard-Nielsen, H.; Jensen, E.S. Evaluating pea and barley cultivars for complementarity in intercropping at different levels of soil N availability. Field Crop. Res. 2001, 72, 185–196. [Google Scholar] [CrossRef]
  59. Schipanski, M.E.; Barbercheck, M.; Douglas, M.R.; Finney, D.M.; Haider, K.; Kaye, J.P.; White, C. A framework for evaluating ecosystem services provided by cover crops in agroecosystems. Agric. Syst. 2014, 125, 12–22. [Google Scholar] [CrossRef]
  60. Sanderson, M.A.; Skinner, R.H.; Barker, D.J.; Edwards, G.R.; Tracy, B.F.; Wedin, D.A. Plant species diversity and management of temperate forage and grazing land ecosystems. Crop Sci. 2004, 44, 1132–1144. [Google Scholar] [CrossRef]
  61. Christopher, S.F.; Lal, R. Nitrogen management affects carbon sequestration in North American cropland soils. Crit. Rev. Plant Sci. 2007, 26, 45–64. [Google Scholar] [CrossRef]
  62. Gould, I.J.; Quinton, J.N.; Weigelt, A.; De Deyn, G.B.; Bardgett, R.D. Plant diversity and root traits benefit physical properties key to soil function in grasslands. Ecol. Lett. 2016, 19, 1140–1149. [Google Scholar] [CrossRef]
  63. McCormack, M.L.; Dickie, I.A.; Eissenstat, D.M.; Fahey, T.J.; Fernandez, C.W.; Guo, D.; Zadworny, M. Redefining fine roots improves understanding of below-ground contributions to terrestrial biosphere processes. New Phytologist. 2015, 207, 505–518. [Google Scholar] [CrossRef]
Figure 1. Mean performance metrics for all bicultures vs. monocultures (averaged across treatments) and presented separately for each soil type. Panels refer to: (a) Total biomass, (b) Shoot Biomass, (c) Root Biomass, and (d) Total N uptake. Means and the standard errors correspond to the original data (without transformation).
Agronomy 12 00142 g001
Figure 2. Mean performance metrics of just perennial bicultures vs. monocultures (averaged across treatments with annual species excluded) and presented separately for each soil type. Panels refer to: (a) Total biomass production, (b) Shoot biomass, (c) Root biomass, and (d) Total N uptake. Means and standard errors correspond to the original data (without transformation).
Agronomy 12 00142 g002
Figure 3. Relative Yield Total (RYT) for different grass–legume biculture treatments, corresponding to the total biomass and averaged across soil types. Errors bars represent 95% of the confidence interval for the estimated averages, and the values greater than 1.0 indicate bicultures that are more productive than the monocultures of their component species.
Agronomy 12 00142 g003
Figure 4. Relative Yield Total (RYT) for each component for above-and belowground biomass production of mixtures with the four legumes ((a) Vetch, (b) Black medic, (c) Red clover, and (d) Alfalfa). The light gray box above the “0” line corresponds to the RY of the legume shoot and the dark one corresponds to the grass shoot; likewise, the light gray box below the “0” line corresponds to the legume root and the darker one corresponds to the grass root. The bars represent the 95% confidence interval for the estimated means correspond to the RYT values, noting that all values greater than the overyielding threshold (1.0) correspond to an effective mixture in relation to the monoculture.
Agronomy 12 00142 g004
Table 1. Physical and chemical properties of soils used in pot experiment. Soils were collected from two localities in Peru (Castillapata, Huancavelica Region and Quilcas, Junín Region).
VariableQuilcasCastillapata
Sand (%)4163
Silt (%)3028
Clay (%)299
Texture classClay LoamSandy Loam
N (g kg−1)1.35.1
Avail. P (mg kg−1)1431
Active C (mg kg−1)683.61229.0
OM (g kg−1)20.680.6
K+ (meq 100 g−1)0.220.146
Ca+2 (meq 100 g−1)2.316.29
Mg+2 (meq 100 g−1)0.5520.199
pH5.645.89
Based on results of soil baseline analysis (Soil and Plant Nutrition Lab at La Molina University—Lima, Peru). Texture [31]; total soil nitrogen (N) (Kjeldahl method); plant available phosphorus (P) (Olsen extraction); active carbon (POXC) [32]; and exchangeable potassium (K+) calcium (Ca2+) and magnesium (Mg2+) (ammonium acetate extraction), and pH (1:1 water:soil) (Estefan et al., (2013) Methods of soil, plant and water analysis, a manual for the West Asia and North African region. International Centre for Agricultural Research in the Dry Areas (ICARDA), Beirut, Lebanon).
Table 2. Seeding rate for grass–legume bicultures and monocultures planted in November 2014 as well as the number of successful repetitions considered for statistical analyses in each treatment.
GrassesLegumes aGrasses
(No. Seeds Pot−1)
Legumes
(No. Seeds Pot−1)
Quilcas (N)Castillapata (N)
OATSVETCH1244
RYEGVETCH2244
FELOVETCH3244
BROMVETCH3243
ORCHVETCH3234
OATSREDC1243
RYEGREDC2233
FELOREDC3233
BROMREDC3243
ORCHREDC3234
OATSMELU1214
RYEGMELU2223
FELOMELU3234
BROMMELU3233
ORCHMELU3234
OATSALFA1344
RYEGALFA2343
FELOALFA3333
BROMALFA3344
ORCHALFA3324
OATS 2 44
RYEG 4 44
FELO 6 44
BROM 6 34
ORCH 6 44
VETCH 444
REDC 444
MELU 444
ALFA 644
a OATS = oats (Avena sativa; cv. Mantaro 15M), RYEG = ryegrass (Lolium multiflorum; cv. Tama), FELO = Festulolium (Lolium × Festuca genera), BROM = brome grass (Bromus catharticus), ORCH = orchardgrass (Dactylis glomerata), VETCH = vetch (Vicia dasycarpa), REDC = red clover (Trifolium pratense), MELU = black medic (Medicago lupulina), ALFA = alfalfa (Medicago sativa; cv. Ranger).
Table 3. Total biomass and total N content (dry weight basis) of grass–legume bicultures and monocultures grown in two soil types (see Table 1). The ANOVA results for each main factor and their respective interaction are presented at the bottom of the table, with significant values (p < 0.05) in bold. Means and standard errors (SE) correspond to the original data (without transformation), while p-values are based on transformed data.
Treatments aTotal Biomass (g Pot−1)Total N (g Pot−1)
QuilcasCastillapataQuilcasCastillapata
MeanSEMeanSEMeanSEMeanSE
OATS/VETCH28.333.8013.011.790.400.120.220.01
RYEG/VETCH15.581.4113.453.220.160.010.200.04
FELO/VETCH19.303.1114.182.780.400.080.220.05
BROM/VETCH14.421.337.363.880.380.020.170.08
ORCH/VETCH17.151.228.811.140.320.070.230.03
OATS/REDC29.762.478.023.450.250.020.090.03
RYEG/REDC19.795.137.981.310.260.110.080.00
FELO/REDC9.701.823.150.560.170.030.040.01
BROM/REDC7.141.650.840.140.110.030.020.00
ORCH/REDC7.062.901.960.790.110.030.030.01
OATS/MELU21.14N/A6.142.050.15N/A0.050.01
RYEG/MELU15.173.384.260.750.160.050.050.01
FELO/MELU10.742.085.791.660.130.020.060.01
BROM/MELU7.612.031.870.230.110.020.030.01
ORCH/MELU8.941.491.910.190.130.010.030.01
OATS/ALFA25.097.908.251.150.240.060.060.01
RYEG/ALFA15.983.904.941.010.170.030.050.01
FELO/ALFA9.014.335.801.140.160.080.050.01
BROM/ALFA6.190.831.110.390.150.060.020.01
ORCH/ALFA5.614.251.700.250.070.050.020.00
OATS18.074.296.391.640.210.040.060.01
RYEG15.092.936.132.180.150.030.060.02
FELO14.903.913.810.980.350.140.030.01
BROM9.411.091.140.410.130.020.020.01
ORCH7.321.332.180.660.130.030.030.01
VETCH10.543.229.470.520.320.100.290.02
REDC2.970.891.220.500.100.030.040.02
MELU0.920.530.560.330.030.010.020.01
ALFA1.800.981.030.920.040.020.030.03
All treatments b
Treatments<0.001 <0.001
Soil<0.001 <0.001
Soil × Treatment0.103 0.191
Contrast:
Biculture vs. Monoculture<0.001 <0.001
Perennialsc
Treatments<0.001 <0.001
Soil<0.001 <0.001
Soil × Treatment0.264 0.356
Contrast:
Biculture vs. Monoculture<0.001 <0.001
a OATS = oats (Avena sativa; cv. Mantaro 15M), RYEG = ryegrass (Lolium multiflorum; cv. Tama), FELO = Festulolium (Lolium × Festuca genera), BROM = brome grass (Bromus catharticus), ORCH = orchardgrass (Dactylis glomerata), VETCH = vetch (Vicia dasycarpa), REDC = red clover (Trifolium pratense), MELU = black medic (Medicago lupulina), ALFA = alfalfa (Medicago sativa; cv. Ranger). b p-values based on treatments involving all species, whether annular/perennial (grasses and legume). c p-values based on treatments for perennial species only (grasses and legume).
Table 4. Production of total roots and shoot biomass by treatment and soil type. The ANOVA results for each main factor and their respective interaction are presented at the bottom with significant values in bold (p < 0.05). Means and standard error (SE) correspond to the original data (without transformation), while p-values are based on the transformed data.
Treatments aRoot Dry Biomass (g Pot−1)Shoot Dry Biomass (g Pot−1)
QuilcasCastillapataQuilcasCastillapata
MeanSEMeanSEMeanSEMeanSE
OATS/VETCH4.671.361.400.2123.663.1811.611.59
RYEG/VETCH4.880.783.520.7610.700.719.932.51
FELO/VETCH3.050.842.790.5816.243.5411.392.89
BROM/VETCH1.000.100.670.2813.421.266.693.60
ORCH/VETCH4.850.721.150.3012.300.537.661.09
OATS/REDC4.780.630.860.2824.982.127.163.17
RYEG/REDC7.071.342.250.2812.723.805.731.36
FELO/REDC3.530.551.100.206.171.272.050.42
BROM/REDC1.400.370.220.035.741.330.620.12
ORCH/REDC2.691.150.820.394.361.771.140.43
OATS/MELU5.83N/A0.780.2515.31N/A5.361.91
RYEG/MELU4.620.231.520.3210.553.152.740.48
FELO/MELU2.380.581.640.468.361.984.141.21
BROM/MELU1.180.330.300.096.431.711.570.15
ORCH/MELU3.181.060.660.055.760.441.240.17
OATS/ALFA3.551.201.040.2521.546.727.210.92
RYEG/ALFA4.611.171.860.4411.372.763.080.58
FELO/ALFA3.081.532.120.105.932.823.681.06
BROM/ALFA1.070.230.290.125.110.640.820.28
ORCH/ALFA1.781.330.760.123.832.920.950.14
OATS2.290.680.740.2815.793.635.651.36
RYEG6.081.362.240.829.011.583.891.36
FELO4.801.131.480.3910.12.872.330.68
BROM1.350.180.220.078.061.270.920.35
ORCH2.880.640.850.334.440.831.330.35
VETCH0.740.110.830.209.803.138.630.44
REDC0.950.300.500.222.020.640.720.28
MELU0.200.080.080.030.730.460.490.3
ALFA0.640.390.140.111.170.590.890.81
All treatments b
Treatments<0.001 <0.001
Soil<0.001 <0.001
Soil × Treatment0.018 0.120
Contrast:
Biculture vs. monoculture<0.001 <0.001
Perennials c
Treatments<0.001 <0.0001
Soil<0.001 <0.0001
Soil × Treatment0.353 0.162
Contrast:
Biculture vs. monoculture<0.001 <0001
a OATS = oats (Avena sativa; cv. Mantaro 15M), RYEG = ryegrass (Lolium multiflorum; cv. Tama), FELO = Festulolium (Lolium × Festuca genera), BROM = brome grass (Bromus catharticus), ORCH = orchardgrass (Dactylis glomerata), VETCH = vetch (Vicia dasycarpa), REDC = red clover (Trifolium pratense), MELU = black medic (Medicago lupulina), ALFA = alfalfa (Medicago sativa; cv. Ranger). b p-values based on treatments involving all species, whether annular/perennial (grasses and legume). c p-values based on treatments for perennial species only (grasses and legume).
Publisher’s Note: MDPI stays neutral with regard to jurisdictional claims in published maps and institutional affiliations.

