Article

Adaptation Potential of Current Wheat Cultivars and Planting Dates under the Changing Climate in Ethiopia

Institute of Environment and Sustainable Development in Agriculture, Chinese Academy of Agricultural Sciences, Beijing 100081, China
*
Author to whom correspondence should be addressed.
Submission received: 1 November 2021 / Revised: 14 December 2021 / Accepted: 21 December 2021 / Published: 24 December 2021
(This article belongs to the Special Issue Adaptations to Climate Change in Agricultural Systems)

Abstract

:
Global warming poses a severe threat to food security in developing countries. In Ethiopia, the primary driver of low wheat productivity is attributed to climate change. Due to the sparsity of observation data, climate-related impact analysis is poorly understood, and the adaptation strategies studied so far have also been insufficient. This study adopted the most popular DSSAT CERES-Wheat model and the ensemble mean of four GCMs to examine the quantitative effects of adjusted sowing dates and varieties on wheat yield. The two new cultivars (Dandaa and Kakaba), with reference to an old cultivar (Digelu), were considered for the mid-century (2036–2065) and late-century (2066–2095) under RCP 4.5 and RCP 8.5 climate scenarios. The results showed that the Dandaa cultivar demonstrates better adaptation potential at late sowing with a yield increase of about 140 kg/ha to 148 kg/ha for the mid- and late-century under RCP4.5. However, under RCP 8.5, Kakaba demonstrates higher adaptation potential with a yield gain for early sowing of up to 142 kg/ha and 170 kg/ha during the mid- and late-century, respectively. Late sowing of the Dandaa cultivar is recommended if GHG emissions are cut off at least to the average scenario, while the Kakaba cultivar is the best option when the emissions are high. The adaptation measures assessed in this study could help to enhance wheat production and adaptability of wheat to the future climate.

1. Introduction

The ongoing global warming has serious repercussions for major crop production systems. Global mean surface temperatures rose by an average of 1.09 °C from 2011 to 2020 relative to the average over the 1850–1900 period [1]. The rising hot temperatures accelerate crop growth, leading to advanced phenology of wheat [2]. From 1981 to 2014, the length of the wheat growing season, and vegetative and reproductive periods shortened at the rate of from −0.08 to −0.36 days/year, due to increasing changes in the mean temperature globally [3]. The day of heading had shifted earlier by 4.1 days per decade from 1972 to 2013 across the globe [4]. This has resulted in a decline of global wheat production by 5.7% [5]. Each 1 °C rise in mean temperature resulted in a dramatic fall in wheat yield by 6% [6,7]. According to a recent report by [8], global wheat yield is declining by −0.9% (−5.0 million tons) annually as temperatures rise above critical physiological levels in both temperate and tropical regions [9].
Africa is the hottest continent in the world, with low temperature variability [10,11]. Wheat yields declined by 2.3% from the 1970s to the 2000s in Africa [8], particularly in Egypt, where unusual temperatures caused wheat yield to largely dwindle by 17.6% [12]. In 2013, total wheat consumption in Sub-Saharan Africa reached 25 million tons, while the region produced only 7.3 million tons in the same year [13]. Many parts of the continent had to import wheat to feed the citizenry. More critically, it is estimated that the wheat production deficit could hit 48.3 million metric tons (MMT) by 2025 in Africa [13]. This is attributed to the alarming rising hot temperatures and the generally low adaptive capacity on the continent.
The vulnerability of wheat production to climate change is visible in Ethiopia; the country is ranked the second largest wheat producer in Africa after South Africa [14], yet imports approximately 1.8 MMT of wheat per year [15], as demand outstrips supply [16]. Most critically, [17] recently estimated that wheat production could further decline in Ethiopia by 15.6% and 27.0% by the 2050s and the 2080s, respectively, under RCP4.5. Adaptation actions, therefore, need to be scaled up to ensure food security. This is particularly important because wheat is one of the most important cereal crops in Ethiopia, eaten by the majority of the population and often referred to as a “food security crop” [18]. However, very limited work has been done on adaptation, as most studies rather focus on “impacts” instead of “actions”. Wheat production in Ethiopia is mainly rain-fed [19]; the high exposure, coupled with the low adaptive capacity due to poverty, lack of access to technology such as irrigation, improved seed, inadequate infrastructure, lack of information, land, and credit services [20,21] play complementary roles in amplifying the vulnerability. Scientific research provides the most effective and sustainable adaptation actions as Africa continues to warm.
Adaptation research done by [22], using DSSAT-CSM v.4.6, developed by DSSAT Foundation Team, Florida, USA to investigate the adaptation strategies on the productivity of wheat in Ethiopia, reported that improved nitrogen fertilizer application in combination with increased CO2 could improve wheat yield in Ethiopia under stable rainfall conditions. The study found that a yield increment of 16–21% could be attained if 160 kg/ha nitrogen fertilizer is applied. Moreover, increased use of farm inputs, herbicides and fertilizers, and using a new wheat variety increased wheat production up to 55% [23]. Other research focused on improving the resistance of the crop variety against climate shocks. For example, a qualitative study done by [24] reported that adopting improved wheat varieties increased the probability of food security, per capita food consumption, and food surplus status in Ethiopia. Adopters of improved wheat varieties raised wheat yield by about from 1 to 1.1 t ha−1, resulting in an average income of from 35 to 50% higher than those who relied on old cultivars [18].
Developing specific adaptation strategies helps to offset the negative impacts of climate shocks and to take advantage of the opportunities from positive impacts [25], and to enhance productivity and livelihood [26,27]. For example, according to [28], adaptation gain varies according to the crop type, region, and change in temperature; however, it enhances yield up to 10% on average, compared with the crops without adaptation. Studies on adaptation in Ethiopia are not adequate [29]. Moreover, most studies on climate change impact assessment on wheat production lack the adaptation aspect [17,30]. The most pressing climate change shock observed in Ethiopia is drought. This extreme climatic event is projected to increase in the future [31,32], yet clear ideas on how to adapt wheat crop production are very limited.
Thus, this study aimed to dissect and examine the most prolific wheat cultivars and the most appropriate sowing dates for wheat production over the Kulumsa area, using the DSSAT CERES-Wheat model and the multi-model ensemble of GCMs from the MarkSim weather generator tool. This could guide local farmers and stakeholders to increase wheat production in the face of climate change. Specifically, this study aimed to examine the potential climate in the wheat growing season for the future.

2. Materials and Methods
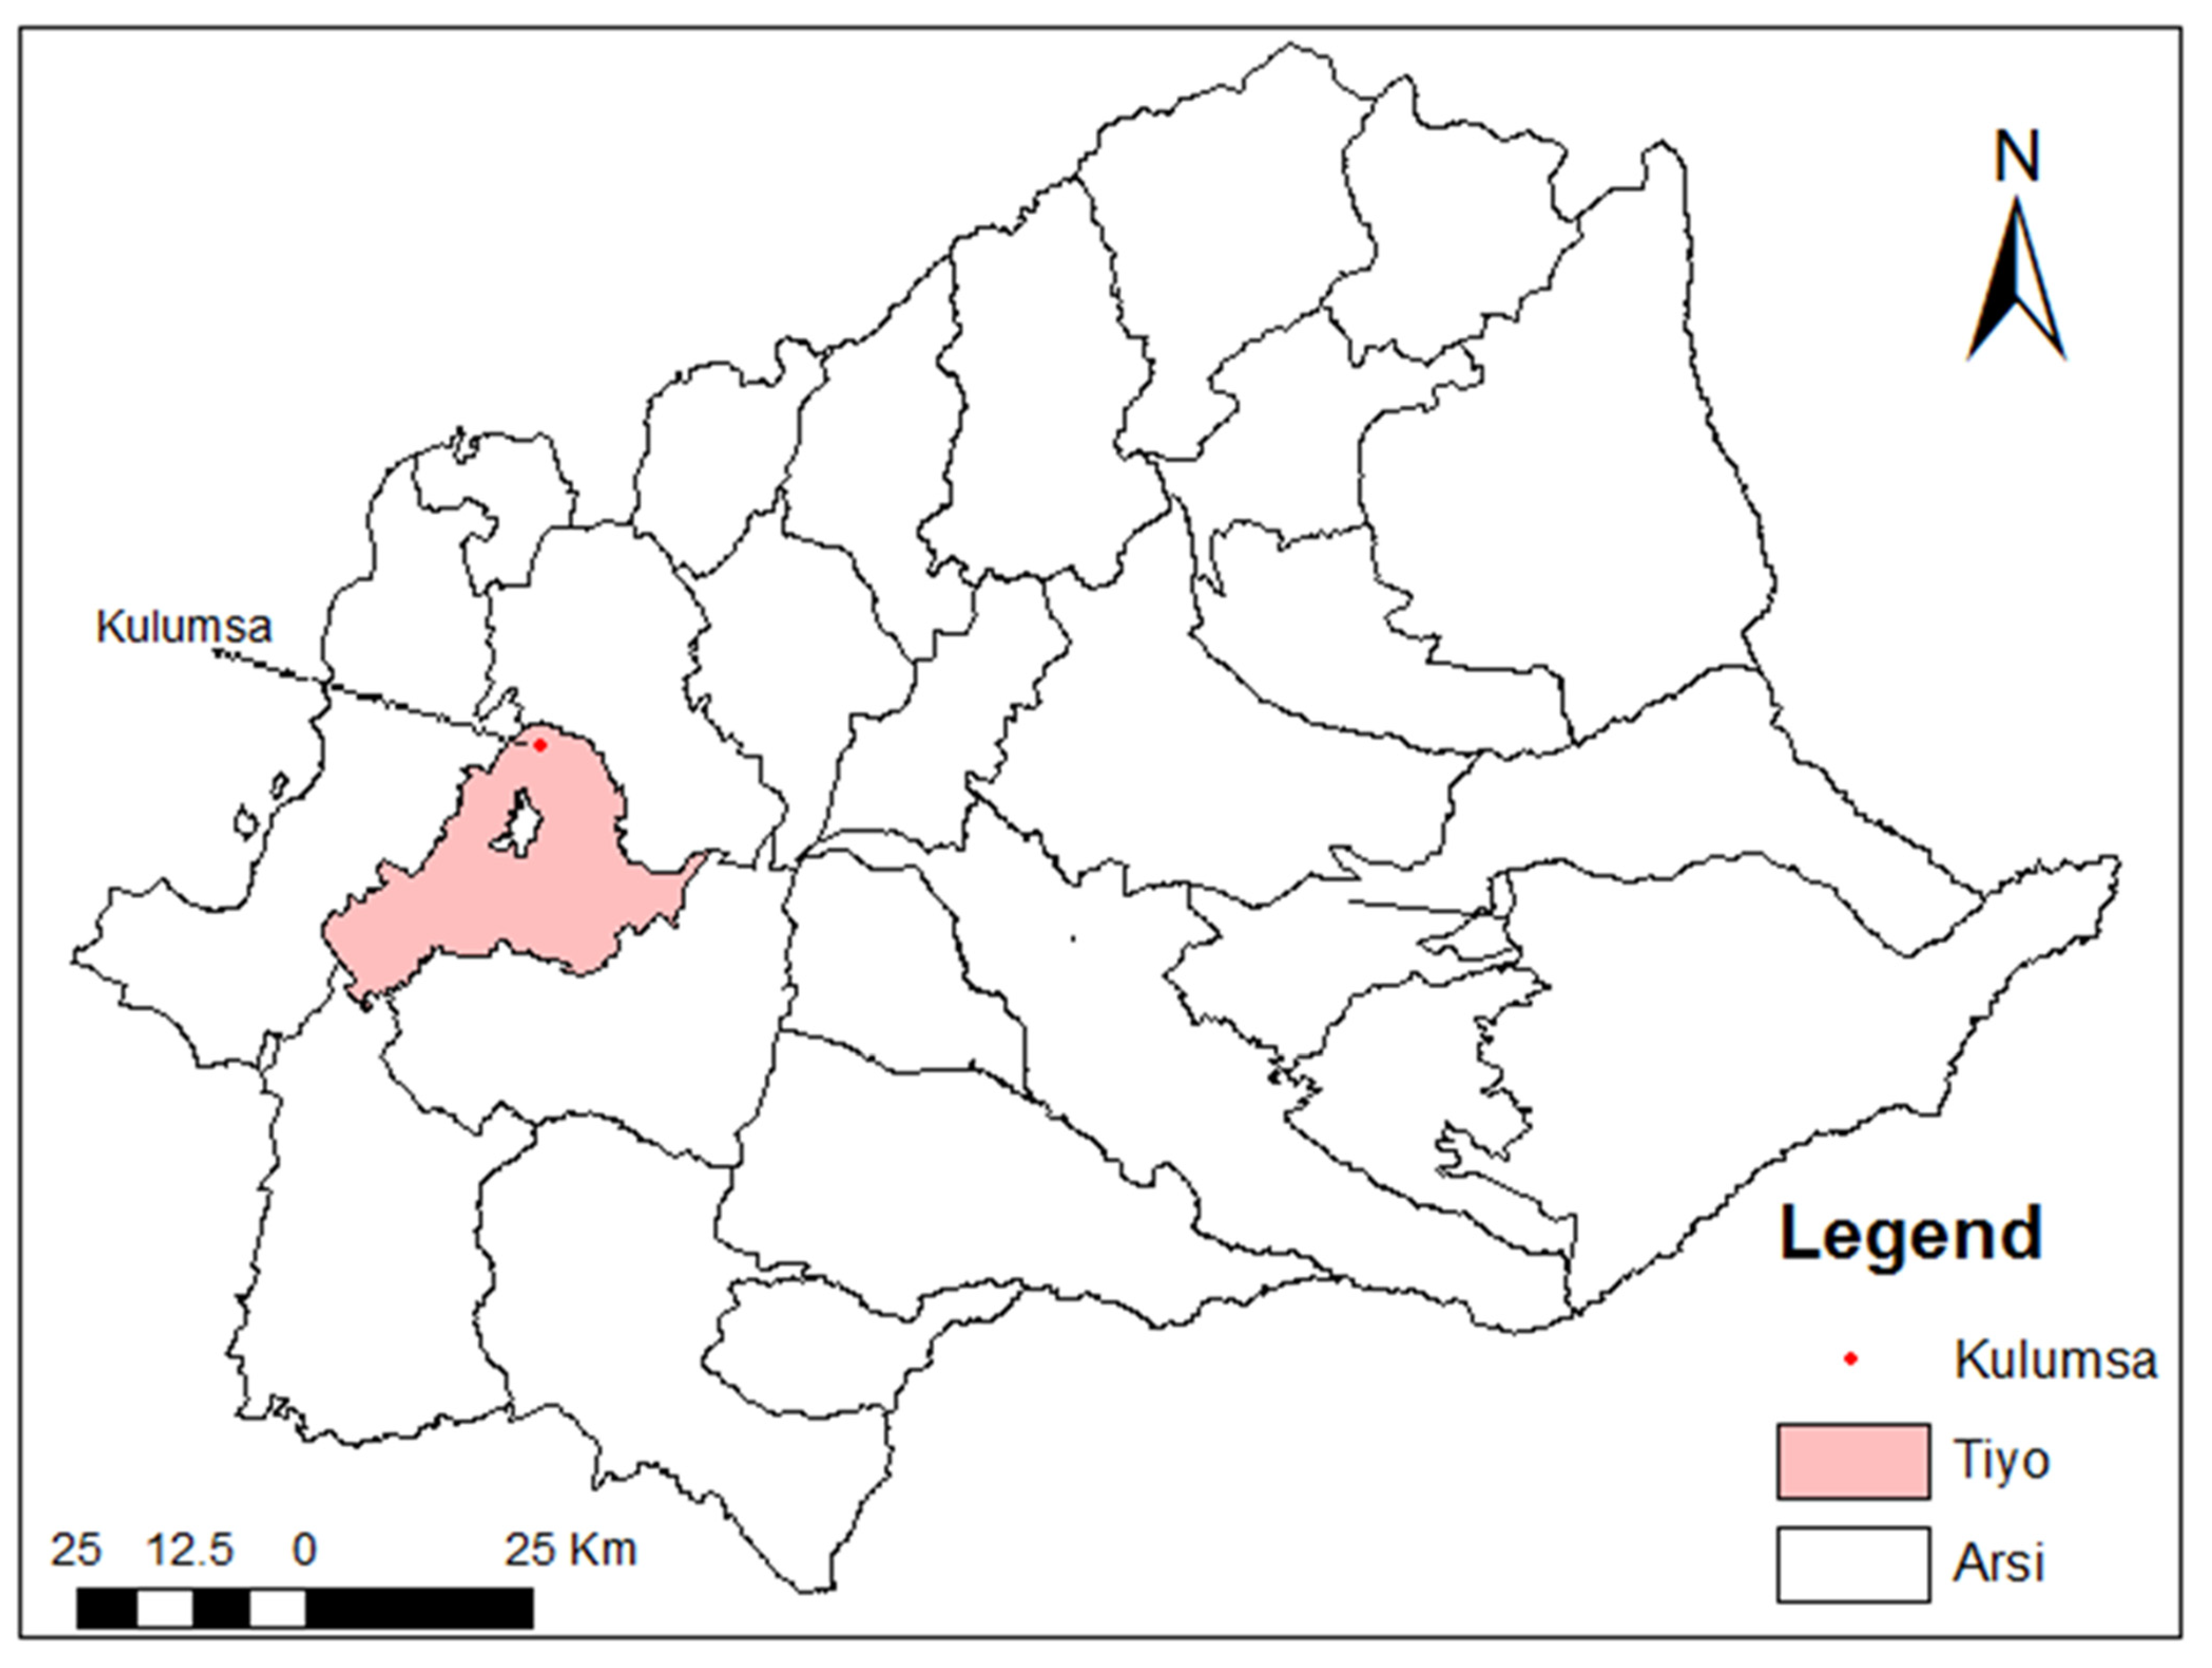
2.1. The Study Area

This study was conducted in Kulumsa, located in the Arsi zone of the Oromia region, Southeastern Ethiopia (Figure 1); it lies between 8°01′10″ N and 39°09′11″ E and at an altitude of 2200 m. The mean maximum and minimum temperatures are 23.2 °C and 10 °C, respectively, and the mean annual precipitation is 823.1 mm. The soil type of the area is clay loam [33,34]. Wheat production is mainly rain-fed, grown in the altitude range of 1500–3000 m, latitude from 6 ° to 16 ° , and longitude from 35 ° to 42 ° [35]. Kulumsa is considered one of the major wheat-producing highlands [36]. The most common fertilizer used in the area for wheat cultivation is diammonium phosphate [37].

2.2. Data Resources

Data used for this study were obtained from different sources. As weather, soil, and crop management data are the minimum data requirements for the DSSAT crop simulation model, these datasets were obtained from different institutes in Ethiopia. Meteorological and soil data were obtained from the National Meteorology Agency and Kulumsa Agricultural Research Center, respectively. The crop data were collected from the National Variety Trial (NVT) experiments conducted by the wheat research program, Kulumsa Agricultural Research Center, Ethiopia. The experiments were laid out in a randomized complete block design (RCBD), with a plot area of 3 m2 and four replications. Wheat was planted in 2.5 m long rows with 20 cm inter-row spacing. The recommended rate of urea fertilizer (41 kg N and 46 kg P ha−1) was applied in two splits: at the sowing and tillering (30–35 days after sowing) stages. Other recommended agronomic practices, including weeding and chemical spray, were applied during the running of the experiment. Detailed descriptions of the datasets can be found in Table 1 and Table 2.
The model datasets were extracted for the observed period (1981–2005), mid-century and late-century for the GCMs listed in Table 3, and their means under RCP 4.5 and RCP 8.5 for the future analysis. GCM datasets included daily series of maximum temperatures, minimum temperatures, precipitation, and solar radiation. GCM data were sourced from the Earth System Grid Federation (ESGF) (https://esgf-node.llnl.gov/search/cmip5/, accessed on 21 February 2021) and downscaled with R Package for the observed period. The dataset from the MarkSim tool (for the future period) is downscaled data [38]; hence, this tool employs the stochastic downscaling technique. The tool has been found effective for the tropics [39], and has been used in Ethiopia in previous studies assessing the impacts of climate change [17,40,41,42,43,44]. In addition, this weather generator tool is based on IPCC AR5 data (CMIP5), considered an appropriate data format for the DSSAT crop model. The tool has 17 GCMs and four RCPs (RCP 2.6, RCP 4.5, RCP 6.0, and RCP 8.5) for the period 2010–2095. Detailed descriptions of the MarkSim weather generator tool can be found in the previous edition [45].

2.3. Bias Correction

The outputs of GCMs are the main sources of data for climate projection studies, though the resolution of GCMs is too coarse to be used directly for research related to climate change impact assessment, which may lead to errors for the study results [46]. After checking the abilities of the individual models and their means, the GCM simulations were far from the observed values, thus, the need to perform bias correction or adjustment of bias [47] before using the GCM data. For this study, the linear scaling bias-correction method was applied for climate variables, daily maximum and minimum temperatures, and precipitation for the period 1981–2005, mid-century and late-century. This bias correction method was selected due to its accuracy, simplicity, parameter consideration, and reliability [48]; hence, previous scholars also used this approach for impact assessment and climate projection studies. The linear scaling bias-correction technique is based on the difference between observed monthly values and monthly simulated values; then, the difference of these values was applied to the simulated data to obtain bias-corrected climate data [49]. The bias-corrected variables were calculated using the following formulas
Phis (d)* = Phis (d) × [µm (Pobs (d))/µm (Phis (d))]
Psim (d)* = Psim (d) × [µm (Pobs (d))/µm (Phis (d))]
This (d)* = This (d) + [µm (Tobs (d)) − µm (This (d))]
Tsim (d)* = Tsim (d) + [µm (Tobs (d)) − µm (This (d))]
where d = daily, µm = long-term monthly mean, * = bias corrected, his = historical GCM simulated, sim = GCM simulated for future, obs = observed.

2.4. Performance Assessment of GCMs

After bias correction, individual GCMs and their means were analyzed for the prediction performance of maximum temperature, minimum temperature, and precipitation on a monthly basis from 1981 to 2005, using the statistical measures coefficient of determination ( R 2 ) and root-mean square error (RMSE). A scatter plot of observed maximum temperature, minimum temperature, and precipitation against model data was computed using R Package.

2.5. Crop Simulation Model Calibration and Validation

The DSSAT CERES-Wheat model version 4.7.5.0 was used to simulate the phenology and yield of three wheat varieties, namely, Dandaa, Digelu, and Kakaba. The above model was used to simulate the impacts of weather, soil, and crop management on the growth, development, and yield of wheat [50]. To run the model, input data types such as weather, soil, and crop management are required. The calibration of the DSSAT crop model in simulating wheat growth and yield for the study area was performed to adjust the simulated input data or parameters in representing the crop response to given soil and atmospheric conditions. The calibration phase was performed using climate data from 1981 to 2015, crop management data from 2011, 2012, and 2013, and soil data for the three wheat cultivars. Genetic coefficients (Table 4) that describe the growth and development of crops for these three cultivars are not included in the DSSAT database for the cultivar file, so the determination of genetic coefficients was obtained by using the GLUE coefficients estimator method during the model calibration process.
Since neither of the cultivars was previously introduced in DSSAT, we first created individual cultivar genotype files in the DSSAT model. To initialize calibration, values of the genetic coefficients, which are available in DSSAT by default, were used to initialize the simulation; therefore, IB1015 MARIS FUNDIN was used for Digelu, and the default genetic coefficient was used to initialize the Dandaa and Kakaba varieties. A continuous and iterative process was applied using GLUE to obtain reasonable genetic coefficients through trial and error, and adjustments were made until a better match between the observed and simulated days of anthesis, physiological maturity, and grain yield were obtained.
Using a crop simulation model is a continuous and iterative process. After various processes during the calibration process, a crop simulation model can be best compared to the observed variables, which can be evaluated using the validation procedure. Validation is useful in crop modelling to check the response of the model to given weather, soil, and crop management conditions with respect to the corresponding observed values, as well as in giving information on the magnitude of the error to users [51]. Before simulating yield and wheat phenology under future climate scenarios, the model was validated to ensure its performance in simulation using different datasets for crops, which were not used during the calibration process (2014 and 2015). We used RMSE, index of agreement (d), modelling efficiency (ME), and R2 to evaluate the model’s performance on the key phenological parameters (days to anthesis and maturity), and the final yield from the 2011 to 2015 growing period. These model performance evaluation techniques were calculated using the following formulas:
RMSE = i = 1 n ( S i O i ) 2 n
d = 1 i = 1 n ( S i O i ) 2 i = 1 n ( | S i O ¯ | + | O i O ¯ | ) 2
ME = 1 i = 1 n ( S i O i ) 2 i = 1 n ( O i O ¯ ) 2
where Si and Oi are simulated and observed values, respectively; s n is the number of data used, and O ¯   is the mean of the observed value.

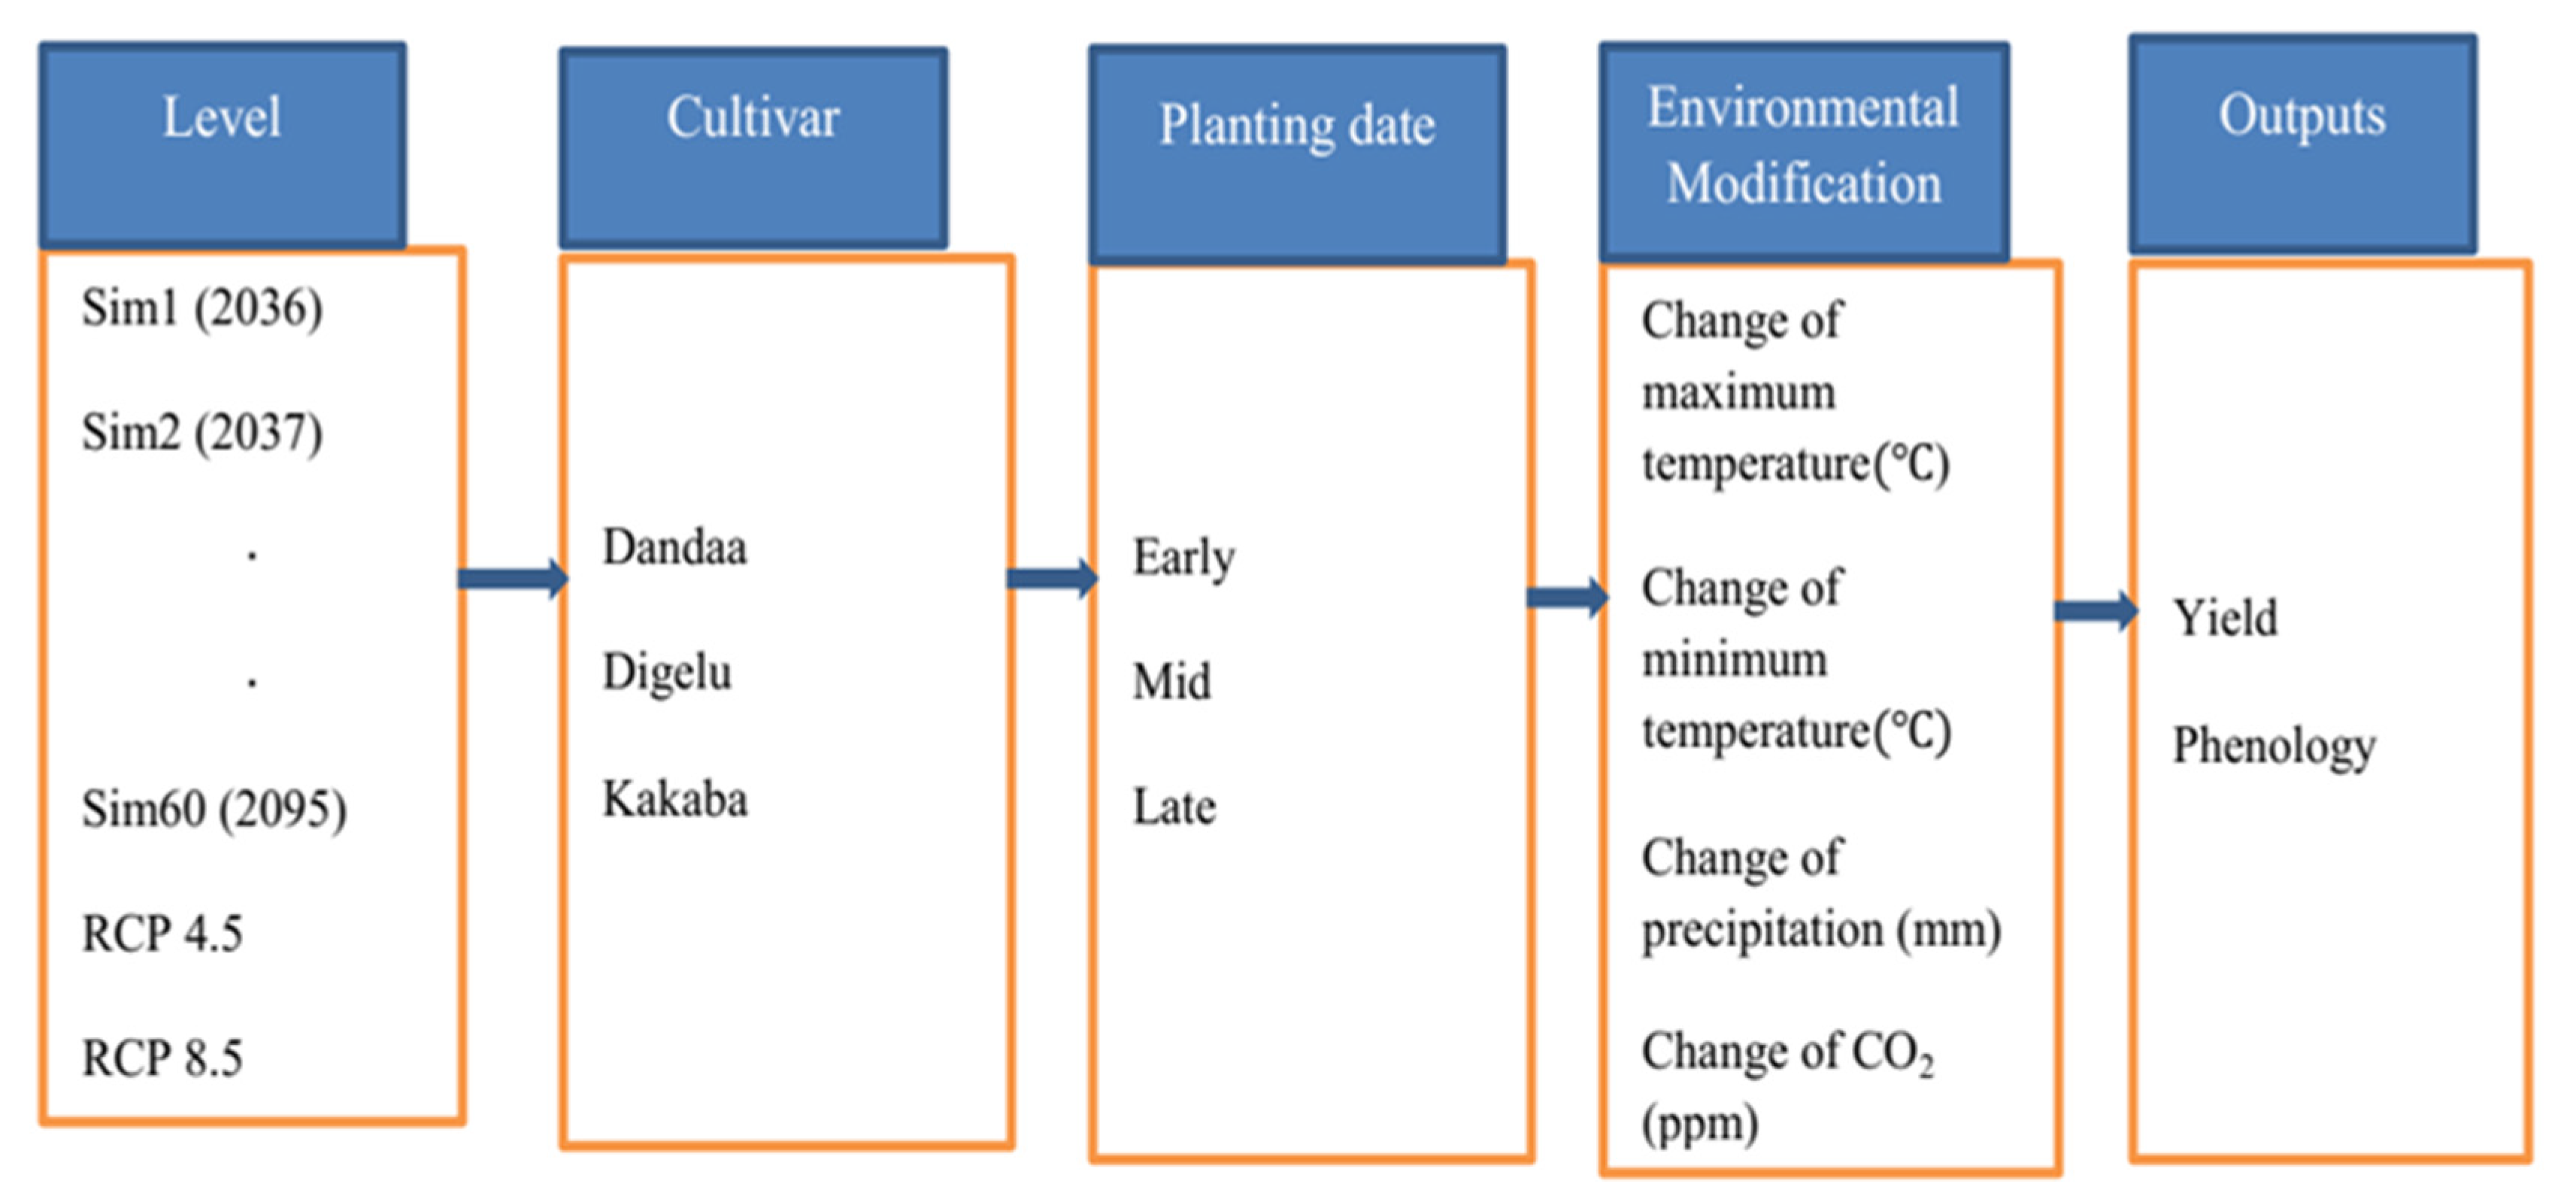
2.6. Crop Model Simulation Design for the Future Period

Figure 2 shows the settings for the variables when running the DSSAT model under the future climate scenario. To assess the response of wheat yield and phenology to future climate scenarios against the baseline, all the four variables (maximum temperature, minimum temperature, precipitation, and carbon dioxide) of the two emission scenarios (RCP 4.5 and RCP 8.5) and the two future periods of 2036–2065 and 2066–2095 were considered. The concentrations of carbon dioxide applied for the simulation are presented in Table 5.

2.7. Quantifying Adaptation Gain

(1)
Sowing date
Based on the observed data and oral discussions with experts during the data collection period, recently, wheat has been sown between 15 June and 15 July in the study area, depending on the onset of rainfall. We set three sowing dates with 15-day intervals from mid-June to mid-July; 15 June, 30 June, and 15 July were considered to represent early, mid, and late sowing dates, respectively. The simulation was done based on these sowing dates for the future scenarios to identify the planting date with the best yield gains.
(2)
New (improved) cultivar
As mentioned in the description in the data input section, three cultivars were used for this study, Dandaa, Digelu, and Kakaba. These cultivars are spring bread wheat types; Dandaa and Kakaba were released in 2010, while Digelu has existed for a long. Therefore, Dandaa and Kakaba varieties are considered as new varieties, and Digelu as an old and reference variety. In general, we considered adjusting the sowing date and using an improved variety as adaptation strategies, but to identify which of the two measures could be called adaptation technology and to what extent, a formula from [53] was adopted to calculate the yield gain from these adaptation measures. It should be noted that, according to this formula, new technology is considered as an adaptation when the difference between its potential future yield gain relative to the old technology and the current yield gain is positive.
Adaptation   gain = [ Q 2 - Q 1 ] - [ W 2 - W 1 ]
where Q2 is the future yield of the new cultivar, Q1 is the future yield of the old (or reference) cultivar, W2 is the initial (current) yield of the new cultivar, and W1 is the initial (current) yield of the old cultivar (or reference).

2.8. Adjustment of Virtual Cultivars for Future Climate

Breeding of new cultivars with high yield potential in a changing climate is a chal-lenging task for crop breeders [54]. Crop modelling is the most powerful tool for sup-porting crop breeders in designing virtual cultivars used for different crops and farming environments [55]. To identify the virtual cultivar that demonstrated the best yield, we set virtual cultivar parameters within the range of the minimum and maximum values (Table 6) by changing the reference cultivar (Dandaa, Digelu, and Kakaba) parameters. We selected nine virtual cultivars (Table 7), three sowing dates (15 June, 30 June, and 15 July), and two emission scenarios (RCP 4.5 and RCP 8.5) for the period from 2036 to 2095. In total, 3240 (9 virtual cultivars × 3 sowing dates × 60 years × 2 emission scenarios) simulations were generated using the DSSAT CERES-Wheat model.
Note that from VC 1 to VC 3 are virtual cultivars based on the reference cultivar Dandaa, from VC 4 to VC 6 are virtual cultivars based on reference cultivar Digelu, and from VC 7 to VC 9 are virtual cultivars based on the reference cultivar Kakaba.

3. Results

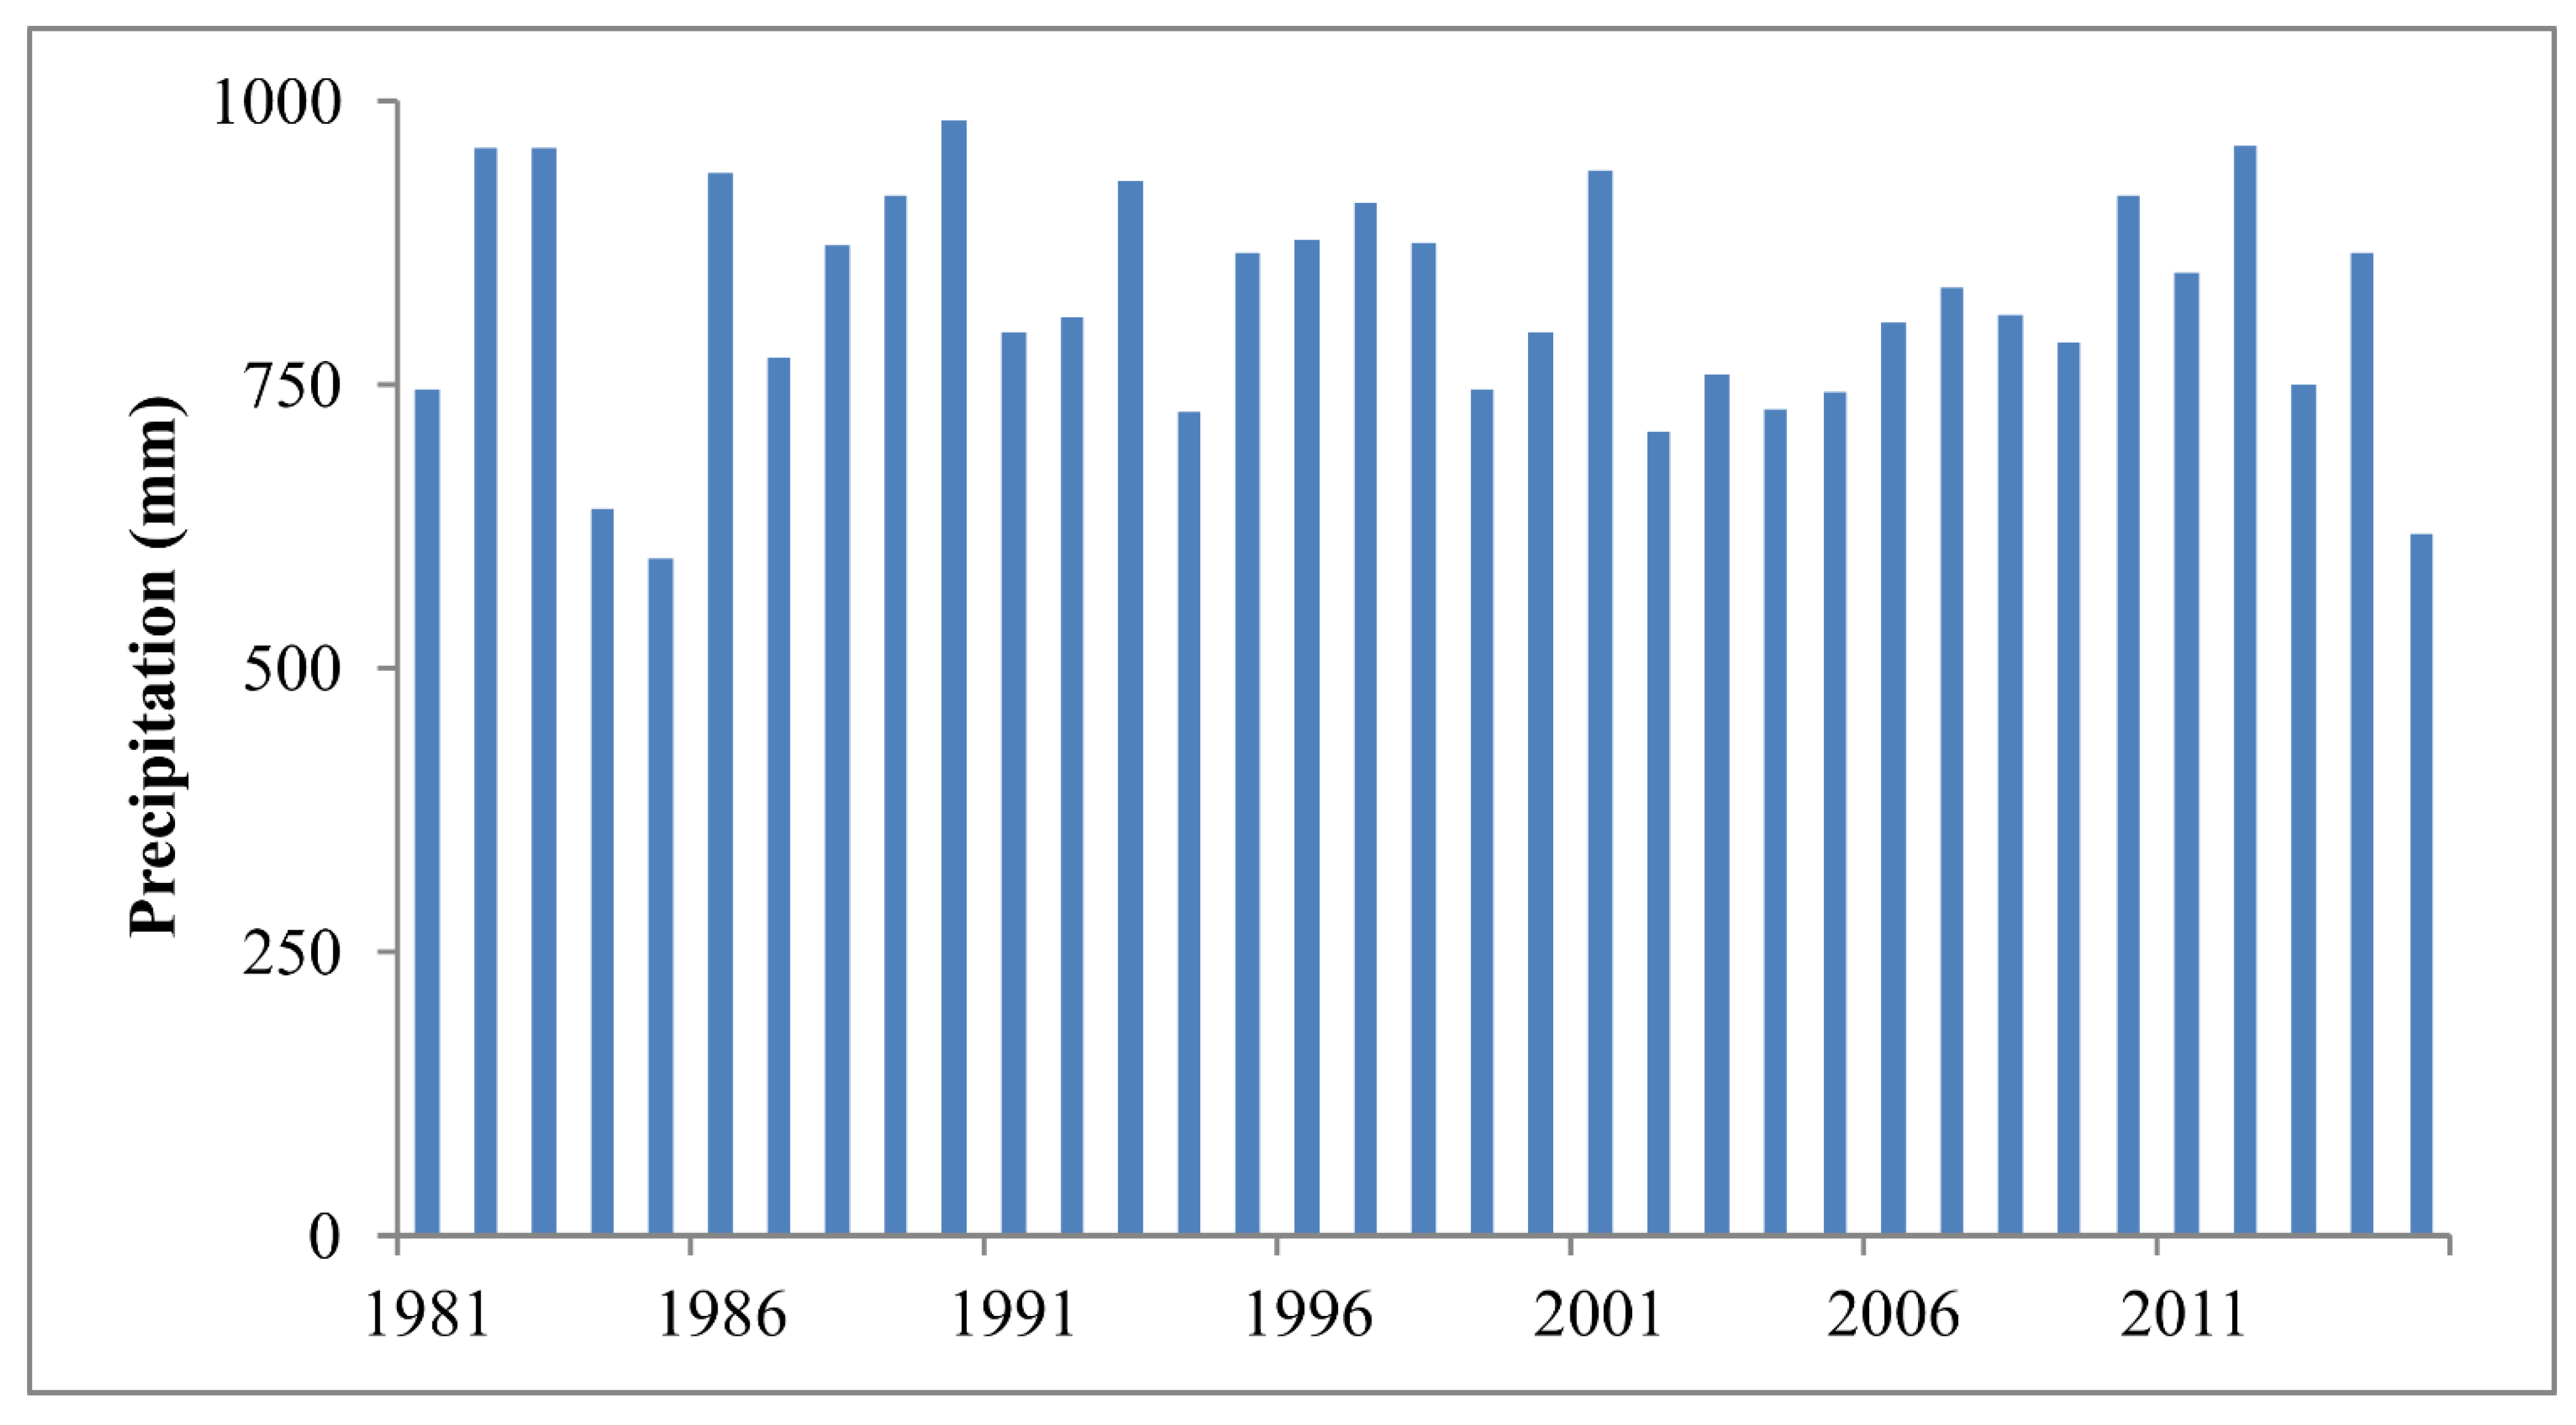
3.1. Climate Background

The annual variation was detected in maximum and minimum temperatures, and the minimum temperature showed upward trends in 2014 and 2015 (Figure 3). Annual precipitation from 1981 to 2015, as presented in Figure 4, indicates no significant monotonic trend; the lowest and highest precipitation were recorded in 1985 and 1990, respectively.
Figure 5 shows the monthly climate (maximum temperature, minimum temperature, and precipitation) cycle for the baseline period, with stress on the recent fifteen years. The maximum temperature in recent years has increased relative to the past 20 years, indicating more warming, while in recent years, the minimum temperature becomes cooler. Two rainy seasons (one shorter rainy season with a low amount of precipitation from February to May, and another long rainy season with higher precipitation from June to September) can be distinguished. Recent precipitation showed a decreasing trend, except for January, May, August, and September; this implies that recent years are drier than past years (Figure 5).
The accumulated growing degree days (AGDD) for the spring wheat growing season for the period 1981–2015 is presented in Figure 6. During this period, the AGDD ranged from 2601.4 °C to 3171.7 °C. The lowest and highest AGDD were observed during the growing periods in 2008 and 2015, respectively.

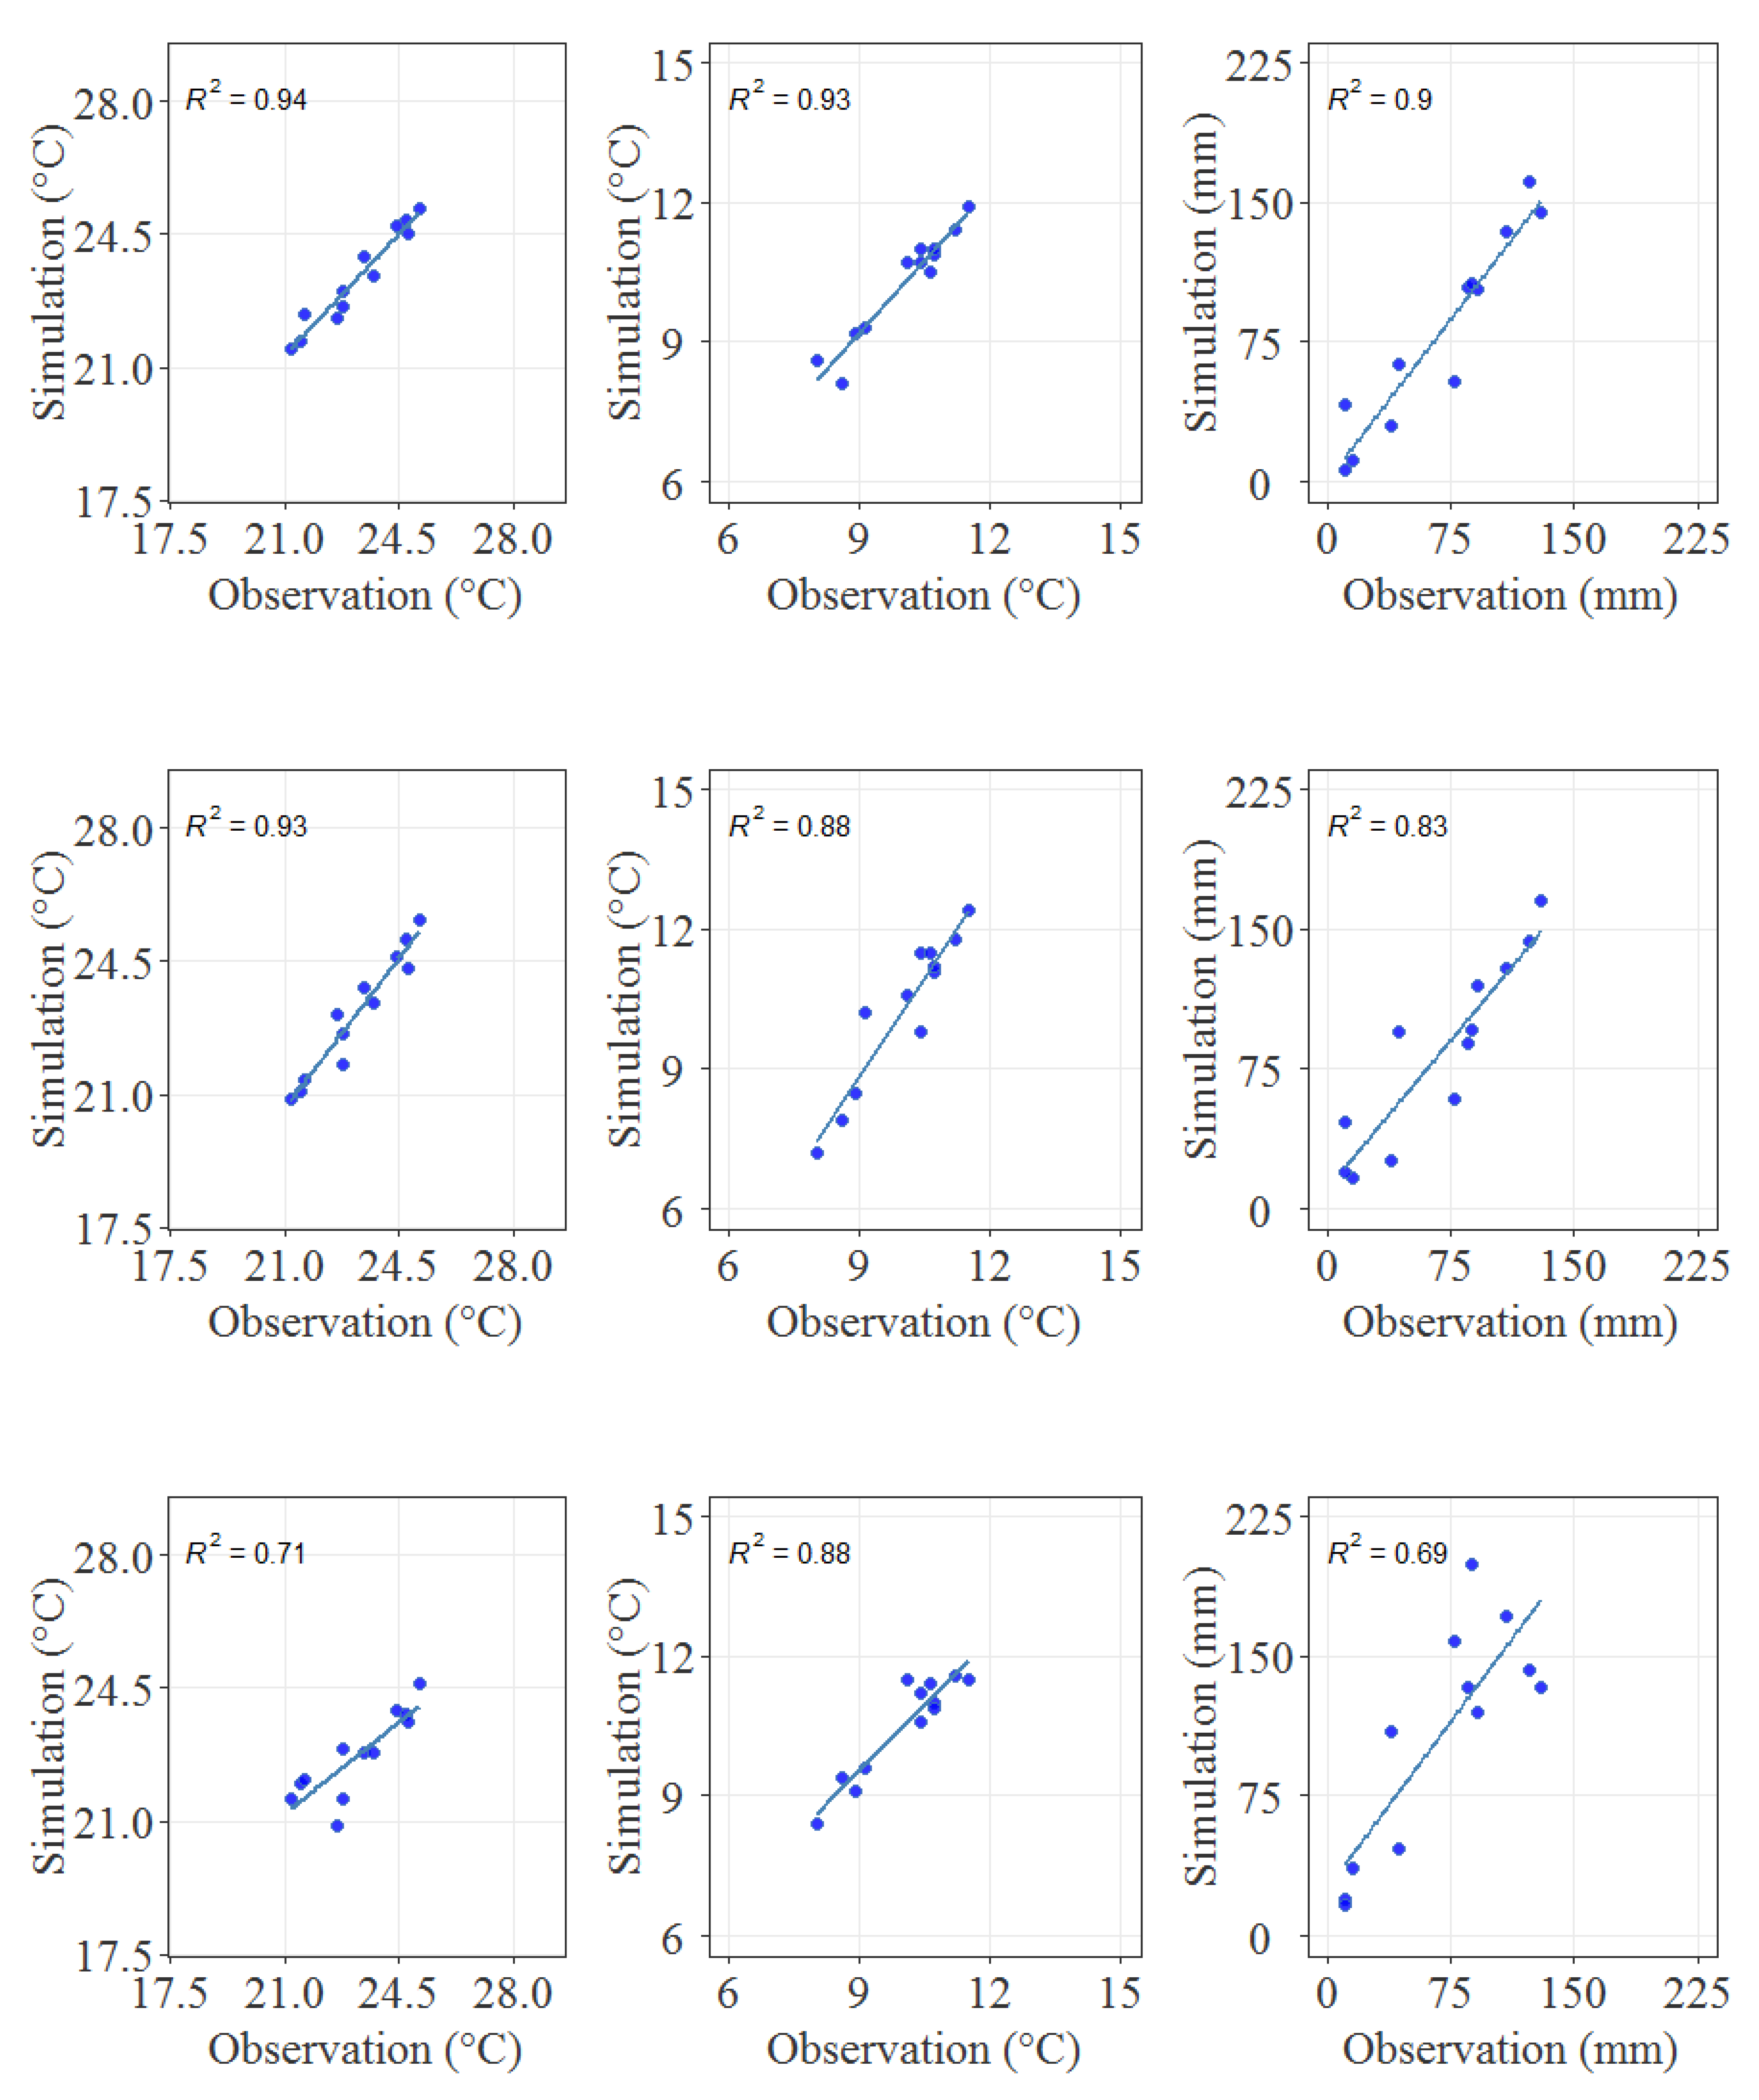
3.2. Performance of GCMs on Simulating Maximum Temperature, Minimum Temperature, and Precipitation

The results of the statistics to assess the performance of GCMs are illustrated in Table 8. The performance comparison among the four GCMs and their means showed that R2 ranged from 0.7 to 0.9, from 0.8 to 0.9, and from 0.6 to 0.9 for maximum temperature, minimum temperature, and precipitation, respectively. RMSE ranged from 0.3 to 0.9 °C, from 0.3 to 0.7 °C, and from 19.5 to 51.7 mm for maximum temperature, minimum temperature, and precipitation, respectively. The means of the four GCMs showed better correlation (Figure 7) and relatively better skill than the individual models in reproducing maximum temperature, minimum temperature, and precipitation, so we adopted the mean of the GCMs to simulate climate scenarios for the future period for the entire study.

3.3. Temperature and Precipitation Projections for Wheat Growing Period

The changes of maximum temperature, minimum temperature, and precipitation during the growing periods for the future scenarios with respect to the baseline period are presented in Figure 8. Maximum temperature and minimum temperature showed increments with different magnitudes in both future time periods and emission scenarios throughout the growing season. The increase in maximum temperature ranged from 1.2 °C to 5.5 °C. The lowest increase was observed for mid-century RCP 4.5 in November, and the highest increase found for late-century RCP 8.5 in August. The rise of the minimum temperature was between 0.6 °C and 3.9 °C throughout the growing season. The lowest and highest increments observed were for mid-century RCP 4.5 in July and late-century RCP 8.5 in November, respectively. Precipitation showed a decreasing trend throughout the growing season, except in July, for both future time periods and emission scenarios. The decrease rate of precipitation ranged from −94% for mid-century RCP 4.5 in November to −29% for late-century RCP 8.5 in June. The increase in precipitation ranged from 59% to 81% in the mid-century RCP 8.5 and mid-century RCP 4.5 in July, respectively. Generally, the deficit of precipitation during the growing season can lead to dry spells, and then to water stress-induced damage.

3.4. Crop Model Calibration and Validation

The genotype values of the three wheat cultivars generated during the calibration phase are presented in Table 9. The performance of the DSSAT CERES-Wheat model in simulating Dandaa, Digelu, and Kakaba cultivars of days to anthesis, days to maturity, and yield parameters revealed RMSE values ranging from 3 to 6.4 days for days to anthesis, from 4.1 to 8.7 days for days to maturity, and from 137.1 to 331.3 kg/ha for yield (Table 10). The model simulated days to anthesis with d values from 0.7 to 0.9; for days to maturity and yield, d value was 0.9 for all cultivars. The value of ME varied, for days to anthesis ranging from −5.4 to 0.8, days to maturity from 0.5 to 0.8, and for grain yield from −1.1 to 0.7. R2 ranged from 0.2 to 0.9, from 0.6 to 0.9, and from 0.8 to 0.9 for days to anthesis, and days to maturity and yield, respectively. Based on ME and R2 values, the model’s simulation performance for the yield of Dandaa cultivar and days to anthesis of Digelu cultivar was low. Nonetheless, based on RMSE and d of the corresponding values of these cultivars, the ability of the model to simulate these varieties’ parameters was still reasonable. The regression analysis also showed good correlation between observed and simulated values of the three cultivars and parameters (Figure 9).

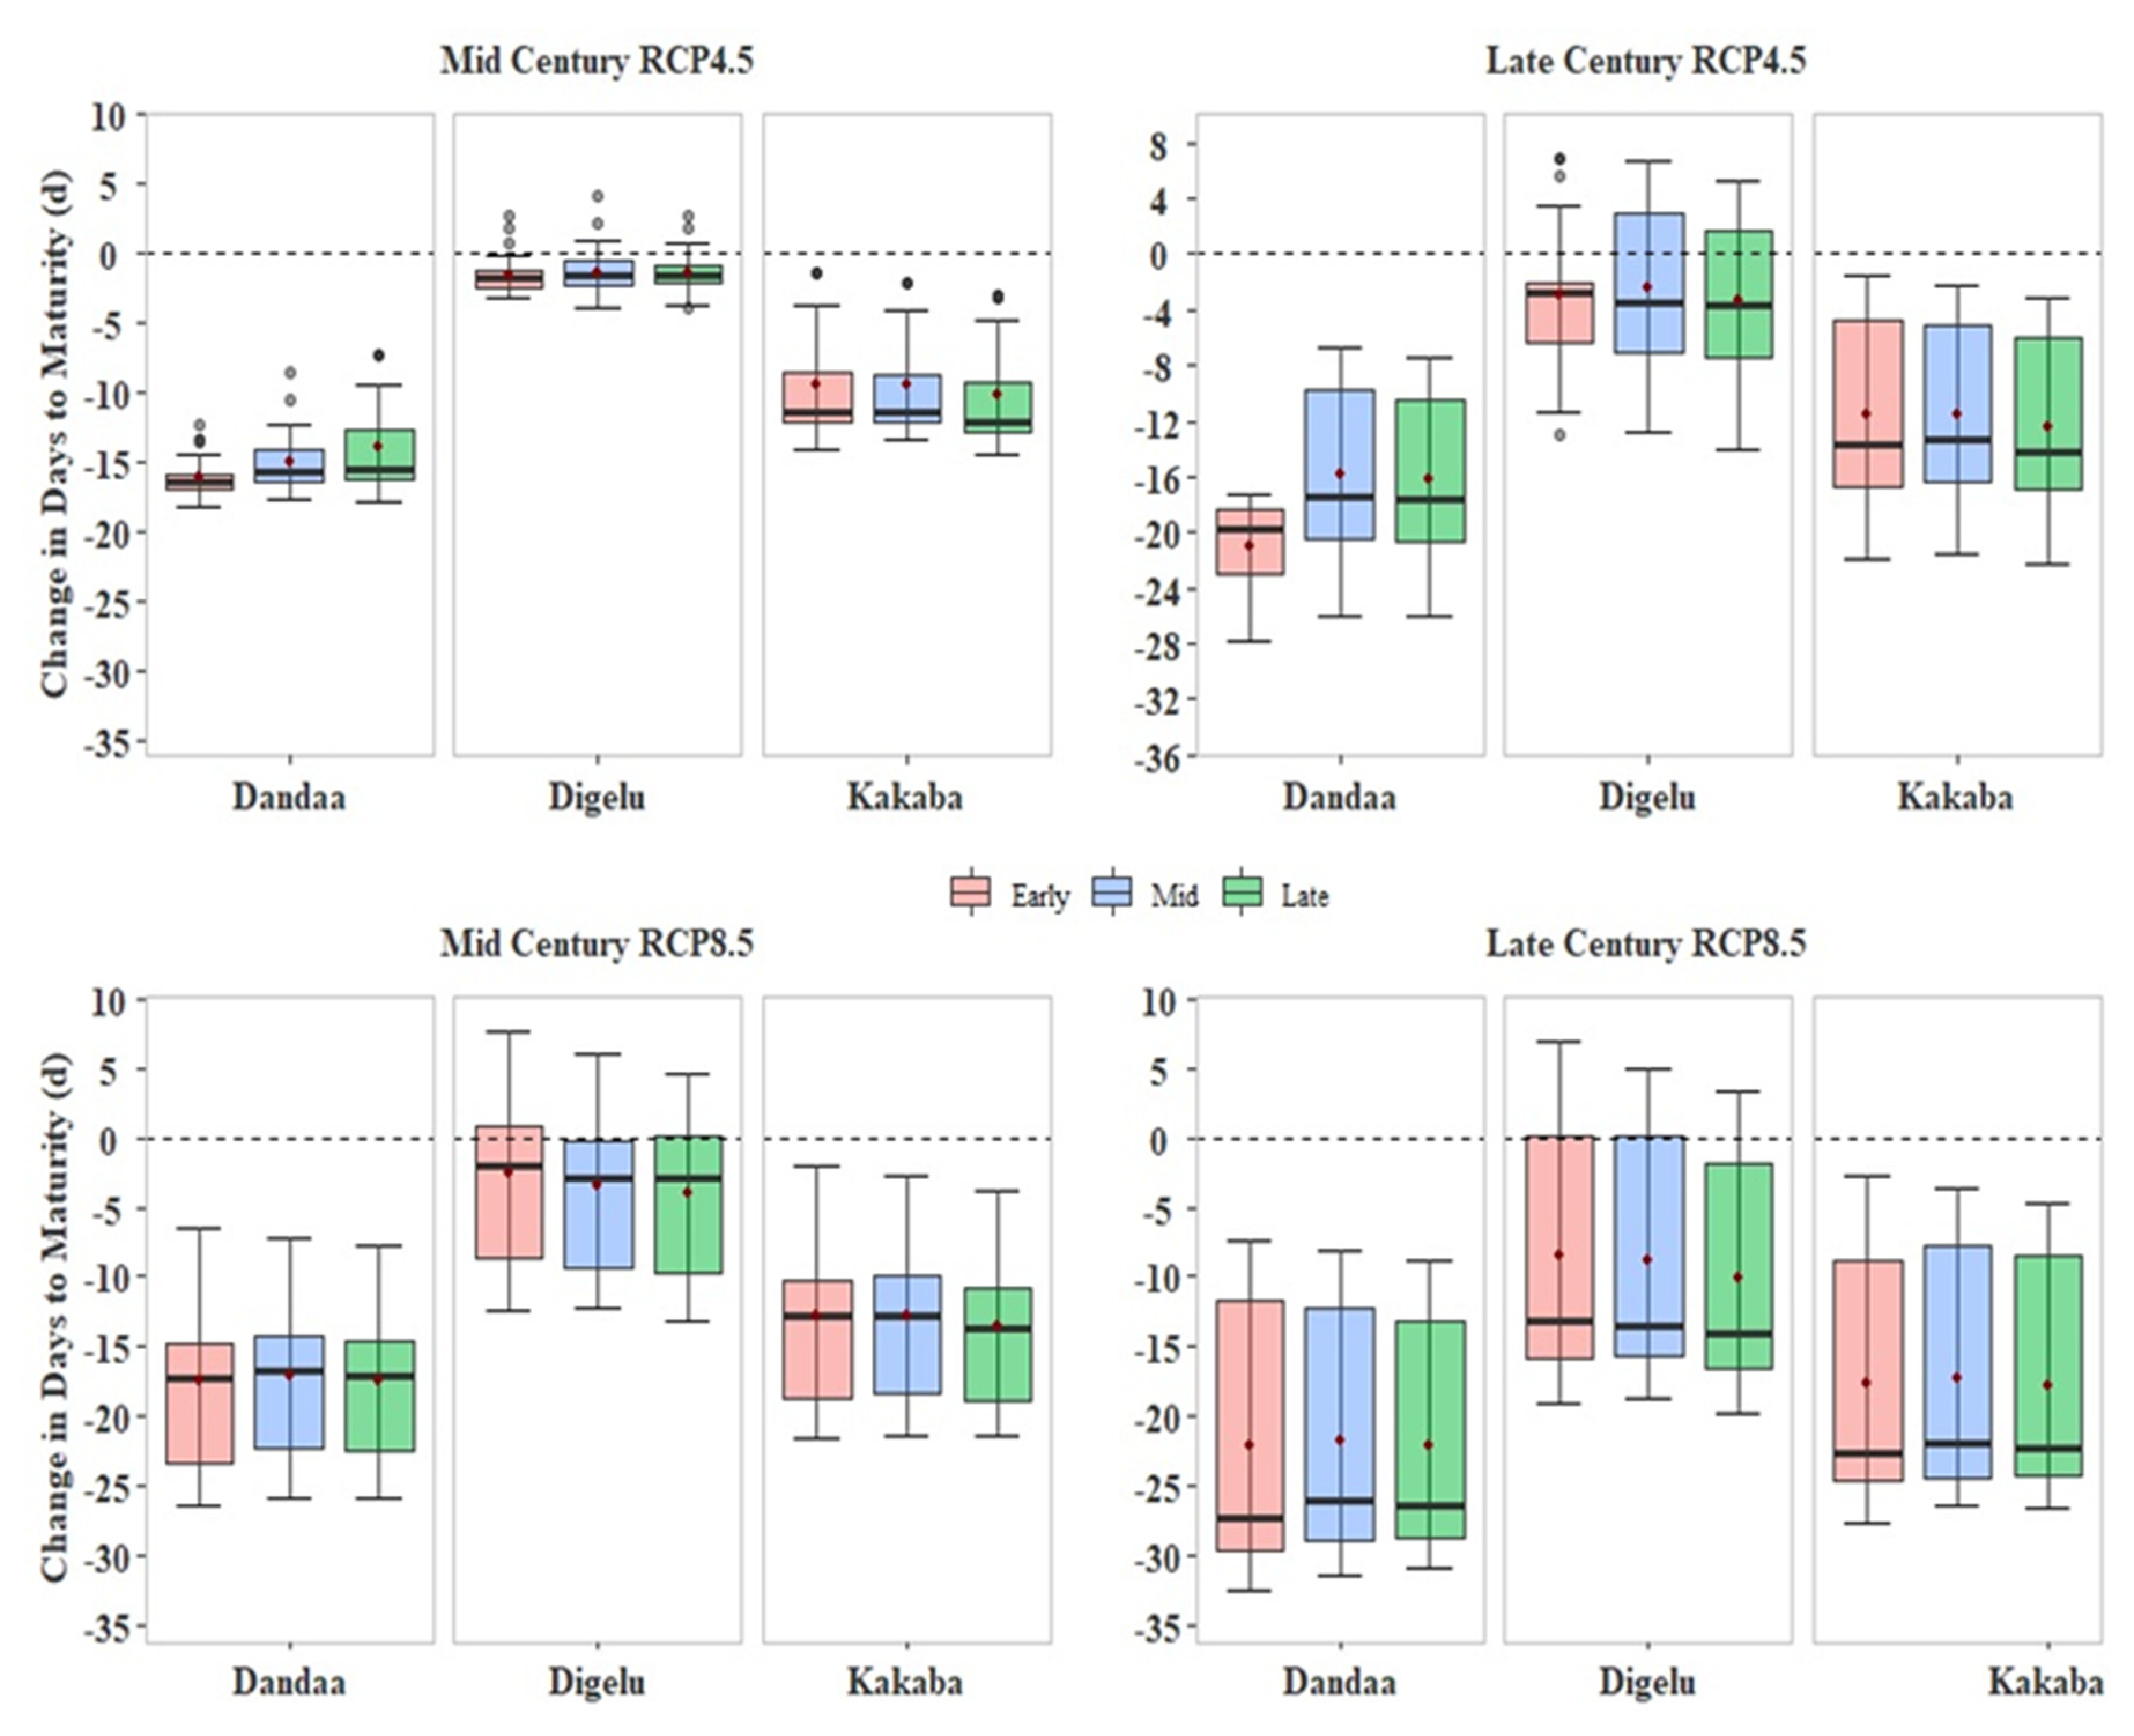
3.5. Crop Response to Future Climate Scenarios

Figure 10 indicates that the Dandaa cultivar, for the late sowing date, gave a higher yield compared to the others under RCP 4.5, with yield gains of about 350 kg/ha and 300 kg/ha for most years in the 2050s and 2080s, respectively. Dandaa also showed a better yield change of around 400 kg/ha in the 2050s under the RCP 8.5, but Kakaba showed a higher yield change of about 550 kg/ha in the 2080s versus 500 kg/ha for Dandaa for the late sowing date. Across the two climate scenari os, the Dandaa and Digelu cultivars indicated yield declines of up to 5% and 4%, respectively, at the early sowing date, compared to the reference yield in most cases, except in the 2080s of RCP 8.5.
The results for change in phenology for the future period relative to the baseline period showed that future climate change would have an impact on the phenology of the Dandaa, Digelu, and Kakaba wheat cultivars. Figure 11 and Figure 12 show the changes in wheat phenology during the mid-century and late-century periods with respect to the baseline period under the RCP 4.5 and RCP 8.5 emission scenarios. Under future climate scenarios, we found advancing in wheat phenology in the two future periods (mid-century and late-century); the effects of RCP 8.5 on phenology were higher than those of RCP 4.5. In addition, under the same CO2 concentration scenario, the advance in the days of wheat phenology during late-century was higher than mid-century. Days to anthesis will be shortened up to 20 days for the Dandaa cultivar and up to 14 days for the Digelu and Kakaba cultivars during late-century under RCP 8.5 (Figure 11). Days to maturity will be shortened up to 32, 20, and 27 days during late-century under RCP 8.5 for the Dandaa, Digelu, and Kakaba cultivars, respectively (Figure 12).

3.6. Adaptation Gain from Adjusting Sowing Date and Using New (Improved) Variety

Figure 13 presents the adaptation potential of the two new varieties (Kakaba and Dandaa) relative to the old cultivar (Digelu) for different planting dates. Considering RCP 4.5, the Dandaa cultivar shows more adaptation potential under the late sowing date, with a yield increase of up to around 140 kg/ha and 148 kg/ha, respectively, for mid- and late- century. However, under RCP 8.5, Kakaba shows higher adaptation, as the yield gain for early sowing date can reach up to 142 kg/ha and 170 kg/ha during the mid- and late-century periods, respectively.

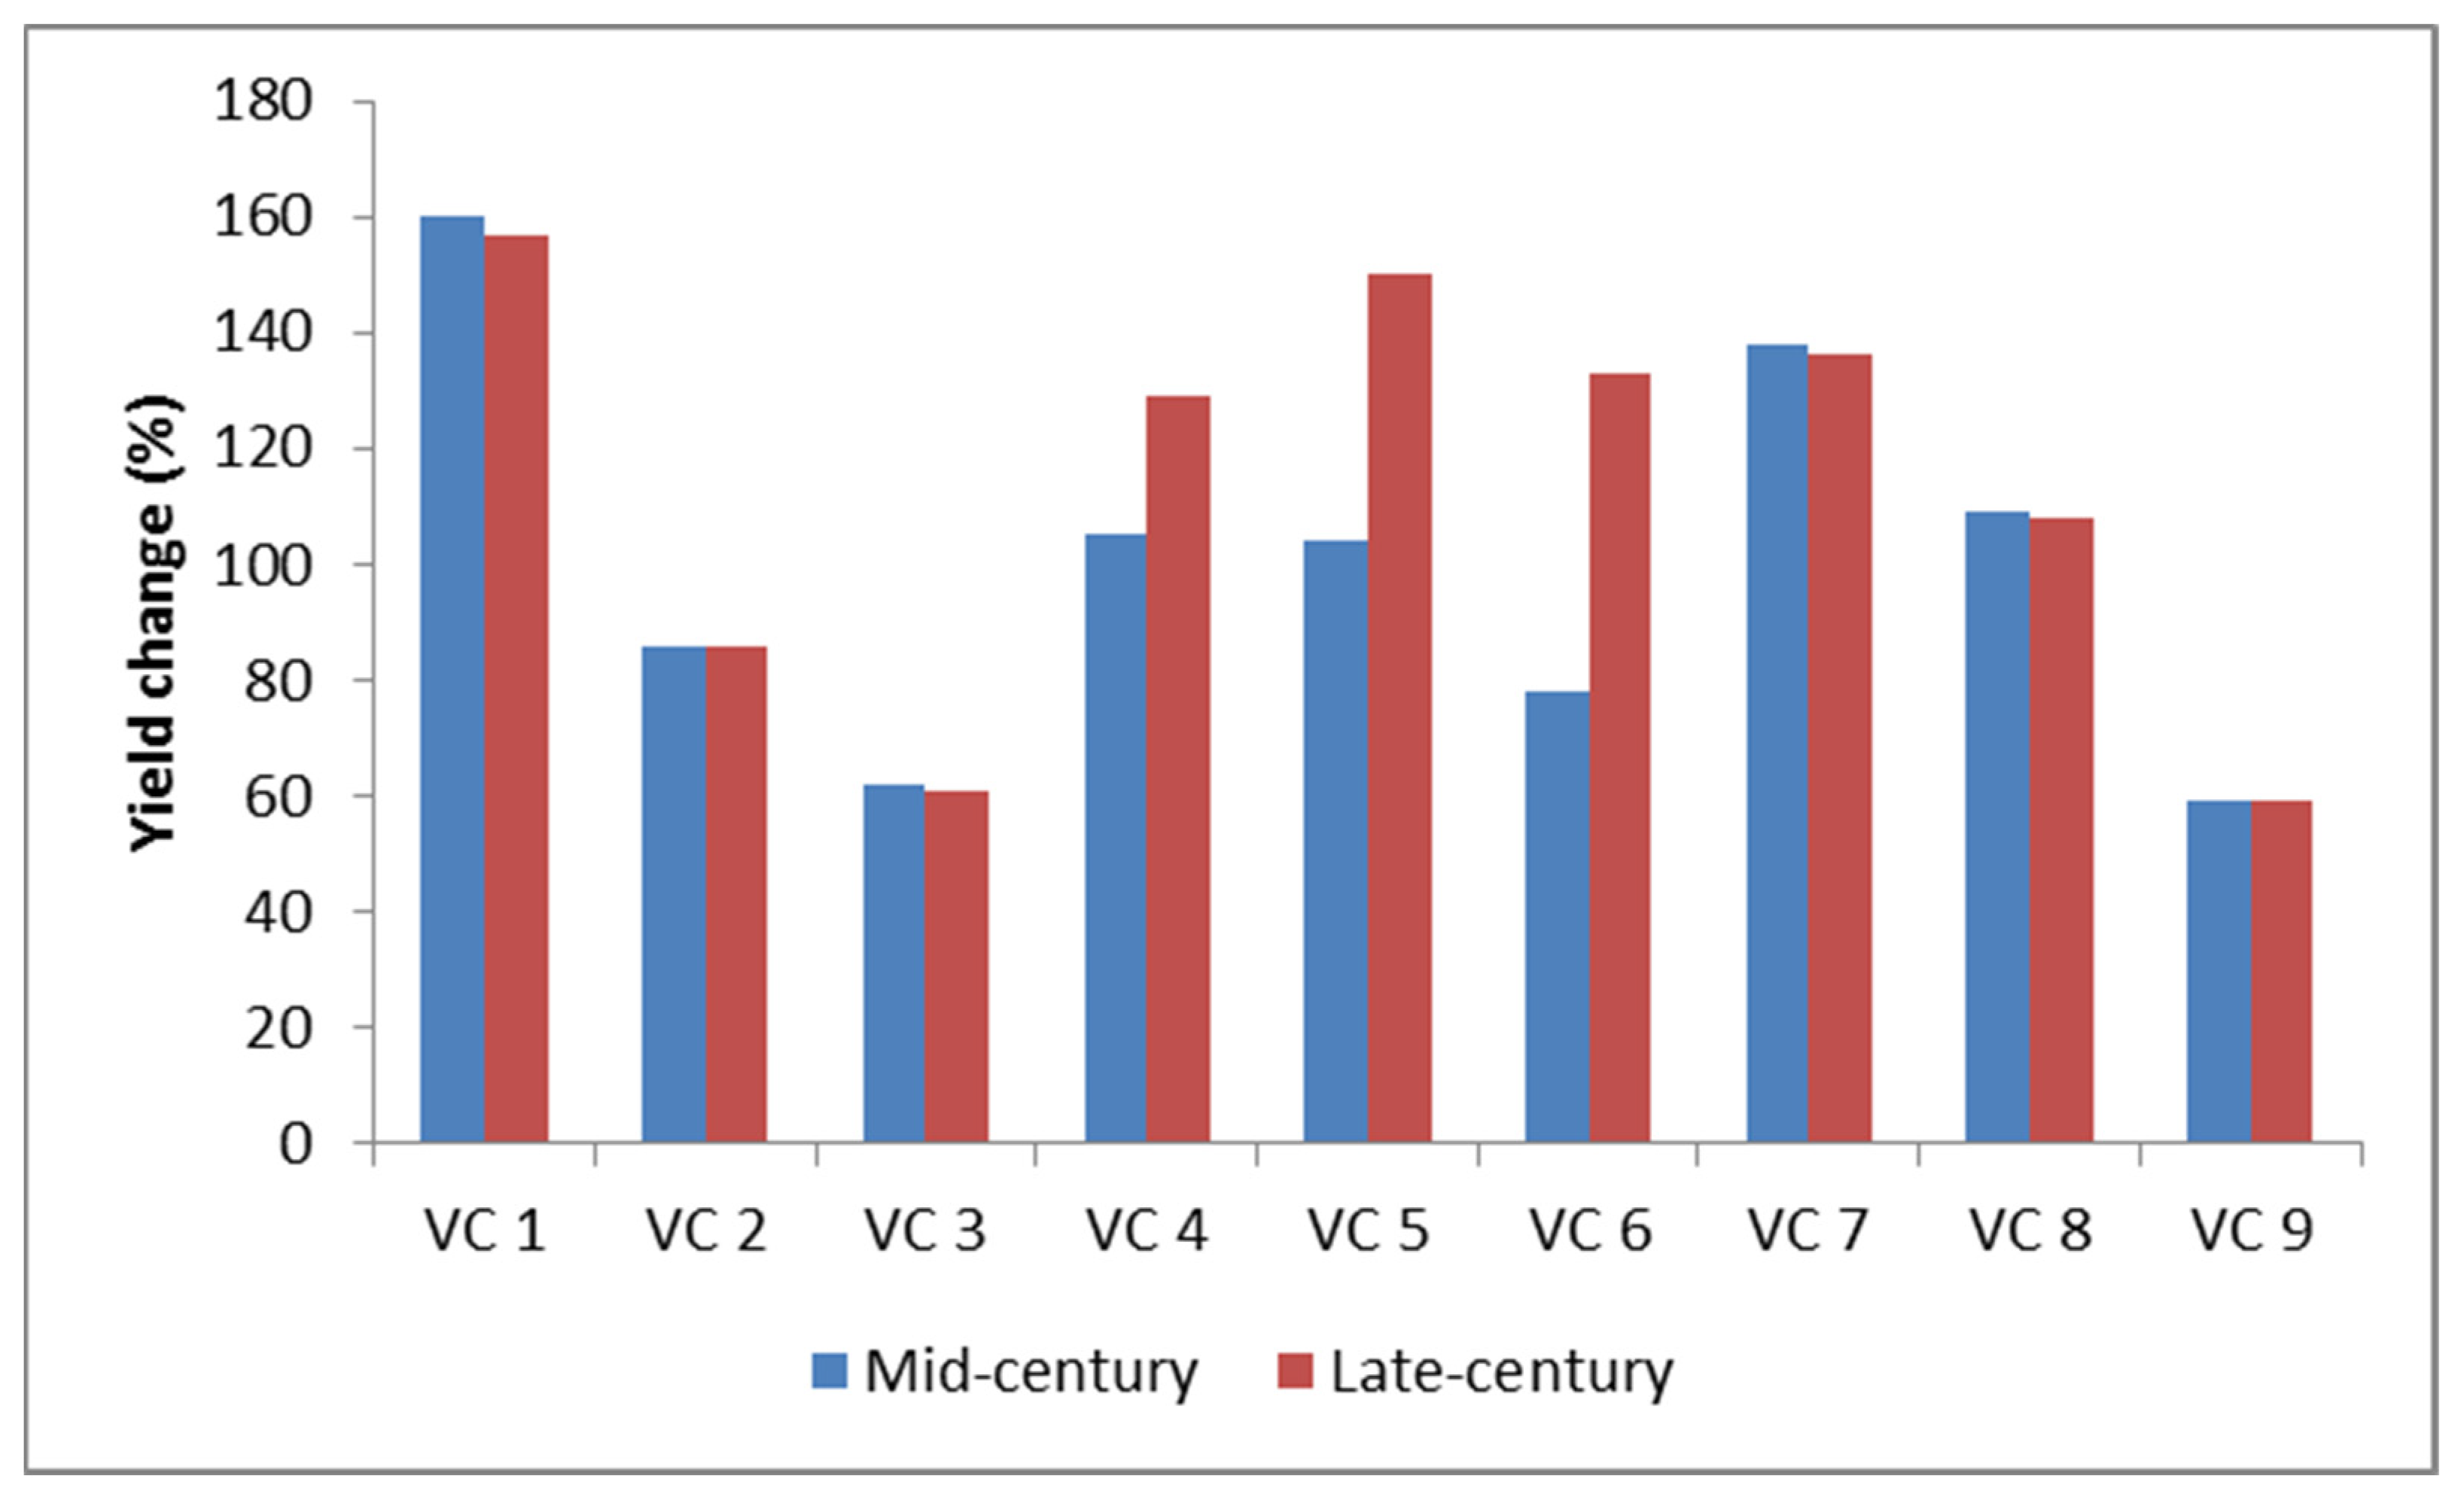
3.7. Yield Potential of Virtual Cultivars in the Future Climate

A delay in sowing date (15 July) resulted in the highest yield for the two future pe-riods and the two emission scenarios, compared to the 15 June and 30 June sowing dates (Figure 14). Figure 15 and Figure 16 show the simulated yield potentials of virtual cultivars under RCP 4.5 and RCP 8.5, respectively. The yield potential of virtual cultivars increased up to 160% and 149% during mid-century and late-century, respectively, under RCP 4.5, and yield increased by 160% and 157% during mid-century and late-century, respectively, under RCP 8.5, compared to the reference cultivar baseline yield.

4. Discussion

From the results presented, the maximum and minimum temperatures are projected to increase up to 4.4 °C and 2.6 °C, respectively, during the mid-century, and up to 5.5 °C and 3.9 °C, respectively, in the late-century. This result is consistent with a study by [56], who reported increases in mean seasonal minimum and maximum temperatures of up to 5.9 °C and 6 °C, respectively, in the late century. Unlike temperature, projection of the growing season precipitation showed a decreasing trend throughout the growing period, except in July. Previous studies also reported a decline in precipitation in Ethiopia. For instance, [57] reported a reduction in precipitation from May to August from 2071 to 2100 relative to the 1961–1990 baseline period. A study by [58] also reported that Kiremt season (from June to September) will be drier in the 2020s, 2050s, and 2080s in western Ethiopia, relative to the 1961–1990 baseline period. Kiremt rainfall showed a decline of up to −68% by 2080 compared to the 1971–1990 baseline period [59], with frequent, intense, and long episodes of drought incidences in the future [60].
Grain yield might decline, either due to an increase in temperatures and/or a decrease in rainfall, especially if water stress occurs at the grain-filling stage, which is yield sensitive [61]. The decreasing pattern observed in wheat yield across the two climate scenarios and time period can be associated with water shortages during flowering and grain-filling stages, as a result of drought. Since Dandaa and Digelu are late-maturing varieties [62], the reduction in yield of these varieties with early planting might be due to a shortage of moisture and heat stress. Using an early maturing variety is necessary to decrease or avoid the heat stress and risks due to water shortages [63]. The early maturing cultivar Kakaba did not show a reduction on any sowing dates, due to the advance in anthesis stage on which risk of crop exposure to heat stress at the sensitive grain-filling stage is decreased or avoided; this resulted in an increment of yields [64].
The present study revealed that, under the average GHGs emission scenarios (RCP4.5), Kakaba, with the early sowing date, showed better adaptation potential compared to Dandaa. This means that Kakaba exhibited good performance under all the aforementioned scenarios and time scales, especially when it is sown early. Depending on the variety and environment, some crops have a tendency for better yield gains under a low emission scenario, while some others perform better in higher emission scenarios [47]. Several studies reported the impact of new or improved varieties on productivity [65]; for instance, reported new varieties of sorghum are more climate-change resilient than old varieties. A study on the impact of improved wheat-variety adoption on food security found that an increase in farm area by 1 unit under improved wheat variety cultivation will enhance food security by 2.9% [24]. A study by [66] reported a 5–17% gain in yields using new wheat varieties in Pakistan. A study by [67] focused on the effects of the adoption of an improved maize variety on productivity, and reported an increase in maize yields of 574 kg/ha in Nigeria. By using improved seed technologies, smallholder farmers increased yields by 26.42%, 15.33%, and 4% for maize, soybean, and wheat, respectively, in Ethiopia [68].
In the present study, we have identified virtual cultivars with the best combinations of cultivar parameters to achieve the best possible wheat yield under the changing climate. The virtual cultivar parameters could provide plant scientists and wheat breeders with a road map for selection of traits with high yield potential for wheat under future climatic conditions.
With climate change, old crop varieties, sowing time, as well as crop management practices, need to be improved by taking into account future climate. Even though the cropping system is still rain-fed, new crop varieties incorporate biotic and abiotic stress features, such as high temperature and water stress. The cropping calendar should be revised and updated by climate services each year to support farmers, due to the current shift in rainy seasons.

5. Conclusions

Generally, climate change adaptation research across Ethiopia has not been given enough attention in the past decades. This study adopted the most popular DSSAT CERES-Wheat model and the multi-model ensemble of GCMs from the MarkSim weather generator to dissect and examine the most prolific wheat cultivars and the most appropriate sowing dates for wheat production in the face of drought in Kulumsa in the 21st century.
The results showed that growing season maximum and minimum temperatures are likely to rise up to 5.5 °C and 3.9 °C, respectively, in the late-century under RCP 8.5. Precipitation will decrease throughout the growing season, except in July, during mid-century and late-century under RCP 4.5 and RCP 8.5. In response to climate change threats, many countries have been implementing adaptation measures in the agricultural sectors. However, the level of practice in applying adaptation measures varies from country to country and crop to crop, due to differences in climate, access to technology, culture, institutions, etc. In this study, we found that adjusting sowing date and using new or improved varieties can help in enhancing wheat yield in the study area. Late sowing of the Dandaa cultivar is recommended if GHG emissions are cut off at least to the average scenario, while the Kakaba cultivar was the best option when emissions are high. However, the adoption of Kakaba with early sowing dates would give a good yield gain under all scenarios and time periods. Therefore, late sowing for Dandaa is an optimistic choice under the low GHG emission scenario, while Kakaba performed well under both low and high emissions. The study, therefore, makes the following major conclusions:
(1)
For early sowing dates, yield decreased up to 5% and 4% for Dandaa and Digelu cultivars, respectively, for the future period, except in the 2080s, of RCP 8.5.
(2)
The Dandaa cultivar with a delay in the sowing date showed better adaptation potential by increasing its yield up to about 140 kg/ha and 148 kg/ha for mid-century and late-century, respectively, under RCP4.5. However, the Kakaba cultivar with early sowing dates demonstrated higher adaptation potential by increasing yield up to 142 kg/ha and 170kg/ha in the mid-century and late-century, respectively, under RCP 8.5.
(3)
The yield potential of virtual cultivars for late sowing dates increased up to 160% and 149% during mid-century and late-century, respectively, under RCP 4.5, and yield increased by 160% and 157% during mid-century and late-century, respectively, under RCP 8.5, compared to the reference cultivar baseline yield.
Considering experimental data scarcity in most African countries such as Ethiopia, this study used only five years of baseline data for calibration and validation of the DSSAT model for one specific region. Hence, there is a need for more research to refine the calibration for different wheat varieties by adding more datasets from different locations and for a longer period of time.
Using an ensemble of four GCMs under two emission scenarios from the CMIP5, this study examined the effects of adaptation measures on the three wheat cultivars studied under future climate scenarios. These findings can be useful for farmers in planning crop and water management strategies to improve the region’s productivity. However, future studies need to consider using up-to-date climate models and scenarios from CMIP6 SSP for more detailed analysis.

Author Contributions

Conceptualization, T.D. and M.A.; methodology, T.D. and M.A.; software, T.D. and M.A.; formal analysis, T.D.; resources, Y.X.; data curation, A.G. and G.T.; writing—original draft preparation, T.D. and A.G.; supervision, Y.X. All authors have read and agreed to the published version of the manuscript.

Funding

The data that support the findings of this study are available from Kulumsa Agricultural Research Center and National Meteorology Agency of Ethiopia. The data are not yet publicly available due to efforts to publish it in a data journal.

Data Availability Statement

The data that support the findings of this study are available upon reasonable request from the corresponding author and/or from Kulumsa Agricultural Research Center and National Meteorology Agency of Ethiopia. The data are not yet publicly available due to efforts to publish it in a data journal.

Acknowledgments

The authors acknowledge the Organization for Women in Science for the Developing World (OWSD) and the Swedish International Development Cooperation Agency (Sida) for providing a PhD fellowship opportunity to the first author.

Conflicts of Interest

The authors declare no conflict of interest.

References

  1. IPCC. Summary for Policymakers. In Climate Change 2021: The Physical Science Basis. Contribution of Working Group I to the Sixth Assessment Report of the Intergovernmental Panel on Climate Change; Masson-Delmotte, V., Zhai, P., Pirani, A., Connors, S.L., Péan, C., Berger, S., Caud, N., Chen, Y., Goldfarb, L., Gomis, M.I., et al., Eds.; Cambridge University Press: Cambridge, UK, 2021; p. 41. [Google Scholar]
  2. Asseng, S.; Foster, I.; Turner, N.C. The impact of temperature variability on wheat yields. Glob. Chang. Biol. 2011, 17, 997–1012. [Google Scholar] [CrossRef]
  3. Ren, S.; Qin, Q.; Ren, H. Contrasting wheat phenological responses to climate change in global scale. Sci. Total Environ. 2019, 665, 620–631. [Google Scholar] [CrossRef]
  4. Rezaei, E.E.; Siebert, S.; Hüging, H.; Ewert, F. Climate change effect on wheat phenology depends on cultivar change. Sci. Rep. 2018, 8, 4891. [Google Scholar] [CrossRef] [Green Version]
  5. Liu, B.; Asseng, S.; Müller, C.; Ewert, F.; Elliott, J.; Lobell, D.B.; Martre, P.; Ruane, A.C.; Wallach, D.; Jones, J.W. Similar estimates of temperature impacts on global wheat yield by three independent methods. Nat. Clim. Chang. 2016, 6, 1130–1136. [Google Scholar] [CrossRef]
  6. Asseng, S.; Ewert, F.; Martre, P.; Rötter, R.P.; Lobell, D.B.; Cammarano, D.; Kimball, B.A.; Ottman, M.J.; Wall, G.W.; Whit, J.W. Rising temperatures reduce global wheat production. Nat. Clim. Chang. 2014, 5, 143–147. [Google Scholar] [CrossRef]
  7. Zhao, C.; Liu, B.; Piao, S.; Wang, X.; Lobell, D.B.; Huang, Y.; Huang, M. Temperature increase reduces global yields of major crops in four independent estimates. Proc. Nat. Acad. Sci. USA 2017, 114, 9326–9331. [Google Scholar] [CrossRef] [Green Version]
  8. Ray, D.K.; West, P.C.; Clark, M.; Gerber, J.S.; Prishchepov, V.; Chatterjee, S. Climate change has likely already affected global food production. PLoS ONE 2019, 14, e0217148. [Google Scholar] [CrossRef]
  9. Gourdji, S.M.; Sibley, A.M.; Lobell, D.B. Global crop exposure to critical high temperatures in the reproductive period: Historical trends and future projections. Environ. Res. Lett. 2013, 8, 024041. [Google Scholar] [CrossRef]
  10. Cibangu, S.K. Human Dark Skin and Equatorial Africa: Toward a Critique. Curr. Res. J. Soc. Sci. 2015, 7, 49–66. [Google Scholar] [CrossRef]
  11. Herold, N.; Alexander, L.; Green, D.; Donat, M. Greater increases in temperature extremes in low versus high income countries. Environ. Res. Lett. 2017, 12, 26–30. [Google Scholar] [CrossRef] [Green Version]
  12. Kheir, A.M.S.; El Baroudy, A.; Aiad, M.A.; Zoghdan, M.G.; Abd El-Aziz, M.A.; Ali, M.G.M.; Fullen, M.A. Impacts of rising temperature, carbon dioxide concentration and sea level on wheat production in North Nile delta. Sci. Total Environ. 2019, 651, 3161–3173. [Google Scholar] [CrossRef] [PubMed]
  13. Tadesse, W.; Bishaw, Z.; Assefa, S. Wheat production and breeding in Sub-Saharan Africa Challenges and opportunities in the face of climate change. Int. J. Clim. Chang. Strateg. Manag. 2018, 11, 696–715. [Google Scholar] [CrossRef] [Green Version]
  14. Demeke, M.; Di Marcantonio, F. Analysis of Incentives and Disincentives for Wheat in Ethiopia; Technicalnotes Series; MAFAP; FAO: Rome, Italy, 2013. [Google Scholar]
  15. World Bank. Cereal Market Performance In Ethiopia: Policy Implications for Improving Investments in Maize and Wheat Value Chain; World Bank: Washington, DC, USA, 2018; pp. 1–89. [Google Scholar]
  16. Haileselassie, B.; Habte, D.; Haileselassie, M.; Gebremeskel, G. Effects of mineral nitrogen and phosphorus fertilizers on yield and nutrient utilization of bread wheat (Tritcum aestivum) on the sandy soils of Hawzen District, Northern Ethiopia. Agric. For. Fish. 2014, 3, 189–198. [Google Scholar]
  17. Tufa, Z.D.; Getnet, M.; Nigatu, L. Modeling Impacts of Climate Change on Bread Wheat (Triticum Aestivum l.) Productivity in Bale Highlands, South Eastern Ethiopia: Case of Robe Area. Asian J. Appl. Sci. Eng. 2018, 7, 29–40. [Google Scholar]
  18. Tesfaye, S.; Bedada, B.; Mesay, Y. Impact of improved wheat technology adoption on productivity and income in Ethiopia. Afr. Crop Sci. J. 2016, 24, 127–135. [Google Scholar] [CrossRef] [Green Version]
  19. Evangelista, P.; Young, N.; Burnett, J. How will climate change spatially affect agriculture production in Ethiopia? Case studies of important cereal crops. Clim. Chang. 2013, 119, 855–873. [Google Scholar]
  20. Bryan, E.; Deressa, T.; Gbetibouo, G.A.; Ringler, C. Adaptation to Climate Change in Ethiopia and South Africa: Options and Constraints. Environ. Sci. Policy 2009, 12, 413–426. [Google Scholar] [CrossRef]
  21. NMA. Climate Change National Adaptation Programme of Action (NAPA) of Ethiopia; National Meteorological Services Agency, Ministry of Water Resources: Addis Ababa, Ethiopia, 2007; pp. 1–85.
  22. Araya, A.; Prasad, P.V.V.; Zambreski, Z.; Gowda, P.H.; Ciampitti, I.A.; Assefa, Y.; Girma, A. Spatial analysis of the impact of climate change factors and adaptation strategies on productivity of wheat in Ethiopia. Sci. Total Environ. 2020, 731, 139094. [Google Scholar] [CrossRef]
  23. Ketema, M.; Kassa, B. Impact of Technology on Smallholder Wheat Production in Bale Highlands of Ethiopia: Application of Output Decomposition Model. Turk. J. Agric. Food Sci. Technol. 2016, 4, 446–454. [Google Scholar] [CrossRef] [Green Version]
  24. Shiferaw, B.; Kassie, M.; Jaleta, M.; Yirga, C. Adoption of improved wheat varieties and impacts on household food security in Ethiopia. Food Policy 2014, 44, 272–284. [Google Scholar] [CrossRef]
  25. Howden, S.M.; Soussana, J.-F.; Tubiello, F.N.; Chhetri, N.; Dunlop, M.; Meinke, H. Adapting agriculture to climate change. Proc. Nat. Acad. Sci. USA 2007, 104, 19691–19696. [Google Scholar] [CrossRef] [Green Version]
  26. Nhemachena, C.; Nhamo, L.; Matchaya, G.; Nhemachena, C.R.; Muchara, B.; Karuaihe, S.T.; Mpandeli, S. Climate Change Impacts on Water and Agriculture Sectors in Southern Africa: Threats and Opportunities for Sustainable Development. Water 2020, 12, 2673. [Google Scholar] [CrossRef]
  27. Peng, B.; Guan, K.; Tang, J.; Ainsworth, E.A.; Asseng, S.; Bernacchi, C.J.; Cooper, M.; Delucia, E.H.; Elliott, J.W.; Ewert, F. Towards a multiscale crop modelling framework for climate change adaptation assessment. Nat. Plants 2020, 6, 338–348. [Google Scholar] [CrossRef]
  28. IPCC. Climate Change 2007: Impacts, Adaptation and Vulnerability. Contribution of Working Group II to the Fourth Assessment Report of the Intergovernmental Panel on Climate Change; Parry, M.L., Canziani, O.F., Palutikof, J.P., Van der, P.J., Hanson, C.E., Eds.; Cambridge University Press: Cambridge, UK, 2007. [Google Scholar]
  29. EPCC. Ethiopian Panel on Climate Change (2015), First Assessment Report, Working Group I Physical Science Basis; Ethiopian Academy of Science: Addis Ababa, Ethiopia, 2015; p. 105. [Google Scholar]
  30. Abera, E.A.; Getnet, M.; Nigatu, L. Impacts of Climate Change on Bread Wheat (Triticum aestivum L) Yield in Adet, North Western Ethiopia. J. Pet. Environ. Biotechnol. 2019, 10, 396. [Google Scholar]
  31. Degefie, D.T.; Seid, J.; Gessesse, B.; Bedada, T.B. Agricultural drought projection in Ethiopia from 1981 to 2050: Using coordinated regional climate downscaling experiment climate data for Africa. In Extreme Hydrology and Climate Variability Monitoring, Modelling, Adaptation and Mitigation; Melesse, A.M., Abtew, W., Senay, G., Eds.; Elsevier: Amsterdam, The Netherlands, 2019; pp. 311–323. [Google Scholar]
  32. Gidey, E.; Dikinya, O.; Sebego, R.; Segosebe, E.; Zenebe, A. Predictions of future meteorological drought hazard (~2070) under the representative concentration path (RCP) 4.5 climate change scenarios in Raya, Northern Ethiopia. Model. Earth Syst. Environ. 2018, 4, 475–488. [Google Scholar]
  33. Lindi, S.; Hone, M.; Meskelu, E.; Iticha, B.; Admasu, W.; Tadesse, K. Integrated Effect of Different Mulching and Furrow Irrigation Techniques on Potato (Solanum tuberosum L.) Yield and Water Productivity at Kulumsa, Ethiopia. Acad. Res. J. Agric. Sci. Res. 2018, 6, 488–494. [Google Scholar]
  34. Wolde, T.; Eticha, F.; Alamerew, S.; Assefa, E.; Dutamo, D.; Birhanu, M. Trait Associations in Some Durum Wheat (Triticum durum L.) Accessions among Yield and Yield related Traits at Kulumsa, South Eastern Ethiopia. Adv. Crop Sci. Technol. 2016, 4, 234. [Google Scholar]
  35. Fikre, G.; Alamerew, S.; Zerihun, T. Genetic Variability Studies in Bread Wheat (Triticum Aestivum L.) Genotypes at Kulumsa Agricultural Research Center, South East Ethiopia. J. Biol. Agric. Healthc. 2015, 5, 89–99. [Google Scholar]
  36. Amanuel, G.; Kühne, R.F.; Tanner, D.G.; Vlek, P.L.G. Biological nitrogen fixation in faba bean (Vicia faba L.) in the Ethiopian highlands as affected by P fertilization and inoculation. Biol. Fertil. Soils 2000, 32, 353–359. [Google Scholar]
  37. Gebre-Mariam, H.; Tanner, D.G.; Hulluka, M. Wheat Research in Ethiopia: A Historical Perspective; Institute of Agricultural Research and International Maize and Wheat Improvement Center: Addis Ababa, Ethiopia, 1991; p. 392. [Google Scholar]
  38. Ziska, L.H.; Fleisher, D.H.; Linscombe, S. Ratooning as an adaptive management tool for climatic change in rice systems along a north-south transect in the southern Mississippi valley. Agric. For. Meteorol. 2018, 263, 409–416. [Google Scholar] [CrossRef]
  39. Jones, P.G.; Thornton, P.K. Generating downscaled weather data from a suite of climate models for agricultural modelling applications. Agric. Syst. 2013, 114, 1–5. [Google Scholar] [CrossRef]
  40. Hadgu, G.; Tesfaye, K.; Mamo, G. Analysis of climate change in Northern Ethiopia: Implications for agricultural production. Theor. Appl. Clim. 2014, 121, 733–747. [Google Scholar] [CrossRef]
  41. Muluneh, A. Impact of climate change on soil water balance, maize production, and potential adaptation measures in the Rift Valley drylands of Ethiopia. J. Arid Environ. 2020, 179, 104195. [Google Scholar] [CrossRef]
  42. Sorecha, E.M.; Tsehai, K.K.; Hadgu, G.; Lupi, A. Exploring the Impacts of Climate Change on Chickpea (Cicer arietinum L.) Production in Central Highlands of Ethiopia. Acad. Res. J. Agri. Sci. Res. 2017, 5, 140–150. [Google Scholar]
  43. Woldesenbet, T.A.; Elagib, N.A.; Ribbe, L.; Jürgen, H. Catchment response to climate and land use changes in the Upper Blue Nile sub-basins, Ethiopia. Sci. Total Environ. 2018, 644, 193–206. [Google Scholar] [CrossRef] [PubMed]
  44. Yadeta, D.; Kebede, A.; Tessema, N. Potential evapotranspiration models evaluation, modelling, and projection under climate scenarios, Kesem sub-basin, Awash River basin, Ethiopia. Model. Earth Syst. Environ. 2020, 6, 2165–2176. [Google Scholar] [CrossRef]
  45. Jones, P.G.; Thornton, P.K.; Diaz, W.; Wilkens, P. MarkSim: A Computer Tool that Generates Simulated Weather Data for Crop Modeling and Risk Assessment; Centro International de Agricultura Tropical (CIAT): Cali, Colombia, 2002; pp. 1–87. [Google Scholar]
  46. Ahmed, F.; Rafii, M.Y.; Ismail, M.R.; Juraimi, A.S.; Rahim, H.A.; Asfaliza, R.; Latif, M.A. Waterlogging tolerance of crops: Breeding, mechanism of tolerance, molecular approaches, and future prospects. Biomed. Res. Int. 2013, 2013, 963525. [Google Scholar] [CrossRef] [PubMed]
  47. Maraun, D.; Shepherd, T.G.; Widmann, M.; Zappa, G.; Walton, D.; Gutiérrez, J.M.; Hagemann, S.; Richter, I.; Soares, P.M.M.; Hall, A. Towards process-informed bias correction of climate change simulations. Nat. Clim. Chang. 2017, 7, 764–773. [Google Scholar] [CrossRef] [Green Version]
  48. Aqilah Tukimat, N.N. Assessing the implementation of bias correction in the climate prediction. IOP Conf. Ser. Mater. Sci. Eng. 2018, 342, 012004. [Google Scholar] [CrossRef]
  49. Shrestha, S.; Shrestha, M.; Babel, M.S. Modelling the potential impacts of climate change on hydrology and water resources in the Indrawati River Basin, Nepal. Environ. Earth Sci. 2016, 75, 280. [Google Scholar] [CrossRef]
  50. Rezzoug, W.; Gabrielle, B.; Suleiman, A.; Benabdeli, K. Application and evaluation of the DSSAT-wheat in the Tiaret region of Algeria. Afr. J. Agric. Res. 2008, 3, 284–296. [Google Scholar]
  51. Gangadhar Rao, D. Validation Of Corn, Soybean, And Wheat Models In Dssat For Assessing Climate Change Impacts On Midwest Crop Production. In Effects of Climate Change and Variability on Agricultural Production Systems; Doering, O.C., Randolph, J.C., III, Southworth, J., Pfeifer, R.A., Eds.; Kluwer Academic Publishers: Hyderabad, India, 2002; pp. 101–125. [Google Scholar]
  52. AGMIP. Guide for Regional Integrated Assessments: Handbook of Methods and Procedures Version 5.1; World Scientific Publishing Co Pte Ltd.: Singapore, 2014; p. 53. [Google Scholar]
  53. Lobell, D.B. Climate change adaptation in crop production: Beware of illusions. Glob. Food Sec. 2014, 3, 72–76. [Google Scholar] [CrossRef]
  54. Senapati, N.; Brown, H.E.; Semenov, M.A. Raising genetic yield potential in high productive countries: Designing wheat ideotypes under climate change. Agric. For. Meteorol. 2019, 271, 33–45. [Google Scholar] [CrossRef]
  55. Rötter, R.P.; Tao, F.; Höhn, J.G.; Palosuo, T. Use of crop simulation modelling to aid ideotype design of future cereal cultivars. J. Exp. Bot. 2015, 66, 3463–3476. [Google Scholar] [CrossRef] [Green Version]
  56. Araya, A.; Hoogenboom, G.; Luedeling, E.; Hadgu, K.M.; Kisekka, I.; Martorano, L.G. Assessment of maize growth and yield using crop models under present and future climate in southwestern Ethiopia. Agric. For. Meteorol. 2015, 214–215, 252–265. [Google Scholar]
  57. Ongoma, V.; Chena, H.; Gaoa, C. Projected changes in mean rainfall and temperature over east Africa based on CMIP5 models. Int. J. Climatol. 2017, 38, 1375–1392. [Google Scholar] [CrossRef]
  58. Gebrechorkos, S.H.; Hülsmann, S.; Bernhofer, C. Regional climate projections for impact assessment studies in East Africa. Environ. Res. Lett. 2019, 14, 044031. [Google Scholar] [CrossRef]
  59. Kassie, B.T.; Rötter, R.P.; Hengsdijk, H.; Asseng, S.; Van Ittersum, M.K.; Kahiluoto, H.; Van Keulen, H. Climate variability and change in the Central Rift Valley of Ethiopia: Challenges for rainfed crop production. J. Agric. Sci. 2013, 152, 58–74. [Google Scholar] [CrossRef]
  60. Haile, G.G.; Tang, Q.; Hosseini-Moghari, S.; Liu, X.; Gebremicael, T.G.; Leng, G.; Kebede, A.; Xu, X.; Yun, X. Projected Impacts of Climate Change on Drought Patterns Over East Africa Earth ’ s Future. Earth’s Future 2020, 10, e2020EF001502. [Google Scholar]
  61. Eitzinger, J.; Štastná, M.; Žalud, Z.; Dubrovský, M.A. simulation study of the effect of soil water balance and water stress on winter wheat production under different climate change scenarios. Agric. Water Manag. 2003, 61, 195–217. [Google Scholar] [CrossRef]
  62. Hei, N.; Shimelis, H.A.; Laing, M. Appraisal of farmers ’ wheat production constraints and breeding priorities in rust prone agro-ecologies of Ethiopia. Afr. J. Agric. Res. 2017, 12, 944–952. [Google Scholar]
  63. Bassu, S.; Asseng, S.; Motzo, R.; Giunta, F. Optimising sowing date of durum wheat in a variable Mediterranean environment. F. Crop. Res. 2009, 111, 109–118. [Google Scholar] [CrossRef]
  64. Yang, C.; Fraga, H.; van Ieperen, W.; Trindade, H.; Santos, J.A. Effects of climate change and adaptation options on winter wheat yield under rainfed Mediterranean conditions in southern Portugal. Clim. Change 2019, 154, 159–178. [Google Scholar] [CrossRef] [Green Version]
  65. Sultan, B.; Guan, K.; Kouressy, M.; Biasutti, M.; Piani, C.; Hammer, G.L.; McLean, G.; Lobell, D.B. Robust features of future climate change impacts on sorghum yields in West Africa. Environ. Res. Lett. 2014, 9, 104006. [Google Scholar] [CrossRef]
  66. Joshi, K.D.; Rehman, A.U.; Ullah, G.; Nazir, M.F.; Zahara, M.; Akhtar, J.; Khan, M.; Baloch, A.; Khokhar, J.; Ellahi, E. Acceptance and competitiveness of new improved wheat varieties by smallholder farmers. J. Crop Improv. 2017, 31, 608–627. [Google Scholar] [CrossRef] [Green Version]
  67. Abdoulaye, T.; Wossen, T.; Awotide, B. Impacts of improved maize varieties in Nigeria: Ex-post assessment of productivity and welfare outcomes. Food Secur. 2018, 10, 369–379. [Google Scholar] [CrossRef]
  68. Dibaba, R.; Hagos, A.; Bekele, A. Effect of Climate Change on Agricultural Technologies and Determinants of Adaptation Strategies by Small-holder Farmers in Benishangul-Gumuz Regional State of Ethiopia. Am. Res. J. Bus. Manag. 2019, 5, 1–17. [Google Scholar] [CrossRef]
Figure 1. Map of the study area.
Agronomy 12 00037 g001
Figure 2. Layout of simulation for the future period.
Agronomy 12 00037 g002
Figure 3. Change in annual mean maximum and minimum temperatures from 1981 to 2015. Note: Tmin, minimum temperature; Tmax, maximum temperature.
Agronomy 12 00037 g003
Figure 4. Variation in annual precipitation from 1981 to 2015.
Agronomy 12 00037 g004
Figure 5. Monthly climate cycle during 1981–2000 and 2001–2015 time periods. Note: Tmin, minimum temperature; Tmax, maximum temperature; Pre, precipitation.
Agronomy 12 00037 g005
Figure 6. Change in accumulated temperature during the wheat growing season from 1981 to 2015.
Agronomy 12 00037 g006
Figure 7. Comparison of average monthly maximum temperature, minimum temperature, and precipitation of four GCMs and their means against observed values for the period from 1981 to 2005. Note: for CSIRO-MK3-6-0 (1st horizontal panel), HadGEM2-ES (2nd horizontal), MIROC5 (3rd horizontal panel), MRI-CGCM3 (4th horizontal panel), and mean of GCMs (5th horizontal panel).
Agronomy 12 00037 g007aAgronomy 12 00037 g007b
Figure 8. Changes in the growing season temperature and precipitation (June to November) for mid-century and late-century under RCP 4.5 and RCP 8.5, relative to the baseline period (1981–2015) at Kulumsa station: (A) for maximum and minimum temperature (B) for precipitation.
Agronomy 12 00037 g008
Figure 9. Regression analyses of simulated and observed values for Dandaa, Digelu, and Kakaba cultivars: (A) days to anthesis, (B) days to maturity, (C) grain yield.
Agronomy 12 00037 g009aAgronomy 12 00037 g009b
Figure 10. Yield change of wheat under future climate scenarios in Ethiopia. Note: For each variety, the left box plot is for early sowing, middle for mid sowing, and the right is for late sowing; top layer left is simulation for the mid-century under RCP 4.5, right for late-century under RCP 4.5, bottom layer left for mid-century under RCP 8.5, and right for late-century under RCP 8.5, compared to the reference yield. In total, 1080 simulations (3 cultivars × 3 sowing dates × 60 years × 2 emission scenarios).
Agronomy 12 00037 g010
Figure 11. Change in anthesis dates for Dandaa, Digelu, and Kakaba wheat cultivars.
Agronomy 12 00037 g011
Figure 12. Change in maturity dates for Dandaa, Digelu, and Kakaba wheat cultivars.
Agronomy 12 00037 g012
Figure 13. Wheat yield gain due to adaptation measures.
Agronomy 12 00037 g013
Figure 14. Simulated wheat yield for virtual cultivars: (A) for mid-century under RCP 4.5, (B) for late-century under RCP 4.5, (C) for mid-century under RCP 8.5, (D) for late-century under RCP 8.5.
Agronomy 12 00037 g014
Figure 15. Simulated yield changes of virtual cultivars sown on 15 July in mid-century and late-century under RCP 4.5, compared to reference cultivar baseline yield.
Agronomy 12 00037 g015
Figure 16. Simulated yield changes of virtual cultivars sown on 15 July in mid-century and late-century under RCP 8.5, compared to reference cultivar baseline yield.
Agronomy 12 00037 g016
Table 1. In situ data collected from Ethiopia.
DataDescriptionSource
ClimateDaily data from 1981 to 2015: maximum temperature, minimum temperature, precipitation, and solar radiation at Kulumsa stationNational Meteorology Agency of Ethiopia
CropRow spacing, sowing date, days to emergence, days to anthesis, days to maturity, grain yield, fertilizer application, etc. of Digelu, Kakaba and Dandaa cultivars from 2011 to 2015Kulumsa Agricultural Research Center, Ethiopia
SoilOrganic carbon, pH in water, cation exchange capacity, bulk density, total nitrogen, etc.Technical Reports of National Soil Research Center of Ethiopian Agricultural Research Organization
Table 2. Crop management and phenology information collected from Kulumsa Agricultural Research Center.
CultivarSowing DateRow SpacingDate of EmergenceAnthesis DateMaturity DateHarvesting Date
Dandaa25/06/201120 cm30/06/201114/09/201116/11/201130/11/2011
29/06/201220 cm05/07/201215/09/201224/10/201211/11/2012
30/06/201320 cm04/07/201314/09/201330/10/201315/11/2013
02/07/201420 cm06/07/201426/08/201416/10/201403/11/2014
05/07/201520 cm09/07/201510/09/201522/10/201506/11/2015
Digelu25/06/201120 cm01/07/201104/09/201116/10/201103/11/2011
29/06/201220 cm06/07/201214/09/201227/10/201214/11/2012
30/06/201320 cm05/07/201315/09/201304/11/201321/11/2013
27/06/201420 cm02/07/201412/09/201428/10/201414/11/2014
22/06/201520 cm27/06/201507/09/201502/11/201520/11/2015
Kakaba26/06/201120 cm01/07/201128/08/201119/10/201104/11/2011
29/06/201220 cm05/07/201221/08/201229/09/201202/11/2012
27/06/201320 cm01/07/201329/08/201328/10/201313/11/2013
02/07/201420 cm06/07/201420/08/201414/10/201431/10/2014
28/06/201520 cm02/07/201524/08/201514/10/201530/10/2015
Table 3. GCMs used for the study.
GCMInstitutionResolution (Latitude × Longitude)
CSIRO-Mk3.6.0Commonwealth Scientific and Industrial Research Organization and the Queensland Climate Change Centre of Excellence1.875 × 1.875
HadGEM2-ESMet Office Hadley Centre1.2414 × 1.875
MIROC5Japan Agency for Marine–Earth Science and Technology, Atmosphere and Ocean Research
Institute (The University of Tokyo), and National Institute for Environmental Studies
1.4063 × 1.4063
MRI-CGCM3Meteorological Research
Institute
1.125 × 1.125
Table 4. Description of genetic coefficients of the DSSAT CERES-Wheat model.
CoefficientsDefinition
P1VDays, optimum vernalizing temperature, required for vernalization
P1DPhotoperiod response (% reduction in rate/10 h drop in pp)
P5Grain-filling (excluding lag) phase duration (degree day)
G1Kernel number per unit canopy weight at anthesis (kernel number/g)
G2Standard kernel size under optimum conditions (mg)
G3Standard, non-stressed dry weight (total, including grain) of a single
tiller at maturity (g)
PHINTThermal time between the appearance of leaf tips (degree days)
Table 5. Carbon dioxide concentration for current and future periods.
ScenarioYearsCarbon Dioxide Concentration
Current 1980–2009360 ppm
RCP 4.52010–2039423 ppm
RCP 8.52010–2039432 ppm
RCP 4.52040–2069499 ppm
RCP 8.52040–2069571 ppm
RCP 4.52070–2099532 ppm
RCP 8.52070–2099801 ppm
We adopted carbon dioxide concentration by [52].
Table 6. The reference cultivars and the range of virtual cultivar parameters.
ParameterReference Cultivar ValueMinimum ValueMaximum Value
Dandaa Digelu Kakaba
P1V689060
P1D9278810200
P5585777768100999
G11515211050
G22321231080
G31.01.01.30.58
PHINT60606030150
Table 7. The combinations of parameters for the nine virtual cultivars (VC).
ParametersVirtual Cultivars
VC 1VC 2VC 3VC 4VC 5VC 6VC 7VC 8VC 9
P1V184511106411
P1D609484718085657283
P5575589560760717725710812765
G1161713161917262419
G2472732272425282624
G30.41.10.81.31.41.21.51.11.1
PHINT816272626663646262
Table 8. Performance of four GCMs and their means for simulating climate parameters.
StatisticParameter GCM
CSIRO-Mk3.6.0HadGEM2-ESMIROC5MRI-CGCM3Mean of GCMs
R2Maximum temperature0.90.90.70.80.9
Minimum temperature0.90.80.80.90.9
Precipitation0.90.80.60.80.9
RMSEMaximum temperature0.40.50.90.60.3
Minimum temperature0.40.70.60.60.3
Precipitation20.72551.72119.5
Table 9. Genetic coefficients of Dandaa, Digelu, and Kakaba cultivars.
CoefficientsDandaaDigeluKakaba
P1V689
P1D927881
P5585777768
G1151521
G2232123
G31.01.01.3
PHINT606060
Table 10. Crop model validation result.
CultivarParameterRMSEdMER2
DandaaDays to anthesis30.90.80.9
Days to maturity8.70.90.60.9
Yield331.30.9−1.10.8
DigeluDays to anthesis6.40.7−5.40.2
Days to maturity4.10.90.80.9
Yield137.10.90.70.9
KakabaDays to anthesis3.40.90.60.6
Days to maturity4.70.90.50.6
Yield323.10.90.60.9
Publisher’s Note: MDPI stays neutral with regard to jurisdictional claims in published maps and institutional affiliations.

