Article

Biofortification of Diverse Basmati Rice Cultivars with Iodine, Selenium, and Zinc by Individual and Cocktail Spray of Micronutrients

1
Nuclear Institute for Agriculture and Biology (NIAB), Faisalabad 38000, Pakistan
2
Institute of Plant Nutrition and Soil Science, Kiel University, 24118 Kiel, Germany
3
Research Station of Engro Eximp. (Private) Limited, Sheikhupura 54800, Pakistan
4
Faculty of Engineering and Natural Sciences, Sabanci University, Istanbul 34956, Turkey
5
Pakistan Academy of Sciences, Islamabad 44000, Pakistan
*
Author to whom correspondence should be addressed.
Submission received: 17 November 2021 / Revised: 3 December 2021 / Accepted: 6 December 2021 / Published: 27 December 2021
(This article belongs to the Topic Plant Nutrition Biofortification)

Abstract

:
Given that an effective combined foliar application of iodine (I), selenium (Se), and zinc (Zn) would be farmer friendly, compared to a separate spray of each micronutrient, for the simultaneous biofortification of grain crops, we compared effectiveness of foliar-applied potassium iodate (KIO3, 0.05%), sodium selenate (Na2SeO4, 0.0024%), and zinc sulfate (ZnSO4∙7H2O, 0.5%), separately and in their combination (as cocktail) for the micronutrient biofortification of four Basmati cultivars of rice (Oryza sativa L.). Foliar-applied, each micronutrient or their cocktail did not affect rice grain yield, but grain yield varied significantly among rice cultivars. Irrespective of foliar treatments, the brown rice of cv. Super Basmati and cv. Kisan Basmati had substantially higher concentration of micronutrients than cv. Basmati-515 and cv. Chenab Basmati. With foliar-applied KIO3, alone or in cocktail, the I concentration in brown rice increased from 12 to 186 µg kg−1. The average I concentration in brown rice with foliar-applied KIO3 or cocktail was 126 μg kg−1 in cv. Basmati-515, 160 μg kg−1 in cv. Chenab Basmati, 153 μg kg−1 in cv. Kisan Basmati, and 306 μg kg−1 in cv. Super Basmati. Selenium concentration in brown rice increased from 54 to 760 µg kg−1, with foliar-applied Na2SeO4 individually and in cocktail, respectively. The inherent Zn concentration in rice cultivars ranged between 14 and 19 mg kg−1 and increased by 5–6 mg Zn per kg grains by foliar application of ZnSO4∙7H2O and cocktail. The results also showed the existence of genotypic variation in response to foliar spray of micronutrients and demonstrated that a foliar-applied cocktail of I, Se, and Zn could be an effective strategy for the simultaneous biofortification of rice grains with these micronutrients to address the hidden hunger problem in human populations.

1. Introduction

Malnutrition of micronutrients, including iodine (I), selenium (Se), and zinc (Zn), commonly known as hidden hunger, is a serious global health problem [1,2]. By vice of its serious health concerns for over one-third of the world’s population, hidden hunger is imposing an economic burden on the health system of the developing countries, costing about 5% loss in gross domestic product [3]. Deficiencies of these micronutrients not only impair growth and development owing to their essential roles in metabolism but also negatively affect the immune system of the body against virulent pathogens [4,5]. During the current pandemic of COVID-19, it became evident that the disease proved lethal to those with a weak immune system. It has been documented that Se deficiency not only impairs the immune system of the body but also causes the rapid mutation of benign RNA viruses to highly virulent variants [6,7,8]. Plenty of scientific evidences from over the past 50 years revealed that Zn is not only a strong antiviral agent but also acts as a stimulant of antiviral immunity [4]. Zinc supplementation with Zn-ionophores can impair the replication of RNA viruses including equine arteritis virus (EAV), influenza virus, and SARS coronavirus (SARS-CoV) [9,10]. Zinc interferes with the viral replication cycle through a number of mechanisms, including (1) inhibition of viral uncoating, (2) free virus inactivation, (3) viral genome transcription, and (4) viral protein translation and polyprotein processing [4,11]. The antiviral properties of Zn are owed to Zn-induced inhibition of synthesis of RNA-dependent RNA polymerases, which catalyze the replication of RNA viruses [10]. Thus, individuals with optimal Se and Zn nutrition could have lower morbidity and better immunity against COVID-19. In addition to its own antiviral effects, Zn supplementation along with Zn-ionophore drugs such as chloroquine and hydroxychloroquine to Zn-deficient individuals suffering from COVID-19 could impart additive or synergistic effects on the efficacy of the drugs.
In regions where soils contain low concentrations of plant-available micronutrients, malnutrition of micronutrients is very common [12]. The relationship among the nutrient status of soils, food crops, and human health is well explained by the fact that agriculture-based food products are the major source of human nutrition [1,12]. Moreover, rice and other staple cereal grains not only genetically contain low levels of micronutrients but also their bioavailability is too low to suffice human dietary requirements [12,13]. Accordingly, insufficient dietary intake of micronutrients is the principal reason of the prevalence of human micronutrient deficiencies in regions dependent on cereal-based staple foods [1,4,14].
The use of agricultural approaches, such as plant breeding and fertilizer application, for the biofortification of micronutrients in staple cereals represents a cost-effective, time-efficient, and sustainable solution to overcome micronutrient malnutrition in humans [15,16,17,18,19]. Multi-country research conducted under the HarvestPlus Zinc Fertilizer Project has demonstrated that the foliar application of I, Se, and Zn is an effective agronomic approach to obtain desirable concentrations of these micronutrients in wheat and rice grains [19,20,21,22]. These studies proved that soil applications of I or Zn is much less effective compared to their foliar application for increasing I or Zn concentrations in grains. Improving the nitrogen (N) nutritional status of plants also has a significant increasing effect on the root uptake and shoot and grain accumulation of Zn and Fe, as shown in different plant species such as rice, wheat, and maize [23,24,25,26]. It is known that improving the N nutrition of wheat increases root release of Zn- and Fe-mobilizing phytosiderophores [27] as well as root uptake, shoot transport and grain deposition of Zn and Fe [28].
Rice is a staple food for more than half of the global population, fulfilling 21% of their energy and protein needs. About 90% of rice is grown and consumed in South and South-East and East Asia, where about 62.5% of the global human population resides. Rice grains generally contain low levels of micronutrients and fail to cater to humans with adequate quantities of these micronutrients. For example, the average I concentration in polished rice collected from 20 distinctly located fields in Japan was found to be 3.6 µg kg−1 [29]. Similarly, Zia et al. [30] and Cakmak et al. [21] reported extremely low concentrations (≤10 µg kg−1) of I in wheat and rice grains. Assuming per capita consumption of 400 g of rice containing 10 µg of I kg−1, the daily intake of I is only 4 µg, i.e., merely 2.5% of the daily recommended intake (150 µg a day; [31]). The biofortification of food crops with I-enriched fertilizers is quite a successful strategy, as shown by published research regarding vegetable crops [32,33,34,35,36]. Considering the status of rice in global calorie provision and its grain I content, rice had been a neglected crop in terms of I biofortification until Cakmak et al. [21] conducted a comprehensive study suggesting a very critical role of foliar biofortification of rice grains with I to a level sufficient for human nutrition.
Likewise, grain Zn concentration in most of the rice-producing regions is lower, i.e., ranges between 16 and 20 mg kg−1 [12], than the desirable Zn concentration of 28 mg kg−1 [37] to avoid risk of human Zn malnutrition. The average level of Zn concentration (25.4 mg Zn kg−1) in brown rice grains of the rice genotypes obtained from the International Rice Research Institute (IRRI) [38] was also too low to supply adequate Zn for human nutrition [39].
Information on Se concentration in staple foods is more limited than I and Zn. However, Se malnutrition is recognized as a serious problem in resource-poor countries of the world [1]. For instance, Se malnutrition in some regions of China is a cause of serious health problems in human populations [40,41]. The foliar application of Se proved very effective in attaining the target concentration of 300 µg Se kg−1 wheat grains [22,42,43]. Foliar application of Se has also been a very successful strategy in increasing the Se in rice grains but to a variable extent depending upon genotype [44,45,46]. Reis et al. [47] concluded that the agronomic biofortification of rice with Se could help in eliminating Se malnutrition in humans.
Although the foliar fertilization of rice with these micronutrients could help in reducing human malnutrition, however, convincing rice growers for realizing the separate foliar application of each micronutrient is next to impossible because of the labor costs. By virtue of cost and time saving, an effective combined spray of I, Se, and Zn would of course be more acceptable to farmers than separate spray of each micronutrient. In spite of its great importance, research about the combined spray of these nutrients in rice is in initial stages with multiple ambiguities. Most of the published literature has considered the application of a single micronutrient such as Zn [48,49,50,51], I [21,52,53], or Se [14,44] or two micronutrients at a time [54,55] with a few exceptions. For example, Fang et al. [56] studied the effect of foliar application of Zn, Se, and Fe simultaneously on the biofortification of rice grains. Recently, Zou et al. [22] evaluated the combined foliar application of Zn, I, Se, and Fe on wheat and found the cocktail application of these micronutrients to be an effective technique to biofortify wheat grains but with a reduction in I enrichment in cocktail treatment as compared to single nutrient application. Similarly, Cakmak et al. [57] compared the effectiveness of foliar application of I alone and in cocktail with Zn and Se and found a reduced efficiency of foliar I application in cocktail with Zn and Se as compared to isolated I spray. Prom-u-thai et al. [58] conducted a comprehensive multi-location study on the biofortification of rice simultaneously with Zn, I, Fe, and Se and found it highly effective for all micronutrients except Fe. Moreover, results regarding grain I concentration were highly variable depending upon locations. For example, in most of the cases, cocktail application had lower grain I enhancement as compared to the application of I alone; however, the results obtained in China and India were not consistent for unknown reasons. The variation in ability of rice cultivars to translocate and deposit Zn into grains is well documented [58,59,60,61], which might also affect I translocation and deposition into grains when applied together with Zn and Se.
Therefore, the present study was designed to validate not only the foliar application of Zn, I, and Se alone and in cocktail for rice biofortification but also the proficiency of contrasting rice cultivars (having different yield potential and phenotypic characteristics such as plant height, leaf area index, and ear length) in translocating and depositing these nutrients into grains from their foliage. To the best of our knowledge, this is the first study investigating the effect of foliar application of micronutrient cocktail (Zn, I, and Se) on the grain nutritional quality of four diverse “Basmati” rice cultivars under similar climatic conditions. We studied also the changes in grain concentrations of iron (Fe), copper (Cu), manganese (Mn), and calcium (Ca) under given experimental conditions to investigate whether foliar application of the mentioned micronutrients either individually or their cocktail has an effect on the grain accumulation of Fe, Cu, Mn, and Ca.

2. Materials and Methods

2.1. Experimental Site and Soil Characterization

A field study was conducted during July–November 2017 at the Research Station of Engro Eximp. (Private) Limited, Sheikhupura, which is situated in the rice belt of Punjab province, Pakistan. Before experimentation, representative plough-layer soil (0–20 cm) was sampled and analyzed for salient physicochemical properties (Table 1). The electrical conductivity (EC) and pH of the soil were measured in 1:1 soil–water extract [62]. Soil texture, organic carbon, and calcium carbonate equivalent were determined according to Bouyoucos [63], Jackson [64], and FAO [65], respectively. Soil Zn was determined by extraction with diethylene triamine pentaacetic acid (DTPA) following the procedure described by Lindsay and Norvell [66], I was determined by extraction with tetramethylammonium hydroxide (TMAH) following Zia et al. [30], and Se was determined by extraction with KH2PO4 following Dhillon et al. [67].

2.2. Crop Husbandry

For nursery raising, the seed bed was flood-irrigated and puddled twice, with a one-week interval. Each puddling was followed by a planking. Two-day water-moistened seeds of four rice cultivars, viz., Basmati-515, Chenab Basmati, Kisan Basmati, and Super Basmati, were sown using a seed rate of 12.5 kg ha−1 nursery area. To prepare for nursery transplanting, the experimental field was repeatedly puddled and planked in standing water with an interval of one week. Thirty-day-old rice seedlings were manually transplanted at a plant–plant and row–row distance of 20 cm. The size of each experimental plot was 10 m2. Basal fertilizers, comprising of 130 kg N (urea), 90 kg P2O5 (diammonium phosphate, DAP), and 60 kg K2O (sulfate of potash, SOP) per hectare, were applied by the broadcast method. A full dose of DAP and SOP and one-half dose of urea were applied at the time of nursery transplanting while the remaining quantity of urea was applied in two equal splits after 25 and 50 days of transplanting. Zinc was applied at the rate of 9 kg ha−1 as ZnSO4∙7H2O three weeks after nursery transplantation. To control rice stem borer and rice leaf folder, two applications of Cartap (Cartap Hydrochloride) were made at the rate of 22.5 kg ha−1 during the 3rd week of August and 1st week of September. To protect the crop from fungal attack, Nativo (trifoxystrobin and tebuconazol) was sprayed at the rate of 160 g ha−1 before and after panicle emergence. Actara (neonicotinoids) was sprayed at the rate of 60 g ha−1 to control the plant hopper. The experimental field was flooded with canal water as and when required throughout the growth period.

2.3. Treatment Application

The experiment comprised of five foliar treatments: (T1) control (i.e., two foliar sprays of distilled water only); (T2) two foliar sprays of 0.05% potassium iodate (KIO3); (T3) two foliar sprays of 0.0024% sodium selenate (Na2SeO4); (T4) two foliar sprays of 0.5% zinc sulfate heptahydrate (ZnSO4∙7H2O); and (T5) two foliar sprays of a cocktail of the above three micronutrient solutions. First, foliar spray was applied one week prior to the rice heading stage (Zadoks Scale 41), and the second spray was made one week after heading, i.e., at the early grain milk stage (Zadoks Scale 59). Spray solutions of all micronutrients contained 0.05% detergent powder (Surf) as a surfactant. Based upon previous experiences, an 800 mL spray solution was applied to each experimental plot of 10 m2 (equivalent to 800 L per hectare). This quantity of solution was enough to wet most of the leaves without run-off. For higher absorption of the applied micronutrients, foliar sprays were realized late in the evening to avoid the immediate evaporation of water. The experimental treatments, each having four replicates, were arranged in a randomized complete block design. Following each foliar spray, the plants were carefully observed to see if the spray solutions were toxic for plant leaves. At maturity, the crop was harvested when grain moisture content reached 14%. After harvesting, plants were threshed using a pedal-driven mini thresher to separate the grains, and yield data were recorded. The grains were washed by using deionized water and dried at 65 ± 5 °C for 72 h in a forced air oven and manually dehusked to obtain brown rice, which was used for analyzing mineral concentrations.

2.4. Elemental Measurements

The I concentration in brown rice grains was analyzed following the method described by Cakmak et al. [21]. This method is highly sensitive and can detect I concentration even below 10 μg kg−1 grain. Briefly, 0.25 g (±10 mg) of dried and ground brown rice grains were digested with 20 mL of 1.25% tetramethylammonium hydroxide in a closed-vessel microwave digestion system (MRAS6, CEM Corp., Charlotte, NC, USA) adjusted to 90 °C for 1 h. The cooled extracts were centrifuged for 20 min at 5000 rpm, diluted to 1:1 by volume with double deionized water (4 μS cm−1 at 25 °C), and filtered in caped plastic vials. Iodine concentrations in the digests were measured by inductively-coupled plasma mass spectrometer (7700 Series, Agilent Technologies, Santa Clara, CA, USA).
For the determination of other minerals including calcium (Ca), copper (Cu), iron (Fe), manganese (Mn), Se, and Zn, brown rice grains were digested in a mixture of nitric acid and perchloric acid (HNO3-HClO4) following the protocol of AOAC [68]. Briefly, 1.0 g of each grain sample contained in a conical flask was initially digested in 5 mL of concentrated HNO3 at 100 °C using a hotplate until most of the dark brown fumes had gone. The mixtures were cooled; then, 1 mL of HClO4 was added to each mixture and reheated at 180 °C until dense white fumes of HClO4 appeared. The digests were cooled, diluted to 50 mL with double deionized water, and stored in capped plastic bottles after filtering through Whatman filter paper No. 42. Elemental concentrations in the digests were measured by inductively coupled plasma mass spectrometry (7700 Series, Agilent Technologies, Santa Clara, CA, USA). The concentrations of the elements in blank were subtracted from their concentrations in the samples.

2.5. Statistical Analyses

The data were statistically analyzed following two-way analysis of variance (ANOVA) and means were compared by the Least Significance Difference (LSD) test at a confidence level of 95% [69]. For grain concentrations of I, Se, and Zn, only relevant treatments were included in the statistical analysis, while for grain yield and concentration of Ca, Cu, Fe, and Mn in grains, all the treatments were included. Statistics 9.0 computer software was used for data analysis.

3. Results

3.1. Grain Yield

Foliar sprays of micronutrients, separately or as a cocktail, did not exhibit any visible detrimental effects on rice leaves. The effect of foliar micronutrient treatments on the grain yield of all rice cultivars was non-significant. However, grain yields differed significantly among the rice cultivars and exhibited following grain yield order: cv. Chenab Basmati > cv. Kisan Basmati > cv. Super Basmati > cv. Basmati-515 (p ≤ 0.05; Table 2).

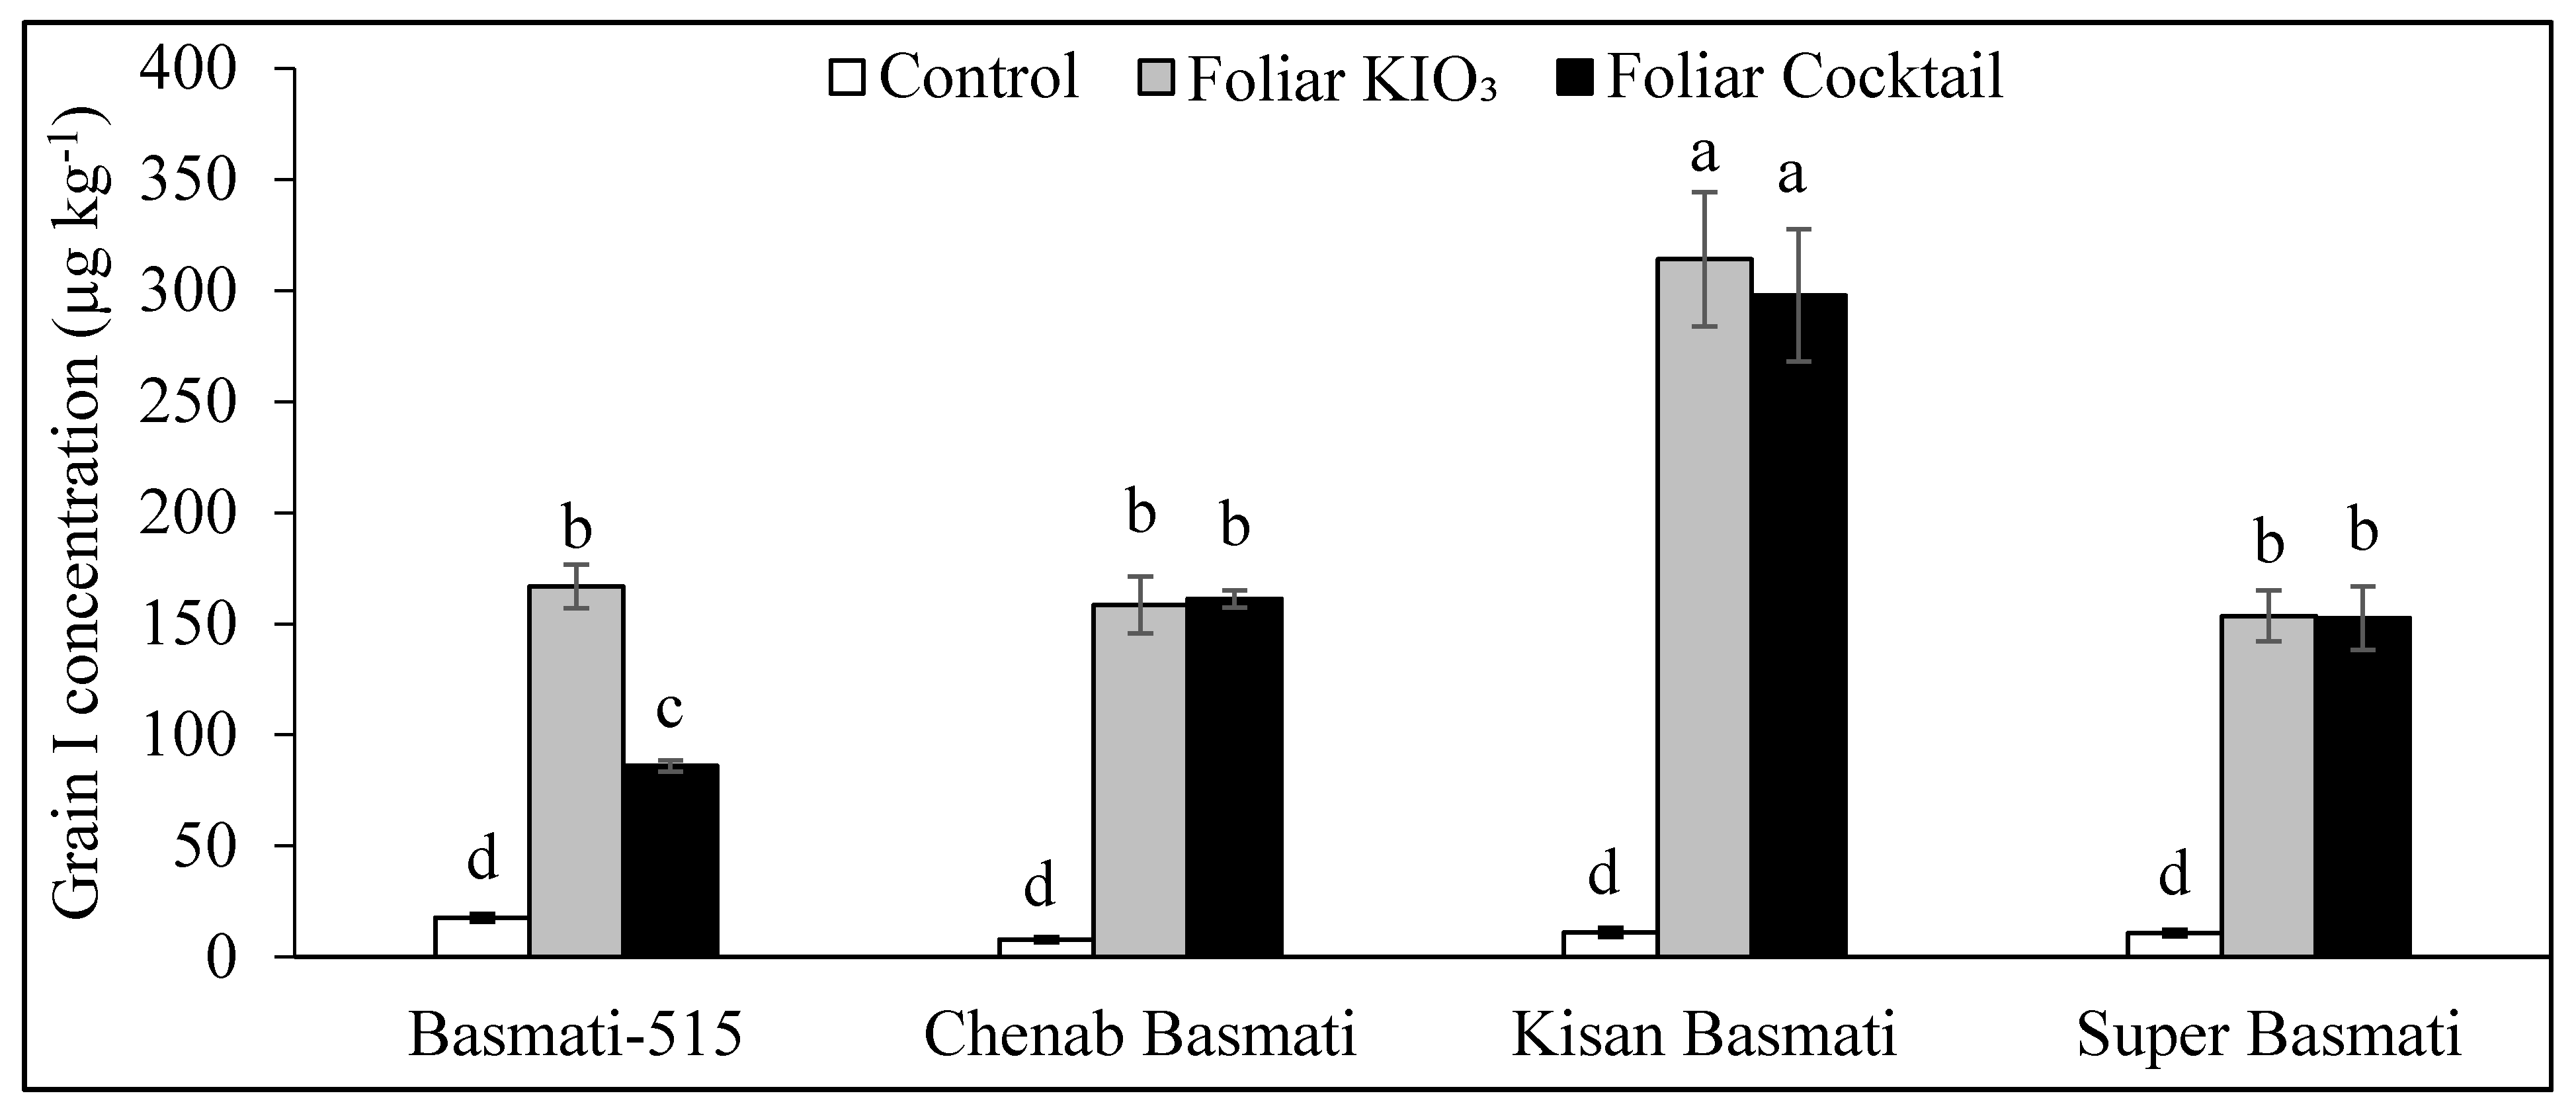
3.2. Iodine Concentration in Brown Rice

The main effects of cultivars and foliar treatments as well as their two-way interaction significantly affected the I concentration in brown rice (p ≤ 0.01; Figure 1). With control treatment (foliar sprays of distilled water only), the I concentration in brown rice was very low, i.e., ranging between 8 and 18 µg kg−1, irrespective of cultivar. The foliar application of KIO3 and cocktail treatment substantially (p ≤ 0.01) increased I concentration, ranging from 5 to 28 folds, depending upon cultivar and treatment composition. Except for cv. Basmati-515, increases in the I concentration of brown rice grains with foliar sprays of KIO3 and cocktail were statistically similar among the cultivars. In cv. Basamti-515, micronutrient cocktail application reduced the effect of foliar I spray by almost 49% when compared with the application of KIO3 alone.
Overall, cv. Kisan Basmati showed a substantially higher response to foliar treatment of I resulting in two-fold higher brown rice I concentration as compared to other cultivars. The average I concentration in brown rice with a foliar application of KIO3 alone or with cocktail was 126 μg kg−1 in cv. Basmati-515, 160 μg kg−1 in cv. Chenab Basmati, 306 μg kg−1 in cv. Kisan Basmati, and 153 μg kg−1 in cv. Super Basmati.

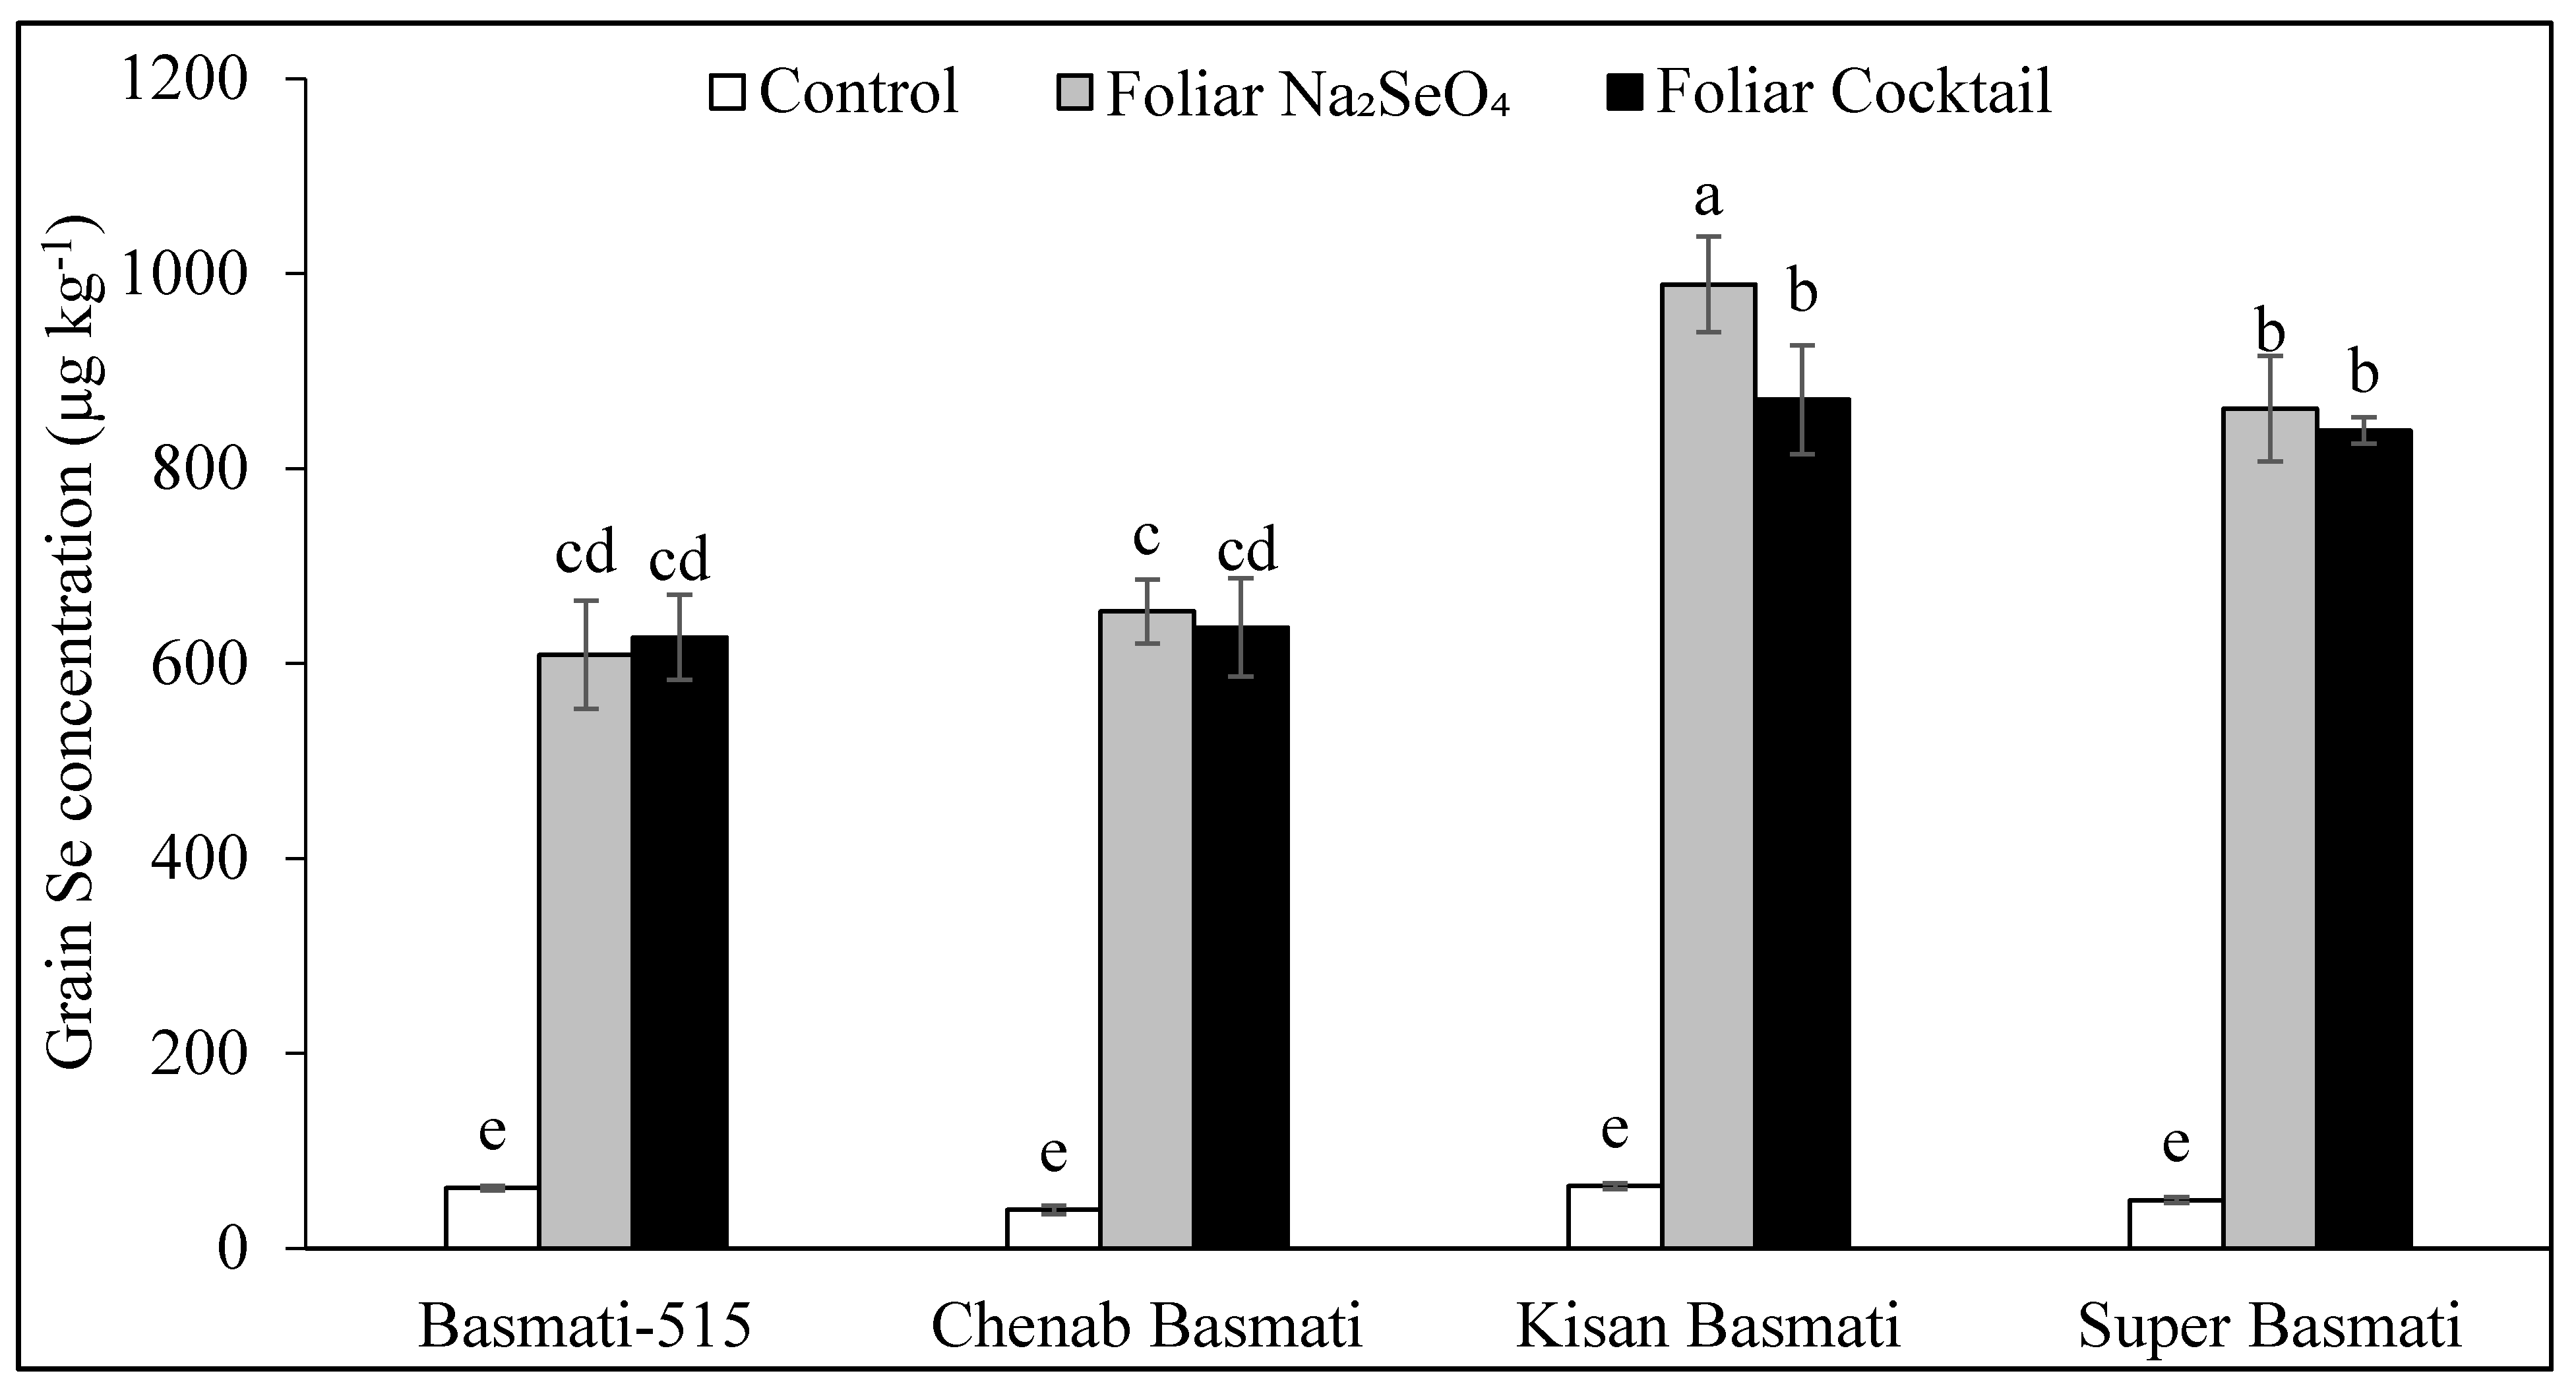
3.3. Selenium Concentration in Brown Rice

The main effects of cultivars and foliar treatments as well as their two-way interaction significantly affected brown rice Se concentration (p ≤ 0.01; Figure 2). Similar to I, with control treatment (i.e., foliar sprays of distilled water only), the Se concentration in brown rice of all rice cultivars was also very low, ranging from 39 to 50 µg kg−1, with no significant cultivar effect. However, substantial increases in the Se concentration of brown rice, ranging from nine to 16 folds, were found with the foliar application of Na2SeO4 and cocktail treatments (p ≤ 0.05) depending upon rice cultivar and treatment composition. Except for cv. Kisan Basmati, in the remaining three cultivars, the foliar application of Na2SeO4 and cocktail increased brown rice Se concentration to a similar extent. In cv. Kisan Basmati, cocktail application reduced the effect of Se biofortification by 12% as compared to the application of Na2SeO4 alone (Figure 2). In addition, with a foliar application of Na2SeO4, cv. Kisan Basmati accumulated the highest Se concentration, which was followed by cv. Super Basmati > cv. Chenab Basmati = cv. Basmati-515. With foliar cocktail treatment, brown rice Se concentration was significantly higher in cv. Kisan Basmati and cv. Super Basmati than cv. Chenab Basmati and cv. Basmati-515. On average, the former group of cultivars (i.e., Kisan Basmati and Super Basmati) contained 223 µg higher Se per kg of brown rice than the latter group of cultivars (Chenab Basmati and Basmati-515); the differences between the cultivars of both groups were non-significant.

3.4. Zinc Concentration in Brown Rice

The main effects of cultivars and foliar treatments on brown rice Zn concentration were significant, while their interaction was non-significant (Table 3). The grain Zn concentration of the control treatment (with water application) in the rice cultivars was between 14 and 19 mg kg−1 and differed significantly among rice cultivars. With control treatment, brown rice Zn concentration was higher in cv. Kisan Basmati and cv. Super Basmati compared to cv. Basmati-515 and cv. Chenab Basmati. Foliar applications of ZnSO4 and cocktail were equally effective in increasing brown rice Zn concentration, irrespective of the cultivar, and they caused an enhancement of 5–6 mg per kg of brown rice Zn concentrations. With foliar ZnSO4 and cocktail, the cultivars maintained their inherent order with respect to brown rice grain Zn concentration; i.e., the cultivars having higher Zn concentration in brown rice with control treatment also had higher Zn concentration with foliar spray of ZnSO4 or cocktail by the same magnitude.

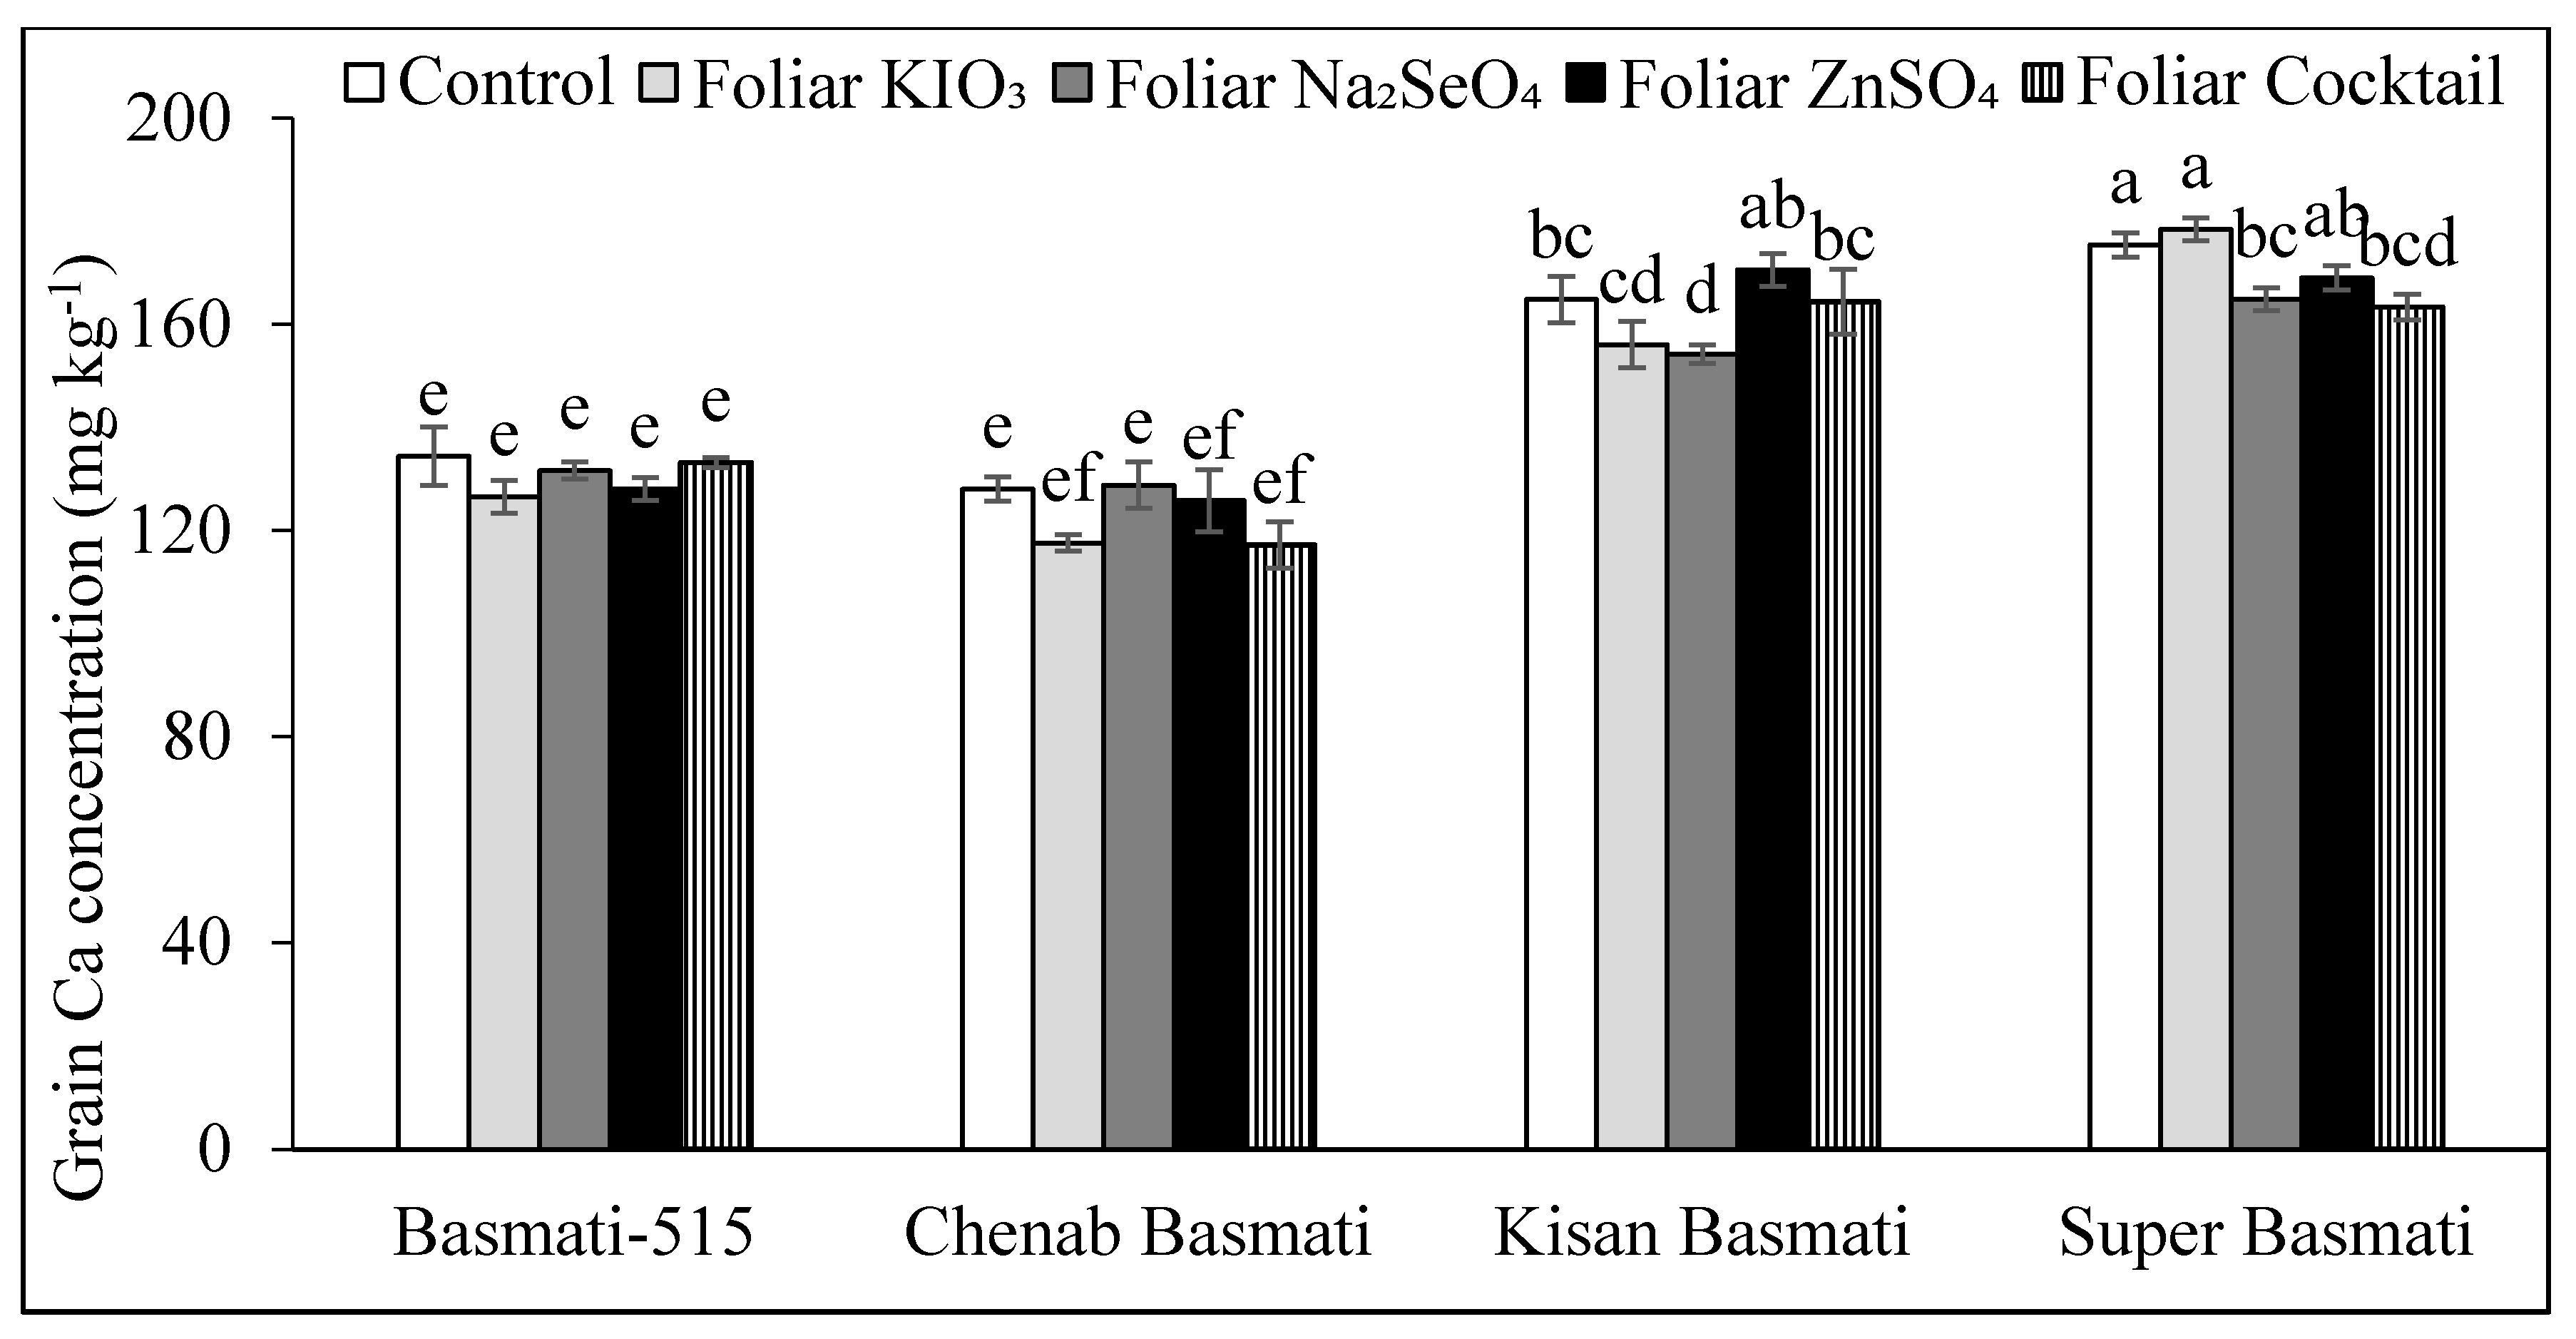
3.5. Copper, Iron, Manganese, and Calcium Concentrations in Brown Rice

Foliar treatments did not affect concentrations of Cu, Fe, and Mn in brown rice, irrespective of cultivars; however, the differences among cultivars were significant for all micronutrients (p ≤ 0.05; Table 4). On average, the highest Cu concentration in brown rice was recorded in cv. Kisan Basmati (3.5 mg kg−1) followed by cv. Super Basmati (2.9 mg kg−1), cv. Chenab Basmati (2.3 mg kg−1), and cv. Basamati-515 (2.0 mg kg−1); however, the last two cultivars had statistically similar concentrations. The cultivar-wise order of Fe concentration in brown rice was Super Basmati > Kisan Basmati > Chenab Basmati > Basmati-515. Brown rice Mn concentration was also higher in cv. Super Basmati than the rest of the three cultivars having statistically similar Mn concentrations. The calcium concentration in brown rice of cv. Kisan Basmati and cv. Super Basmati was significantly higher (up to 37%) than cv. Basmati-515 and cv. Chenab Basmati (p ≤ 0.05; Figure 3). On average, the former group contained 39 mg higher Ca per kg of grains than the latter group, and differences between the cultivars within groups were non-significant. Compared to control treatment, foliar micronutrient treatments did not affect grain Ca concentration in cv. Basmati-515 and cv. Chenab Basmati. However, there was a statistically significant decreasing trend in grain Ca concentration with foliar application of KIO3 in cv. Kisan Basmati and both by KIO3 and cocktail in cv. Super Basmati (p ≤ 0.05; Figure 3).

4. Discussion

In this field experiment, conducted in the rice belt of the Punjab province of Pakistan, the effect of foliar-applied I, Se, and Zn, either individually or as a cocktail, was studied on the biofortification of these micronutrients in four cultivars of Basmati rice having contrasting characteristics such as different yield potential and phenotypic characteristics including plant height, leaf area index, and ear length.
In general, this study revealed that foliar treatments of I, Se, Zn, or cocktail did not affect rice grain yield; however, substantial increases in I and Se concentrations and moderate increases in Zn concentration in brown rice were recorded irrespective of cultivar (p < 0.05; Table 2, Figure 1 and Figure 2). The lack of grain yield enhancement with foliar applied Zn treatment is attributed to adequate DTPA-extractable Zn concentration in the experimental field soil (i.e., >1.0 mg kg−1 soil; Table 1; [70]), because of Zn application as basal fertilizer in the whole filed, and is in line with previous studies [58]. The low inherent I concentrations in the brown rice of all the cultivars are well explained by the negligible concentration of I in the experimental soil (Table 1). It might also be related to the poor phloem transport of I, as suggested and discussed several times in the previous studies [29,52,58]. This is highly consistent with earlier observations of very minimal I concentration in rice grains in the absence of foliar I application.
For example, in Japan, the I concentration of polished rice collected from 20 different field sites varied between 1.4 and 18 µg kg−1, with a mean value of 3.6 µg kg−1 [29]. Similarly, the I concentration in field-grown rice grains was reported to be between 5 and 9 µg kg−1 [28]. In the present study, foliar application of KIO3, alone as well as in cocktail with Zn and Se, immensely increased I concentration in brown rice (Figure 1). Similar to the results of the present study, Cakmak et al. [28] also reported that the foliar application of 0.05% KIO3 resulted in substantial increases in brown rice I concentration in Brazil and Thailand. In contrast to the results presented in this study for rice, foliar I spray did not result in marked increases in fruit I concentrations of apple and pears. The increases found were minimal but suggested to have an important potential to contribute to human dietary I intake [52,53,55]. In our study, except for cv. Basmati-515, the foliar application of KIO3 alone or in cocktail was equally effective in improving grain I concentration. It means that concentrations and forms of Zn and Se used in the cocktail neither antagonize I absorption in rice leaves nor its translocation to rice grains. Zou et al. [22] and Prom-u-thai et al. [58] also reported the lack of antagonistic effects of forms and application rates of Zn, Se, and Fe on I absorption and translocation in wheat and rice, respectively. In fruit trees, the addition of Na selenate in the I-containing solution did not affect fruit I concentration [55]. It has been observed that the foliar application of either KIO3 or KI in combination with calcium fertilizers, fungicides, or insecticides did not affect the absorption of I in butterhead lettuce; rather, it enhanced I absorption in some cases [71]. In our study, among cultivars, the mean increase in grain I concentration in cv. Kisan Basmati grains was much higher than the increase recorded in other cultivars. The reason for this genotypic variation could not be understood and could be due to the higher absorption of I in leaves or its more effective translocation from leaves to grains. Cakmak et al. [21] reported that the absorption and translocation of foliar-applied I to grains was highest in wheat, medium in rice, and least in maize. Although cv. Chenab Basmati had a brown rice I concentration similar to cv. Basmati 515 and cv. Super Basmati, when compared in terms of grain yield, cv. Chenab Basmati seems far more superior to the rest of the studied cultivars in assimilating foliar-applied I. The lower I concentration could be attributed to the dilution effect. It might be also quite possible that a part of the increase in grain I concentration could be a consequence of a direct fortification (i.e., contamination) of seeds by foliar spray, as suggested earlier [21,57,58]. If this was the case, the genotypic variation in grain I concentrations following foliar sprays might be also related to the differential exposure of ears or florets to foliar sprays during the 2nd foliar spray that was made during the early milk stage. Studies are needed to investigate the extent of direct seed contamination in cereals with I through foliar spray of I-containing products.
In populations where rice contributes 75% of daily caloric intake, it may be supposed to provide at least the same proportion of recommended dietary allowance (RDA) of I, i.e., about 112 µg I out of 150 µg total RDA per day. Assuming 400 g daily per capita consumption of rice, having an I concentration of 158–306 µg kg−1, which was achieved with foliar-applied KIO3 or a cocktail to various Basmati cultivars used in this study, could deliver 63–122 µg daily I intake, i.e., about 40–80% of RDA. This assumption stands true only if there are no I losses during processing and cooking, and 100% of the grain I is bioavailable. However, Cakmak et al. [57] reported that upon boiling, 40% of I contained in agronomically I biofortified brown rice is lost possibly due to the leaching of I from kernels to boiling water or the evaporation of I from boiled water. Moreover, they also found that only 50% of the I present in boiled rice is bioaccessible in the small intestine. This implies that after accounting for 40% loss on boiling and 50% bioaccessibility of I in boiled rice, the consumption of 400 g biofortified brown rice grains obtained in this study can provide 19–36 µg I daily. Although this supplementation of I from biofortified brown rice is much higher as compare to control, its overall contribution to RDA is low. Hence, these authors suggested that for the optimal use of I in biofortified rice grains, rice food preparation methods must be reconsidered to lower I loss and get the maximum content in the prepared food. For example, instead of boiling, rice can be steamed. Goindi et al. [72] reported 37% loss I from salt by boiling and only 20% by steaming. Alternatively, the quantity of water used for boiling may be reduced to just match the saturation requirements of rice grains. More importantly, to account for I losses during the polishing of rice and preparation of food, future research is warranted to further increase the I concentration in agronomically biofortified brown rice through developing rice cultivars efficient in the absorption, translocation, and deposition of micronutrients into grains through the application of classical and modern plant breeding techniques. For example, in case of wheat, Zn biofortified cultivars developed under HarvestPlus (www.harvestplus.org; Accessed on 11 November 2021) program were more efficient in accumulating Zn in grains as compared to standard cultivars (unpublished results). Overall, the foliar application of I fertilizer to rice could substantially contribute to meet the RDA of I in human populations consuming rice as a staple diet.
Likewise, the inherent Se concentration in the brown rice grains of all the cultivars was low, and with the foliar application of Na2SeO4 alone or contained in the cocktail, it increased substantially, from a mean value of 54 to 760 µg kg−1 (p = 0.05; Figure 2). All cultivars responded equally to the foliar application of Na2SeO4 alone or in cocktail except for cv. Kisan Basmati, which outperformed other cultivars when sprayed with Na2SeO4 alone; however, with cocktail treatment, this cultivar maintained grain Se concentration at the level of cv. Super Basmati (Figure 2). The absorption and phloem mobility of Se is well documented in plants [73,74,75] and is confirmed in this study by the efficient deposition of Se in rice grains. Cakmak et al. [57] found the foliar application of Se along with I and Zn as a feasible technique for improving rice grain Se concentration. Similarly, the combined application of Se and Zn was highly effective in increasing the grain concentration of these micronutrients in rice [54]; however, a dose and cultivar-dependent antagonistic effect of Zn was observed on grain Se concentration, as shown in the case of cv. Kisan Basmati (Figure 2) in the current study. Moreover, the higher Se concentration of cv. Super Basmati is directly related to the concentration effect of lower grain yield as compared to other cultivars, especially cv. Chenab Basmati. However, as was observed in the case of I, cv. Kisan Basmati outperformed all cultivars in terms of Se concentration in brown rice in spite of the higher grain yield as compared to cv. Super Basmati and cv. Basmati 515 (Table 2), which could be attributed to the efficient absorption, translocation, and deposition of foliar-applied Se. Future studies should focus on better understanding the genotypic variation in absorption and seed deposition of foliarly applied Se.
It was quite encouraging to observe that in the present study, the Se concentration achieved in the brown rice of all the Basmati cultivars was higher than the target level of 300 µg kg−1. Most often, polished rice is used for human consumption and not brown rice. Since most of the Se is located in the outer aleurone layer of the rice grain, up to 34% of Se can be lost during the polishing of rice [76]. Moreover, Se is also lost during the boiling of rice for food preparation [77]. Therefore, higher values of Se in brown rice are advantageous, as its leftover quantity after polishing would be in the adequate range in the polished rice. This suggests that a 600 to 800 L solution of 0.001% Na2SeO4 (i.e., 4.2 g Se ha−1), in combination with Zn and I, is a suitable dose to obtain the desired levels of Se in rice grains.
Inherent Zn concentration in brown rice grains in the tested Basmati cultivars ranged between 13.6 and 19.0 mg kg−1; cv. Kisan Basmati and cv. Super Basmati had a 4–5 mg kg−1 higher Zn concentration in brown rice than cv. Basmati-515 and cv. Chenab Basmati (Table 2). Martínez et al. [78] also observed a narrow range of Zn concentration, i.e., 20–25 mg kg−1, in 11,400 samples of brown rice. In our study, the foliar application of ZnSO4 alone or in cocktail resulted in an equal net increase of 5–6 mg Zn kg−1 brown rice of all Basmati cultivars; the Basmati cultivars maintained their inherent order with respect to Zn concentration in brown rice grains, i.e., cv. Super Basmati > cv. Kisan Basmati > cv. Basmat-515 > cv. Chenab Basmati (Table 3). The higher concentration of Zn in the brown rice of cv. Super Basmati is most likely attributed to the “concentration effect” of lower grain yield as compared to other cultivars, while the opposite is true for cv. Chenab Basmati, which had a lower grain Zn concentration but the highest yield among the cultivars studied (Table 2). In line with grain Se and I concentration, cv. Kisan Basmati performed very well in terms of Zn biofortification through standing at par with cv. Super Basmati in spite of significantly higher (19%) grain yield as compared to cv. Super Basmati (Table 2). The equal effectiveness of ZnSO4 alone or contained in the cocktail, together with I and Se, for increasing the grain Zn concentration in brown rice is in line with the previous studies [58]. It implies that the forms and quantities of I and Se used in the present study are compatible to combine with Zn for the agronomic biofortification of rice through foliar fertilization. Contrary to the above findings, Mangueze et al. [54] reported an antagonistic effect of Se on Zn absorption in rice. This might be due to the reason that the dose of Se for foliar application used by these researchers was much higher (i.e., 150 g Se ha−1) as compared to the much lower dose used in our study (4.2 g ha−1). Mangueze et al. [54] have suggested that the dose of Se for foliar spray may be reduced to avoid such deleterious interactions. Obviously, by virtue of higher inherent Zn contents, cv. Super Basmati and cv. Kisan Basmati can more effectively meet daily Zn intake requirements. The HarvestPlus [37] has set a target value of 28 mg Zn kg−1 rice grains for adequately meeting the daily intake requirements of Zn for human populations consuming rice as a staple diet. Although the resultant Zn concentrations in brown rice grains in the tested Basmati rice cultivars, with the foliar application of Zn or cocktail treatment, were less than the target value of 28 mg Zn kg−1, still, the attained Zn levels represent a considerable increase over the inherent levels (Table 3). Saha et al. [79] reported that the effect of foliar- and soil-applied Zn in enhancing grain Zn concentration varied between 23.4 and 45.3% among the tested genotypes of rice. However, in contrast to the results of our study, these researchers achieved the target Zn concentration of 28 mg Zn kg−1 rice grains of all the tested genotypes with two foliar sprays of Zn at tillering and flowering growth stages. The larger quantity of Zn spray solution (660–1320 L ha−1) used by these researchers, as compared to the spray solution volume used in our study (800 L ha−1), may explain these contradictory findings in the two studies. In addition, environmental factors and the use of different cultivars might have also contributed to the differential absorption of foliar-applied Zn fertilizer. On the other hand, in line with our results, Ram et al. [80] have also reported the same magnitude of increase in brown rice Zn concentration (5–6 mg Zn kg−1 grains) in field grown rice sprayed with 0.5% ZnSO4∙7H2O solution in India and China. Hence, to attain higher Zn concentration in rice grains, the attributes such as stage of crop growth, Zn concentration in spray solution, and volume of spray solution merit further investigations.
Concentrations of some other mineral nutrients were also analyzed in the rice grains in order to study the effect of foliar treatments on their grain accumulation. Concentrations of Ca, Cu, Fe, and Mn in brown rice differed significantly among Basmati rice cultivars; cv. Kisan Basmati and cv. Super Basmati had a substantially higher concentration of these mineral nutrients compared with cv. Basmati-515 and cv. Chenab Basmati. Clearly higher grain Ca concentrations in cv. Kisan Basmati and cv. Super Basmati could be interesting in terms of human Ca nutrition. Similar to micronutrient deficiencies, also human Ca deficiency is a growing nutritional problem in human populations and suggested that the biofortification of stable food crops with Ca through plant breeding would be a sustainable solution to address human Ca deficiency [81].
Except for Ca, concentrations of Cu, Mn, and Fe were not negatively affected by any foliar treatment (Table 4 and Figure 3). However, there was a statistically significant decreasing trend in grain Ca concentration with the foliar application of KIO3 alone in case of cv. Kisan Basmati and with KIO3 as well as cocktail treatments in case of cv. Super Basmati. It depicts that it was foliar application of I, as KIO3 alone and I, was contained in the cocktail, and not Se and Zn, which had a minimal negative effect on Ca concentration in rice grains. Xia et al. [82] have reported that the foliar application of 0.2–0.3% ZnSO4∙7H2O solution did not affect the Ca concentration in grains of maize. Although Mangueze et al. [54] have reported a decreasing trend in Ca concentration of rice with foliar application of Se, their dose of foliar-applied Se was too high, and they had recommended decreasing the dose for the Se biofortification of rice. Strawberries grown in nutrient solution containing 2 and 4 mg Se L−1 had similar concentrations of Ca, Cu, Fe, and Mn to those grown without Se in nutrient solution [83]. Thus, in general, it could be inferred that the applied foliar treatments had no or a negligible negative effect on the concentrations of these mineral nutrients in brown rice grains.

5. Conclusions

For the simultaneous biofortification of multiple Basmati rice cultivars with I, Se, and Zn, combined foliar sprays of these micronutrients were found to be as effective as their separate foliar sprays—however, up to a variable extent, depending upon cultivars. Cultivar Chenab Basmati had lower micronutrient concentrations as compared to cv. Super Basmati and cv. Basmati 515, which was probably because of its higher grain yield. However, cv. Kisan Basmati outperformed all of the studied cultivars in terms of nutritional quality under foliar biofortification in spite of significantly higher grain yield than cv. Super Basmati and cv. Basmati 515. Cultivar Kisan Basmati and cv. Chenab Basmati need characterization for contrasting features important for agronomic biofortification. Since foliage did not show any visual toxicity to foliar-applied micronutrients, it is also concluded that foliar treatments with a higher concentration of Zn may be tested in cocktail to obtain a higher concentration of Zn in rice grains. Moreover, the foliar application of the micronutrients did not impart any negative effect on the concentration of other useful minerals in grains. Thus, the combined application of I, Se, and Zn is recommended as an effective strategy along with the selection of biofortification-efficient cultivars for enhancing the concentration of these micronutrients in rice grains.

Author Contributions

Conceptualization, I.C. and A.N.; Data curation, A.N. and M.A. (Muhammad Aslam); Formal analysis, I.C. and M.A. (Muhammad Asif); Methodology and Mineral analysis, A.N., M.A. (Muhammad Aslam), M.A.Y. and M.A. (Muhammad Asif); Resources, M.A. (Muhammad Aslam) and M.A. (Mumtaz Ahmad); Supervision, I.C. and A.R.; Writing—original draft, A.N., A.R., Writing—review and editing, A.R., I.C. and M.A.(Muhammad Asif); Project administration, I.C. and A.R.; Funding acquisition, I.C. All authors have read and agreed to the published version of the manuscript.

Funding

This research was funded by HarvestPlus Zinc Fertilizer Project “HarvestZinc”.

Institutional Review Board Statement

Not applicable.

Informed Consent Statement

Not applicable.

Data Availability Statement

The data that support the findings of this study are available from the corresponding author upon reasonable request.

Acknowledgments

Asif Naeem is highly thankful to Alexander von Humboldt for the grant of George Forster Post-Doctorate Fellowship.

Conflicts of Interest

The authors declare no conflict of interest.

References

  1. Welch, R.M.; Graham, R.D.; Cakmak, I. Linking agricultural production practices to improving human nutrition and health. In Proceedings of the Expert Paper Written for ICN2 Second International Conference on Nutrition Preparatory Technical Meeting, Rome, Italy, 13−15 November 2013. [Google Scholar]
  2. Harding, K.L.; Aguayo, V.M.; Webb, P. Hidden hunger in South Asia: A review of recent trends and persistent challenges. Public Health Nutr. 2018, 21, 785–795. [Google Scholar] [CrossRef] [Green Version]
  3. Godecke, T.; Stein, A.J.; Qaim, M. The global burden of chronic and hidden hunger: Trends and determinants. Glob. Food Secur. 2018, 17, 21–29. [Google Scholar] [CrossRef]
  4. Bailey, R.L.; West, K.P., Jr.; Black, R.E. The epidemiology of global micronutrient deficiencies. Ann. Nutr. Metab. 2015, 66 (Suppl. 2), 22–33. [Google Scholar] [CrossRef] [PubMed]
  5. Read, S.A.; Obeid, S.; Ahlenstiel, C.; Ahlenstiel, G. The role of zinc in antiviral immunity. Adv. Nutr. 2019, 10, 696–710. [Google Scholar] [CrossRef] [PubMed] [Green Version]
  6. Beck, M.A.; Nelson, H.K.; Shi, Q.; Van Dael, P.; Schiffrin, E.J.; Blum, S.; Barclay, D.; Levander, O.A. Selenium deficiency increases the pathology of an influenza virus infection. FASEB J. 2001, 15, 1481–1483. [Google Scholar] [CrossRef]
  7. Harthill, M. Review: Micronutrient selenium deficiency influences evolution of some viral infectious diseases. Biol. Trace Elem. Res. 2011, 143, 1325–1336. [Google Scholar] [CrossRef]
  8. Guillin, O.M.; Vindry, C.; Ohlmann, T.; Chavatte, L. Selenium, selenoproteins and viral infection. Nutrients 2019, 11, 2101. [Google Scholar] [CrossRef] [Green Version]
  9. Uchide, N.; Ohyama, K.; Bessho, T.; Yuan, B.; Yamakawa, T. Effect of antioxidants on apoptosis induced by influenza virus infection: Inhibition of viral gene replication and transcription with pyrrolidine dithiocarbamate. Antivir. Res. 2002, 56, 207–217. [Google Scholar] [CrossRef]
  10. te Velthuis, A.J.; van den Worm, S.H.; Sims, A.C.; Baric, R.S.; Snijder, E.J.; van Hemert, M.J. Zn2+ inhibits coronavirus and arterivirus RNA polymerase activity in vitro and zinc ionophores block the replication of these viruses in cell culture. PLoS Pathog. 2010, 6, e1001176. [Google Scholar] [CrossRef]
  11. Derwand, R.; Scholz, M. Does zinc supplementation enhance the clinical efficacy of chloroquine/hydroxychloroquine to win today’s battle against COVID-19? Med. Hypotheses 2020, 142, 109815. [Google Scholar] [CrossRef]
  12. Cakmak, I.; Kutman, U.B. Agronomic biofortification of cereals with zinc: A review. Eur. J. Soil Sci. 2018, 69, 172–180. [Google Scholar] [CrossRef] [Green Version]
  13. Cakmak, I. Enrichment of cereal grains with zinc: Agronomic or genetic biofortification? Plant Soil 2008, 302, 1–17. [Google Scholar] [CrossRef]
  14. Lyons, G. Biofortification of cereals with foliar selenium and iodine could reduce hypothyroidism. Front. Plant Sci. 2018, 9, 730. [Google Scholar] [CrossRef] [PubMed] [Green Version]
  15. Bouis, H.E.; Saltzman, A. Improving nutrition through biofortification: A review of evidence from HarvestPlus, 2003 through 2016. Glob. Food Secur. 2017, 12, 49–58. [Google Scholar] [CrossRef] [PubMed]
  16. Naeem, A.; Aslam, M.; Lodhi, A. Improved potassium nutrition retrieves phosphorus-induced decrease in zinc uptake and grain zinc concentration of wheat. J. Sci. Food Agric. 2018, 98, 4351–4356. [Google Scholar] [CrossRef]
  17. Velu, G.; Tutus, Y.; Gomez-Becerra, H.; Hao, Y.F.; Demir, L.; Kara, R.; Crespo-Herrera, L.A.; Orhan, S.; Yazici, A.; Singh, R.P.; et al. QTL mapping for grain zinc and iron concentrations and zinc efficiency in a tetraploid and hexaploid wheat mapping populations. Plant Soil 2017, 411, 81–99. [Google Scholar] [CrossRef]
  18. Velu, G.; Singh, R.P.; Crespo-Herrera, L.; Juliana, P.; Dreisigacker, S.; Valluru, R.; Stangoulis, J.; Sohu, V.S.; Mavi, G.S.; Mishra, V.K.; et al. Genetic dissection of grain zinc concentration in spring wheat for mainstreaming biofortification in CIMMYT wheat breeding. Sci. Rep. 2018, 8, 13526. [Google Scholar] [CrossRef] [PubMed]
  19. Zou, C.Q.; Zhang, Y.Q.; Rashid, A.; Ram, H.; Savasli, E.; Arisoy, R.Z.; Ortiz-Monasterio, I.; Simunji, S.; Wang, Z.H.; Sohu, V.; et al. Biofortification of wheat with zinc through zinc fertilization in seven countries. Plant Soil 2012, 361, 119–130. [Google Scholar] [CrossRef]
  20. Phattarakul, N.; Rerkasem, B.; Li, L.J.; Wu, L.H.; Zou, C.Q.; Ram, H.; Sohu, V.S.; Kang, B.S.; Surek, H.; Kalayci, M.; et al. Biofortification of rice grain with zinc through zinc fertilization in different countries. Plant Soil 2012, 361, 131–141. [Google Scholar] [CrossRef]
  21. Cakmak, I.; Prom-U-Thai, C.; Guilherme, L.R.G.; Rashid, A.; Hora, K.H.; Yazici, A.; Savasli, E.; Kalayci, M.; Tutus, Y.; Phuphong, P.; et al. Iodine biofortification of wheat, rice and maize through fertilizer strategy. Plant Soil 2017, 418, 319–335. [Google Scholar] [CrossRef]
  22. Zou, C.Q.; Du, Y.; Rashid, A.; Ram, H.; Savasli, E.; Pieterse, P.J.; Ortiz-Monasterio, I.; Yazici, A.; Kaur, C.; Mahmood, K.; et al. Simultaneous biofortification of wheat with zinc, iodine, selenium, and iron through foliar treatment of a micronutrient cocktail in six countries. J. Agric. Food Chem. 2019, 67, 8096–8106. [Google Scholar] [CrossRef] [Green Version]
  23. Kutman, U.B.; Yildiz, B.; Cakmak, I. Effect of nitrogen on uptake, remobilization and partitioning of zinc and iron throughout the development of durum wheat. Plant Soil 2011, 342, 149–164. [Google Scholar] [CrossRef]
  24. Xue, Y.F.; Yue, S.C.; Zhang, Y.Q.; Cui, Z.L.; Chen, X.P.; Yang, F.C.; Cakmak, I.; McGrath, S.P.; Zhang, F.S.; Zou, C.Q. Grain and shoot zinc accumulation in winter wheat affected by nitrogen management. Plant Soil 2012, 361, 153–163. [Google Scholar] [CrossRef]
  25. Xue, Y.F.; Yue, S.C.; Liu, D.Y.; Zhang, W.; Chen, X.P.; Zou, C.Q. Dynamic zinc accumulation and contributions of pre- and/or post-silking zinc uptake to grain zinc of maize as affected by nitrogen supply. Front. Plant Sci. 2019, 10, 1203. [Google Scholar] [CrossRef] [Green Version]
  26. Jaksomsak, P.; Rerkasem, B.; Prom-u-Thai, C. Responses of grain zinc and nitrogen concentration to nitrogen fertilizer application in rice varieties with high-yielding low-grain zinc and low-yielding high grain zinc concentration. Plant Soil 2011, 411, 101–109. [Google Scholar] [CrossRef]
  27. Aciksoz, S.B.; Ozturk, L.; Gokmen, O.O.; Römheld, V.; Cakmak, I. Effect of nitrogen on root release of phytosiderophores and root uptake of Fe(III)-phytosiderophore in Fe-deficient wheat plants. Physiol. Plant 2011, 142, 287–296. [Google Scholar] [CrossRef]
  28. Cakmak, I.; Pfeiffer, W.H.; McClafferty, B. Biofortification of durum wheat with zinc and iron. Cereal Chem. 2010, 87, 10–20. [Google Scholar] [CrossRef] [Green Version]
  29. Tsukada, H.; Hasegawa, H.; Takeda, A.; Hisamatsu, S. Concentrations of major and trace elements in polished rice and paddy soils collected in Aomori, Japan. J. Radioanal. Nuclear Chem. 2007, 273, 199–203. [Google Scholar] [CrossRef]
  30. Zia, M.H.; Watts, M.J.; Gardner, A.; Chenery, S.R. Iodine status of soils, grain crops, and irrigation waters in Pakistan. Environ. Earth Sci. 2015, 73, 7995–8008. [Google Scholar] [CrossRef] [Green Version]
  31. Zimmermann, M.B. The adverse effects of mild-to-moderate iodine deficiency during pregnancy and childhood: A review. Thyroid 2007, 17, 829–835. [Google Scholar] [CrossRef]
  32. Weng, H.X.; Weng, J.K.; Yan, A.L.; Hong, C.L.; Yong, W.B.; Qin, Y.C. Increment of iodine content in vegetable plants by applying iodized fertilizer and the residual characteristics of iodine in soil. Biol. Trace Elem. Res. 2008, 123, 218–228. [Google Scholar] [CrossRef] [PubMed]
  33. Voogt, W.; Holwerda, H.T.; Khodabaks, R. Biofortification of lettuce (Lactuca sativa L.) with iodine: The effect of iodine form and concentration in the nutrient solution on growth, development and iodine uptake of lettuce grown in water culture. J. Sci. Food Agric. 2010, 90, 906–913. [Google Scholar] [CrossRef]
  34. Kiferle, C.; Gonzali, S.; Holwerda, H.T.; Ibaceta, R.R.; Perata, P. Tomato fruits: A good target for iodine biofortification. Front. Plant Sci. 2013, 4, 205. [Google Scholar] [CrossRef] [Green Version]
  35. Smoleń, S.; Kowalska, I.; Sady, W. Assessment of biofortification with iodine and selenium of lettuce cultivated in the NFT hydroponic system. Sci. Hortic. 2014, 166, 9–16. [Google Scholar] [CrossRef]
  36. Ledwożyw-Smoleń, I.; Smoleń, S.; Rożek, S.; Sady, W.; Strzetelski, P. Iodine biofortification of potato (Solanum tuberosum L.) grown in field. Agronomy 2020, 10, 1916. [Google Scholar] [CrossRef]
  37. HarvestPlus. Biofortification Progress Briefs; HarvestPlus: Washington, DC, USA, 2014. [Google Scholar]
  38. Welch, R.M.; Graham, R.D. Breeding crops for enhanced micronutrient content. In Food Security in Nutrient-Stressed Environments: Exploiting Plants’ Genetic Capabilities; Adu-Gyamfi, J.J., Ed.; Springer: Dordrecht, The Netherlands, 2002; pp. 267–276. [Google Scholar]
  39. Welch, R.M.; Graham, R.D. Breeding for micronutrients in staple food crops from a human nutrition perspective. J. Exp. Bot. 2004, 55, 353–364. [Google Scholar] [CrossRef] [Green Version]
  40. Whanger, P.D. Selenium and its relationship to cancer: An update. Br. J. Nutr. 2004, 91, 11–28. [Google Scholar] [CrossRef] [PubMed] [Green Version]
  41. Yuan, L.; Xuebin, Y.; Yuanyuan, Z.; Fei, L.; Yang, H.; Ying, L.; Zhiqing, L. Selenium in plants and soils, and selenosis in Enshi, China: Implications for selenium biofortification. In Phytoremediation and Biofortification-Two Sids of One Coins; Yin, X., Yuan, L., Eds.; Springer: Dordrecht, The Netherlands, 2012; pp. 7–31. [Google Scholar]
  42. Lyons, G.; Stangoulis, J.; Graham, R. High-selenium wheat: Biofortification for better health. Nutr. Res. Rev. 2003, 16, 45–60. [Google Scholar] [CrossRef] [Green Version]
  43. Lyons, G.H.; Judson, G.J.; Ortiz-Monasterio, I.; Genc, Y.; Stangoulis, J.C.R.; Graham, R.D. Selenium in Australia: Selenium status and biofortification of wheat for better health. J. Trace Elem. Med. Biol. 2005, 19, 75–82. [Google Scholar] [CrossRef]
  44. Boldrin, P.F.; Faquin, V.; Ramos, S.J.; Boldrin, K.V.; Ávila, F.W.; Guilherme, L.R. Soil and foliar application of selenium in rice biofortification. J. Food Compost. Anal. 2013, 31, 238–244. [Google Scholar] [CrossRef]
  45. Lidon, F.C.; Oliveira, K.; Ribeiro, M.M.; Pelica, J.; Pataco, I.; Ramalho, J.C.; Leitão, A.E.; Almeida, A.S.; Campos, P.S.; Ribeiro-Barros, A.I.; et al. Selenium biofortification of rice grains and implications on macronutrients quality. J. Cereal Sci. 2018, 81, 22–29. [Google Scholar] [CrossRef]
  46. de Lima Lessa, J.H.; Raymundo, J.F.; Corguinha, A.P.B.; Martins, F.A.D.; Araujo, A.M.; Santiago, F.E.M.; de Carvale, H.W.; Guilherme, L.R.; Lopes, G. Strategies for applying selenium for biofortification of rice in tropical soils and their effect on element accumulation and distribution in grains. J. Cereal Sci. 2020, 96, 103125. [Google Scholar] [CrossRef]
  47. Reis, H.P.G.; de Queiroz Barcelos, J.P.; Silva, V.M.; Santos, E.F.; Tavanti, R.F.R.; Putti, F.F.; Young, S.D.; Broadley, M.R.; White, P.J.; Dos Reis, A.R. Agronomic biofortification with selenium impacts storage proteins in grains of upland rice. J. Sci. Food Agric. 2020, 100, 1990–1997. [Google Scholar] [CrossRef]
  48. Mabesa, R.L.; Impa, S.M.; Grewal, D.; Johnson-Beebout, S.E. Contrasting grain-Zn response of biofortification rice (Oryza sativa L.) breeding lines to foliar Zn application. Field Crop. Res. 2013, 149, 223–233. [Google Scholar] [CrossRef]
  49. Singh, M.K.; Prasad, S.K. Agronomic aspects of zinc biofortification in rice (Oryza sativa L.). Proc. Natl. Acad. Sci. India Sect. B Biol. Sci. 2014, 84, 613–623. [Google Scholar] [CrossRef]
  50. Zhang, C.M.; Zhao, W.Y.; Gao, A.X.; Su, T.T.; Wang, Y.K.; Zhang, Y.Q.; Zhou, X.B.; He, X.H. How could agronomic biofortification of rice be an alternative strategy with higher cost-effectiveness for human iron and zinc deficiency in China? Food Nutr. Bull. 2018, 39, 246–259. [Google Scholar] [CrossRef] [Green Version]
  51. Goloran, J.B.; Johnson-Beebout, S.E.; Morete, M.J.; Impa, S.M.; Kirk, G.J.D.; Wissuwa, M. Grain Zn concentrations and yield of Zn-biofortified versus Zn-efficient rice genotypes under contrasting growth conditions. Field Crop. Res. 2019, 234, 26–32. [Google Scholar] [CrossRef] [Green Version]
  52. Budke, C.; Mühling, K.H.; Daum, D. Iodine uptake and translocation in apple trees grown under protected cultivation. J. Plant Nutr. Soil Sci. 2020, 183, 468–481. [Google Scholar] [CrossRef]
  53. Wójcik, P.; Wójcik, M. Preharvest iodine sprays at high rates are more effective in biofortification of apples than soil application. Plant Soil 2021, 465, 317–334. [Google Scholar] [CrossRef]
  54. Mangueze, A.V.D.J.; Pessoa, M.F.; Silva, M.J.; Ndayiragije, A.; Magaia, H.E.; Cossa, V.S.; Reboredo, F.H.; Carvalho, M.L.; Santos, J.P.; Guerra, M.; et al. Simultaneous zinc and selenium biofortification in rice. Accumulation, localization and implications on the overall mineral content of the flour. J. Cereal Sci. 2018, 82, 34–41. [Google Scholar] [CrossRef]
  55. Budke, C.; Dierend, W.; Schȍn, H.G.; Hora, K.; Mühling, K.H.; Daum, D. Iodine biofortifcation of apples and pears in an orchard using foliar sprays of diferent composition. Front. Plant Sci. 2021, 12, 638671. [Google Scholar] [CrossRef]
  56. Fang, Y.; Wang, L.; Xin, Z.; Zhao, L.; An, X.; Hu, Q. Effect of foliar application of zinc, selenium, and iron fertilizers on nutrients concentration and yield of rice grain in China. J. Agric. Food Chem. 2008, 56, 2079–2084. [Google Scholar] [CrossRef] [PubMed]
  57. Cakmak, I.; Marzorati, M.; Van den Abbeele, P.; Hora, K.; Holwerda, H.T.; Yazici, M.A.; Savasli, E.; Neri, J.; Du Laing, G. Fate and bioaccessibility of iodine in food prepared from agronomically biofortified wheat and rice and impact of cofertilization with zinc and selenium. J. Agric. Food Chem. 2020, 68, 1525–1535. [Google Scholar] [CrossRef]
  58. Prom-U-Thai, C.; Rashid, A.; Ram, H.; Zou, C.; Guilherme, L.; Corguinha, A.; Guo, S.; Kaur, C.; Naeem, A.; Yamuangmorn, S.; et al. Simultaneous biofortification of rice with zinc, iodine, iron and selenium through foliar treatment of a micronutrient cocktail in five countries. Front. Plant Sci. 2020, 11, 589835. [Google Scholar] [CrossRef] [PubMed]
  59. Impa, S.M.; Morete, M.J.; Ismail, A.M.; Schulin, R.; Johnson-Beebout, S.E. Zn uptake, translocation, and grain Zn loading in rice (Oryza sativa L.) genotypes selected for Zn deficiency tolerance and high grain Zn. J. Exp. Bot. 2013, 64, 2739–2751. [Google Scholar] [CrossRef]
  60. Johnson-Beebout, S.E.; Goloran, J.B.; Rubianes, F.H.; Jacob, J.D.; Castillo, O.B. Zn uptake behavior of rice genotypes and its implication on grain Zn biofortification. Sci. Rep. 2016, 6, 38301. [Google Scholar] [CrossRef] [Green Version]
  61. Sanjeeva, R.D.; Neeraja, C.N.; Babu, M.P.; Nirmala, B.; Suman, K.; Rao, L.V.; Surekha, K.; Raghu, P.; Longvah, T.; Surendra, P.; et al. Zinc biofortified rice varieties: Challenges, possibilities, and progress in India. Front. Nutr. 2020, 7, 26. [Google Scholar] [CrossRef] [PubMed] [Green Version]
  62. Richards, L.A. Diagnosis and Improvement of Saline and Alkali Soils; Agriculture Handbook No. 60; United States Salinity Laboratory Staff, United States Department of Agriculture: Washington, DC, USA, 1954. [Google Scholar]
  63. Bouyoucos, G.H. Hydrometer method improved for making particle size analysis of soils. Agron. J. 1962, 54, 454–465. [Google Scholar] [CrossRef]
  64. Jackson, M.L. Soil Chemical Analysis; Prentice-Hall: Englewood Cliff, NJ, USA, 1962. [Google Scholar]
  65. FAO. The Euphrates Pilot Irrigation Project. Methods of Soil Analysis, Gadeb Soil Laboratory (A Laboratory Manual); Food and Agriculture Organization: Rome, Italy, 1974. [Google Scholar]
  66. Lindsay, E.L.; Norvell, W.A. Development of a DTPA soil test for zinc, iron, manganese, and copper. Soil Sci. Soc. Am. J. 1978, 42, 421–428. [Google Scholar] [CrossRef]
  67. Dhillon, K.S.; Rani, N.; Dhillon, S.K. Evaluation of different extractants for the estimation of bioavailable selenium in seleniferous soils of Northwest India. Austr. J. Soil Res. 2005, 43, 639–645. [Google Scholar] [CrossRef]
  68. AOAC. Official Methods of Analysis, 15th ed.; Association of Official Analytical Chemists: Arlington, VA, USA, 1999. [Google Scholar]
  69. Steel, R.G.D.; Torrie, J.H.; Dickey, D.A. Principles and Procedures of Statistics. A Biometrical Approach, 3rd ed.; McGraw Hill: New York, NY, USA, 1996. [Google Scholar]
  70. Sims, J.T.; Johnson, G.V. Micronutrient soil tests. In Micronutrients in Agriculture; Mortvedt, J.J., Cox, F.R., Shuman, L.M., Welch, R.M., Eds.; Soil Science Society America Book Series; Soil Science Society of America: Madison, WI, USA, 1991; pp. 427–476. [Google Scholar]
  71. Lawson, P.G.; Daum, D.; Czauderna, R.; Vorsatz, C. Factors influencing the efficacy of iodine foliar sprays used for biofortifying butterhead lettuce (Lactuca sativa). J. Plant Nutr. Soil Sci. 2016, 179, 661–669. [Google Scholar] [CrossRef]
  72. Goindi, G.; Karmarkar, M.G.; Kapil, U.; Jagannathan, J. Estimation of losses of iodine during different cooking. Asia Pac. J. Clin. Nutr. 1995, 4, 225–227. [Google Scholar] [PubMed]
  73. Sors, T.G.; Ellis, D.R.; Salt, D.E. Selenium uptake, translocation, assimilation and metabolic fate in plants. Photosynth. Res. 2005, 86, 373–389. [Google Scholar] [CrossRef]
  74. Terry, N.; Zayed, A.M.; Souza, M.P.D.; Tarun, A.S. Selenium in higher plants. Annu. Rev. Plant Physiol. Plant Mol. Biol. 2000, 51, 401–432. [Google Scholar] [CrossRef] [PubMed] [Green Version]
  75. Schiavon, M.; Nardi, S.; dalla Vecchia, F.; Ertani, A. Selenium biofortification in the 21st century: Status and challenges for healthy human nutrition. Plant Soil 2020, 453, 245–270. [Google Scholar] [CrossRef]
  76. Liu, K.; Cao, X.; Bai, Q.; Wen, H.; Gu, Z. Relationships between physical properties of brown rice and degree of milling and loss of selenium. J. Food Eng. 2009, 94, 69–74. [Google Scholar] [CrossRef]
  77. Sun, G.; Van de Wiele, T.; Alava, P.; Tack, F.; Du Laing, G. Bioaccessibility of selenium from cooked rice as determined in a simulator of the human intestinal tract (SHIME). J. Sci. Food Agric. 2017, 97, 3540–3545. [Google Scholar] [CrossRef]
  78. Martínez, C.; Borrero, J.; Taboada, R.; Viana, J.L.; Neves, P.; Narvaez, L.; Puldon, V.; Adames, A.; Vargas, A. Rice cultivars with enhanced iron and zinc content to improve human nutrition. In Proceedings of the 28th International Rice Research Conference, Hanoi, Vietnam, 8 November 2010. [Google Scholar]
  79. Saha, S.; Chakraborty, M.; Padhan, D.; Saha, B.; Murmu, S.; Batabyal, K.; Seth, A.; Hazra, G.C.; Mandal, B.; Bell, R.W. Agronomic biofortification of zinc in rice: Influence of cultivars and zinc application methods on grain yield and zinc bioavailability. Field Crop. Res. 2017, 210, 52–60. [Google Scholar] [CrossRef]
  80. Ram, H.; Rashid, A.; Zhang, W.; Duarte, A.P.; Phattarakul, N.; Simunji, S.; Kalayci, M.; Freitas, R.; Rerkasem, B.; Bal, R.S.; et al. Biofortification of wheat, rice and common bean by applying foliar zinc fertilizer along with pesticides in seven countries. Plant Soil 2016, 403, 389–401. [Google Scholar] [CrossRef]
  81. Knez, M.; Stangoulis, J.C.R. Calcium Biofortification of Crops-Challenges and Projected Benefits. Front Plant Sci. 2021, 12, 669053. [Google Scholar] [CrossRef]
  82. Xia, H.; Kong, W.; Wang, L.; Xue, Y.; Liu, W.; Zhang, C.; Yang, S.; Li, C. Foliar Zn Spraying Simultaneously Improved Concentrations and Bioavailability of Zn and Fe in Maize Grains Irrespective of Foliar Sucrose Supply. Agronomy 2019, 9, 386. [Google Scholar] [CrossRef] [Green Version]
  83. Narváez-Ortiz, W.A.; Martínez-Hernández, M.; Fuentes-Lara, L.O.; Benavides-Mendoza, A.; Valenzuela-García, J.R.; González-Fuentes, J. Effect of selenium application on mineral macro-and micronutrients and antioxidant status in strawberries. J. Appl. Bot. Food Qual. 2018, 91, 321–331. [Google Scholar]
Figure 1. Effect of foliar sprays of KIO3 (0.05%) alone or contained in a cocktail together with ZnSO4∙7H2O (0.5%) and Na2SeO4 (0.0024%) on I concentration in brown rice grains of different Basmati rice cultivars. Control, two foliar sprays of distilled water; Foliar KIO3, two foliar sprays of 0.05% KIO3; Foliar Cocktail, two foliar sprays of a mixture of 0.05% KIO3, 0.0024% Na2SeO4 and 0.5% ZnSO4·7H2O. Bars (mean ± SE) having different letters differ significantly at p = 0.05. LSD: Cultivar = 23.9, Treatment = 20.7, Cultivar × Treatment = 41.4.
Agronomy 12 00049 g001
Figure 2. Effect of foliar application of Na2SeO4 (0.0024%) alone or contained in a cocktail together with KIO3 (0.05%) and ZnSO4∙7H2O (0.5%) on Se concentration in brown rice grains of different Basmati rice cultivars. Control, two foliar sprays of distilled water; Foliar Na2SeO4; two foliar sprays of 0.0024% Na2SeO4; Foliar Cocktail, two foliar sprays of a mixture of 0.05% KIO3, 0.0024% Na2SeO4, and 0.5% ZnSO4∙7H2O. Data bars (mean ± SE) having different letters differed significantly at p = 0.05. LSD: Cultivar = 57.6, Treatment = 49.9, Cultivar × Treatment = 99.8.
Agronomy 12 00049 g002
Figure 3. Effect of foliar sprays of KIO3 (0.05%), Na2SeO4 (0.0024%), and ZnSO4∙7H2O (0.5%) alone or together as a cocktail on Ca concentration in brown rice grains of different Basmati rice cultivars. Control, two foliar sprays of distilled water; Foliar KIO3, two foliar sprays of 0.05% KIO3; Foliar Na2SeO4, two foliar sprays of 0.0024% Na2SeO4; Foliar ZnSO4, two foliar sprays of 0.5% ZnSO4·7H2O; Foliar Cocktail, two foliar sprays of a mixture of 0.05% KIO3, 0.0024% Na2SeO4 and 0.5% ZnSO4·7H2O. Data bars (mean ± SE) having different letters differ significantly at p = 0.05. LSD: Cultivar = 4.37, Treatment = NS, Cultivar × Treatment = 9.76.
Agronomy 12 00049 g003
Table 1. Physicochemical properties of soil of the experimental field.
ParameterUnitValue
Texture Sandy loam
pH1:1 8.30
EC1:1dS m−10.65
CaCO3 equivalentg 100 g−1 soil3.54
Organic carbong 100 g−1 soil0.46
NaHCO3 extractable Pmg kg−1 soil26.0
NH4OAc extractable Kmg kg−1 soil77.0
TMAH extractable I *µg kg−1 soil0.20
KH2PO4 extractable Se *µg kg−1 soil12.0
DTPA extractable Zn *mg kg−1 soil1.09
* The concentration of I and Se in soil was very low, and that of Zn was adequate for plant growth.
Table 2. Effect of foliar treatments on paddy yield (Mg ha−1) of different cultivars of Basmati rice.
Treatment aBasmati-515Chenab BasmatiKisan BasmatiSuper BasmatiMean
Control3.24 ± 0.024.98 ± 0.294.36 ± 0.163.76 ± 0.104.09
Foliar KIO33.28 ± 0.144.80 ± 0.064.48 ± 0.103.67 ± 0.264.06
Foliar Na2SeO43.13 ± 0.155.10 ± 0.134.46 ± 0.063.83 ± 0.174.13
Foliar ZnSO43.20 ± 0.144.95 ± 0.254.37 ± 0.103.85 ± 0.064.09
Foliar Cocktail3.21 ± 0.104.98 ± 0.324.53 ± 0.093.60 ± 0.104.08
Mean3.21 a *4.96 a4.44 b3.74 c
a Control, two foliar sprays of distilled water; Foliar KIO3, two foliar sprays of 0.05% KIO3; Foliar Na2SeO4, two foliar sprays of 0.0024% Na2SeO4; Foliar ZnSO4, two foliar sprays of 0.5% ZnSO4·7H2O; Foliar Cocktail, two foliar sprays of a mixture of 0.05% KIO3, 0.0024% Na2SeO4 and 0.5% ZnSO4·7H2O. * Values (means ± SE) within a row followed by different letters differed significantly at p = 0.05. LSD: Cultivar = 0.205, Treatment = NS, Cultivar × Treatment = NS.
Table 3. Effect of foliar treatments on Zn concentration (mg kg−1 grain) in brown rice grains of different Basmati cultivars.
Treatment aBasmati-515Chenab BasmatiKisan BasmatiSuper BasmatiMean
Control14.8 ± 0.4213.6 ± 0.6018.5 ± 0.3419.0 ± 0.3216.5 b *
Foliar ZnSO420.7 ± 0.5419.7 ± 0.7023.2 ± 0.5524.5 ± 0.3022.0 a
Foliar Cocktail21.4 ± 0.3419.8 ± 0.6824.0 ± 0.3124.3 ± 0.2822.3 a
Mean19.0 b *17.7 c21.9 a22.6 a
a Control, two foliar sprays of distilled water; Foliar ZnSO4, two foliar sprays of 0.5% ZnSO4·7H2O; Foliar Cocktail, two foliar sprays of a mixture of 0.05% KIO3, 0.0024% Na2SeO4, and 0.5% ZnSO4·7H2O. Values (means ± SE) within a column or row followed by different letters differ significantly at p = 0.05. * LSD: Cultivar = 0.69, Treatment = 0.80, Cultivar × Treatment = NS.
Table 4. Effect of foliar treatments on Cu, Fe, and Mn concentration in brown rice grains of different Basmati cultivars.
Treatment aBasmati-515Chenab BasmatiKisan BasmatiSuper BasmatiMean
Cu (mg kg−1)
Control1.7 ± 0.072.2 ± 0.093.6 ± 0.143.0 ± 0.112.6
Foliar KIO32.1 ± 0.052.5 ± 0.043.5 ± 0.153.0 ± 0.132.8
Foliar Na2SeO41.9 ± 0.012.3 ± 0.053.5 ± 0.162.8 ± 0.072.6
Foliar ZnSO42.1 ± 0.092.2 ± 0.013.6 ± 0.133.1 ± 0.102.7
Foliar Cocktail2.0 ± 0.062.4 ± 0.043.4 ± 0.132.6 ± 0.052.6
Mean2.0 c *2.3 c3.5 a2.9 b2.6
Fe (mg kg−1)
Control7.9 ± 0.428.6 ± 0.5110.8 ± 0.3611.3 ± 0.609.7
Foliar KIO38.3 ± 0.358.7 ± 0.2710.2 ± 0.2411.0 ± 0.289.5
Foliar Na2SeO47.6 ± 0.079.2 ± 0.5711.1 ± 0.2910.6 ± 0.19.6
Foliar ZnSO48.4 ± 0.419.2 ± 0.2510.2 ± 0.1311.2 ± 0.339.7
Foliar Cocktail8.7 ± 0.159.0 ± 0.4511.2 ± 0.4411.0 ± 0.4510.0
Mean8.2 c8.9 b10.7 a11.0 a
Mn (mg kg−1)
Control17.7 ± 0.4317.3 ± 1.0417.6 ± 0.4522.0 ± 0.3518.6
Foliar KIO319.0 ± 0.5317.9 ± 0.7618.1 ± 0.4422.4 ± 0.7919.3
Foliar Na2SeO418.1 ± 0.3117.9 ± 0.7819.6 ± 0.2023.0 ± 0.8219.7
Foliar ZnSO417.7 ± 0.3517.9 ± 0.6517.2 ± 0.7323.4 ± 0.8419.0
Foliar Cocktail18.6 ± 0.0418.2 ± 0.4519.2 ± 0.2921.6 ± 0.5419.4
Mean18.20 b17.83 b18.33 b22.51 a
a Control, two foliar sprays of distilled water; Foliar KIO3, two foliar sprays of 0.05% KIO3, Foliar Na2SeO4; two foliar sprays of 0.0024% Na2SeO4; Foliar ZnSO4, two foliar sprays of 0.5% ZnSO4·7H2O; Foliar Cocktail, two foliar sprays of a mixture of 0.05% KIO3, 0.0024% Na2SeO4, and 0.5% ZnSO4·7H2O. * Values (means ± SE) within a row followed by different letters differed significantly at p = 0.05. LSD: Fe: Cultivar = 0.45, Treatment = NS, Cultivar × Treatment = NS. Cu: Cultivar = 0.15, Treatment = NS, Cultivar × Treatment = NS. Mn: Cultivar = 0.75, Treatment = NS, Cultivar × Treatment = NS.
Publisher’s Note: MDPI stays neutral with regard to jurisdictional claims in published maps and institutional affiliations.

