Article

Salt-Stressed Coriander (Coriandrum sativum L.) Responses to Potassium Silicate, Humic Acid and Gamma Irradiation Pretreatments

1
Department of Botany, Faculty of Science, Ain Shams University, Cairo 11566, Egypt
2
Department of Natural Products, National Center for Radiation Research and Technology, Atomic Energy Authority, Nasr City, P.O. Box 29, Cairo 11787, Egypt
*
Authors to whom correspondence should be addressed.
Submission received: 15 August 2022 / Revised: 15 September 2022 / Accepted: 19 September 2022 / Published: 22 September 2022

Abstract

:
The application of biostimulants has great potential in preserving plants against abiotic or biotic stresses and is integrated into promoting tolerance and acclimating of coriander against salinity stress. Deciphering the morphological, physiological and molecular responses underpinning the ameliorative aspects of ecofriendly biostimulants is indispensable to link and overlap the ameliorative responses of seed priming. Hereby, the ameliorative responses of seed priming against salinity stress using potassium silicate, humic acid, and gamma irradiation were evaluated. Salinity stress generally diminishes vegetation, productivity, and metabolic activities. However, abscisic acid (ABA) levels and soluble sugars were elevated. Pretreatments with potassium silicate or humic acid, followed by gamma rays, alleviated and promoted growth parameters, yield components, and vital metabolic processes in salinity-stressed coriander. This promotion was concurrent with an increase in growth promotors, chlorophyll a/b, carbohydrates, antioxidants (compounds and enzymes), and upregulation of RuBisCO large subunit protein expression. Collectively, potassium silicate and humic acid were the best at alleviating the adverse effects of saline conditions. Triggered pretreatments might be engaged in maintaining metabolic activities toward deleterious salinity impacts. Thus, it was suggested that seed priming by potassium silicate and humic acid is an effective regime benefitting salinized along with nonsalinized plants that sustain coriander productivity.

1. Introduction

Salinity is a serious environmental challenge that affects 50% of modern agriculture, impacts plant distribution, interacts with wild plants along with cultivated plants and is considered the cause for reshaping plants morphologically, physiologically, and genetically, as salinity stress rapidly expanding in cultivable areas poses a major peril to crop yield. Furthermore, salinity induced by NaCl has the most detrimental effect on plants compared to salinity induced by other salts [1]. Notably, salinity exerts lethal effects on the quality and productivity of plants [2]. The impact of salinity on plant growth is ascribed to the disturbance of various physiological processes, suppression of nutrient uptake, enhancement of toxic absorption from soil, and metabolic imbalance [3,4]. Plants under stress operate a highly functioning antioxidative system of enzymes, such as catalase (CAT), polyphenol oxidase (PPO), peroxidase (POD) and superoxide dismutase (SOD), along with low molecular weight elements, such as ascorbic acid, carotenoids, flavonoids, proline, and tocopherols [5]. Nonetheless, disturbance of metabolites is considered an adaptation mechanism to stress that results from disturbance of sensitive pathways to salinity, such as photosynthesis, the tricarboxylic acid (TCA) cycle, amino acid synthesis and reactive axygen species (ROS) scavengers [6].
Coriander is a vegetable plant belonging to the family Apiaceaea that was widely used in ancient times for its nutritional and pharmaceutical values. Coriander, under normal conditions, synthesizes vital biochemical principles regarded as biologically potent, including essential oils, geraniol, coriandrin and dihydrocoriandrin, flavonoids, terpenes, cymene, citronellol, monoterpenes and pinene [7]. Several studies have recorded the tolerance, growth and productivity of coriander cultivated under salinity stress. However, adverse salinity effects have attracted attention to the importance of inventing environmentally friendly technologies to assist plant survival [8]. Hence, the application of biostimulants was recently practiced regulating metabolic pathways and enhancing acclimation and tolerance against salinity stress.
Silicon is considered as an essential metal for the healthy growth of most plants and has been thoroughly used as a nutritional supplement to alleviate salinity and enhance strategic tolerance to desiccation and salt stress in grown plants [9,10,11]. Silicon was exploited recently to protect sweet pea plants from seawater salinity, either using the science of nanoparticles or by the traditional techniques of seed hydropriming. Incorporation of silicon nanoparticles into seeds of pea plants prior to germination with seawater, although a reduced germination rate, led to an increased germination percentage due to facilitated water uptake ascribed to the moisture absorption property of silica [12]. On the other hand, halo-priming reduced Na uptake, elevated fresh and dry mass, antioxidant enzymes, antioxidant compounds, and significantly diminished levels of malonyldialdehyde (MDA) accumulation [13].
Humic acid (HA) structure has both phenolic and carboxylic groups and is found in soil following the decomposition of nitrogenous compounds containing amino acids of polymeric organic residues remnants of plants and animal sources and contributes to soil fertility [14]. In addition, HA protects plants under salinity stress by promoting mineral absorption, transportation, decreasing membrane damage, biomass increase and root elongation [14,15,16,17]. Furthermore, HA functions as a growth-regulating substance, promoting plant growth under salinity effects, and an elicitor of photosynthesis, respiration, and phosphate and oxygen uptake [18,19]. Moreover, HA was found to be generally beneficial in reducing proline and promoting plant growth under 120 mM NaCl [20].
The practice of gamma treatments revealed that gamma assisted with plant acclimation to adverse salinity by inducing antioxidant enzymes and hence alleviated oxidative damage [21,22,23,24]. Gamma irradiation at low doses (especially, 50-Gy) was presented to promote the growth parameters of A. thaliana seedlings, decrease H2O2 and MDA levels, increase proline, and induce antioxidant enzymes in treated seedlings compared with the controls [21]. In the same study, gene expression analysis at the transcription level revealed that some signalling cascades associated with salt stress were upregulated under a low dose of gamma rays. Furthermore, gamma rays employed as a widely used physical mutagen in efficient plant mutation breeding act as a signal activating molecule for the plant antioxidant defense system [22,23].
The current investigation was aimed to address efficiency of seed priming regimes using three powerful ameliorative agents with suggested concentrations and doses as follows: potassium silicate (pot. silicate), humic acid (HA), and gamma irradiation (gamma) on the growth, productivity, metabolic activities, and biochemical aspects regarding the cluster analysis of banding patterns of extracted total cellular proteins of grown coriander under normal conditions as well as 150 mM NaCl until or during the flowering stage.

2. Materials and Methods

2.1. Plant Seeds, Chemicals, and Physiological Treatments

Coriander seeds were purchased from Abd-Elhady El-Gayar Company (seeds’ suppliers in local market, Cairo, Egypt). The pot. silicate of 99% purity grade was used (Sigma-Aldrich, Cat. no. 792640). The source of HA used in the present study is registered and accredited by the Egyptian Ministry of Agriculture, Cairo, Egypt under the name of “HUMO” (Acc. No. 7050). Priming of coriander seeds was carried out as summarized and listed in Table 1. The methodological section concerning irradiation experiments was carried out in NCRRT, AEA, Cairo, Egypt by applying Cesium-137 under 0.758 rad s−1 dose rate. Several pilot optimization experiments were conducted to detect the optimum concentration(s) of pot. silicate and HA to be used in seed priming experiments. Therefore, a wide range of ascending concentrations of pot. silicate (10–160 mM) or HA (5–100 mg L−1) were practiced. It was found that the best concentrations were 80 mM and 50 mg L−1 of pot. silicate and HA, respectively. The selection of optimum concentrations was based on the best results that exhibited the maximum readings for vegetative growth characteristics and parameters of yield components (listed in Tables 2–4). Four sets of untreated coriander seeds were primed in; tap water, pot. silicate, HA, and seeds treated by gamma rays (50 Gy) then primed in tap water. All seeds in the four sets were soaked at room temperature (20 ± 2 °C) for 16 h (Table 1).

2.2. Sowing, Irrigation, and Sampling

Before sowing, washing soaked seeds thoroughly with distilled water was done. The seeds were divided into two groups and then sown in plastic pots (40 cm) containing 15 kg clay: sandy (2:1 w/w) soil, 10 seeds per pot, and 10 replicates for each treatment. Pots of the first group were irrigated with tap water and considered the control set for the other saline stress group, which was watered with 150 mM NaCl. All pots were watered, keeping the water holding capacity at 80%. Plants at both the vegetative and yield component stages were harvested 75 and 135 days after the sowing date, respectively. Samples of five plants each were taken from each treatment to measure the growth parameters enumerated in Table 2 and Table 3. The parameters of yield components were recorded for each treatment, as shown in Table 4. The measurements were carried out in the following season, and the average was recorded. The physiological treatments were assigned to a completely randomized design.

2.3. Extraction, Isolation, and Estimation of Plant Growth Regulators

The extraction of plant growth regulators was initially described by Shindy and Smith [25] and fully investigated by Hassanein et al. [26]. Indole-3-acetic (IAA), Gibberellic acid (GA3), and ABA were quantified by an isocratic HPLC-UV analyser, utilizing a RO-C18 reversed-phase column (WATERS Corporation, MA, USA) according to Kelen et al. and Hassanein et al. [26,27]. The identification and characterization of detected peaks of coriander samples were executed using the retention times (RTs) of authentic sample peaks. Peak characterization was detected by comparing the relative RT of each verified peak with those of acidic hormone standards. By triangulation, the peak area was estimated. Additionally, the individual component relative properties were detected at various RTs throughout the samples.

2.4. Estimation of Photosynthetic Pigments

Photosynthetic pigments (Chl a, Chl b, and carotenoids) were colorimetrically defined according to Metzner et al. [28]. Briefly, 85% aqueous acetone was used to homogenize half gram fresh weight of leaves for 5 min. The homogenate was centrifuged at 2800× g for 10 min at 4 °C, and the clear supernatant reached up to 25 mL with 85% aqueous acetone. Measurement of the extract was carried out against a control sample of 85% pure aqueous acetone at three wavelengths: 452, 644, and 663 nm using a DC Tiny 25III Spectropolarimeter. Determination of photosynthetic pigments was executed as shown by Hassanein et al. [26]. Finally, the quantification of pigments was expressed as μg g−1 of leaf dry weight.

2.5. Carbohydrate Content Estimation

Determination of polysaccharides and soluble sugars was performed from 1 g of fresh oven-dried tissues until a fixed weight was obtained at 80 °C and ground to a fine powder. To extract and estimate soluble sugars, homogenization of 25 mg oven-dried tissues by 80% ethanol was executed and kept for 15 min with continuous shaking in a boiling water bath. After cooling, the filtered extract was oven-dried at 60 °C and then dissolved in 2 mL of double distilled water to determine the soluble sugars as described by Homme et al. and Whistler et al. [28,29]. On the other hand, the extraction and estimation of polysaccharides occurred from the dried residue left over after the extraction of soluble carbohydrates, according to Whistler et al. and Hedge et al. [30,31]. By using pure glucose, a calibration curve was generated, and the measurements were expressed as mg g−1 dry weight. The total carbohydrate content was calculated as a sum of polysaccharides plus soluble sugars.

2.6. Extraction and Measurement of Antioxidant Defense Compounds

Antioxidant defense compounds (ascorbic acid, carotenoids, flavonoids, total phenolics, and proline) were estimated. Determination of ascorbic acid was expressed as mg 100 g−1 fresh leave samples that were titrated by 2,6-dichlorophenolindophenol as described by Zvaigzne et al. [32]. On the other hand, the aluminum chloride colorimetric assay was performed to determine total flavonoids as investigated by Marinova et al. [33]. The total flavonoids were represented as mg quercetin equivalent to each 100 g dry weight. Total phenolics were determined as shown by Malik and Singh [34]. The total phenolic concentration was estimated for each 100 g leaf dry weight based on a gallic acid-constructed calibration curve. The readings were measured as mg 100 g−1 dry weight. Estimation of free proline was performed according to Bates et al. [35] and the ninhydrin reagent was prepared as described by Hassanein et al. [26]. The proline concentration was measured on a dry matter basis and estimated using a calibration curve.

2.7. Extraction and Estimation of Antioxidant Enzymes

Liquid nitrogen frozen and ground fresh leaves (250 mg) were homogenized in 100 mM chilled sodium phosphate buffer (KH2PO4/K2HPO4, pH 7.0) supplemented with 1% (w/v) polyvinylpyrrolidone (PVP) and 100 µM EDTA. For each gram of plant tissue, 4 mL of extraction buffer were added. The mixture was homogenized and centrifuged for 15 min at 4 °C at 20,000× g. The supernatant was taken apart to measure catalase (CAT), peroxidase (POD), and polyphenol oxidase (PPO) activities. Furthermore, in the crude extract, protein quantification was estimated according to Lowry et al. [36] using the bovine serum albumin (BSA) calibration curve. CAT (EC 1.11.1.6) activity, POD (EC1.11.1.7), and PPO (EC 1.14.18.1) activity were measured as previously described by Aebi, Hammerschmidt et al. and Oktay et al. [37,38,39], respectively. Finally, the CAT, POD, and PPO activities were measured as unit min−1 mg−1 protein.

2.8. Lipid Peroxidation Estimation

The peroxidation level of lipids was determined using fresh coriander leaves by estimating the quantity of malondialdehyde (MDA) that emerged from the reaction of thiobarbituric acid (TBA) according to Heath and Packer [40]. Half a gram of coriander leaves was homogenized with 5 mL of 0.1% TCA (m/V). The homogenate was centrifuged for 20 min at 10,000× g (Hettich Universal 16 R, Germany). For each milliliter of the supernatant, a freshly prepared reagent of 4 mL TBA 0.5% prepared by TCA 20% was added. The homogenate was incubated for 30 min at 95 °C and consequently cooled on ice. The mixture was centrifuged for 15 min at 10,000× g, and the absorbance at 532 and 600 nm was detected. For nonspecific absorption, the value(s) recorded at 600 nm was subtracted. The MDA concentration was estimated by dividing the detected absorbance difference(s) at A532 and A600 by 155 mM−1 cm−1 (its molar extinction coefficient). Finally, the measurements were expressed as nmol g−1 fresh weight.

2.9. Total Cellular Proteins (TCPs) Extraction and Monitoring the Expression of RuBisCOLS

TCPs were extracted from 75-day-old leaves at the vegetative stage as fully previously described by Hassanein et al. [26]. According to Bradford [41], the protein concentration was estimated by using an Eppendorf Biophotometer (Model #6131). To fractionate isolated TCPs, 10% SDS–PAGE was carried out according to Laemmli [42]. Protein extraction from the leaves was carried out from three biological and three technical replicates. The experimental design, by which the biological and technical replicates were used, is described by Hassanein et al. [26]. Extracted TCPs were equally loaded after estimating their protein concentration. Gel images were documented by Gel Doc™ EZ (Bio-Rad). Based on the protein profile, band scoring (“1” for presence and “0” for absence) was performed. Binary scoring was executed to generate the binary matrix to calculate the genetic similarity coefficient. The similarity matrix was computed according to Dice’s coefficient. The cluster analysis was consequently constructed. The unweighted pair group method with arithmetic mean (UPGMA) agglomerative clustering method was used to generate a distance tree by PAST software, ver. 4.02 (OSLO, Norway) according to Hammer et al. [43]. Quantification of RuBisCOLS protein band was performed using BSA calibration curve and documented by the ImageJ program (IJ 1.46r) as previously described by Hassanein et al. [26].

2.10. Statistical Analysis

Executed biostatistical analyses were carried out using the recorded data obtained from the leaves of three independent biological and three independent technical replicates using IBM SPSS statistical software, ver. 17.0 (IBM, Chicago, IL, USA) and Microsoft Excel 365 (Microsoft Corporation, New Mexico, USA)according to Hassanein et al. [26]. The mean values of the technical replicates were obtained. Values of least significant difference (LSD) at the 5% level of probability were calculated to compare the mean values of different treatments according to Snedecor and Cochran [44]. Based on Duncan’s multiple range test, the different alphabetical letters express significant variation (defined as p < 0.05). Euclidian distance has been used after the data matrix scaling and standardization [45]. By using “pvclust” R-package, the agglomerative cluster analysis was created [46]. The ordination analyses executed by the principal component analysis (PCA) examined the repeatability of the grouping acquired by the cluster analyses as previously described by Igbari et al. [47]. The R-packages, “factoextra” and “ggplot2”, were used for visualizing the distance matrices “fviz_pca” that provide ggplot2-based innovative visualization of PCA [44]. Using the “Corrplot” package, the correlation coefficients for the variable’s relationship were performed and visualized according to Soetewey [48]. Furthermore, R-package “pheatmap” and “ggplot2” packages [49,50] accessed the similarity and dissimilarity within and among the pretreatments or measurements.

3. Results

The percentage value was calculated by subtracting the reading value of the control from the value of any physiological treatment reading, and then the outcome was divided by the reading value of the control. The latter value is multiplied by 100 to get the percentage of decrease/increase. The full and summarized experimental protocol is listed and shown in Table 1.

3.1. Growth and Yield Parameters

The results revealed high percentages of biomass increase in growth parameters on average at both the vegetative stage and flower stage in response to pretreatments with pots. silicate, HA, and γ-radiation as follows: shoot length (157%, 128%), number of leaves/plants (206%, 141%), number of branches/plants (133.4%, 149.2%), leaf area/plant (394%, 191%), fresh and dry weight of shoots and roots (225%, 414%) and (203%, 235%), respectively (Table 2).
Under salinity stress and in response to pretreatments, the average percentages of growth traits at the vegetative stage and the flowering stage were also highly upregulated as follows: shoot length (126.34%, 128%), number of leaves/plants (191.7%, 196.6%), number of branches/plants (173.5%, 147%), leaf area/plant (355%, 283.35%), fresh and dry weight of shoots and roots (142.5%, 133%) and (167%, 125.7%), respectively (Table 2). The inflorescence number increased by 158% under normal growth conditions in response to pretreatment and by 197.28% in pretreated coriander grown under salinity stress (Figure S1 and Table 3). Yield components per plant were upregulated dramatically according to pretreatments in normally grown and salinized coriander. For example, fruit number increased by 323.5% and 571%, seed number increased by 421% and 571%, seed wt. by 705.3% and 1286%, and the weight of 1000 seeds increased by 145.6% and 219%, respectively (Table 4).

3.2. Changes in Phytohormones

The data in Table 5 revealed a 32.865% decrease in IAA and a 68.3% decrease in GA3 in salinized coriander, in addition to a 12% decrease in the IAA + GA3/ABA ratio. Pretreatments caused an average upregulation up to 185.4% in IAA, 106% in GA3, and in normally grown coriander, and up to 345.86% in IAA and to 122.88% increase in GA3 in salinized coriander. The ratio of IAA + GA3/ABA was diminished by 47.6% under normal conditions, although it increased by 207% under salinity stress. The levels of ABA increased by 605.8% under salinity and increased to 275.61% in pretreated salt-free coriander. However, ABA decreased with the pretreatments and salinity together to 65.855%. Gamma rays were the senior agent increasing the IAA and IAA + GA3/ABA ratio and decreasing ABA levels in salinized coriander. Whereas under normal growth conditions, HA was superior in doing so with IAA and the IAA + GA3/ABA ratio, and pot. silicate was the best for decreasing ABA levels, non-significantly.

3.3. Changes in Photosynthetic Pigments and Carbohydrate Contents

The data of Table 6 revealed a significant decrease in chl a by 67.5%, chl b by 46% and total pigments by 60% in the leaves of coriander exposed to salinity stress. However, chl a/b increased by 147%. Normally grown coriander accumulated a higher pigment content, with an average of 114.5%, when seeds were pretreated with pot. silicate, HA and γ-irradiation, with the best effect of HA on the upregulation of chl a, chl b and total pigment content and of gamma on the chl a/b ratio. Salinity-stressed coriander exhibited a 164.05% increase in total pigments, 145% increase in chl a, 218.5% increase in chl b, and a 66.55% decrease in chl a/b with the pretreatments.
Concerning the estimation of carbohydrate contents, data derived from Table 6 detected a 154.54% increase in soluble sugar in coriander plants caused by the salinity effect. Soluble sugar increase was greatly enhanced due to pot. silicate, HA and gamma pretreatments by 167.12% on average. Pretreated salinized coriander contained higher soluble sugar, as a pot. silicate and HA were responsible for a 117.2% increase in soluble sugars on average. Controversially, soluble sugar decreased to 83.53% with gamma pretreatments. A decrease of 73.23% was determined under gamma-only pretreatment. The polysaccharide content decreased to 65.74% under the effect of salinity and increased in pretreated salt-free coriander to 131.27% and in salinized pretreated plants to 153.34% on average. The gamma role was minimal in terms of the upregulation of total carbohydrates, whereas the effects of pot. silicate and HA were maximal.

3.4. Changes in Antioxidant Compounds

The degree of numerous fluctuations in antioxidant (ascorbic acid, carotenoids, flavonoid, phenols, and proline) activities were detected in coriander leaves due to seed pretreatments prior to sowing using pot. silicate, HA or gamma with or without salinity stress are illustrated in Table 7. The prevailing effect of salinity stress led to reduced ascorbic acid and carotenoid contents (p ˂ 0.05) to 45% and 57% of those of the control, respectively. In contrast, flavonoids, total phenols and proline increased up to 143.6%, 112%, and 420.5% over the control, respectively. Using of pot. silicate and HA were responsible for alleviation of ascorbic acid up to 130.6% in normal coriander. Pretreatments also caused an increase in carotenoids to 126.78% on average under normal conditions and to 205% in the saline condition. Pretreatments led to under saline conditions. Pretreatment led to a 360% increase in flavonoids under normal conditions and caused a reduction of 85% under salinized conditions. Pretreatments led to a reduction in total phenols to 97% under normal conditions and to 90.03% under salinized conditions. Proline increased due to pretreatments under normal conditions to 128.7% on average and decreased to 37.4% on average in salinized plants (Table 7).

3.5. Changes in the Antioxidant Enzyme Pool and MDA

The activities of three antioxidant enzymes were estimated in control and salinized coriander plants. The data showed a pronounced increase in the activities of polyphenol oxidase (PPO, 208%), peroxidase (POD, 416%), and catalase (CAT, 191.22%) under salinity stress (Table 8). Potassium silicate pre-treatment increased POD activity to 120.14% over salt-free control plants. In salinized coriander, PPO activity dramatically diminished to 9.26% under the gamma effect, to 67.9% under the HA effect and to 78.83% due to pot. silicate pretreatment. The applied pretreatments induced a 221.7% increase in POD on average in salt-free coriander. In contrast, POD decreased to 55.55% on average under the effects of pretreatments combined with salinity stress. Pretreatments exert varied effects on CAT activity. For example, Sil induced CAT activity up to 145.6%, HA reduced CAT activity to 79.02%, and gamma diminished CAT activity to 37% compared to normally grown coriander plants. In salinized coriander, pot. silicate increased CAT activity up to 113.26%, HA reduced CAT to 81.46% and gamma also reduced CAT activity to 38.76%. Normally grown coriander revealed a 123.08% increase in MDA due to pretreatments; whereas, the MDA level was reduced to 60.23% in pretreated salinized plants (Table 8).
To draw further conclusive insights based on applied pretreatments, performed morphological and metabolic measurements were then analyzed for their correlation with each other (Figure 1). The colour scale is relative to the divergence value between investigated measurements. The blue colour indicated the positive correlation between measurements, whereas the red colour assumed the negative one. In this connection, the PCA biplot by plotting Dim1 (64.6%) and Dim2 (13.6%) with total ordination analysis of 78.2% confirmed the key morphological or metabolic measurement(s) that play a pronouncing role under control, saline conditions or upon alleviating the salt stress by applied pretreatments (Figure 2).

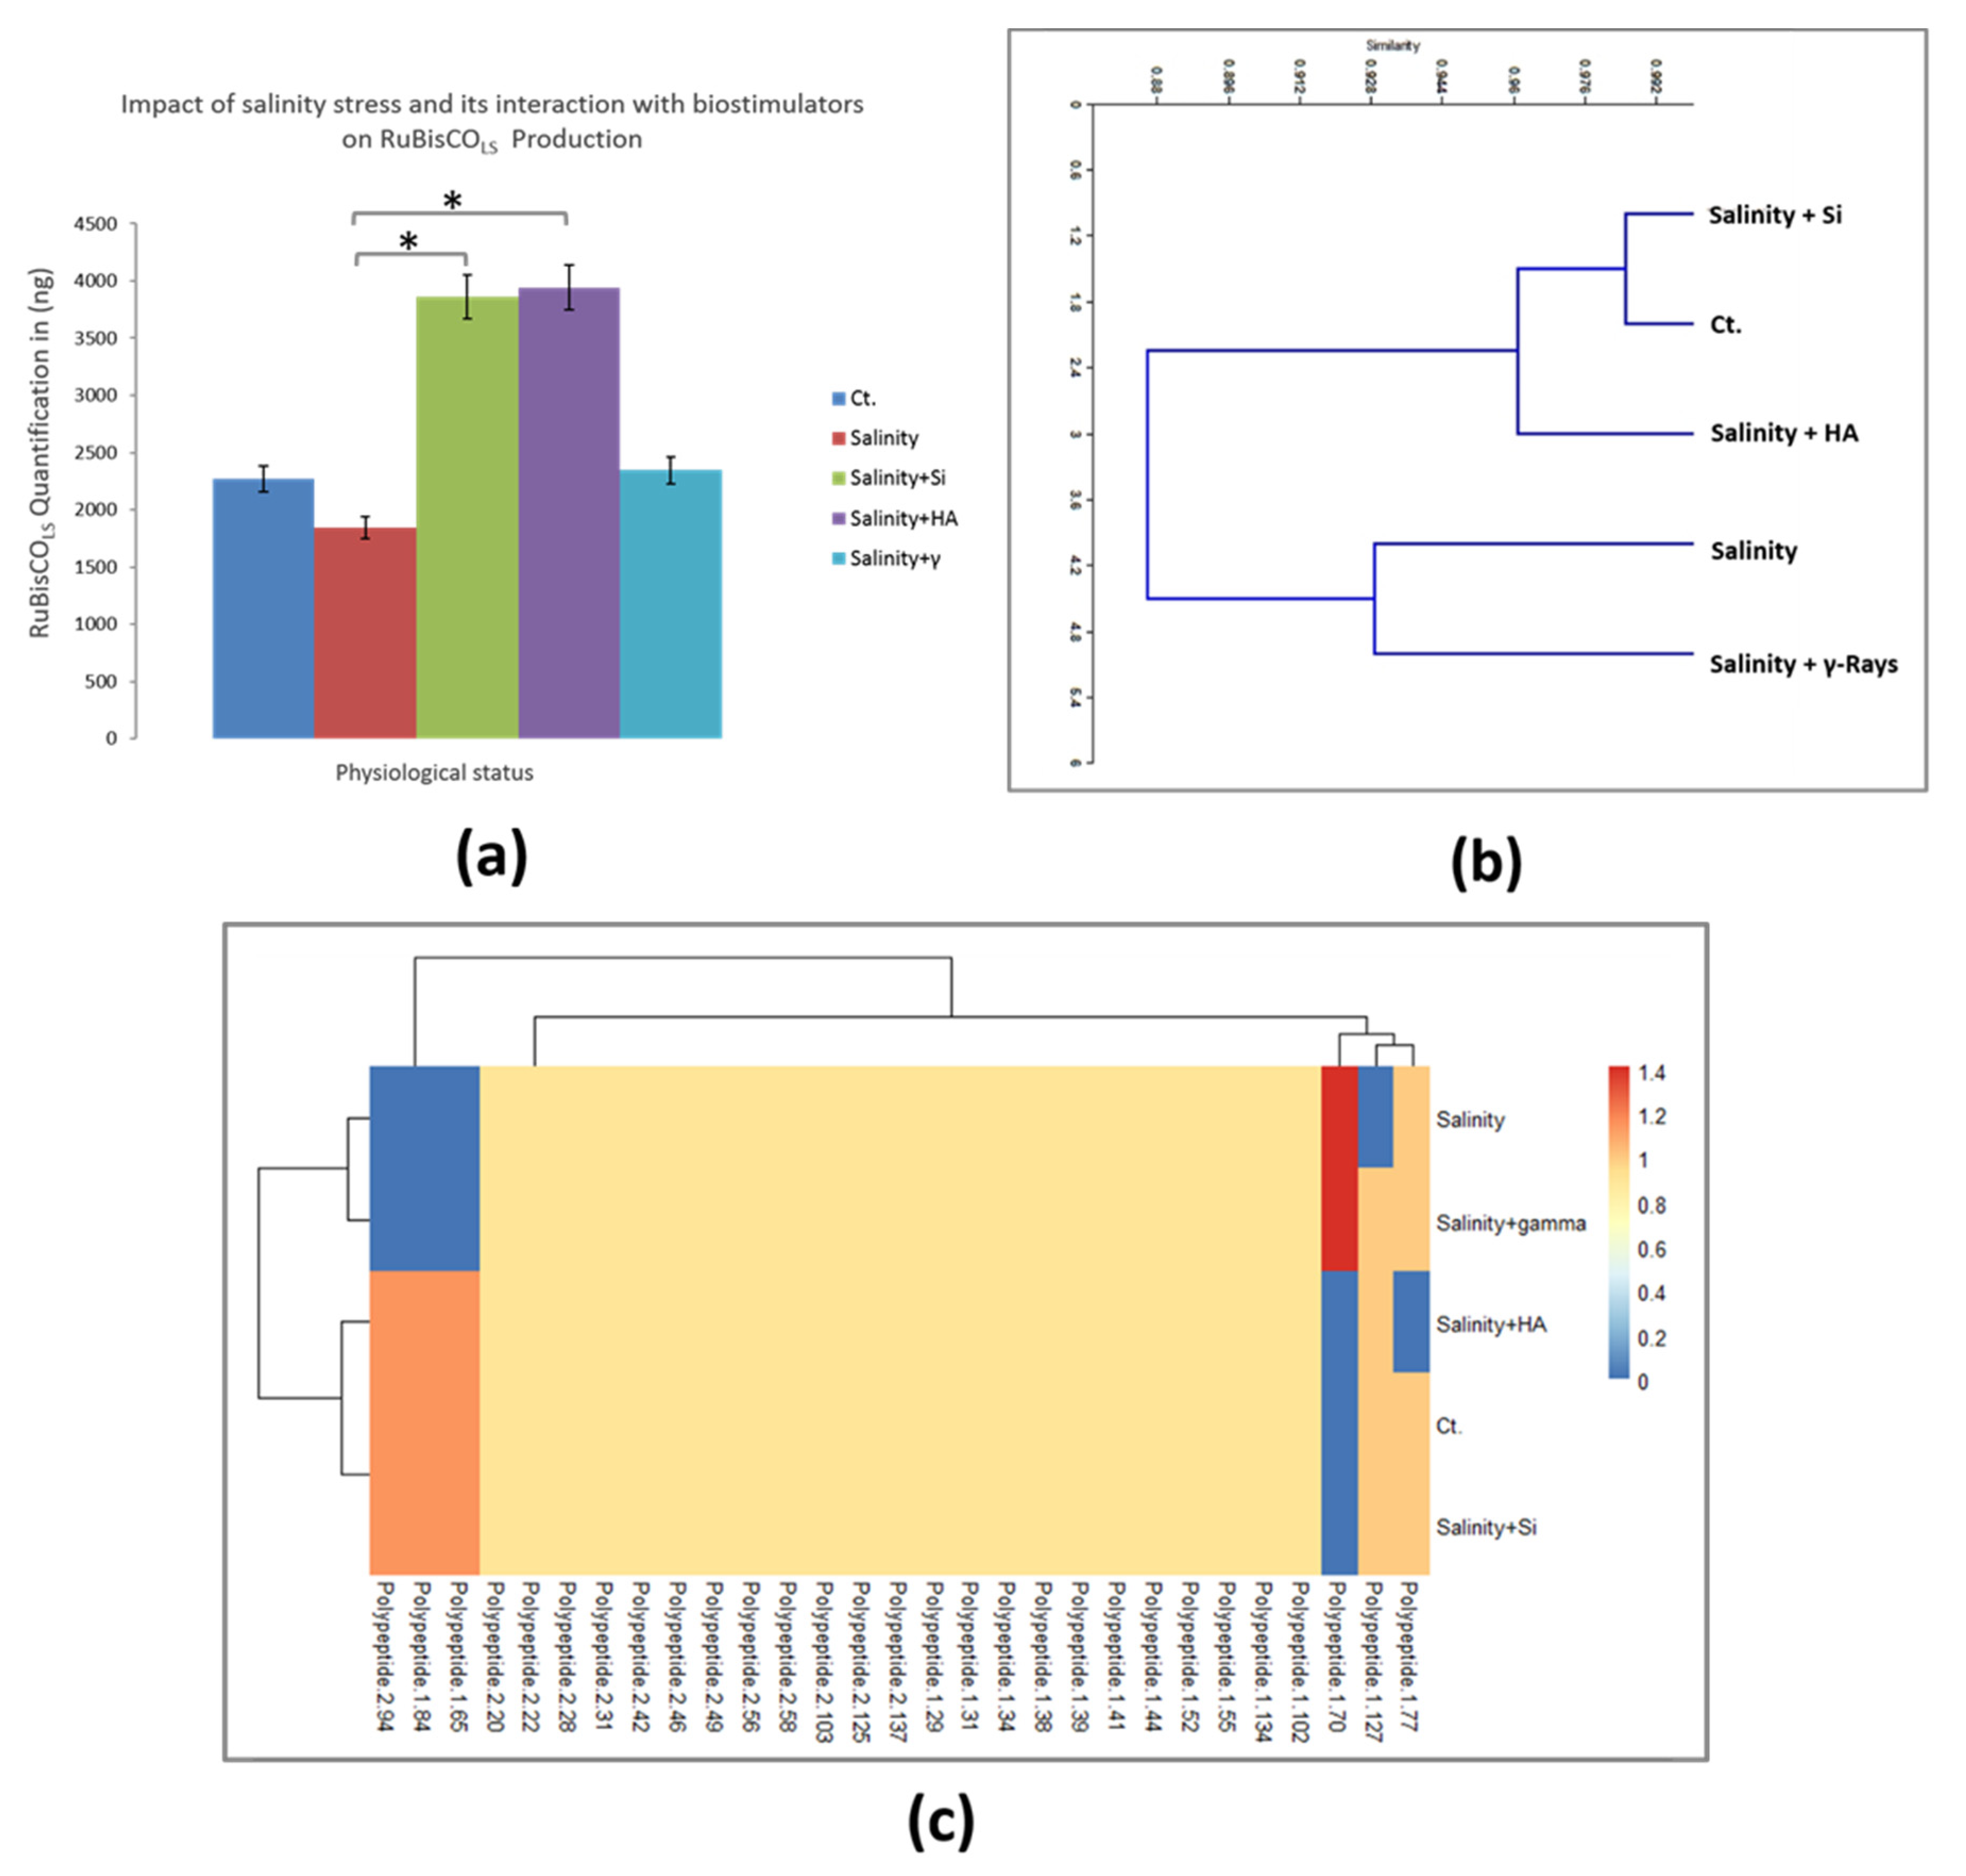
3.6. Characterization of Salinity Stress Impact on TCPs and the Expression of RuBisCOLS

Total cellular proteins (TCPs) were extracted from control, saline-stressed, and alleviated biostimulant-treated and stressed leaves as described previously by Hassanein et al. [26]. The protein concentration was detected according to Bradford [41]. Protein banding profiles of 70–100 µg TCPs (equivalent to total protein content) were fractionated by 10% SDS–PAGE (Figure S2A,B). To manifest the consistency and reproducibility of the resulting protein profiles after stress performance and stress-alleviation application, TCPs were extracted from the studied samples during two successive seasons (seasons 1 and 2). Band scoring (band presence/absence) and quantification of specific protein band(s) of interest were carried out using Egyptian Genetic Software 3 (www.geocities.com/eugene; accessed on 26 November 2020) and ImageJ software, respectively. It was found that the RuBisCOLS protein band, running at approximately 53 kDa, was detected in all samples of control (Figure S2A,B, Lane 1), salt-stressed (Figure S2A,B, Lane 2), and salinity-stressed alleviated coriander plants (Figure S2A,B, Lanes 3–5). The accumulation of RuBisCOLS was affected by applied salinity stress compared with the control sample (Figure S2A,B, Lanes 1–2). Salinity-stressed coriander alleviated by pot. silicate (80 mM) or HA (50 mg L−1) triggered a pronounced enhancement and induced the highest observed protein expression and accumulation of RuBisCOLS (Figure S2A,B, Lanes 3–4, respectively). The expression of the RuBisCOLS protein product was retrieved, at least to the control level, in salinity-stressed coriander plants alleviated by individual application of gamma irradiation (Figure S2A,B, Lane 5). Moreover, the use of silicate as a stress alleviation element positively induced the expression of unique and characteristic polypeptides running approximately 63, 75, 100, and 200 kDa more than their corresponding bands in control samples and other stress-alleviated samples (Figure S2A,B, denoted by red arrows). To the same extent, salinity-stressed samples alleviated by HA application showed the same behavior as pot. silicate application. In this connection, quantification of the RuBisCOLS protein product using an ascending concentration ladder of protein standard BSA was performed (Figure 3A and Figure S2A,B). Band scoring revealed polymorphism percentages of 25% and 22.2% for seasons 1 and 2, respectively, with a mean of 23.6%. A generated binary matrix (based on band presence, denoted by 1, and band absence, denoted by 0) was used to construct a cluster analysis. The Latter analysis was used to find the most relevant samples based on their protein profiles. The cluster analysis revealed two major clusters (Figure 3B). The first cluster included two subclusters. The first subcluster grouped the control coriander together with silicate-alleviated samples, whereas the second subcluster included only HA-alleviated samples. The second cluster included salinity-stressed samples, which were grouped together with gamma-alleviated samples (Figure 3B). The Latter findings were consistent with the constructed heatmap (Figure 3C). These findings showed the alleviation of salt stress by pot. silicate or HA was able to retain and overcome the salinity-stressed conditions.

4. Discussion

Salinity is the stress of elevated salt concentration in the soil environment of cultivated plants and is considered a global environmental dilemma [51]. The impact of salinity on plants is extreme due to retarded morphological, metabolic, and genetic pivotal procecces resulting in diminished overall dry matter [52,53]. Recently, the salinity effect was discovered to be related to the large fraction of energy directed by plants to tolerate salinity instead of consumption for growth and development [54]. Plants acquire very sophisticated strategies of highly ordered physiological and molecular mechnisms to acclimate to unfavorable environmental conditions. In this connection, plants are rich with potent compounds viz. osmoprotectants and antioxidants to face unsuitable environmental hazards and could be devoted to coping with salinity stress [55].
Morphological characteristics of grown coriander under salinity stress were mitigated with HA pretreatment, as HA encountered salinity hazardous effects regarding the prevention of nutrient uptake and promoted of the toxic matter uptake. Instead, HA promotes growth by increasing dry matter and it increases proline, antioxidant enzymes, and chlorophyll content under stress conditions [56,57,58].
In this study, applied pretreatments caused continuation of coriander growth due to increments of hormonal ratio, particularly IAA and GA3, which led to higher mass production at the vegetative and flowering stages compared to coriander grown under normal or saline conditions. The pretreated coriander before sowing could cope with salinity stress by inducing antioxidant elements that act on the prevention of cellular damage [58]. Thereby, the growth was maintained and preceded normally. Notably, that pot. silicate and HA pretreatments enhanced nutrient uptake and increased the photosynthetic rate, as evidenced by pigment accumulation in total expanded leaf area resulting from prompt vegetative growth ending with higher dry matter and quantities of soluble sugars and carbohydrates [59]. In the same context, the overaccumulation of soluble sugars was recorded by Rivero et al. and Omer et al. [59,60] owing to a glyoxylate cycle disruption along with a sucrose and starch imbalanced metabolism which was a salinity-induced response leading to photosynthetic retardation by feedback inhibition. Furthermore, some crypto-protectant molecules of carbohydrate nature were synthesized under a dehydrating effect and engaged with cell membrane protection [61]. Thus, soluble sugars, in case of pretreatment, did not overaccumulate to that extent to reduce the photosynthetic rate by feedback inhibition, as speculated under stress.
Notably, all pretreatments, particularly pot. silicate and HA acted to maintain higher levels of antioxidants throughout the whole life cycle of coriander grown with salinity stress until the flowering stages and were crucial for plants to cope with stress [62]. The antioxidant defense system composed of enzymatic and nonenzymatic components that act on cellular protection from the oxidative destruction caused by reactive oxygen species (ROS) [63]. Ascorbic acid (vitamin C) is a ubiquitous potent metabolite produced in the cytoplasm to tolerate salinity stress by protecting cellular lipids and proteins from oxidative damage, maintaining the rate of photosynthesis, and allowing plant growth and development within a long-term stress span [64]. In this study, a correlation between ascorbic acid elevation was detected in plants pretreated with HA and harboured high levels of IAA and GA3, and increased growth parameters. The effect of HA on ascorbic acid induction was superior among the other pretreatments and prevailed in coriander grown with or without salinity and enhanced yield components. The HA effect on generating ascorbic acid is substantial, as a previous study showed that the endogenous ascorbic acid in most plant species was not synthesized to an extent countering salinity stress [65]. In another context, proline synthesis is overaccumulated under stress conditions, and proline is the stress most popular makeup molecule. Proline is the key metabolite for stress tolerance and was produced significantly in tolerant transformants at high temperature stress [66,67].
Our findings were in accordance with previous studies regarding the prevalent role of pot. silicate which promoted the synthesis of enzymatic antioxidants, protected chlorophyll, generated phenolic compounds synthesis, immobilized toxic ions in the plant environment, polymerized in the apoplastic layer to prevent Na uptake, and enhanced plant vigor and biomass production, as silicon is a lignin precursor which can deposit on the walls of plant cells to maintain several physiological activities [68,69,70]. Moreover, silicon was involved in plant metabolism to keep membrane permeability unharmed during salinity stress, suggesting a silicon role in the induction of enzymatic antioxidants [71]. However, HA prevailed with stimulation of nonenzymatic antioxidants.
The utilized dose of gamma radiation (50 Gy) in this study was enough for coriander protection to pursue growth and productivity by improving coriander morphological and physiological behavior under salinity stress. The 50 Gy dose was suggested as the proper dose for seed tolerance, germination, and overall plant growth [72]. However, many plants, such as rice, oat, and sweet potato, have sensitivity to gamma high doses. Thus, in the mentioned plants, very low doses of gamma expressed the highest tolerance to NaCl stress (for example, [20,73]). In our investigation, low doses of gamma surpassed the effects of both HA and pot. silicate in improving growth traits at the vegetative and flowering stages as investigated by Wi et al. [74]. In the same context and consistent with previous reports, gamma radiation was even used at doses higher than 50 Gy [72,75].
In the present study, the RuBisCOLS expression level was affected to some extent by salinity stress; whereas, RuBisCOLS upregulation was shown upon the pretreatment of salinized plants with pot. silicate or HA. RuBisCO complex activity was judged by the expression of its two subunits inside the cell [76]. The rate of biosynthesis and degradation, which is controlled by gene expression, is greatly affected by adverse abiotic conditions [76,77,78]. Moreover, a reduction in chlorophyll content was observed, and inhibition of RuBisCO activity in chickpea under varying ascending levels of NaCl concentrations was also reported [79]. Similarly, a decrease in the photosynthetic rate and RuBisCO activity in the cotton cultivar ‘Arya-Anubam’ under NaCl treatment was recorded [80]. Recently, it was suggested that the magnitude of RuBisCO inhibition was dependent on salt concentration [81]. Furthermore, RuBisCO deactivation might be concomitant with negative effects on chloroplast thylakoid structure and its subsequent related functions, especially during and after the first contact between the plant leaf and temperature stress [82]. Therefore, inhibition of photosynthesis by salinity treatment may mediate the closure of stomata, leading to a decrease in CO2 conductance. As a result, disturbances in photosynthetic electron transport and carboxylation capacity have been reported [83]. These findings may explain why the protein level of RuBisCOLS was not affected in the present study through applied pot. silicate and HA pretreatments under salt stress.
Ameliorative fluctuation in protein patterns of salinity-stressed and pretreated samples using pot. silicate or HA were triggered through a wide range of polypeptides (63, 100, and 180 kDa) in this study. These results agreed with Maslenkova et al. [84] and Hassan et al. [85]. Additionally, some protein bands were decreased or disappeared after application of salt stress [86,87,88]. The results investigated in this study were consistent with Manivannan et al. [87]. The same range of induced high molecular weight polypeptides was reported in salt individual treatment and in the case of salt combination with jasmonic acid in purified intact chloroplasts from garden peas [88].

5. Conclusions

Application of pot. silicate, HA, and gamma irradiation individually or in combination with salt stress on coriander plant is considered safe methods for improving and stimulating bioactive and healthy components in coriander plants on the physiological level. The preferable biostimulant in alleviating salt stress was pot. silicate and HA followed by gamma radiation. The metabolic mechanism of used biostimulators might be based mainly on ruling out oxidative damage by controlling the overgeneration of O2 by aggravating the induction of proline, reinforcing the capacity of the scavengers POD, PPO and CAT that acted on lowering the MDA level to a minimum, reducing ABA levels, inducing hormonal ratios, and hence maintaining coriander growth capability and productivity under salinity stress. On the molecular level, extracted TCP profiles reflected the ability of pot. silicate and HA to restore to a close extent the proteostasis steady state of coriander plants after the defeated effect of salinity stress on cellular proteins, specifically the RuBisCOLS protein subunit. Thus, it was suggested that salt stress alleviated by pot. silicate or HA treatments were the best to retain and recover the cellular metabolic pathways and molecular mechanisms Hereby, these results may give novel insights and accretion our understanding of salinity tolerance mechanisms to develop resistant crops of highly important economic value such as the coriander plant. The present study has presented the integration of morphological, physiological, biochemical, and molecular approaches to evaluate the effect of salt stress on the coriander crop and the extent of using ecofriendly alleviating agents.

Supplementary Materials

The following supporting information can be downloaded at: https://0-www-mdpi-com.brum.beds.ac.uk/article/10.3390/agronomy12102268/s1, Figure S1: The effect of biostimulants’ pretreatments on the vegetative stage of coriander samples at the flowering stage subjected to salinity stress.; Figure S2: The effect of pretreatments on TCPs patterns of control, salt-stressed, and stress-alleviated coriander plants by pretreatments 75 days after sowing.

Author Contributions

Conceptualization, R.A.H., O.S.H., A.F.A. and M.I.; methodology, R.A.H., O.S.H., Y.E.H. and M.I.; writing—original draft preparation, O.S.H., A.F.A., Y.E.H. and M.I.; conceived and designed the experimental methodology, R.A.H., O.S.H., A.F.A., I.A.F., Y.E.H. and M.I.; written, reviewed, and edited the approved manuscript, O.S.H., A.F.A. and M.I. All authors have read and agreed to the published version of the manuscript.

Funding

This research received no external funding.

Data Availability Statement

All datasets generated and/or analyzed during this study were completely included within the article and its supplementary information.

Acknowledgments

This work was supported by the National Center for Radiation Research and Technology (NCRRT), Atomic Energy Authority, Cairo, Egypt. The authors express their gratitude to Scientific Research Sector of Ain Shams University, Egypt for their technical support. The authors are grateful to Fatem Y. Ellmouni for keen technical assistance to generate the figures of correlogram and heatmap.

Conflicts of Interest

The authors declare no conflict of interest.

Abbreviations

RuBisCO: Ribulose-1 5-bisphosphate carboxylase/oxygenase; RuBisCOLS: RuBisCO complex large protein subunit; IAA: Indole Acetic Acid; ABA: Abscisic Acid; HA: Humic Acid; Gy: Gray unit; HPLC: High performance thin layer chromatography; CAT: Catalase; POD: peroxidase; PPO: polyphenol oxidase.

References

  1. Aiazzi, M.T.; Di Rienzio, J.A.; Sosa, L. Effects of different salts on the germination and early seedling growth of Atriplex cordobensis Gandoger et Stuckert (Chenopodiaceae). Seed Sci. Technol. 2009, 37, 1. [Google Scholar] [CrossRef]
  2. Hong, Y.; Liu, Y.; Zhang, Y.; Jia, L.; Yang, X.; Zhang, X.; Liu, J.; Luan, Y. Genome-wide characterization of homeobox-leucine zipper gene family in tomato (Solanum lycopersicum) and functional analysis of SlHDZ34 (III sub-family member) under salinity stress. Environ. Exp. Bot. 2021, 192, 104652. [Google Scholar] [CrossRef]
  3. Meng, S.; Su, L.; Li, Y.; Wang, Y.; Zhang, C.; Zhao, Z. Nitrate and ammonium contribute to the distinct nitrogen metabolism of populus simonii during moderate salt stress. PLoS ONE 2016, 11, e0150354. [Google Scholar] [CrossRef]
  4. Abdel Latef, A.A.H.; Omer, A.M.; Badawy, A.A.; Osman, M.S.; Ragaey, M.M. Strategy of Salt Tolerance and Interactive Impact of Azotobacter chroococcum and/or Alcaligenes faecalis Inoculation on Canola (Brassica napus L.) Plants Grown in Saline Soil. Plants 2021, 10, 110. [Google Scholar] [CrossRef] [PubMed]
  5. Sharma, P.; Dubey, R.S. Involvement of oxidative stress and role of antioxidative defense system in growing rice seedlings exposed to toxic concentrations of aluminum. Plant Cell Rep. 2007, 26, 11. [Google Scholar] [CrossRef] [PubMed]
  6. Widodo, J.; Patterson, H.; Newbigin, E.; Tester, M.; Bacic, A.; Roessner, U. Metabolic responses to salt stress of barley (Hordeum vulgare L.) cultivars, Sahara and Clipper, which differ in salinity tolerance. J. Exp. Bot. 2009, 60, 14. [Google Scholar] [CrossRef] [PubMed]
  7. Nadeem, M.; Anjum, F.M.; Khan, M.I.; Tehseen, S.; El-Ghorab, A.; Sultan, J.I. Nutritional and medicinal aspects of coriander (Coriandrum sativum L.): A review. Br. Food J. 2013, 115, 5. [Google Scholar] [CrossRef]
  8. Shilev, S. Plant-growth-promoting bacteria mitigating soil salinity stress in plants. Appl. Sci. 2020, 10, 7326. [Google Scholar] [CrossRef]
  9. Rizwan, M.; Ali, S.; Ibrahim, M.; Farid, M.; Adrees, M.; Bharwana, S.A.; Zia-Ur-Rehman, M.; Qayyum, M.F.; Abbas, F. Mechanisms of silicon-mediated alleviation of drought and salt stress in plants: A review. Environ. Sci. Pollut. Res. 2015, 22, 20. [Google Scholar] [CrossRef]
  10. Khan, W.U.D.; Aziz, T.; Maqsood, M.A.; Sabir, M.; Ahmad, H.R.; Ramzani, P.M.A.; Naseem, M. Silicon: A Beneficial Nutrient Under Salt Stress, Its Uptake Mechanism and Mode of Action. In Soil Science: Agricultural and Environmental Prospectives; Hakeem, K., Akhtar, J., Sabir, M., Eds.; Springer: Cham, Switzerland, 2016. [Google Scholar] [CrossRef]
  11. Almeida, D.M.; Margarida Oliveira, M.; Saibo, N.J.M. Regulation of Na+ and K+ homeostasis in plants: Towards improved salt stress tolerance in crop plants. Genet. Mol. Biol. 2017, 40, 1. [Google Scholar] [CrossRef]
  12. Pesaran, A.A. Moisture Transport in Silica Gel Particle Beds; University of California: Los Angeles, CA, USA, 1983. [Google Scholar]
  13. El-Serafy, R.S.; El-Sheshtawy, A.N.A.; Atteya, A.K.G.; Al-Hashimi, A.; Abbasi, A.M.; Al-Ashkar, I. Seed priming with silicon as a potential to increase salt stress tolerance in lathyrus odoratus. Plants 2021, 10, 2140. [Google Scholar] [CrossRef] [PubMed]
  14. Çimrin, K.M.; Türkmen, Ö.; Turan, M.; Tuncer, B. Phosphorus and humic acid application alleviate salinity stress of pepper seedling. Afr. J. Biotechnol. 2010, 9, 36. [Google Scholar] [CrossRef]
  15. Mackowiak, C.L.; Grossl, P.R.; Bugbee, B.G. Beneficial Effects of Humic Acid on Micronutrient Availability to Wheat. Soil Sci. Soc. Am. J. 2001, 65, 6. [Google Scholar] [CrossRef] [PubMed]
  16. Canellas, L.P.; Olivares, F.L.; Okorokova-Façanha, A.L.; Façanha, A.R. Humic acids isolated from earthworm compost enhance root elongation, lateral root emergence, and plasma membrane H+-ATPase activity in maize roots. Plant Physiol. 2002, 130, 4. [Google Scholar] [CrossRef]
  17. Chen, Y.; Magen, H.; Clapp, C.E. Mechanisms of plant growth stimulation by humic substances: The role of organo-iron complexes. Soil Sci. Plant Nutr. 2004, 50, 7. [Google Scholar] [CrossRef]
  18. Delfine, S.; Tognetti, R.; Desiderio, E.; Alvino, A. Effect of foliar application of N and humic acids on growth and yield of durum wheat. Agronomie 2005, 25, 2. [Google Scholar] [CrossRef]
  19. Türkmen, O.; Demr, S.; Ensoy, S.; Dursum, A. Effects of Arbuscular Mycorrhizal Fungus and Humic Acid on the Seedling Development and Nutrient Content of Pepper Grown under Saline Soil Conditions. J. Biol. Sci. 2005, 5, 5. [Google Scholar] [CrossRef]
  20. Aydin, A.; Kant, C.; Turan, M. Humic acid application alleviate salinity stress of bean (Phaseolus vulgaris L.) plants decreasing membrane leakage. Afr. J. Agric. Res. 2012, 7, 7. [Google Scholar] [CrossRef]
  21. Qi, W.; Zhang, L.; Xu, H.; Wang, L.; Jiao, Z. Physiological and molecular characterization of the enhanced salt tolerance induced by low-dose gamma irradiation in Arabidopsis seedlings. Biochem. Biophys. Res. Commun. 2014, 450, 2. [Google Scholar] [CrossRef]
  22. Beyaz, R.; Yildiz, M. The Use of Gamma Irradiation in Plant Mutation Breeding. In Plant Engineering; Reed Business Information: Singapore, 2017. [Google Scholar] [CrossRef]
  23. Beyaz, R. Impact of gamma irradiation pretreatment on the growth of common vetch (Vicia sativa L.) seedlings grown under salt and drought stress. Int. J. Radiat. Biol. 2020, 96, 2. [Google Scholar] [CrossRef]
  24. Elhamahmy, A.M.; Elsadany, O.; Eid, M.; Abdelazeem, S.; Gerish, S.; Kalaji, M.H.; Wróbel, J.; Elsheery, N. Impact of gamma irradiation pretreatment on biochemical and molecular responses of potato growing under salt stress. Chem. Biol. Technol. Agric. 2021, 8, 35. [Google Scholar] [CrossRef]
  25. Shindy, W.W.; Smith, O.E. Identification of Plant Hormones from Cotton Ovules. Plant Physiol. 1975, 55, 3. [Google Scholar] [CrossRef]
  26. Hassanein, R.A.; Hussein, O.S.; Abdelkader, A.F.; Farag, I.A.; Hassan, Y.E.; Ibrahim, M. Metabolic activities and molecular investigations of the ameliorative impact of some growth biostimulators on chilling-stressed coriander (Coriandrum sativum L.) plant. BMC Plant Biol. 2021, 21, 1. [Google Scholar] [CrossRef]
  27. Kelen, M.; Demiralay, E.Ç.; Şen, S.; Alsancak, G.Ö. Separation of abscicic acid, indole-3-acetic acid, gibberellic acid in 99R (vitis berlandieri x vitis rupestris) and rose oil (Rosa damascene Mill.) reversed phase liquid chromatography. Turk. J. Chem. 2004, 28, 603–610. [Google Scholar]
  28. Metzner, H.; Rau, H.A.; Senger, H. Untersuchungen zur Synchronisierbarkeit einzelner Pigmentmangel-Mutanten von Chlorella. Planta 2004, 65, 186–194. [Google Scholar] [CrossRef]
  29. Homme, P.M.; Gonalez, B.; Billard, L. Carbohydrate content, fructane and sucroce enzyme activities in roots, stubble and leaves of rye grass (Lolium perenne L.) as affected by source/sink modification after cutting. J. Plant Physiol. 1992, 140, 282–291. [Google Scholar] [CrossRef]
  30. Whistler, R.L.; Wolform, M.L.; Bemiller, J.N.; Shafizadeh, F. Anthrone coluorimetric method. In Methods in Carbohydrate Chemistry; Acadimic Press: New York, NY, USA; London, UK, 1962; Volume 1, p. 384. [Google Scholar]
  31. Hedge, J.E.; Hofreiter, B.T. Anthrone coluorimetric method. In Methods in Carbohydrate Chemistry; Academic Press: New York, NY, USA, 1962; Volume 1, pp. 380–394. [Google Scholar]
  32. Zvaigzne, G.; Karklina, D.; Seglina, D.; Krasnova, I. Antioxidant in various citrus fruits juices. Chemine Technol. 2009, 3, 56–61. [Google Scholar]
  33. Marinova, D.; Ribarova, F.; Atanassova, M. Total phenolic and total flavonoids in Bulgarian fruits and vegetables. J. Univ. Chem. Technol. Metall. 2005, 40, 255–260. [Google Scholar]
  34. Malik, C.P.; Singh, S.M. Plant Enzymology and Histoenzymology; Kalyani Puplishers: New Delhi, India, 1980; Volume 53, p. 286. [Google Scholar]
  35. Bates, L.S.; Waldren, R.P.; Teare, I.D. Rapid determination of free proline for water-stress studies. Plant Soil 1973, 39, 1. [Google Scholar] [CrossRef]
  36. Lowry, O.H.; Rosebrough, N.J.; Farr, A.L.; Randall, R.J. Protein measurement with the Folin phenol reagent. J. Biol. Chem. 1951, 193, 1. [Google Scholar] [CrossRef]
  37. Aebi, H. Methods of Enzymatic Analysis. Catalase; Bergmeyer, H.U., Ed.; Verlag Chemie/Academic Press Inc.: Weinheim, Germany; NewYork, NY, USA, 1974. [Google Scholar]
  38. Hammerschmidt, R.; Nuckles, E.M.; Kuć, J. Association of enhanced peroxidase activity with induced systemic resistance of cucumber to Colletotrichum lagenarium. Physiol. Plant Pathol. 1982, 20, 1. [Google Scholar] [CrossRef]
  39. Oktay, M.; Kufrevioğlu, O.I.; Kocacaliskan, I.; Sakiroğlu, H. Polyphenol oxidase from Amasya apple. J. Food Sci 1995, 60, 495–499. [Google Scholar] [CrossRef]
  40. Heath, R.L.; Packer, L. Photoperoxidation in isolated chloroplasts. I. Kinetics and stoichiometry of fatty acid peroxidation. Arch. Biochem. Biophys. 1968, 125, 1. [Google Scholar] [CrossRef] [PubMed]
  41. Bradford, M.M. A rapid and sensitive method for the quantitation of microgram quantities of protein utilizing the principle of protein-dye binding. Anal. Biochem. 1976, 72, 248–254. [Google Scholar] [CrossRef]
  42. Laemmli, U.K. Cleavage of structural proteins during the assembly of the head of bacteriophage T4. Nature 1970, 227, 5259. [Google Scholar] [CrossRef] [PubMed]
  43. Hammer, Ø.; Harper, D.A.T.; Ryan, P.D. Past: Paleontological statistics software package for education and data analysis. Palaeontol. Electron. 2001, 4, 9. [Google Scholar]
  44. Snedecor, G.W.; Cochran, W.G. Statistical Methods, 7th ed.; Iowa State University Press: Ames, IA, USA, 1982. [Google Scholar]
  45. Kassambara, A.; Mundt, F. Factoextra: Extract and Visualize the Results of Multivariate Data Analyses, R package version 1.0.7. Available online: https://CRAN.R-project.org/package=factoextra (accessed on 31 March 2021).
  46. Suzuki, R.; Shimodaira, H. Hierarchical Clustering with P-Values via Multiscale Bootstrap Resampling, R package. 2006. Available online: http://www.is.titech.ac.jp/~shimo/prog/pvclust/ (accessed on 31 March 2021).
  47. Igbari, A.; Nodza, G.; Adeusi, A.; Ogundipe, O. Morphological characterization of mango (Mangifera indica L.) cultivars from south-west Nigeria. Ife J. Sci. 2019, 21, 155–163. [Google Scholar] [CrossRef]
  48. Soetewey, A. Correlation Coeffificient and Correlation Test in R. Available online: https://www.statsandr.com/blog/correlation-coefficient-and-correlation-test-in-r/ (accessed on 20 February 2021).
  49. Wickham, H. ggplot2: Elegant Graphics for Data Analysis; Springer: New York, NY, USA, 2016. [Google Scholar]
  50. Kassambara, A. ggpubr: “ggplot2” Based Publication Ready Plots, Version R Package Version 0.3. 0; Github: San Francisco, CA, USA, 2020.
  51. Negrão, S.; Schmöckel, S.M.; Tester, M. Evaluating physiological responses of plants to salinity stress. Ann. Bot. 2017, 119, 1. [Google Scholar] [CrossRef]
  52. Al-Ashkar, I.; Alderfasi, A.; Ben Romdhane, W.; Seleiman, M.F.; El-Said, R.A.; Al-Doss, A. Morphological and genetic diversity within salt tolerance detection in eighteen wheat genotypes. Plants 2020, 9, 287. [Google Scholar] [CrossRef] [PubMed]
  53. Zhang, X.H.; Zhou, D.; Cui, J.J.; Ma, H.L.; Lang, D.Y.; Wu, X.L.; Wang, Z.S.; Qiu, H.Y.; Li, M. Effect of silicon on seed germination and the physiological characteristics of glycyrrhiza uralensis under different levels of salinity. J. Hortic. Sci. Biotechnol. 2015, 90, 4. [Google Scholar] [CrossRef]
  54. Soltabayeva, A.; Ongaltay, A.; Omondi, J.O.; Srivastava, S. Morphological, physiological and molecular markers for salt-stressed plants. Plants 2021, 10, 243. [Google Scholar] [CrossRef]
  55. Fraire-Velazquez, S.; Emmanuel, V. Abiotic Stress in Plants and Metabolic Responses. In Abiotic Stress—Plant Responses and Applications in Agriculture; IntechOpen: London, UK, 2013. [Google Scholar] [CrossRef] [Green Version]
  56. Khaled, H.; Fawy, H. Effect of different Levels of humic acids on the nutrient content, plant growth, and soil properties under conditions of salinity. Soil Water Res. 2011, 6, 1. [Google Scholar] [CrossRef]
  57. Kaya, C.; Akram, N.A.; Ashraf, M.; Sonmez, O. Exogenous application of humic acid mitigates salinity stress in maize (Zea mays L.) plants by improving some key physico-biochemical attributes. Cereal Res. Commun. 2018, 46, 1. [Google Scholar] [CrossRef]
  58. El Mongy, M.S.; Zhou, H.; Cao, Y.; Liu, B.; Xia, Y. The effect of humic acid on endogenous hormone levels and antioxidant enzyme activity during in vitro rooting of evergreen azalea. Sci. Hortic. 2018, 227, 234–243. [Google Scholar] [CrossRef]
  59. Rivero, R.M.; Mestre, T.C.; Mittler, R.; Rubio, F.; Garcia-Sanchez, F.; Martinez, V. The combined effect of salinity and heat reveals a specific physiological, biochemical and molecular response in tomato plants. Plant Cell Environ. 2014, 37, 5. [Google Scholar] [CrossRef] [PubMed]
  60. Omer, A.M.; Osman, M.S.; Badawy, A.A. Inoculation with Azospirillum brasilense and/or Pseudomonas geniculata reinforces flax (Linum usitatissimum) growth by improving physiological activities under saline soil conditions. Bot. Stud. 2022, 63, 15. [Google Scholar] [CrossRef] [PubMed]
  61. Adam, S.; Murthy, S. Characterization of alterations in photosynthetic electron transport activities in maize thylakoid membranes under zinc stress. Eur. J. Exp. Biol. 2014, 4, 25–29. [Google Scholar]
  62. Mittler, R. ROS Are Good. Trends Plant Sci. 2017, 22, 1. [Google Scholar] [CrossRef] [PubMed]
  63. Szymańska, R.; Ślesak, I.; Orzechowska, A.; Kruk, J. Physiological and biochemical responses to high light and temperature stress in plants. Environ. Exp. Bot. 2017, 139, 165–177. [Google Scholar] [CrossRef]
  64. Naz, H.; Akram, N.A.; Ashraf, M. Impact of ascorbic acid on growth and some physiological attributes of cucumber (Cucumis Sativus) plants under water-deficit conditions. Pak. J. Bot. 2016, 48, 877–883. [Google Scholar]
  65. Latif, M.; Akram, N.A.; Ashraf, M. Regulation of some biochemical attributes in drought-stressed cauliflower (Brassica oleracea L.) by seed pre-treatment with ascorbic acid. J. Hortic. Sci. Biotechnol. 2016, 91, 2. [Google Scholar] [CrossRef]
  66. Cvikrová, M.; Gemperlová, L.; Dobrá, J.; Martincová, O.; Prásil, I.T.; Gubis, J.; Vanková, R. Effect of heat stress on polyamine metabolism in proline-over-producing tobacco plants. Plant Sci. 2012, 182, 1. [Google Scholar] [CrossRef]
  67. Badawy, A.A.; Alotaibi, M.O.; Abdelaziz, A.M.; Osman, M.S.; Khalil, A.M.A.; Saleh, A.M.; Mohammed, A.E.; Hashem, A.H. Enhancement of Seawater Stress Tolerance in Barley by the Endophytic Fungus Aspergillus ochraceus. Metabolites 2021, 11, 428. [Google Scholar] [CrossRef]
  68. Alshaal, T.; Alsaeedi, A.; El-Ramady, H.; Almohsen, M. Enhancing seed germination and seedlings development of common bean (Phaseolus vulgaris) by SiO2 nanoparticles. Egypt J. Soil Sci. 2017, 57, 407–415. [Google Scholar] [CrossRef]
  69. Ahanger, M.A.; Alyemeni, M.N.; Wijaya, L.; Alamri, S.A.; Alam, P.; Ashraf, M.; Ahmad, P. Potential of exogenously sourced kinetin in protecting Solanum lycopersicum from NaCl-induced oxidative stress through up-regulation of the antioxidant system, ascorbate-glutathione cycle and glyoxalase system. PLoS ONE 2018, 13, e0202175. [Google Scholar] [CrossRef] [PubMed]
  70. Ahmad, P.; Ahanger, M.A.; Alam, P.; Alyemeni, M.N.; Wijaya, L.; Ali, S.; Ashraf, M. Silicon (Si) Supplementation Alleviates NaCl Toxicity in Mung Bean [Vigna radiata (L.) Wilczek] Through the Modifications of Physio-biochemical Attributes and Key Antioxidant Enzymes. J. Plant Growth Regul. 2019, 38, 1. [Google Scholar] [CrossRef]
  71. Coskun, D.; Britto, D.T.; Huynh, W.Q.; Kronzucker, H.J. The role of silicon in higher plants under salinity and drought stress. Front. Plant Sci. 2016, 7. [Google Scholar] [CrossRef]
  72. Geng, X.M.; Liu, X.; Ji, M.; Hoffmann, W.A.; Grunden, A.; Xiang, Q.Y.J. Enhancing heat tolerance of the little dogwood cornus canadensis L. f. with introduction of a superoxide reductase gene from the hyperthermophilic archaeon Pyrococcus furiosus. Front. Plant Sci. 2016, 7, 26. [Google Scholar] [CrossRef]
  73. Shereen, A.; Ansari, R.; Mumtaz, S.; Bughio, H.R.; Mujtaba, S.M.; Shirazi, M.U.; Khan, M.A. Impact of Gamma irradiation induced changes on growth and physiological responses of rice under saline conditions. Pak. J. Bot. 2009, 41, 2487–2495. [Google Scholar]
  74. Wi, S.G.; Chung, B.Y.; Kim, J.S.; Kim, J.H.; Baek, M.H.; Lee, J.W.; Kim, Y.S. Effects of gamma irradiation on morphological changes and biological responses in plants. Micron 2007, 38, 553–564. [Google Scholar] [CrossRef]
  75. Geng, X.; Zhang, Y.; Wang, L.; Yang, X. Pretreatment with high-dose gamma irradiation on seeds enhances the tolerance of sweet osmanthus seedlings to salinity stress. Forests 2019, 10, 406. [Google Scholar] [CrossRef]
  76. Krapp, A.; Hofmann, B.; Schäfer, C.; Stitt, M. Regulation of the expression of rbcS and other photosynthetic genes by carbohydrates: A mechanism for the ‘sink regulation’ of photosynthesis? Plant J. 1993, 3, 6. [Google Scholar] [CrossRef]
  77. Kim, D.W.; Rakwal, R.; Agrawal, G.K.; Jung, Y.H.; Shibato, J.; Jwa, N.S.; Iwahashi, Y.; Iwahashi, H.; Kim, D.H.; Shim, I.S. A hydroponic rice seedling culture model system for investigating proteome of salt stress in rice leaf. Electrophoresis 2005, 26, 4521–4539. [Google Scholar] [CrossRef]
  78. Parker, R.; Flowers, T.J.; Moore, A.L.; Harpham, N.V.J. An accurate and reproducible method for proteome profiling of the effects of salt stress in the rice leaf lamina. J. Exp. Bot. 2006, 57, 5. [Google Scholar] [CrossRef]
  79. Garg, N.; Singla, R. Growth, photosynthesis, nodule nitrogen and carbon fixation in the chickpea cultivars under salt stress. Braz. J. Plant Physiol. 2004, 16, 3. [Google Scholar] [CrossRef]
  80. Desingh, R.; Kanagaraj, G. Influence of salinity stress on photosynthesis and antioxidative systems. Gen. Appl. Plant Physiol. 2007, 33, 221–234. [Google Scholar]
  81. Ratnakar, A.; Rai, A. Influence of Nacl Salinity On The Activity Of Ribulose 1, 5-Bisphosphate Carboxylase In Three Leafy Vegetables. Octa J. Environ. Res. 2015, 3, 163–166. [Google Scholar]
  82. Sharkey, T.D. Effects of moderate heat stress on photosynthesis: Importance of thylakoid reactions, rubisco deactivation, reactive oxygen species, and thermotolerance provided by isoprene. Plant Cell Environ. 2005, 28, 3. [Google Scholar] [CrossRef]
  83. Metodiev, M.V.; Tsonev, T.D.; Popova, L.P. Effect of jasmonic acid on the stomatal and nonstomatal limitation of leaf photosynthesis in barley leaves. J. Plant Growth Regul. 1996, 15, 2. [Google Scholar] [CrossRef]
  84. Maslenkova, L.T.; Miteva, T.S.; Popova, L.P. Changes in the polypeptide patterns of barley seedlings exposed to jasmonic acid and salinity. Plant Physiol. 1992, 98, 2. [Google Scholar] [CrossRef]
  85. Hassan, N.M.; Serag, M.S.; El Feky, F.M. Changes in nitrogen content and protein profile following in vitro selection of NaCl resistant mung bean and tomato. Acta. Physiol. Plant. 2004, 26, 165–175. [Google Scholar] [CrossRef]
  86. Zhang, L.; Gao, M.; Zhang, L.; Li, B.; Han, M.; Alva, A.K.; Ashraf, M. Role of exogenous glycinebetaine and humic acid in mitigating drought stress-induced adverse effects in Malus robusta seedlings. Turk. J. Bot. 2013, 37, 5. [Google Scholar] [CrossRef]
  87. Manivannan, A.; Soundararajan, P.; Muneer, S.; Ko, C.H.; Jeong, B.R. Silicon mitigates salinity stress by regulating the physiology, antioxidant enzyme activities, and protein expression in Capsicum annuum ‘Bugwang’. Biomed. Res. Int. 2016, 2016, 3076357. [Google Scholar] [CrossRef]
  88. Khalifa, N.; Shehata, M.; Sakran, A.; Shehata, M.; Abdelsattar, M. Differential Expression of RuBisCO large Subunit and its Assembly in Intact Chloroplasts of Pisum sativum L. Treated with NaCl and Jasmonic Acid. Egypt. J. Bot. 2017, 57, 525–537. [Google Scholar] [CrossRef]
Figure 1. Correlogram based on the correlation coefficients based on morphological and metabolic measurements. The blue colour indicates the positive correlation between measurements, whereas the red colour assumes the negative one.
Agronomy 12 02268 g001
Figure 2. PCA biplot was conducted by blotting the first two principal components, illustrating the plotting of the studied morphological and metabolic measurements using multivariate analysis in R software.
Agronomy 12 02268 g002
Figure 3. (a) Differential expression of RuBisCOLS protein as revealed by salinity stress. Y axis values represented the differentially expressed RuBisCOLS. The data were expressed as the mean ± s.e.m. *, p < 0.05. Quantification of the RuBisCO large subunit (RuBisCOLS) protein band using ImageJ software (IJ 1.46r) as described by Hassanein et al. [26]. Full-length original SDS–PAGE figures are shown in Supplementary Figure S2A,B. Read normalization of RuBisCOLS protein quantification was performed according to a 35 kDa protein band, as shown in Supplementary Figure S2A,B. (b) Cluster analysis as revealed by fractionated TCPs using 10% SDS–PAGE showed the effect of biostimulant pretreatments on the TCPs pattern under saline conditions. A dendrogram was constructed using the scored data of the binary matrix by the UPGMA agglomerative clustering method. (c) Multivariate heatmap illustrating the genetic diversity of control, salt-stressed, and alleviated coriander samples based on the SDS-PAGE fractionated polypeptides and constructed using the module of Heatmap of R software.
Agronomy 12 02268 g003
Table 1. Experimental design and regime of primed seeds of coriander by tap water, solutions of 80 mM pot. silicate or 50 mg L−1 HA or irradiation by 50 Gy γ-rays then primed in water at room temperature (20 ± 2 °C) for 16 h.
No.TreatmentIrrigation
1ControlTap water
2Salinity (150 mM NaCl)Saline solution (150 mM NaCl)
3Pot. silicate (80 mM)Tap water
4Humic acid (50 mg L−1)Tap water
5γ-rays (50 Gy)Tap water
6NaCl (150 mM) + Pot. silicateSaline solution (150 mM NaCl)
7NaCl (150 mM) + Humic acidSaline solution (150 mM NaCl)
8NaCl (150 mM) + γ-raysSaline solution (150 mM NaCl)
Table 2. Influence of biostimulants’ pretreatments on vegetative growth parameters of coriander plants under salinity stress at the vegetative stage. Control and salinized stressed coriander samples were subjected to 80 mM pot. silicate, 50 mg L−1 HA or soaked in water after exposure by 50 Gy γ-rays. Based on Duncan’s multiple range test, the different alphabetical letters express significant variation (defined as p < 0.05).
Growth Parameters
Shoot Length
(cm)
No. of Leaves/PlantsNo. of Branches/
Plant
Leaves Area/
Plant
(cm)2
Fresh
Weight
of Shoot
(g)
Dry Weight of Shoot (g)Root Length
(cm)
Fresh
Weight
of Root
(g)
Dry Weight
of Root (g)
Treatment
Control11.27 ± 0.1 d16 ± 1.53 d5 ± 0.58 d30.2 ± 1.67 e0.59 ± 0.044 de0.09 ± 0.001 f6.17 ± 0.55 cd0.043 ± 0.004 g0.011 ± 0.00 d
Salinity (150 mM NaCl)9.83 ± 0.21 e12 ± 1.00 d3.33 ± 0.58 e17.18 ± 0.84 f0.46 ± 0.006 e0.06 ± 0.31 g5.97 ± 0.31 d0.058 ± 0.01 f0.013 ± 0.001 d
pot. Silicate (80 mM)17.07 ± 0.89 a27.67 ± 1.00 b6 ± 0.58 abcd93.94 ± 4.38 b0.77 ± 0.065 cde0.14 ± 0.64 d6.83 ± 0.64 abc0.061 ± 0.009 e0.015 ± 0.001 c
Humic acid (50 mg−1 L)17.77 ± 1.58 a33.33 ± 1.00 a6.67 ± 0.58 ab107.8 ± 1.18 a1.17 ± 0.013 b0.19 ± 0.68 b7.1 ± 0.68 ab0.121 ± 0.004 a0.023 ± 0.002 a
γ-rays (50 Gy)17.23 ± 0.83 a33 ± 1.00 a7 ± 0.58 a89.98 ± 1.92 b2.13 ± 0.085 a0.22 ± 0.71 a7.57 ± 0.71 a0.123 ± 0.076 a0.022 ± 0.002 a
NaCl (150 mM) + Pot. silicate11.7 ± 0.25 cd21 ± 1.00 c5.67 ± 0.58 bcd54.16 ± 2.12 d0.85 ± 0.035 bcd0.13 ± 0.95 e6.47 ± 0.95 bcd0.091 ± 0.01 b0.019 ± 0.001 b
NaCl (150 mM) + Humic acid12.83 ± 0.3 b26.67 ± 1.00 b5.33 ± 0.58 cd67.78 ± 1.17 c0.96 ± 0.44 bc0.12 ± 0.85 e6.53 ± 0.85 bcd0.077 ± 0.002 d0.02 ± 0.00 b
NaCl (150 mM) + γ-rays 12.73 ± 0.53 bc21.33 ± 1.00 c6.33 ± 0.58 abc60.99 ± 1.33 c1.03 ± 0.021 bc0.16 ± 0.40 c7.43 ± 0.40 a0.08 ± 0.002 c0.026 ± 0.01 a
LSD at 0.051.0624.3151.3036.620.3130.0020.8340.0020.002
Table 3. Influence of biostimulants’ pretreatments on growth parameters of coriander plants under salinity stress at the flowering stage. Control and salinized stressed coriander samples were subjected to 80 mM pot. silicate, 50 mg L−1 HA or soaked in water after exposure by 50 Gy γ-rays. Based on Duncan’s multiple range test, the different alphabetical letters express significant variation (defined as p < 0.05).
Growth ParametersShoot Length
(cm)
No. of
Leaves/Plants
No. of Branches/
Plant
Leaves Area/Plant
(cm)2
Fresh Weight
of Shoot
(g)
Dry Weight of Shoot
(g)
Root Length
(cm)
Fresh Weight
of Root
(g)
Dry Weight of Root
(g)
No. of Inflorescence/Plant
Treatment
Control31.33 ± 3.79 de69 ± 3.60 c7 ± 1.00 d38.98 ± 1.27 e2.55 ± 0.29 d0.493 ± 0.06 de8.33 ± 1.53 b0.139 ± 0.017 d0.077 ± 0.015 d6.33 ± 1.53 d
Salinity (150 mM NaCl)22.67 ± 2.08 f32.33 ± 3.79 e5 ± 1.00 e21.45 ± 1.25 f1.99 ± 0.37 d0.389 ± 0.04 e8.17 ± 0.76 b0.278 ± 0.058 c0.07 ± 0.016 e4 ± 1.00 e
pot. Silicate (80 mM)36 b ± 2.65 c104 ± 5.29 a9 ± 1.00 bc93.94 ± 1.92 b4.77 ± 0.21 b0.913 ± 0.09 b11.73 ± 1.97 a0.32 ± 0.078 c0.11 ± 0.019 c10.33 ± 1.53 ab
Humic acid (50 mg L−1)45 ± 3.60 a99 ± 3.60 a12.33 ± 0.58 a107.8 ± 6.37 a6.87 ± 1.48 a1.586 ± 0.33 a13.07 ± 1.10 a0.933 ± 0.153 a0.243 ± 0.017 a11 ± 1.00 a
γ-rays (50 Gy)40 ± 1.00 b89 ± 3.60 b10 ± 1.00 b89.98 ± 3.03 b3.97 ± 0.72 c0.796 ± 0.06 bc11.07 ± 1.8 a0.474 ± 0.067 b0.19 ± 0.034 b8.67 ± 1.53 bc
NaCl (150 mM)+Pot. Silicate 27 ± 1.00 ef54.67 ± 6.43 d8 ± 1.00 cb54.16 ± 4.19 d2.67 ± 0.16 d0.431 ± 0.07 de11.57 ± 1.21 a0.284 ± 0.009 c0.085 ± 0.008 d7 ± 1.00 cd
NaCl (150 mM)+Humic acid 32.33 ± 2.51 cd69 ± 3.60 c7 ± 1.00 d67.18 ± 4.00 c2.9 ± 0.20 cd0.667 ± 0.08 bcd11.27 ± 0.68 a0.469 ± 0.03 b0.099 ± 0.019 cd9 ± 1.53 abc
NaCl (150 mM) + γ-rays 27.67 ± 0.76 e67 ± 8.19 c7 ± 1.00 d60.99 ± 5.43 c2.6 ± 0.10 d0.596 ± 0.15 cde9.73 ± 0.70 b0.358 ± 0.10 c0.08 ± 0.011 d7.67 ± 1.00 cd
LSD at 0.054.569.271.6446.351.1340.24772.3290.12380.00552.166
Table 4. Influence of biostimulants’ pretreatments on the yield components of coriander plants under salinity stress. Control and salinized stressed coriander samples were subjected to 80 mM pot. silicate, 50 mg L−1 HA or soaked in water after exposure by 50 Gy γ-rays. Based on Duncan’s multiple range test, the different alphabetical letters express significant variation (defined as p < 0.05).
Yield ComponentsNo of Fruits/PlantNo of Seeds/PlantWeight Seeds/Plant (g)Seed Index
(Weight
1000 Seeds (g))
Treatment
Control122.00 ± 10.00 g244 ± 14.00 e0.57 ± 0.14 f2.33 ± 0.14 f
Salinity (150 mM NaCl)68.00 ± 2.00 h136 ± 17.00 f0.19 ± 0.02 g1.41 ± 0.02 g
pot. Silicate (80 mM)526.65 ± 23.03 b1053.3 ± 142.00 b4.08 ± 0.35 b3.87 ± 0.35 b
Humic acid (50 mg L−1)589.3 ± 10.00 a1178.6 ± 135.00 a5.78 ± 0.14 a4.90 ± 0.14 a
γ-rays (50 Gy)425.00 ± 2.00 d850 ± 27.00 c2.20 ± 0.27 d2.59 ± 0.27 e
NaCl (150 mM) + Pot. Silicate 392.00 ± 23.00 e784 ± 13.00 c2.19 ± 0.13 d2.79 ± 0.13 de
NaCl (150 mM) + Humic acid 481.00 ± 23.00 c962 ± 127.00 b3.46 ± 0.33 c3.60 ± 0.33 c
NaCl (150 mM) + γ-rays 292.00 ± 10.00 f584 ± 29.00 d1.68 ± 0.29 e2.87 ± 0.29 d
LSD at 0.0527.62104.60.20720.2072
Table 5. Influence of biostimulants’ pretreatments on endogenous phytohormones (μg/100 g F. wt.) at flowering stage of coriander plants under salinity stress. Control and salinized stressed coriander samples were subjected to 80 mM pot. silicate, 50 mg L−1 HA or soaked in water after exposure by 50 Gy γ-rays. Based on Duncan’s multiple range test, the different alphabetical letters express significant variation (defined as p < 0.05).
Endogenous PhytohormonesIAAGA3ABAIAA+GA3/ABA
Treatment
Control7.12 ± 1.12 f389.7 ± 25.00 d1.90 ± 0.50 f208.847
Salinity (150 mM NaCl)2.34 ± 1.12 h266.2 ± 25.00 h11.51 ± 1.10 a23.329
pot. Silicate (80 mM)13.20 ± 1.10 b405.5 ± 25.00 b3.90 ± 1.10 e107.499
Humic acid (50 mg L−1)15.54 ± 1.12 a443.4 ± 25.00 a4.07 ± 1.10 e112.659
γ-rays (50 Gy)10.86 ± 1.12 c390.9 ± 25.00 c7.74 ± 1.10 c51.902
NaCl (150 mM) + Pot. Silicate 8.66 ± 1.12 e299.9 ± 25.00 g9.26 ± 1.10 b33.32
NaCl (150 mM) + Humic acid 9.37 ± 1.12 d367.9 ± 25.00 e7.98 ± 1.10 c47.28
NaCl (150 mM) + γ-rays6.25 ± 1.12 g313.5 ± 25.00 f5.50 ± 1.10 d58.14
LSD at 0.050.05540.001750.367-
Table 6. Influence of biostimulants’ pretreatments on photosynthetic pigments (μg g−1 D. wt. in coriander leaves) and carbohydrate contents (g/100 g D. wt.) at flowering stage of coriander plants under salinity stress. Control and salinized stressed coriander samples were subjected to 80 mM pot. silicate, 50 mg L−1 HA or soaked in water after exposure by 50 Gy γ-rays. Based on Duncan’s multiple range test, the different alphabetical letters express significant variation (defined as p < 0.05).
Pigments/CarbohydratePhotosynthetic PigmentsCarbohydrate Fractions
Treatment Chl aChl bChl
a/b
Total ChlSoluble SugarsPolysaccharidesTotal Carbohydrate
Control13.71 ± 0.42 d7.08 ± 0.01 bc1.94 ± 0.0620.79 ± 0.41 bc2.24 ± 0.12 d14.39 ± 2.11 c16.63 ± 1.63 f
Salinity (150 mM NaCl)9.25 ± 0.00 f3.25 ± 0.22 d2.85 ± 0.1912.5 ± 0.22 d3.40 ± 0.28 b9.46 ± 0.44 e12.86 ± 1.63 h
pot. Silicate (80 mM)15.62 ± 0.12 b7.55 ± 0.36 b2.07 ± 0.0823.17 ± 0.48 b4.04 ± 0.13 a19.14 ± 0.87 a23.18 ± 1.63 b
Humic acid (50 mg L−1)17.1 ± 0.32 a9.39 ± 0.17 a1.82 ± 0.0026.49 ± 0.49 a3.59 ± 0.3 b20.89 ± 2.13 a24.48 ± 1.63 a
Γ-rays (50 Gy)14.36 ± 0.13 c6.65 ± 0.26 c2.16 ± 0.0721.01 ± 0.40 bc2.49 ± 0.41 cd16.64 ± 1.38 b19.13 ± 1.63 e
NaCl (150 mM) + Pot. Silicate 13.97 ± 0.48 cd7.01 ± 0.57 bc1.99 ± 0.1020.98 ± 1.1 bc4.18 ± 0.13 a15.67 ± 0.50 bc19.88 ± 1.63 c
NaCl (150 mM) + Humic acid 14.05 ± 0.26 cd7.71 ± 0.01 b1.82 ± 0.0321.76 ± 0.27 b3.79 ± 0.2 ab15.43 ± 1.17 bc19.22 ± 1.63 d
NaCl (150 mM) + γ-rays 12.26 ± 0.15 e6.52 ± 0.38 bc1.88 ± 0.0618.78 ± 0.53 c2.84 ± 0.1 c12.42 ± 0.75 d15.26 ± 1.63 g
LSD 0.050.560.76-1.220.4111.9660.00175
Table 7. Influence of biostimulants’ pretreatments on antioxidant compounds (ascorbic acid, carotenoids, flavonoids, total phenolics and proline) at flowering stage of coriander plants under salinity stress. Control and salinized stressed coriander samples were subjected to 80 mM pot. silicate, 50 mg L−1 HA or soaked in water after exposure by 50 Gy γ-rays. Based on Duncan’s multiple range test, the different alphabetical letters express significant variation (defined as p < 0.05).
Antioxidant CompoundsAscorbic Acid
(g/100 g D. wt.)
Carotenoids
(µg/g D. wt.)
Flavonoids
(g/100 g D. wt.)
Total Phenolics
(g/100 g D. wt.)
Proline
(µg/100 g D. wt.)
Treatment
Control0.49 ± 0.01 d4.63 ± 0.17 b0.484 ± 0.08 h0.968 ± 0.068 c166.3 ± 6 c
Salinity (150 mM NaCl)0.22 ± 0.02 h2.64 ± 0.21 c0.695 ± 0.08 a1.084 ± 0.066 a698.9 ± 5.9 a
Pot. silicate (80 mM)0.56 ± 0.02 c5.84 ± 0.68 a0.563 ± 0.084 e0.898 ± 0.068 g239.0 ± 5.8 b
Humic acid (50 mg L−1)0.72 ± 0.015 a6.07 ± 0.2 a0.679 ± 0.084 b0.978 ± 0.066 d184.4 ± 6 c
γ-rays (50 Gy)0.45 ± 0.03 f5.7 ± 0.42 a0.50 ± 0.08 g0.882 ± 0.068 h218.6 ± 6.1 b
NaCl (150 mM) + Pot. silicate 0.48 ± 0.015 e5.61 ± 0.14 a0.557 ± 0.08 f0.966 ± 0.07 e234.2 ± 6 b
NaCl (150 mM) + Humic acid 0.57 ± 0.02 b5.74 ± 0.16 a0.633 ± 0.084 c1.007 ± 0.068 b266.2 ± 6 b
NaCl (150 mM) + γ-rays 0.40 ± 0.015 g4.89 ± 0.27 b0.586 ± 0.08 d0.955 ± 0.066 f283.0 ± 6.1 b
LSD at 0.050.01390.270.0680.0524.9
Table 8. Influence of biostimulants’ pretreatments on antioxidant enzymes PPO, POD, CAT (unit mg−1 protein), and MDA (nmol g−1 F. wt.) at flowering stage of coriander plants under salinity stress. Control and salinized stressed coriander samples were subjected to 80 mM pot. silicate, 50 mg L−1 HA or soaked in water after exposure by 50 Gy γ-rays. Based on Duncan’s multiple range test, the different alphabetical letters express significant variation (defined as p < 0.05).
Antioxidant Enzymes/MDAAntioxidant Enzymes
(Unit/mg Protein)
Lipid Peroxidation
(nmol/g F.wt.)
MDA
Treatment PPOPODCAT
Control5622.5 ± 152.85 de1.49 ± 0.16 e0.5707 ± 0.05 d0.478 ± 0.015 e
Salinity (150 mM NaCl)11688.9 ± 212.10 a6.21 ± 0.74 a1.0913 ± 0.25 ab1.166 ± 0.16 a
pot. Silicate (80 mM)6754.8 ± 57.77 cd3.08 ± 0.21 cd0.831 ± 0.19 c0.57 d ± 0.038 e
Humic acid (50 mg L−1)4641.8 ± 103.12 e3.88 ± 0.07 c0.451 ± 0.12 de0.642 ± 0.036 cd
γ-rays (50 Gy)4092.7 ± 367.56 e2.95 ± 0.21 d0.211 ± 0.00 e0.553 ± 0.042 de
NaCl (150 mM) + Pot. Silicate 9215.3 ± 301.10 b5.23 ± 0.12 b1.236 ± 0.03 a0.64 ± 0.037 cd
NaCl (150 mM) + Humic acid 7935.4 ± 331.02 bc2.72 ± 0.21 d0.889 ± 0.17 bc0.699 ± 0.037 bc
NaCl (150 mM) + γ-rays 1083.8 ± 125.00 f2.45 ± 0.74 d0.423 ± 0.17 de0.768 ± 0.070 b
LSD at 0.0520850.920.25970.111
Publisher’s Note: MDPI stays neutral with regard to jurisdictional claims in published maps and institutional affiliations.

