


The Composition of the Organic Matter Fractions of Loamy Sand after Long-Term FYM Application without Liming

Department of Plant Nutrition and Fertilization, Institute of Soil Science and Plant Cultivation—State Research Institute in Puławy, Czartoryskich 8, 24-100 Puławy, Poland
*
Author to whom correspondence should be addressed.
Agronomy 2022, 12(10), 2385; https://0-doi-org.brum.beds.ac.uk/10.3390/agronomy12102385
Submission received: 12 July 2022
/
Revised: 19 September 2022
/
Accepted: 20 September 2022
/
Published: 1 October 2022
(This article belongs to the Topic Frontier Studies in Composition of Humic Substances and Soil Organic Matter)
Abstract
:The key to soil organic matter management is understanding the transformation processes of fresh organic matter to permanent humus that control soil organic carbon dynamics. This paper presents the results of the effect of long-term soil fertilization with increasing doses of (manure) FYM and ammonium nitrate on the composition of humus compounds not limed of loamy sand. The study showed that both crop rotation and manure fertilization significantly affected organic matter fractions and humus humification index. The soil in crop rotation B (with enriching effect) accumulated significantly larger amounts of soil organic carbon in 0–30 cm layer despite a lower soil pH, but had lower soil organic quality compared to the soil in crop rotation A (with depleting effect). In both rotations, FYM was applied once per 4-year rotation at a dose of 40 t·ha−1 which improved the soil organic carbon content. Depleting crop rotation (A) showed no increase in soil accumulation of humins fractions (H), while the “enriching” crop rotation (B) had such a tendency. Mineral nitrogen fertilization significantly affected the composition of the humic acids fraction. The soil in crop rotation B was characterized by a significantly higher content of fulvic acid (FA) and lower of humins (H) carbon fraction. The large input of organic matter into the soil under lower content pH conditions may hinder its transformation into permanent humus. Changes in the humification index were the consequence of changes in the carbon content of humic and fulvic acids, under the influence of plant selection in crop rotation and manure fertilization. According to the criterion of this parameter, soil in crop rotation A and soil fertilized with manure had lower loss of the more labile FA fraction (lower value of humification index—1.48).
1. Introduction
Humic substances (HS) represent approximately 40–60% of the soil organic matter (SOM) and include three different fractions defined according to their solubility in water at various pH as: humic acids (HA), fulvic acids (FA) and humins (H). Due to the complexity of SOM compounds, the relationship between its characteristics and agricultural practices is poorly understood [1,2]. These substances affect soil fertility and plant growth due to high cation sorption, oxygen content, and water content [3]. The depletion of soil organic matter reserves may lead, on the one hand, to disruption of basic soil functions and, on the other hand, to a significant decrease in soil fertility, and consequently to lower yields of crops [4]. This problem is particularly important and current for Polish soils, which are mostly light and acidified. In order to increase the accumulation of organic matter in the soil, various agro-technical practices are recommended. One of the more effective practices is the return to the use of crop rotations. The selection of different plant species in a specific cropping system also affect in different decomposition dynamics of the plant residues left in the soil, due to the different chemical composition, i.e., C:N ratio or lignin content. The dominant groups of cultivated plant species affect humus gain or loss in the soil through their specific root system (root mass, root deposits in the soil) as well as their specific requirements for tillage [5]. One of the crop rotation can be classified as enriching (grass-clover mixtures, legumes in pure sowing) and depleting (cereals, root crops) the soil of organic matter. Crop rotation may also influence the rate of N mineralization or the conversion of organic to mineral N by modifying of soil moisture, soil temperature, pH, plant residue, and tillage practices. There is no doubts that manure is also a valuable source of nutrients and at the same time influences humus reproduction [5,6].
The advantage of farmyard manure (FYM) is primarily efficient and low-loss nutrient recycling and secondarily contributes to humus preservation. It also plays the most important role in maintaining soil fertility and ensuring long-term stability of humic substances [7]. Numerous long term field experiments have demonstrated that many years of fertilization, especially the application of manure alone or in combination with mineral fertilizers, increases the SOM and humic substances content [8,9,10]. However, there are discrepancies in the views of scientists who are concerned with the effects of manure on organic carbon content in soils as well as the effects of manure on humus compounds [11]. The literature confirms an increase of the organic carbon content in soil fertilized with high doses of manure (>40 t·ha−1) once every 3–4 years, but does not indicate which fractions of humic substances were responsible for this increase [12,13]. According to Łabza [14] 70–90% of organic matter from manure undergoes mineralization in the soil, so manure has no significant impact on the organic matter content of the soil. However, Łabętowicz et al. [15] proved in long-term research that the content of organic matter in the soil after regular application of manure at a dose of 30 t·ha−1 increased by 60% in comparison with the soil, where no manure was applied. Łakomiec [16] showed that, manure fertilization has a significant effect on the organic matter content of the entire soil profile. Manure rates of 20 t·ha−1 mainly increase the content of FA in the soil, while higher rates increase the content of and FA. Lower manure rates of amounted 20 t·ha−1 increase mainly the content of fulvic acids in the soil, while higher rates above 20 t·ha−1 increase in the content of humic and fulvic acids. Similar discrepancies also apply to the effect of liming on the increase of humus content in soil as well as on stable humus fractions. Calcium carbonate is thought to promote the accumulation of humic substances in the soil, especially the persistent humin fraction. Other researchers indicate that manure and crop residues decompose more rapidly in limed soils, because this treatment accelerates the mineralization process [11,17]. There is also a view that long-term soil acidification can decrease organic carbon content and worsen the soil organic matter quality [18,19]. One way to mitigate of soil acidity is to apply of manure, which increases the buffering capacity of light soils. Green manures are also a significant source of carbon. Very important is also Sowing the plants is very important in playing the role of green manure because it has the same effect as liming the soil, i.e., the so called “liming effect”. This is very important for agricultural management of acidic soils and mitigation of acidifying side effects of nitrogen fertilization [20,21,22].
The aim of the study was to evaluate changes in the content of soil organic carbon and humic substances in 0–30 cm top layer of not limed soil after long-term mineral nitrogen fertilization and manure application in two 4-years crop rotations with different amounts of inflowing organic matter. In this work, different fractions of soil organic matter were used instead of total soil organic carbon (SOC) as sensitive indicators of changes in soil quality, due to the many important interactions of these components in the soil [16,23]. The degree of humification of soil organic matter, HA/FA ratio, together with the contributions of the particular fractions of humic substances, were determined using the Schnitzer method [24]. The same soil type (a loamy sand) without the use of manure and mineral nitrogen was used in presented experiment as a reference (control).
2. Materials and Methods
2.1. Study Area Location
The study was based on a three-factor long-term field experiment, which has been established in 1980 at the Grabow Experimental Station (Lat: 51°21′08″ N; Long: 21°40′08″ E), belonging to the Institute of Soil Science & Plant Cultivation in Puławy, Poland. The soil was classified as an Albic Luvisol (WRB, 2014) [25]. and has the loamy sand texture (70% sand, 25% silt, 5% clay). The climate at the site is temperate with a the mean annual rainfall on the level of 560 mm and the mean annual air temperature 7.8 °C (based on 36-year climatic data collected from 1980 to 2016). This climate is considered as Dfb i.e. warm humid continental climate, according to the Köppen-Geiger climate classification
2.2. Study Area
The experiment includes two 4-year crop rotations: crop rotation A (that depletes the soil in organic matter) which were cultivated grain maize (Zea mays), winter wheat (Triticum aestivum), spring barley (Hordeum vulgare) and silage maize, and crop rotation B (that enriches the soil in organic matter) with the cultivation of: maize (Zea mays), winter wheat (Triticum aestivum) plus mustard (Sinapis alba), spring barley (Hordeum vulgare) (with undersown grass–clover) and grass–clover mixture (Festuca pratensis Huds and Trifolium pratense ). Until 2008 potatoes were grown in both crop rotations, which were then replaced by grain maize in view of the rapid expansion of grain maize in Poland. Barley, maize and wheat straw were removed from the field in both crop rotations. Mustard for use as green manure was sown in the third week of August, shortly after disk harrowing of winter wheat stubble. At the beginning of November green mustard biomass was disked and about two weeks later incorporated into the soil by ploughing. The seeds of grass–clover mixture were sown between 1 and 15 April. in an amount of 12 kg of red clover and 14 kg of meadow fescue per hectare. The grass–clover sward was harvested in three to four cuts per year and removed from the field. Grass clover mixture was disked and ploughed down in the autumn. Within each crop rotation, application rates of manure (FYM) and inorganic N fertilizer were varied in a split-plot design replicated in four blocks per field. Five FYM rates were assigned to main plots, starting in autumn 1979. The manure was applied in both crop rotations once per 4-year cycle, in the autumn preceding potatoes (grain maize), at rates: 0, 20, 40, 60 and 80 Mg ha−1. FYM composition was measured in 2015 (fresh wt. basis) and on average, FYM reaction amounted 8.4. It contained [kg·t−1 (fresh wt. basis)]: 5.4 (N), 3.5 (P2O5) and 5.8 (K2O), as well as 245 kg·t−1 of dry matter. In 1988 N fertilizer rates were introduced as a third orthogonal factor adjusted to the nutritional requirements of cultivated plants (No, N1, N2, N3). Doses N2 and N3 were a multiples of N1 dose. Each crop was supplied with four rates of nitrogen fertilization and the doses of phosphorus and potassium fertilizers were in accordance with Table 1. Nitrogen was applied as ammonium nitrate (34% N), P as triple superphosphate (45% P2O5) and K as potassium chloride (60% K2O).
In this experiment conventional soil tillage system was used, with disking to cut the stubble and bury it shallowly prior to mouldboard ploughing to the depth of 30 cm. In this long-term experiment liming the soil was never used. The “liming effect” was achieved with different rates of manure. Four rates of mineral nitrogen were assigned to smaller plots marked out within the each main plot, with the same FYM rate. Each plot had a total area 8 × 5 m, or 6.25 × 4 m for net harvesting.
2.3. Soil Sampling and Methods of Staistical Analysis
In both crop rotations, plant residues were harvested from the field and no limed soil was applied to the soil. At 4-year intervals (after each crop rotation) soil samples were collected at the end of the growing season just before ploughing (September−October) from 0−30 cm of the soil layer. Properties of the soil were selected—pH (pH in the suspension KCl (mol·dm−3) PN-ISO 10390:199—and the content of SOC by the Tyurin method (PB 021-wyd.IV.28.08.2020) was performed by the certified chemical laboratory of the Institute of Soil Science and Plant Cultivation in Puławy, Poland, and also detailed soil organic quality tests like the fractionation of organic matter by the Schnitzer method [24] were also performed.
Humic acids were extracted from the soil under study according to the method of Schnitzer to obtain humins (H), humic acid (HA), and fulvic acid (FA) fractions. The separation of the differing properties of three categories of humic substances: humic acids, fulvic acids and humin, is the result of the analytical procedure for their fractionation, based on the criterion of their solubility in selective solvents: in acids and alkali. The carbon contents in soil extracts (individual fractions) was determined using the automated N/C analyzer (Multi N/C 3100, Analytik Jena; Jena, Germany). Based on the obtained results, the percentage share of individual fractions in the total pool of organic carbon was calculated. The carbon of the humin fraction calculated from the difference between organic carbon and the sum of marked factions. The content of organic carbon of separated fractions was calculated as follow:
CD-carbon in extracts after soil decalcification with 0.025 M HCl (extraction for 24 h at room temperature)HA + FA-carbon of the sum of humic and fulvic acids in extracts obtained with 0.5 M
NaOH (extraction for 24 hours at room temperature);
FA-carbon of fulvic acids in solutions after precipitation of humic acids with 6 M HCl
to pH = 2) (extraction for 24 hours at room temperature)
HA - carbon of humic acids calculated from the difference:
HA = HA + FA − FA
H = 100 − (HA + FA + CD)
The solutions of each fraction are separated from the soil by centrifugation.
The fractional composition was expressed as the percentage share of respective fraction in the total organic carbon pool. The fractional composition was expressed as the percentage share of respective fraction in the total pool of soil organic carbon (SOC). The ratio HA/FA ratio (indicator of the soil organic matter quality) and the degree of humification (DH) index (DH= (HA + FA)/H) were also calculated. For the purpose of this study in 2016 soil samples were collected from two crop rotations neighboring fields on which maize for silage (rotation A) and grass-clover mixture (rotation B) were grown according to conventional crop management system. This paper presents the results of the analysis of the properties of loamy soil fertilized with the rates: 0 (N0) 100 (N100) and 150 (N150) kg∙ha−1 of inorganic nitrogen and: 0 (M0), 20 (M20), and 40 (M40) t∙ha−1 of FYM (doses of manure oscillating within the norms of the Council Directive 91/676/EEC of 12 December 1991) [26].
The data were subjected to the 3 way analysis of variance (ANOVA) to compare crop rotations, FYM rates, and N levels and all possible interactions, with significance of differences assessed by Tukey’s Honestly Significant Difference at p ≤ 0.05, using the FR-ANALWAR 5.2 (Rudnicki, Bydgoszcz, Poland) software based on Microsoft Excel.
3. Results and Discussion
3.1. Soil Organic Carbon Content and Soil pH
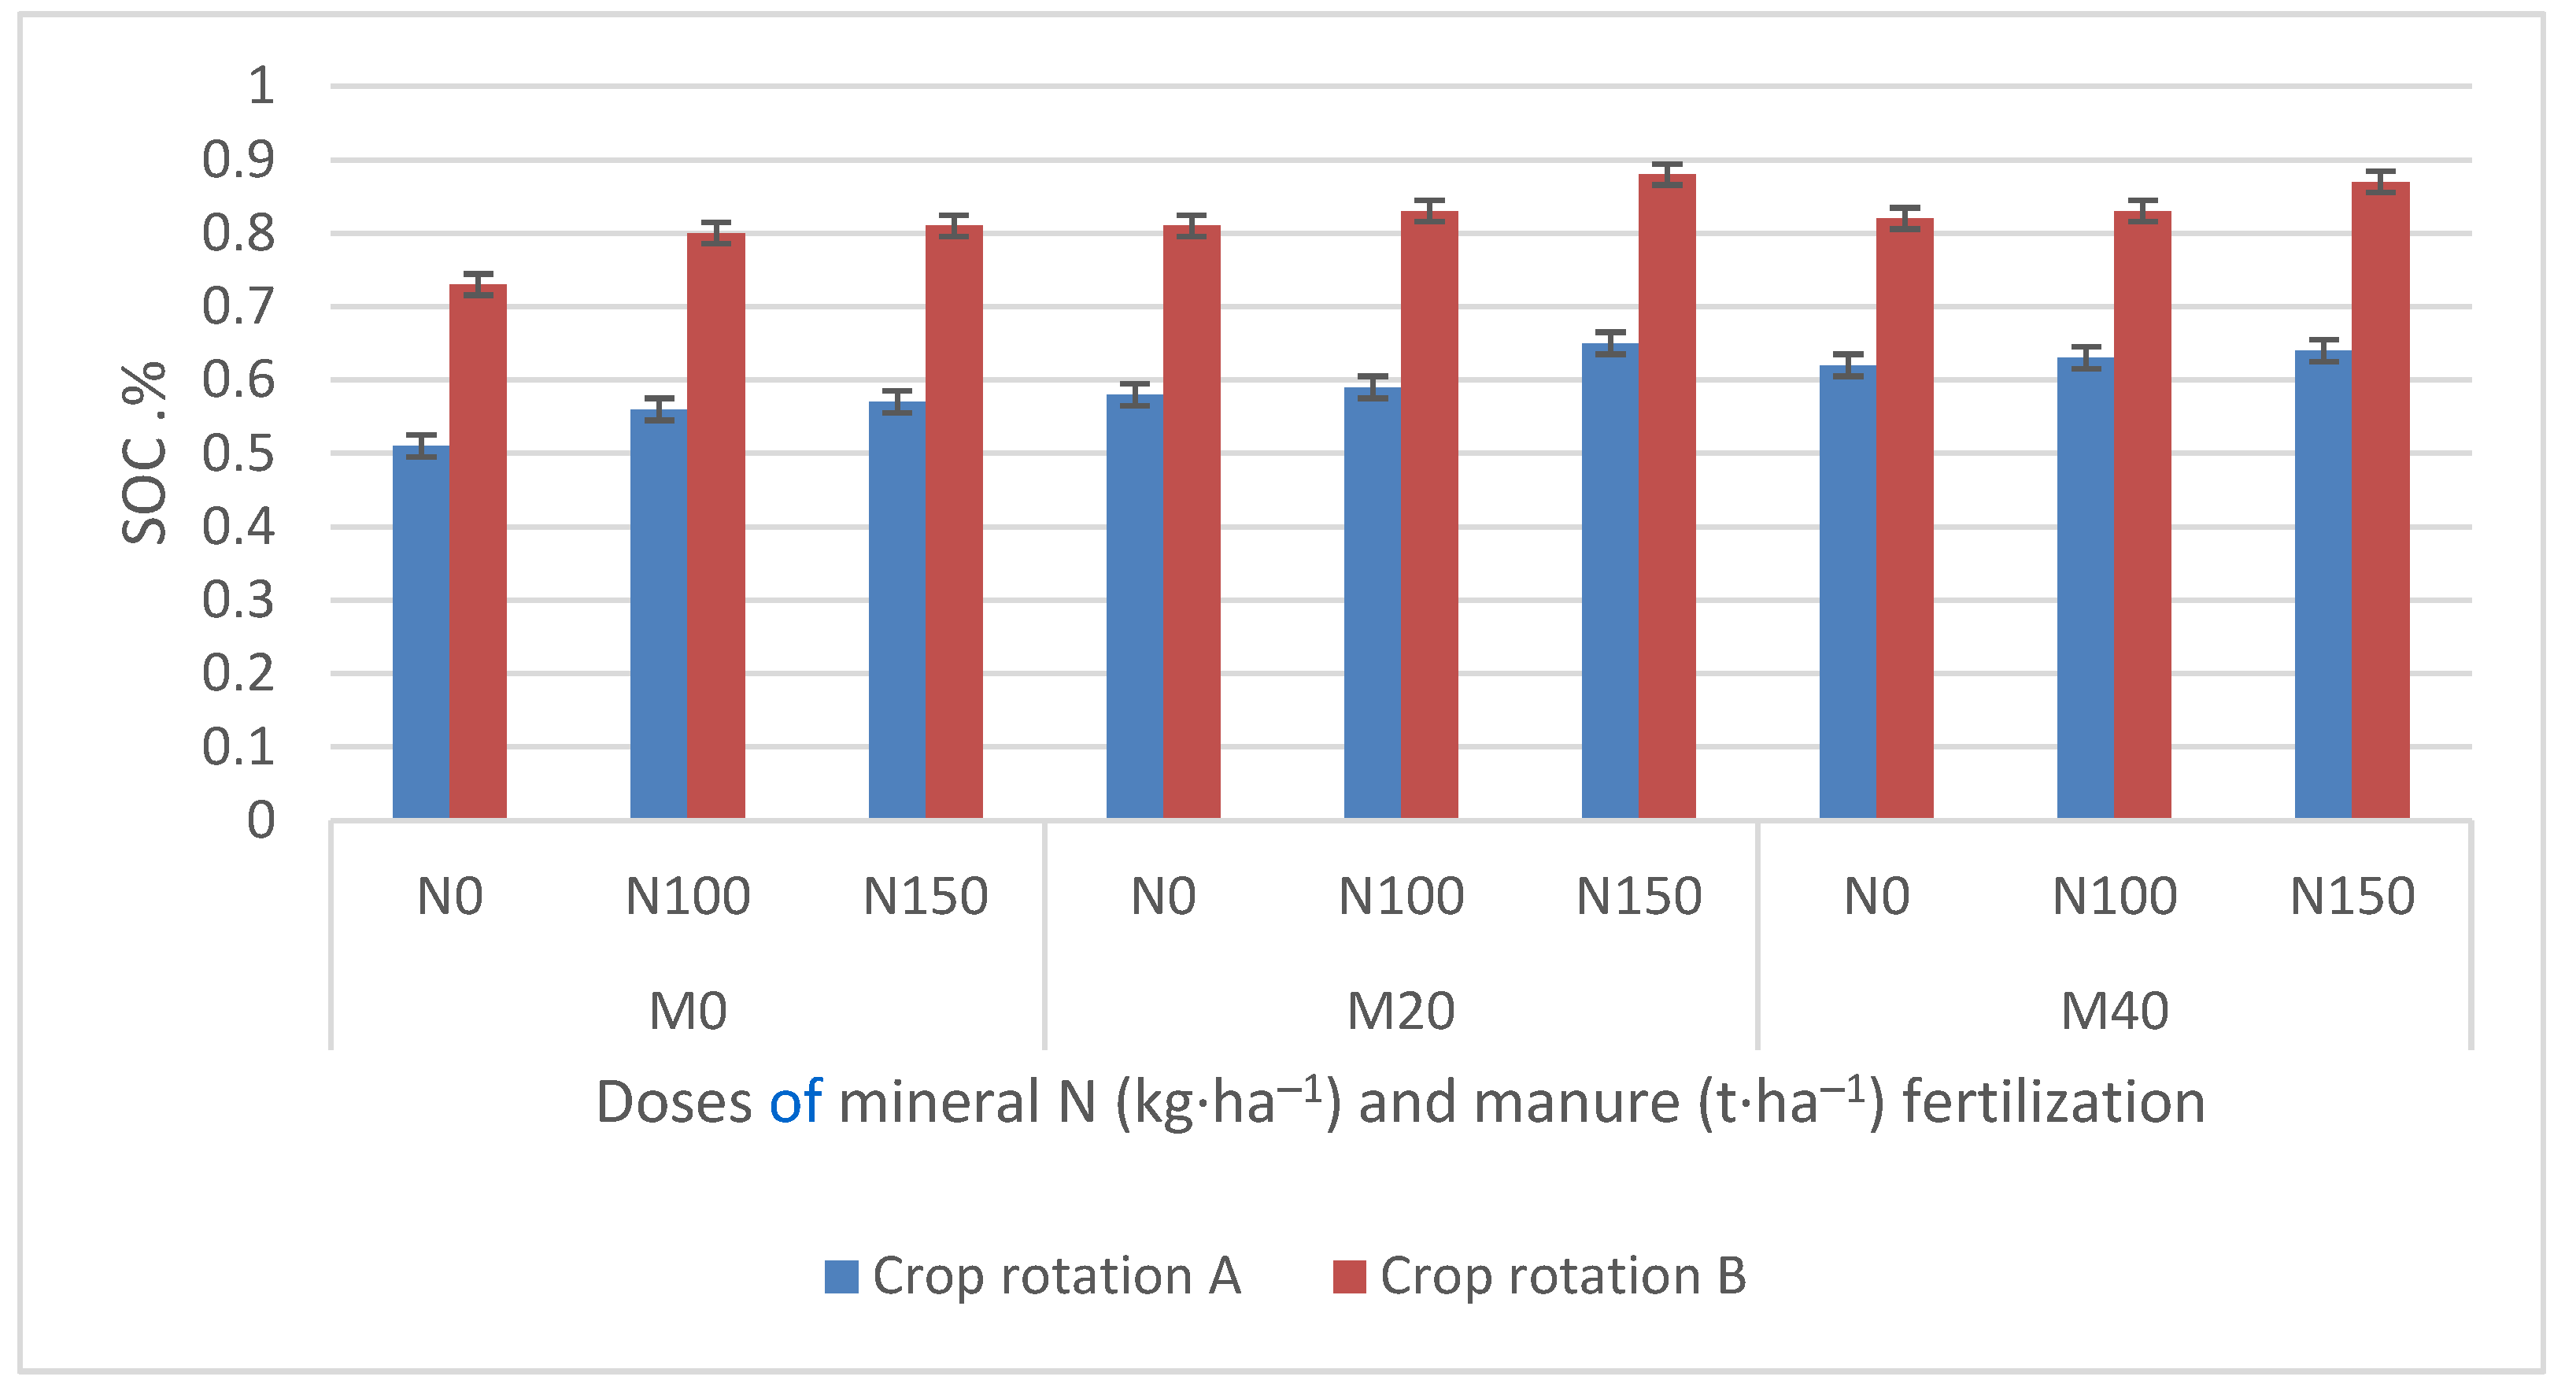
The results of the statistical analysis showed that the factors significantly influenced on soil organic carbon content were crop rotation, manure and inorganic N fertilization. The significant interaction of crop rotation and mineral nitrogen fertilization as well as the significant interaction of manure and mineral nitrogen fertilization on soil carbon content were confirmed (Figure 1, Table S1). In the described experiment, the selection of plant species for crop rotation was recognized as crucial for this parameter. The soil in crop rotation B accumulated significantly larger amounts of soil organic carbon in 0–30 cm layer despite of the lower soil pH (Figure 2, Table S2). This confirms the opinion of many scientists that organic matter origins from manure ploughed once per 4 years into a light soil has a smaller contribution in increase of soil organic carbon, compared to organic matter that is left annually by crops [4,5,8]. The depleting crop rotation—consisting of grain maize, winter wheat, spring barley and silage maize—accumulated 0.60% (overall mean) of soil organic carbon, while crop rotation enrichment of SOM—consisting of grain maize, winter wheat plus mustard, spring barley (with under sown grass–clover and grass–clover mixture)—accumulated markedly larger soil organic carbon (overall mean 0.82%). Averaged across all the treatments, the content of organic carbon in rotation B was almost 36% higher than that in crop rotation A (Figure 1). There was also an increase in soil organic carbon with increasing of manure application rates. The soils of the variants with 20 and 40 t· ha−1 of manure contained more carbon than the soils from the control treatments (without manure) in both of crop rotation. A similar trend occurred after increasing the doses of mineral nitrogen.
In crop rotation A the unamended soil (N-0, no FYM) contained the lowest amount of SOC (0.51%), while the highest content (0.64%) was found in the soil fertilized with N-150 and 20 tha−1 of FYM. In crop rotation B the corresponding values of SOC were 0.73% and 0.88%, respectively. In addition, in both crop rotations and at all N rates soil fertilized with 40 t ha−1 of FYM showed significantly higher SOC content compared to the untreated soil. The positive influence of organic fertilizers on soil fertility has been demonstrated in the papers of many researchers [27,28,29,30,31]. Under properly constructed crop rotation and with use of FYM, but without using mineral fertilizers, natural mechanisms that maintain high soil fertility also should be stimulated [32]. In this study the soil fertilized with 0 t·ha−1 of FYM and with mineral nitrogen in doses 100 and 150 kg·ha−1 in crop rotation B was richer in SOC by 42%, on average, in N rates, than the soil in crop rotation A without applying of manure. The scientific literature indicates, however, that exclusive mineral fertilization can stabilize the organic carbon content in the soil, as well as can prevent decrease or even increase its content [28]. When manure was used in a doses 40 t·ha−1 with 150 kg N·ha−1 the accumulation of the maximum amounts of SOC in both crop rotation was found (Figure 1). The results confirmed that including legumes in mixture with grass and mustard into crop rotation might provide an effective method to preserve the optimal level of humus. However, in the majority of conducted long-term experiments, an increase was recorded in the total organic carbon content on soils fertilized with manure combined with N mineral [7,33]. In the presented research, the effect of crop rotation had a larger impact on organic carbon accumulation in soil than the manure applications. Those results could be explained by the fact that the mixture of clover with grasses results in a greater amount of humus accumulation in soil compared with manure application. Moreover, carbon from manure is more prone to undergo mineralization. Numerous papers indicate that the combined application of manure and mineral nitrogen fertilizers enhances the mineralization process of humus [34,35,36]. However, there exists a strong consensus in the literature that mineral nitrogen has beneficial effect on humus stabilization [28,37]. In this study, the significant effect of mineral nitrogen fertilization was proven. These results are also in accordance with the general knowledge that soil organic carbon changes slowly in response to various agricultural practices such as crop rotation, manuring or mineral fertilization [38,39,40].
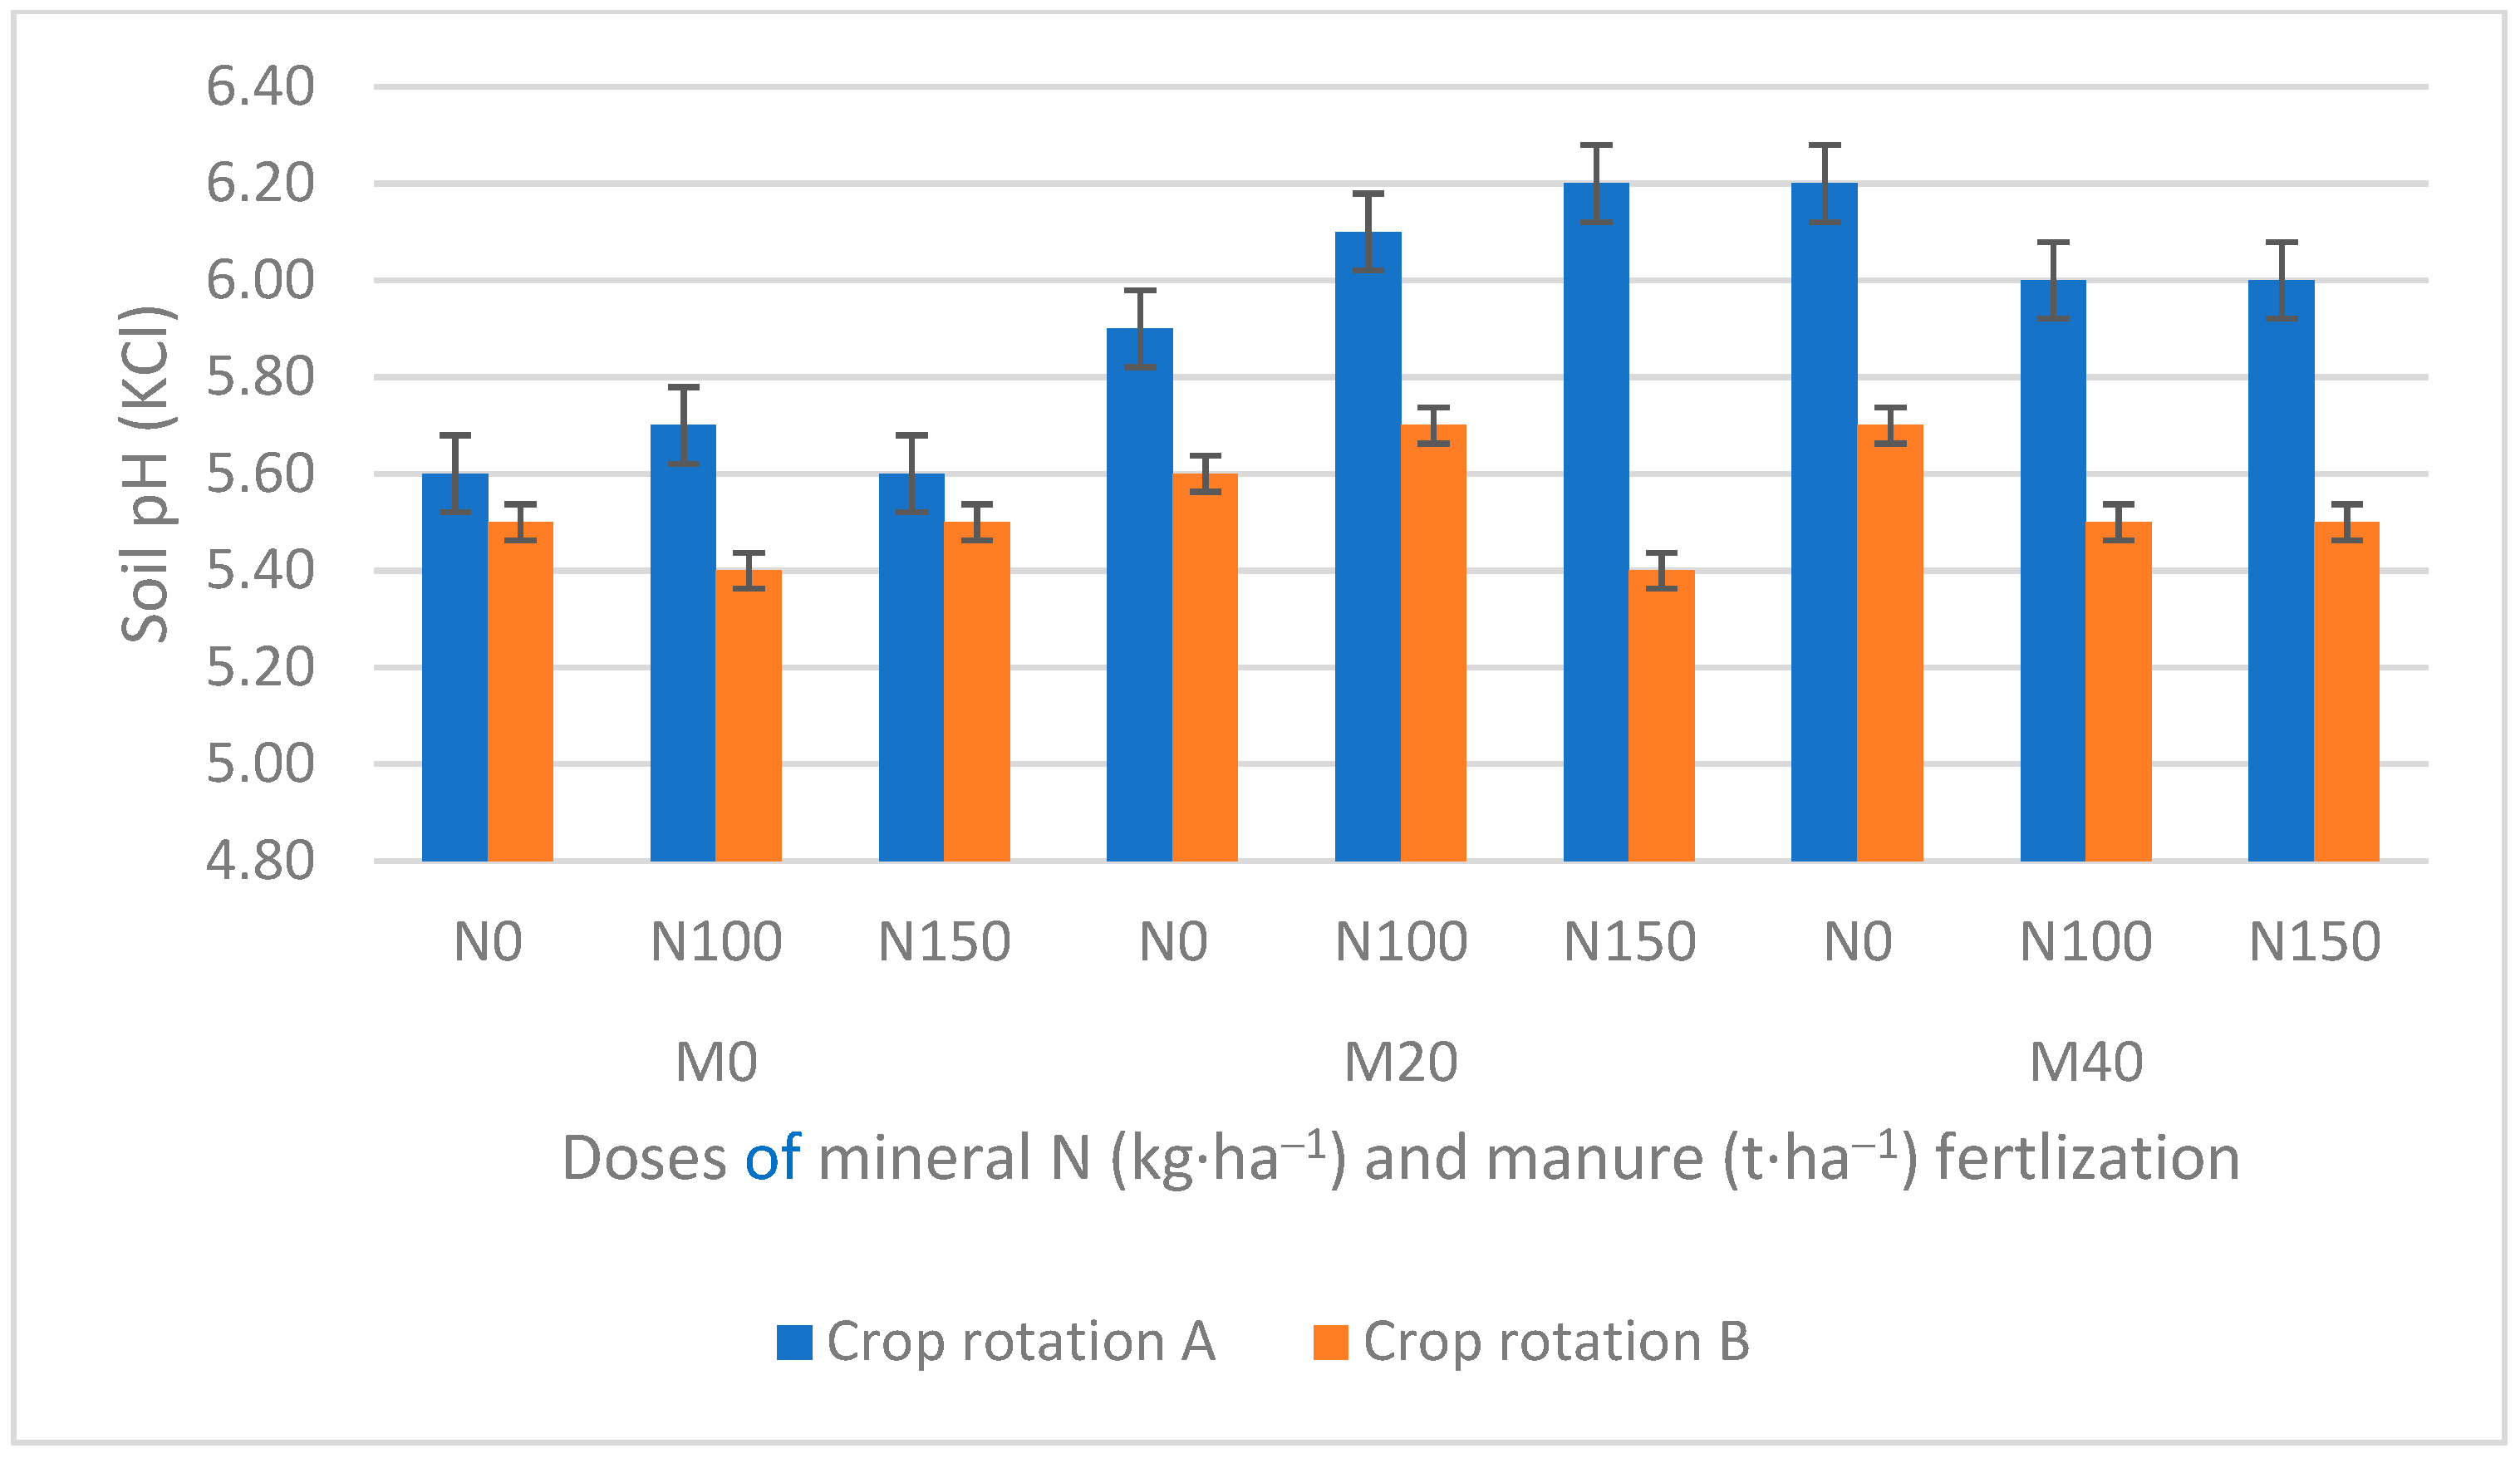
Scientific studies showed that soil liming has a beneficial effect on soil organic carbon accumulation [18,29,40]. In contrast, intensive mineral fertilization and a lack of liming caused a decrease in soil pH [4,7,41] and consequently a decrease in soil organic carbon content. In our study, the soil was not limed. The role of pH regulating of light soil is fulfilled only by manure [8,33]. After nearly forty years of research, the soil in crop rotation A was characterized by a significantly higher pH compared to crop rotation B, irrespective of the dose of manure and mineral nitrogen applied (Figure 2). The average pH of soil not fertilized with manure was 5.6. After the application of manure the pH was 6.1. In crop rotation B, despite of the applied manure, the soil reaction was lower. In treatments without this fertilizer, the average pH was 5.5, while after the application of farmyard manure at the doses of 20 and 40 t· ha−1, it oscillated around 5.6. The different pH of soil was mainly determined by the quality of soil organic matter [19].
3.2. Humic Substance Characterization
Simply storing of organic carbon in the soil does not guarantee the stability and good quality of organic matter. Soil organic matter consists of a light fraction, not bound to mineral colloids (labile fraction), the fraction bound to soil aggregates, and a fraction strongly bound to mineral particles, which determines its quality and stability [37,41,42,43,44,45]. From a chemical point of view, the quality of organic matter is determined by the composition of humic substances, i.e., the share of fractions of HA, FA and H in the total pool of organic carbon and HA/FA ratio [23,28]. The contents of humic substances are directly and indirectly determined by physical, chemical, biological, and environmental properties of soil [1,3]. The properties of soil organic matter were evaluated on the basis of its fractional composition. Figure 3, Figure 4, Figure 5 and Figure 6 and Table S1 shows the groups of humus composition after almost 40 years of the experiment with manure and mineral N application. The research results showed that the composition of the organic matter fractions (%) was modified both by crop rotation (the selection of plant species for crop rotation), manure and mineral nitrogen application (Figure 3, Figure 4, Figure 5 and Figure 6).
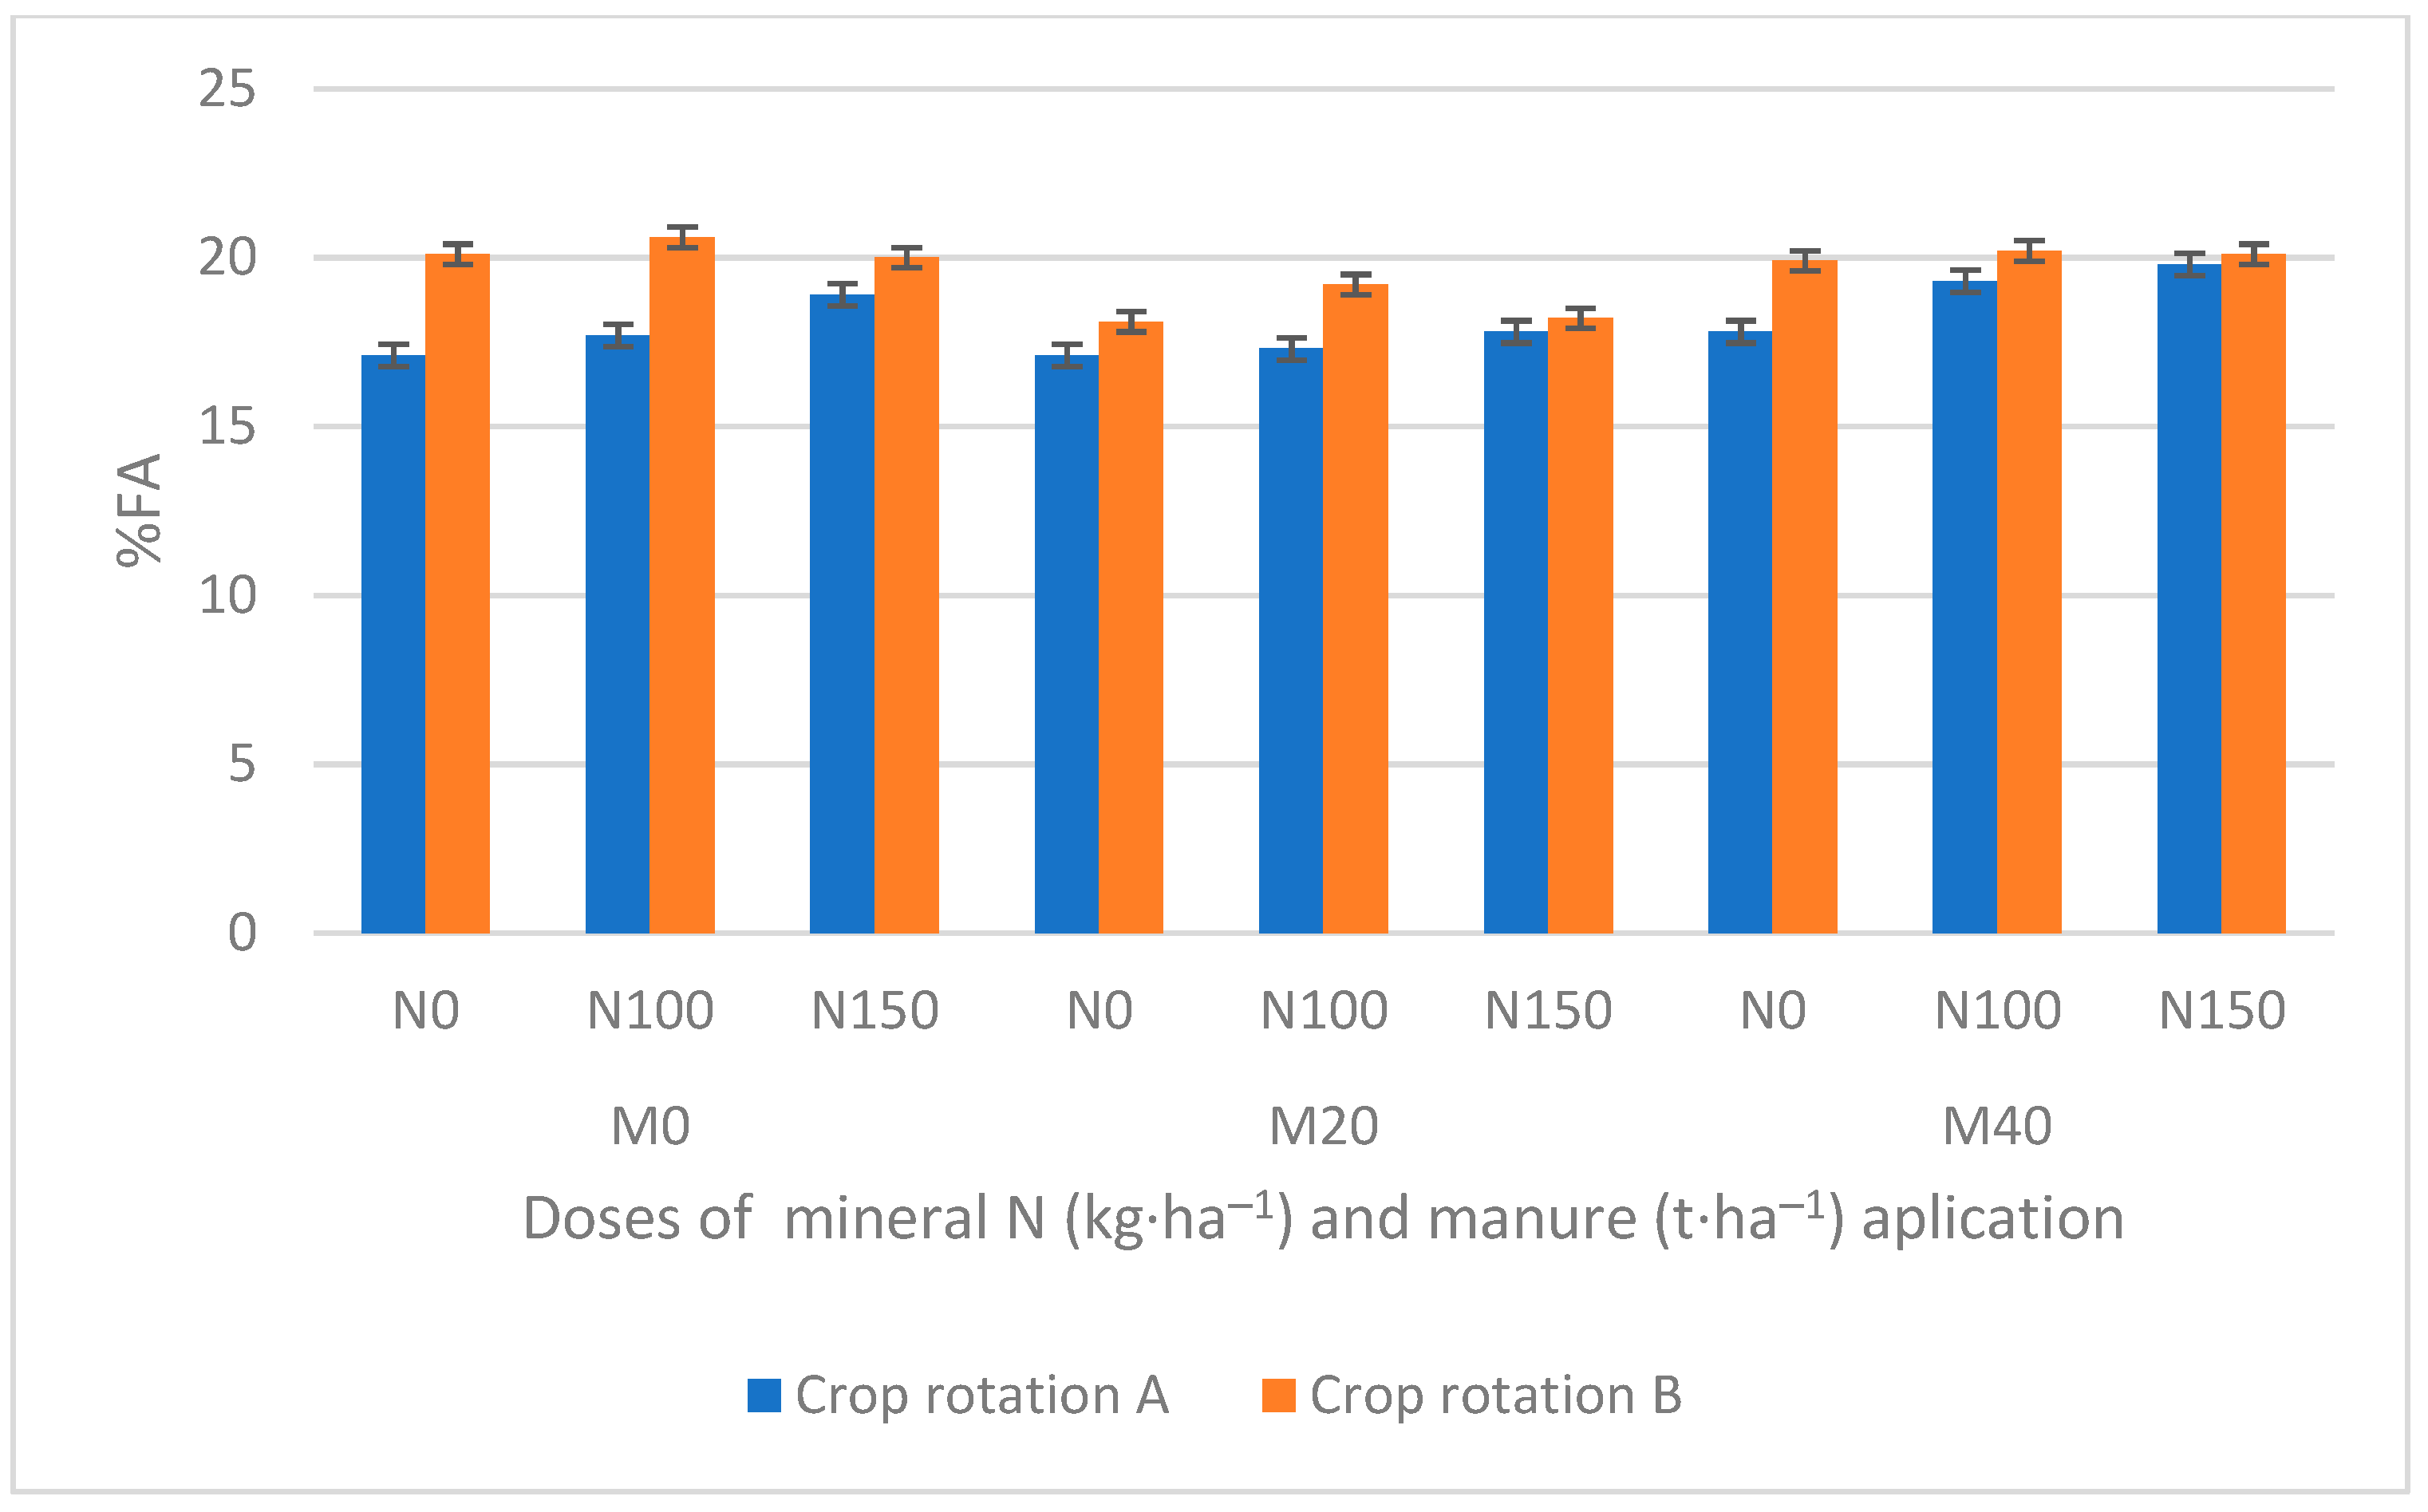
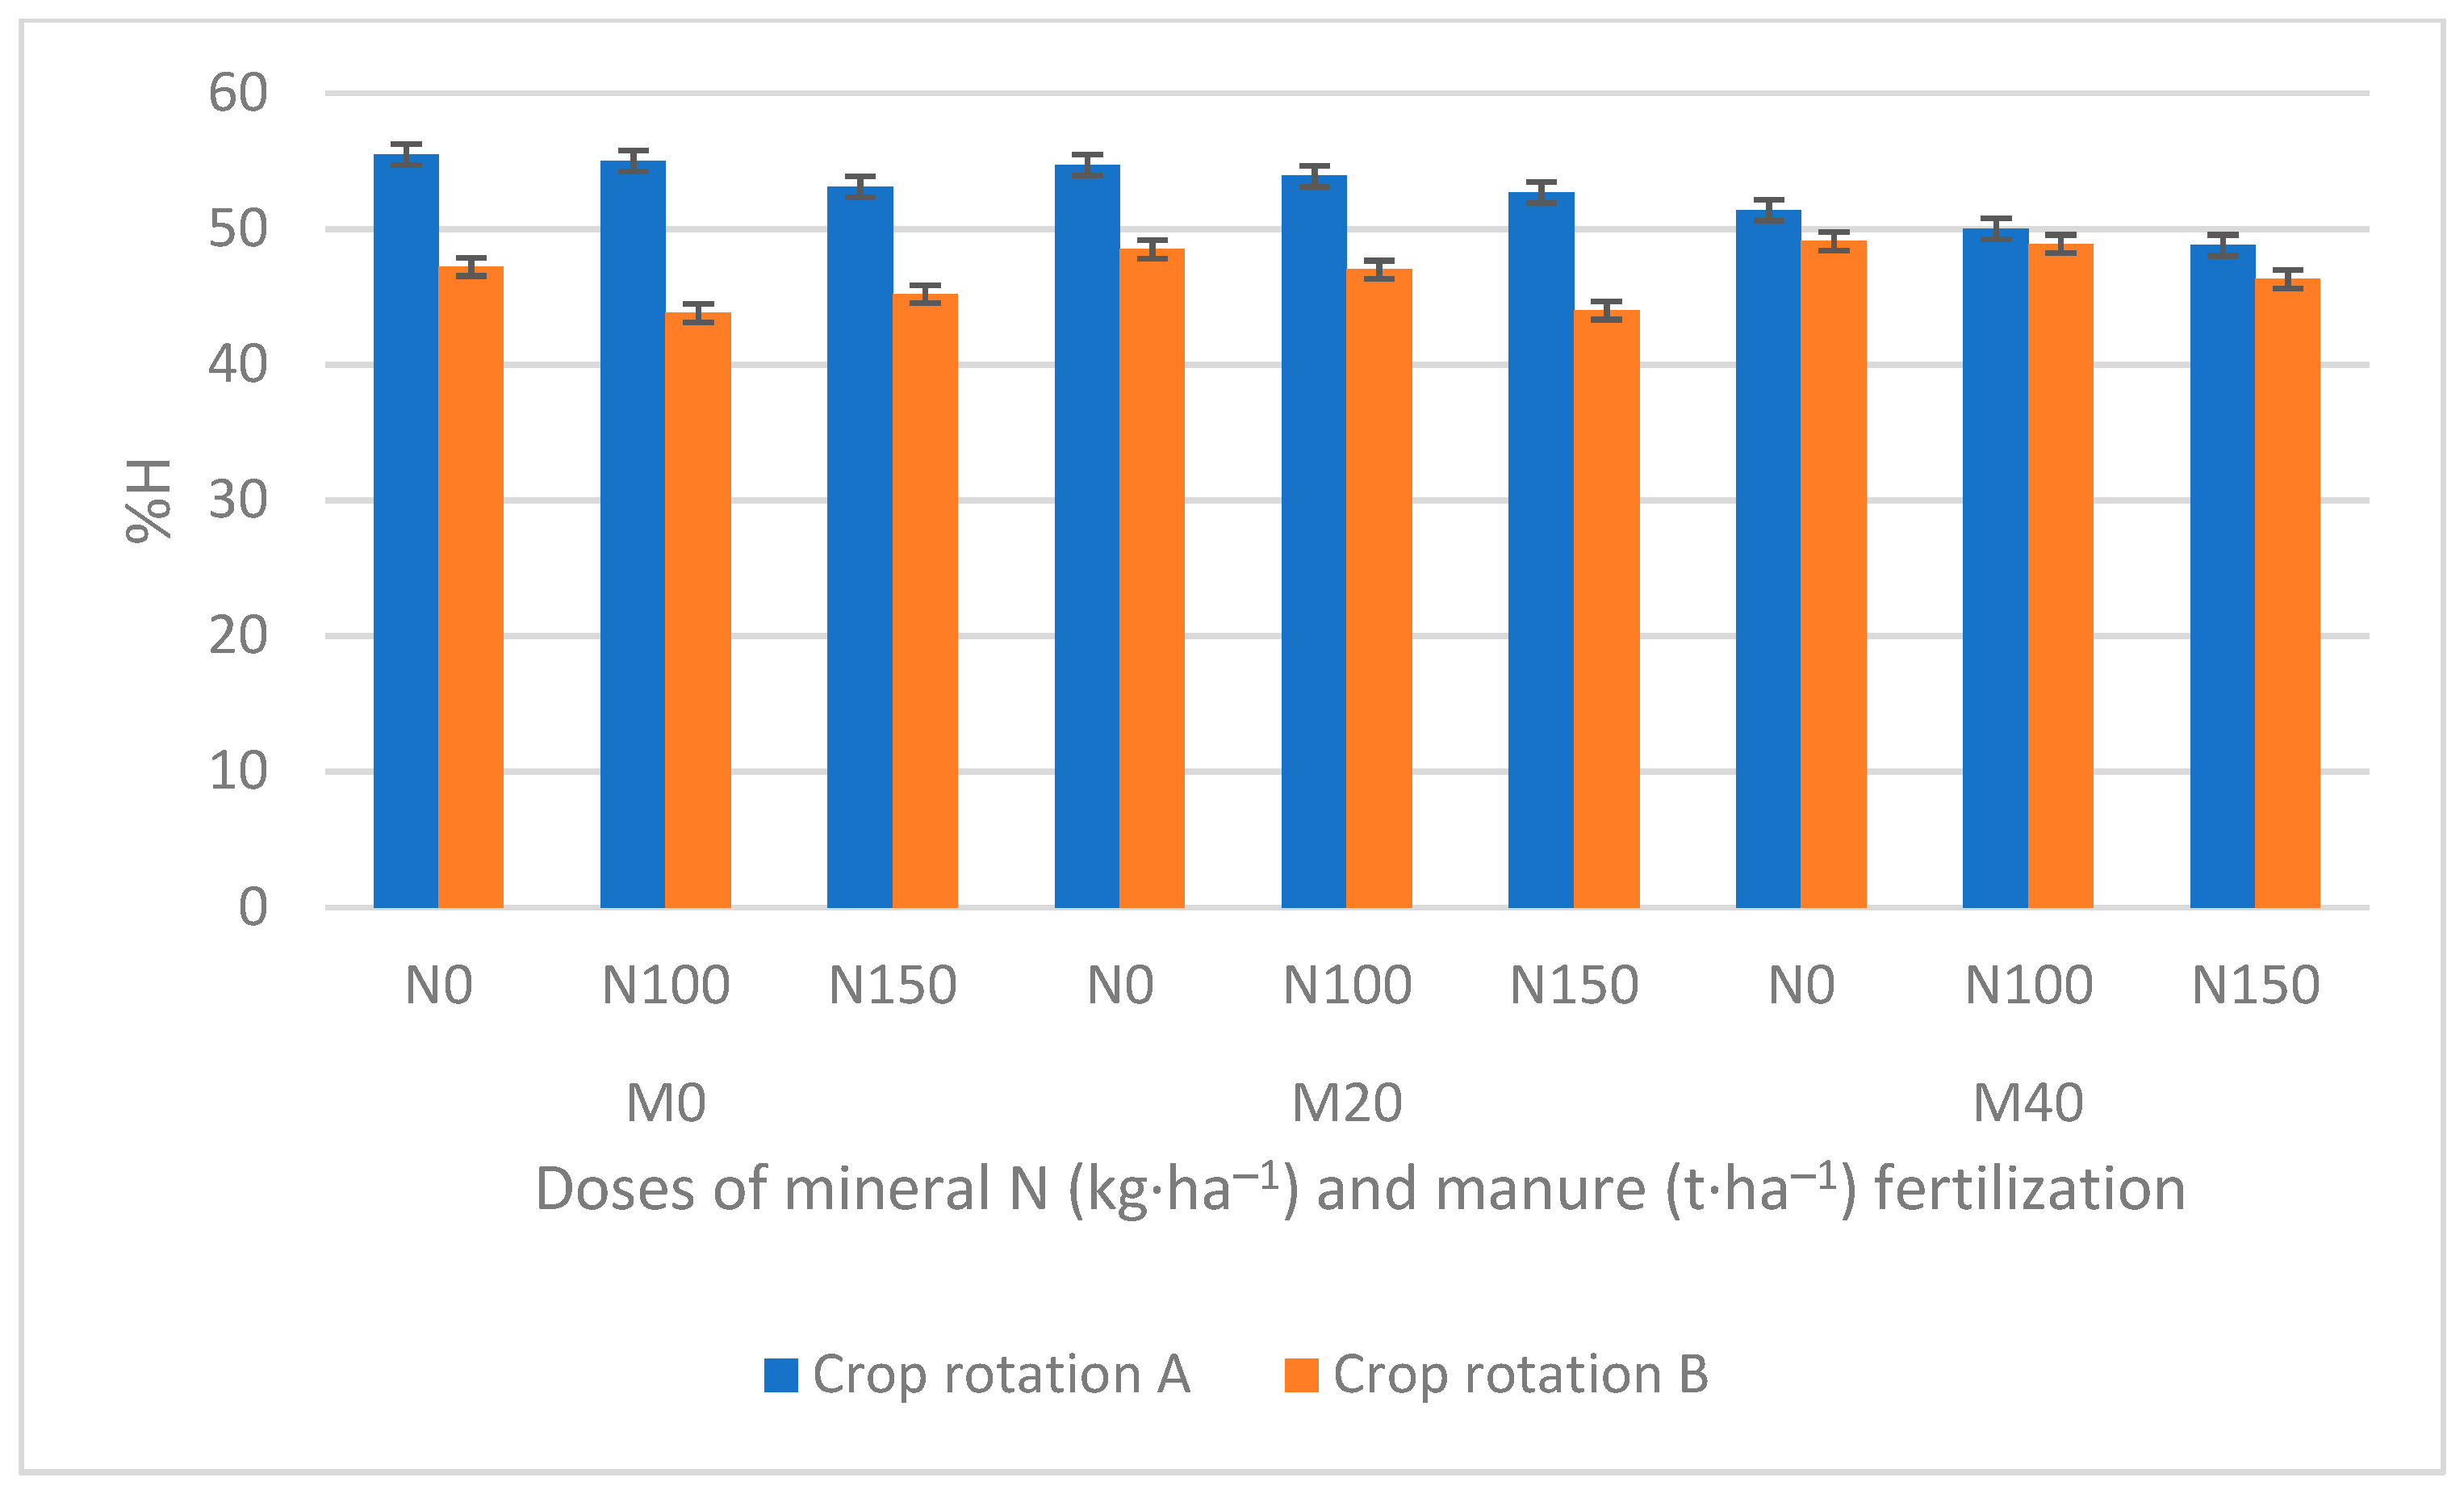
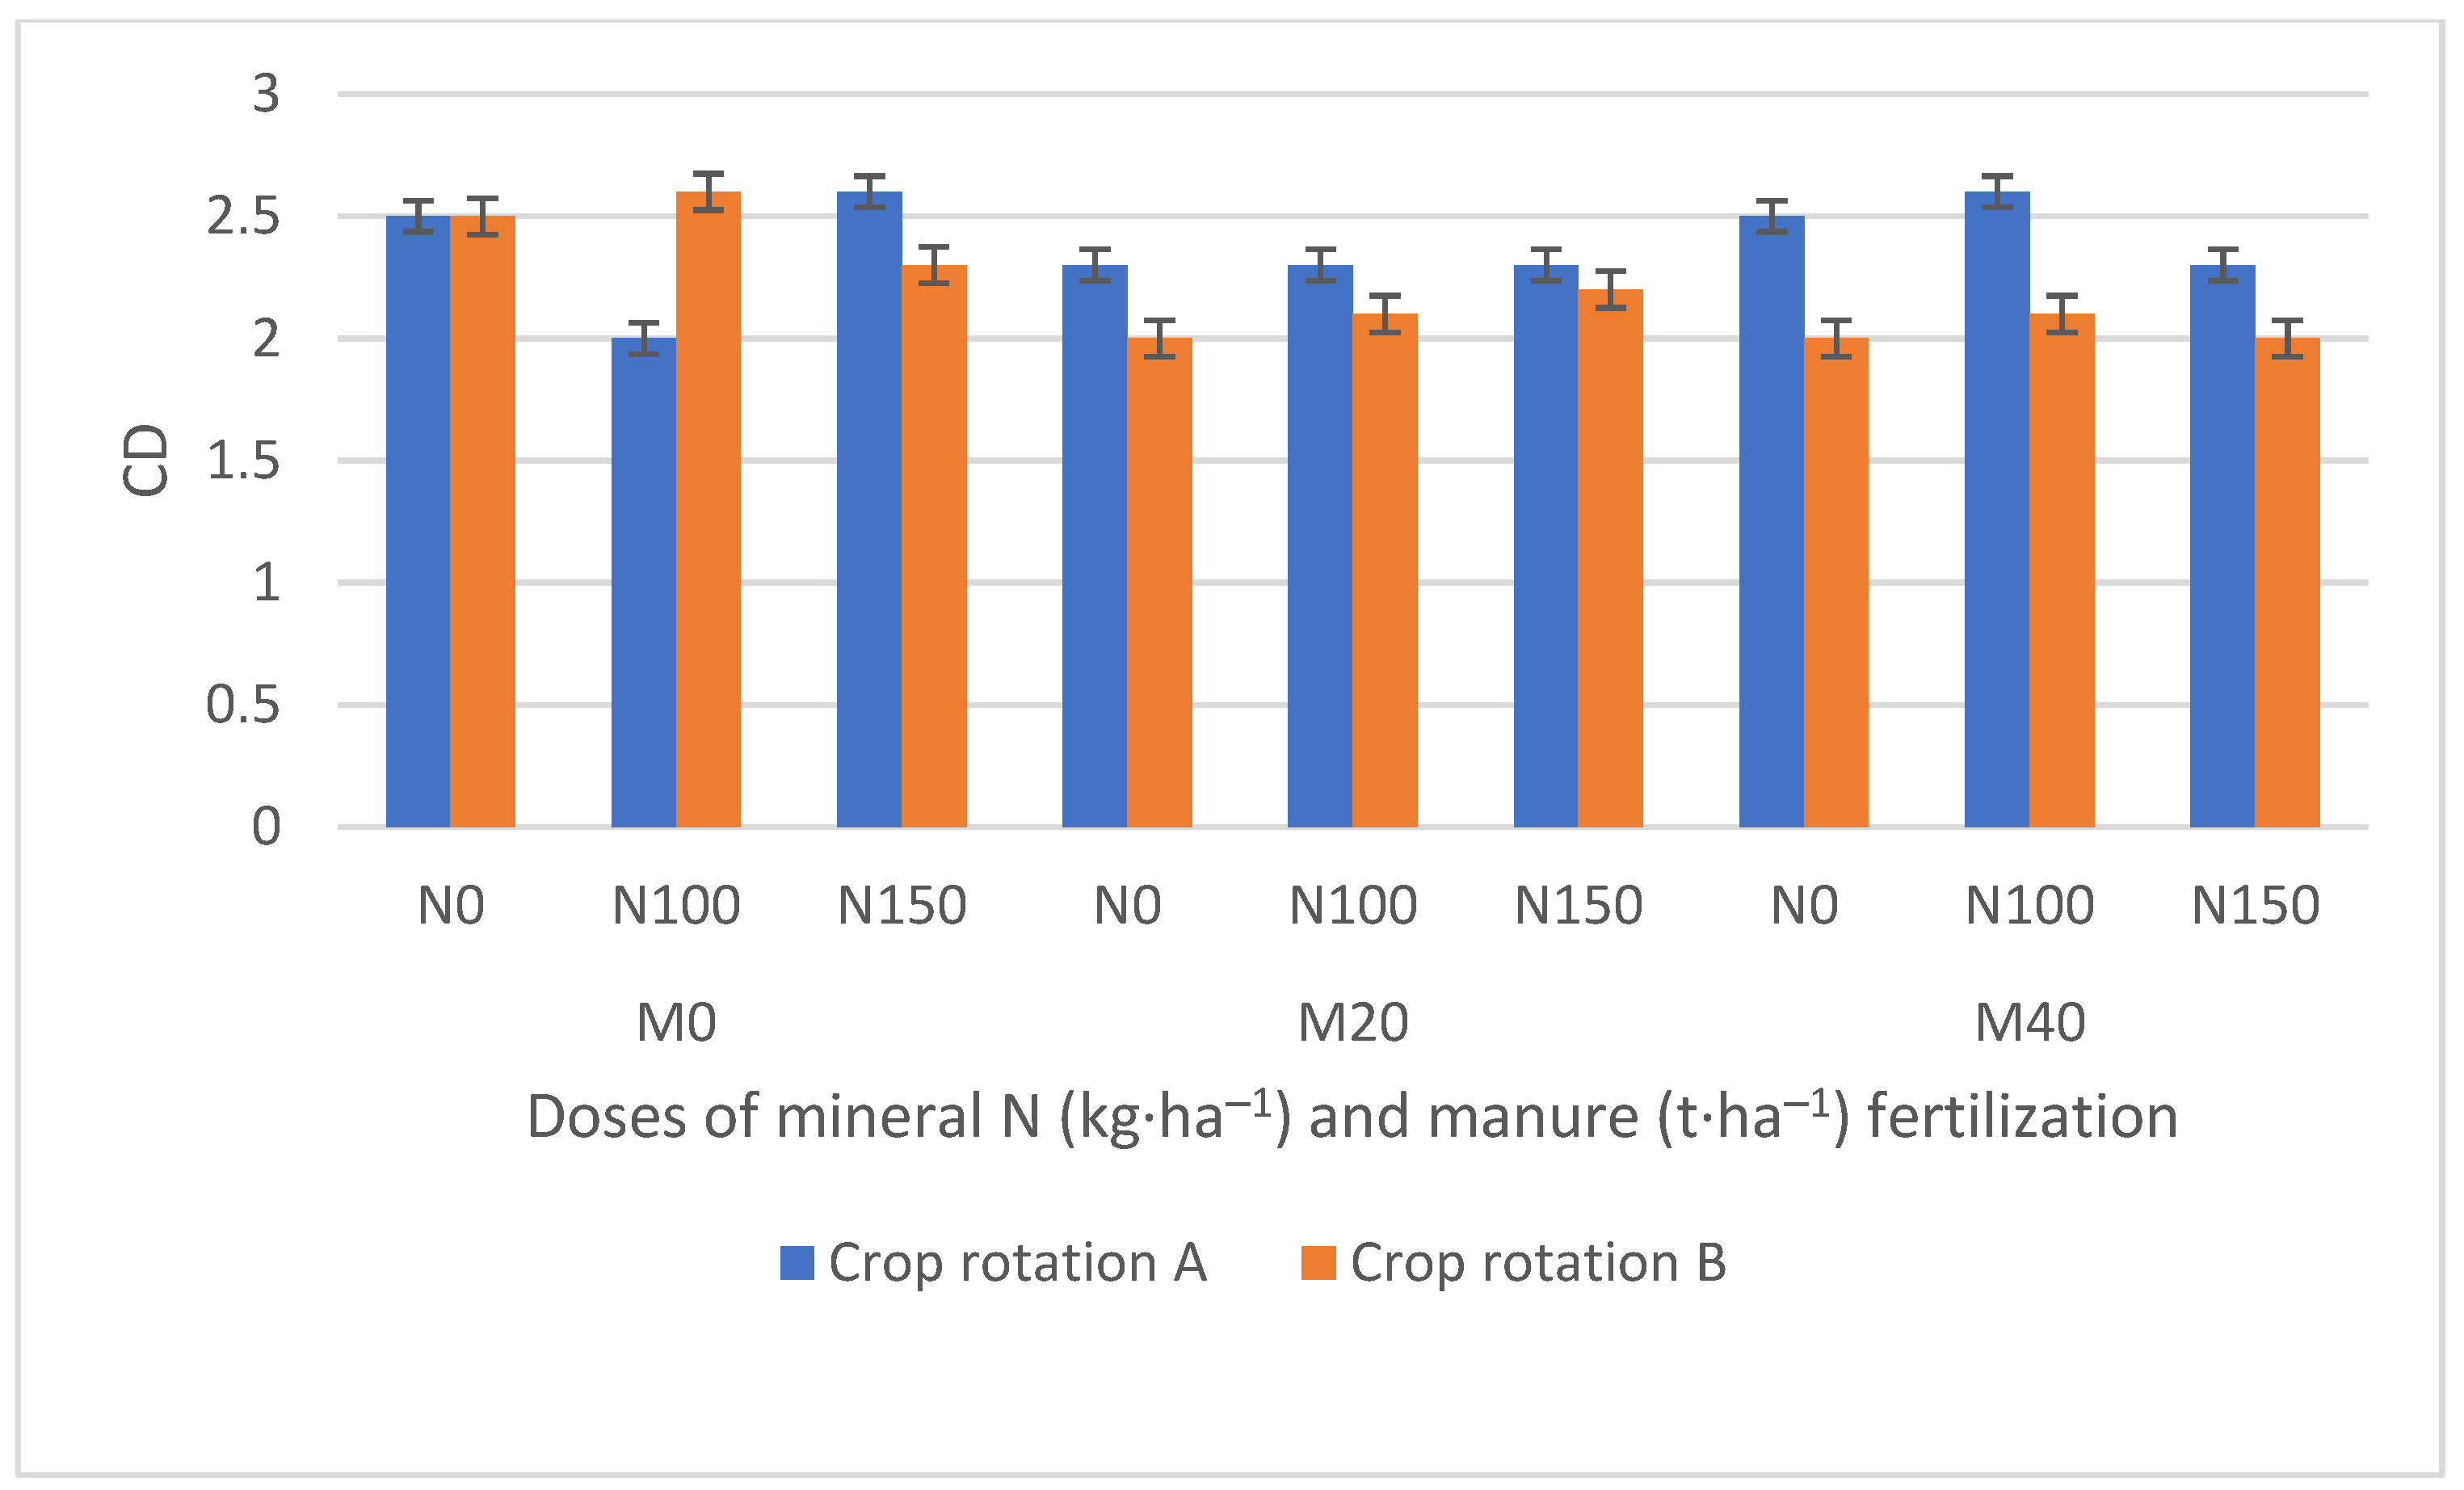
Humic substances are more stable organic matter compounds, which are a significant portion of the total soil organic C and N [1,28]. The results of the statistical analysis showed that the factors significantly, influenced on HA, FA, H content were crop rotation, manure application and fertilization with inorganic N (Figure 3, Figure 4, Figure 5 and Figure 6) The significant interaction of crop rotation and fertilization with mineral nitrogen, as well as manure and mineral nitrogen fertilization on humic acids content in soil was confirmed (Figure 3). In rotation B, the average CHA content was 18% higher than in rotation A. This fraction also was depended on manure fertilization significant influence of all experimental factors and their interactions on this fraction of soil organic matter, was confirmed (crop rotation between inorganic feralization, and manure application between inorganic fertilization). The effect of FYM on the content of humic acids was particularly evident in depleting crop rotation after using a dose of 40 t·ha−1. A similar trend occurred in the case of FA (Figure 4). A distinctive/significant difference was observed in the evolution of the stable fraction of organic matter—(H) (Figure 5) over time for crop rotation that included plants recognized to deplete humic substances or plants that can enrich their content in soil (Figure 1). It was shown that, in contrast to the fractions FA and HA, the H fraction is more sensitive and responsive to changes in agricultural practices, such as crop rotation or organic amendments, and the results of the present study confirmed these findings. Crop rotation had a strong influence on soil organic matter quality. The mixture of legumes with grass mixture left a great amount of residue which was abundant with carbon and nitrogen—the source of energy for soil microorganisms—which promoted the process of humus transformation with the prevalence of mineralization [28,32]. It was found that crop rotation A increased the contribution of this fraction to the total organic carbon pool (mean—50.1%) compared to crop rotation B (mean—47.3%). Averaged over all treatments, fraction of H in crop rotation B was almost 9.7% lower than in crop rotation A, while HA and FA were 17.6 and FA 8.24% higher, respectively than in crop rotation A (Figure 3, Figure 4 and Figure 5). The lower percentage of stable organic matter fraction in crop rotation B was probably due to the cultivation of legume plants in this crop rotation, which left larger amounts of nitrogen in the soil, and to the ploughed mustard that had an acidifying effect on the soil, which might intensified the mineralization process [34,45]. In addition, the process of humification of plant residues containing high levels of nitrogen may be characterized by a lower value of the humification index in crop rotation B. As a result of manure application in dose 20 and 40 t·ha−1, an increasing tendency in the content of H (increased from 2.4 to 5.95%) only in the rotation B in comparison with the treatments without manure (FYM—0 t·ha−1) was found. Doses of manure application did not affect the percentage of FA fraction regardless of crop rotation. The average content of this fraction in crop rotation A was 18.1% and in crop rotation B amounted 20.1% (Figure 4). The application of manure affected differently the percentage of H in crop rotations. Moreover, manure did not affect the percentage of fulvic acid in carbon fraction irrespective of the crop rotation so, its values were similar. In crop rotation A, the application of manure doses on the level of 20 and 40 t·ha−1 resulted in a lower humins fraction compared to the treatment where no manure was applied (crop rotation B). The lowest percentage of persistent organic matter fraction was recorded after application of 40 t ha−1 of manure (50.1%). In crop rotation B, after manure application at the doses of 20 and 40 t ha−1, an increase in the humins fraction was recorded, but the average percentage share of this fraction was lower than in crop rotation A (50.1%) and amounted 48.1% (Figure 5). Generally, a higher percentage share of H fraction was recorded in crop rotation A (overall mean 51.9%), and in crop rotation B (overall mean 47.3%). The lower % share of humin fraction in this crop rotation was due to the lower soil reaction caused by mustard cultivation, which has an acidifying effect on soil [16,20]. The lower soil pH may have enhanced the mineralization process [4,23,33]. The percentage of carbon in the solutions after decalcification was similar in both crop rotations and oscillated around 2% (Figure 6).
The results shown above (Figure 1, Figure 2, Figure 3, Figure 4, Figure 5 and Figure 6) are in accord with those reported earlier in numerous studies all over the world [15,17,18,19,20,21], which clearly indicate that for example: FYM, slurry, straw, and diversified crop rotations, in particular those comprising grasses or grass-legume mixtures, beneficially affect different soil processes and properties, including accumulation of SOC in soil. However, the above crop rotation with a combination of regular application of FYM and mineral nitrogen had a different effect on the fractional composition of organic matter in light soil.
3.3. HA/FA Ratio—Indicator of the Soil Organic Matter Quality
As a consequence of changes in the humic and fulvic acids carbon content in the total organic carbon pool, under the influence of differentiated mineral fertilization and manure application, changes in HA/FA ratio determining the humus quality were observed. The results of the statistical analysis showed that the factors significantly influencing HA/FA ratio were crop rotation and manure. Significantly influence of fertilization with ammonium nitrate on this parameter was not proven (Figure 7).
The ratio between humic and fulvic acids (HA/FA) reflects the mobility of soil organic carbon [1,15]. HA/FA ratio near 1 the good quality of organic material that could enhance soil physical properties and improve plant growth. HA/FA ratio > 1 indicates loss of the more labile FA fraction, a situation very common in sandy soils [1]. Such a relationship was observed in this study. Lower values of HA/FA ratio were obtained in crop rotation A (overall mean 1.48). In crop rotation enriching the soil with organic matter the value of humic acids to fulvic acids carbon ratio was 1.61. In the depleting crop rotations, after the application of manure, the value of this ratio was higher compared to treatments without this fertilizer, equaling 1.52 for the dose of 20 t· ha−1 and 1.41 for the manure dose of 40 t ·ha−1—FYM = 0 t ha−1. In the enriching crop rotations, the ratio was higher compared to the treatment without manure only after the application of the dose of 20 t·ha−1 —it amounted to 1.78 and for the treatment FYM = 0 t· ha−1—1.58, respectively.. This could be explained by the higher input of fresh organic matter in the crop rotation with grass- clover mixture and mustard as green manure [5,34]. Crop rotation A in which cereal crops predominate, has less post-harvest residues in soil, which translated into a lower value of this ratio. Legumes in pure sowing or in mixtures increase organic matter content in soil [7,19]. This is a consequence of chemical composition of organic material. Cereals straw contains more lignin, while and legumes more cellulose and nitrogen. Thus, the mineralization process of legumes residues occurs faster and the C:N ratio is narrower as compared to other crops [43]. The HA:FA ratio indicates also the direction of organic matter transformation in soil [44]. It is widely described that fertile soils are characterized by higher humus content and HA:FA ratio is >1. The literature on the subject indicates that on the agricultural lands, soil humus properties are mostly determined by post- harvest residue left on the field after the harvest of crops [1,3,11,44]. The HA:FA index with values < 1 is typical for soils with a predominant process of mineralization. Intensive agricultural systems deteriorate soil quality and fertility by diminishing the levels of soil organic matter. In the described experiment, the selection of plant species for crop rotation was recognized as crucial for this parameter. The humus value under crop rotation B included crops enriching the soil with organic matter—leading to a much higher HA:FA ratio—was different than in the soil from crop rotation A. (Figure 7). The results obtained indicate that mineralization prevailed in crop rotation B, which is related to the lower percentage of stable forms of organic matter—the humin carbon fraction. It should be mentioned that in the B rotation a lower soil pH was obtained compared to crop rotation A and a higher pH was obtained following the cultivation of mustard (Figure 2). A large supply of fresh organic matter in this crop rotation under conditions of higher soil pH increases the mineralization process and does not favor the accumulation of permanent humus. According to Guimarães et al. [1] evaluating the SOM disproportion ratio as an indicator of soil quality requires care, because a high stratification ratio does not always reflect its good quality. Another researcher indicates that high SOM stratification ratios are expected to indicate relatively undisturbed soil with good water infiltration capacity, aggregate stability, microbial activity, and nutrient supply [36]. In crop rotation B, the soil had high SOM stratification ratios, however, the percentage of permanent humus was low. Much lower soil pH in this crop rotation reduced the rate of decomposition of the large part of fresh organic matter. The soil in crop rotation B showed high HA/FA ratio, but, the percentage of permanent humus (H) was low. Much lower soil pH in this crop rotation reduced the rate of decomposition of a large amount of fresh organic matter.
The role of mineral nitrogen fertilization remains unclear. Several authors have described that application of high amounts of mineral fertilizers might accelerate mineralization process and, therefore, reduce the amount of organic carbon [4,7,15,32]. Other authors [35,36] propose that prolonged application of mineral N fertilizers on loess and brown soils may cause a decrease of carbon content in soil about 21% compared with soils not supplied with mineral fertilizers. Numerous papers indicate that the combined application of manure and mineral nitrogen fertilizers enhances the mineralization process of humus [23,29,36]. However, there exists a strong consensus on the literature that mineral nitrogen has a beneficial effect for humus stabilization [23]. According to Kaiser and Kalbitzb [39], deposit of manure fertilizer could enhance soil microbial biomass, which indicated an increasing soil carbon output. It is noteworthy that microbial communities invest a greater amount of carbon sources into biomass growth than on metabolic activities under manure fertilization [5,38]. Microbial-derived smaller organic matter resulted in forming of soil organo-mineral complexes, which further physically protected SOC from decomposing. Probably, soil microbial organisms after manure fertilization would help to immobilize more carbon into soil instead of mineralizing it and loss to the atmosphere [45]. In our research the significant interaction of crop rotation and inorganic fertilizer on HA/FA ratio was confirmed (Figure 1). It was a result of a lower FA/HA ratio in cereal crop rotations A. More FA than HA indicates low humification rate (rotation B) so, HA/FA ratios can be regarded as a determinant of the development of soil organic horizons and the abundance and rate of humus accumulation [1].
3.4. The Degree of Humification (DH) Index
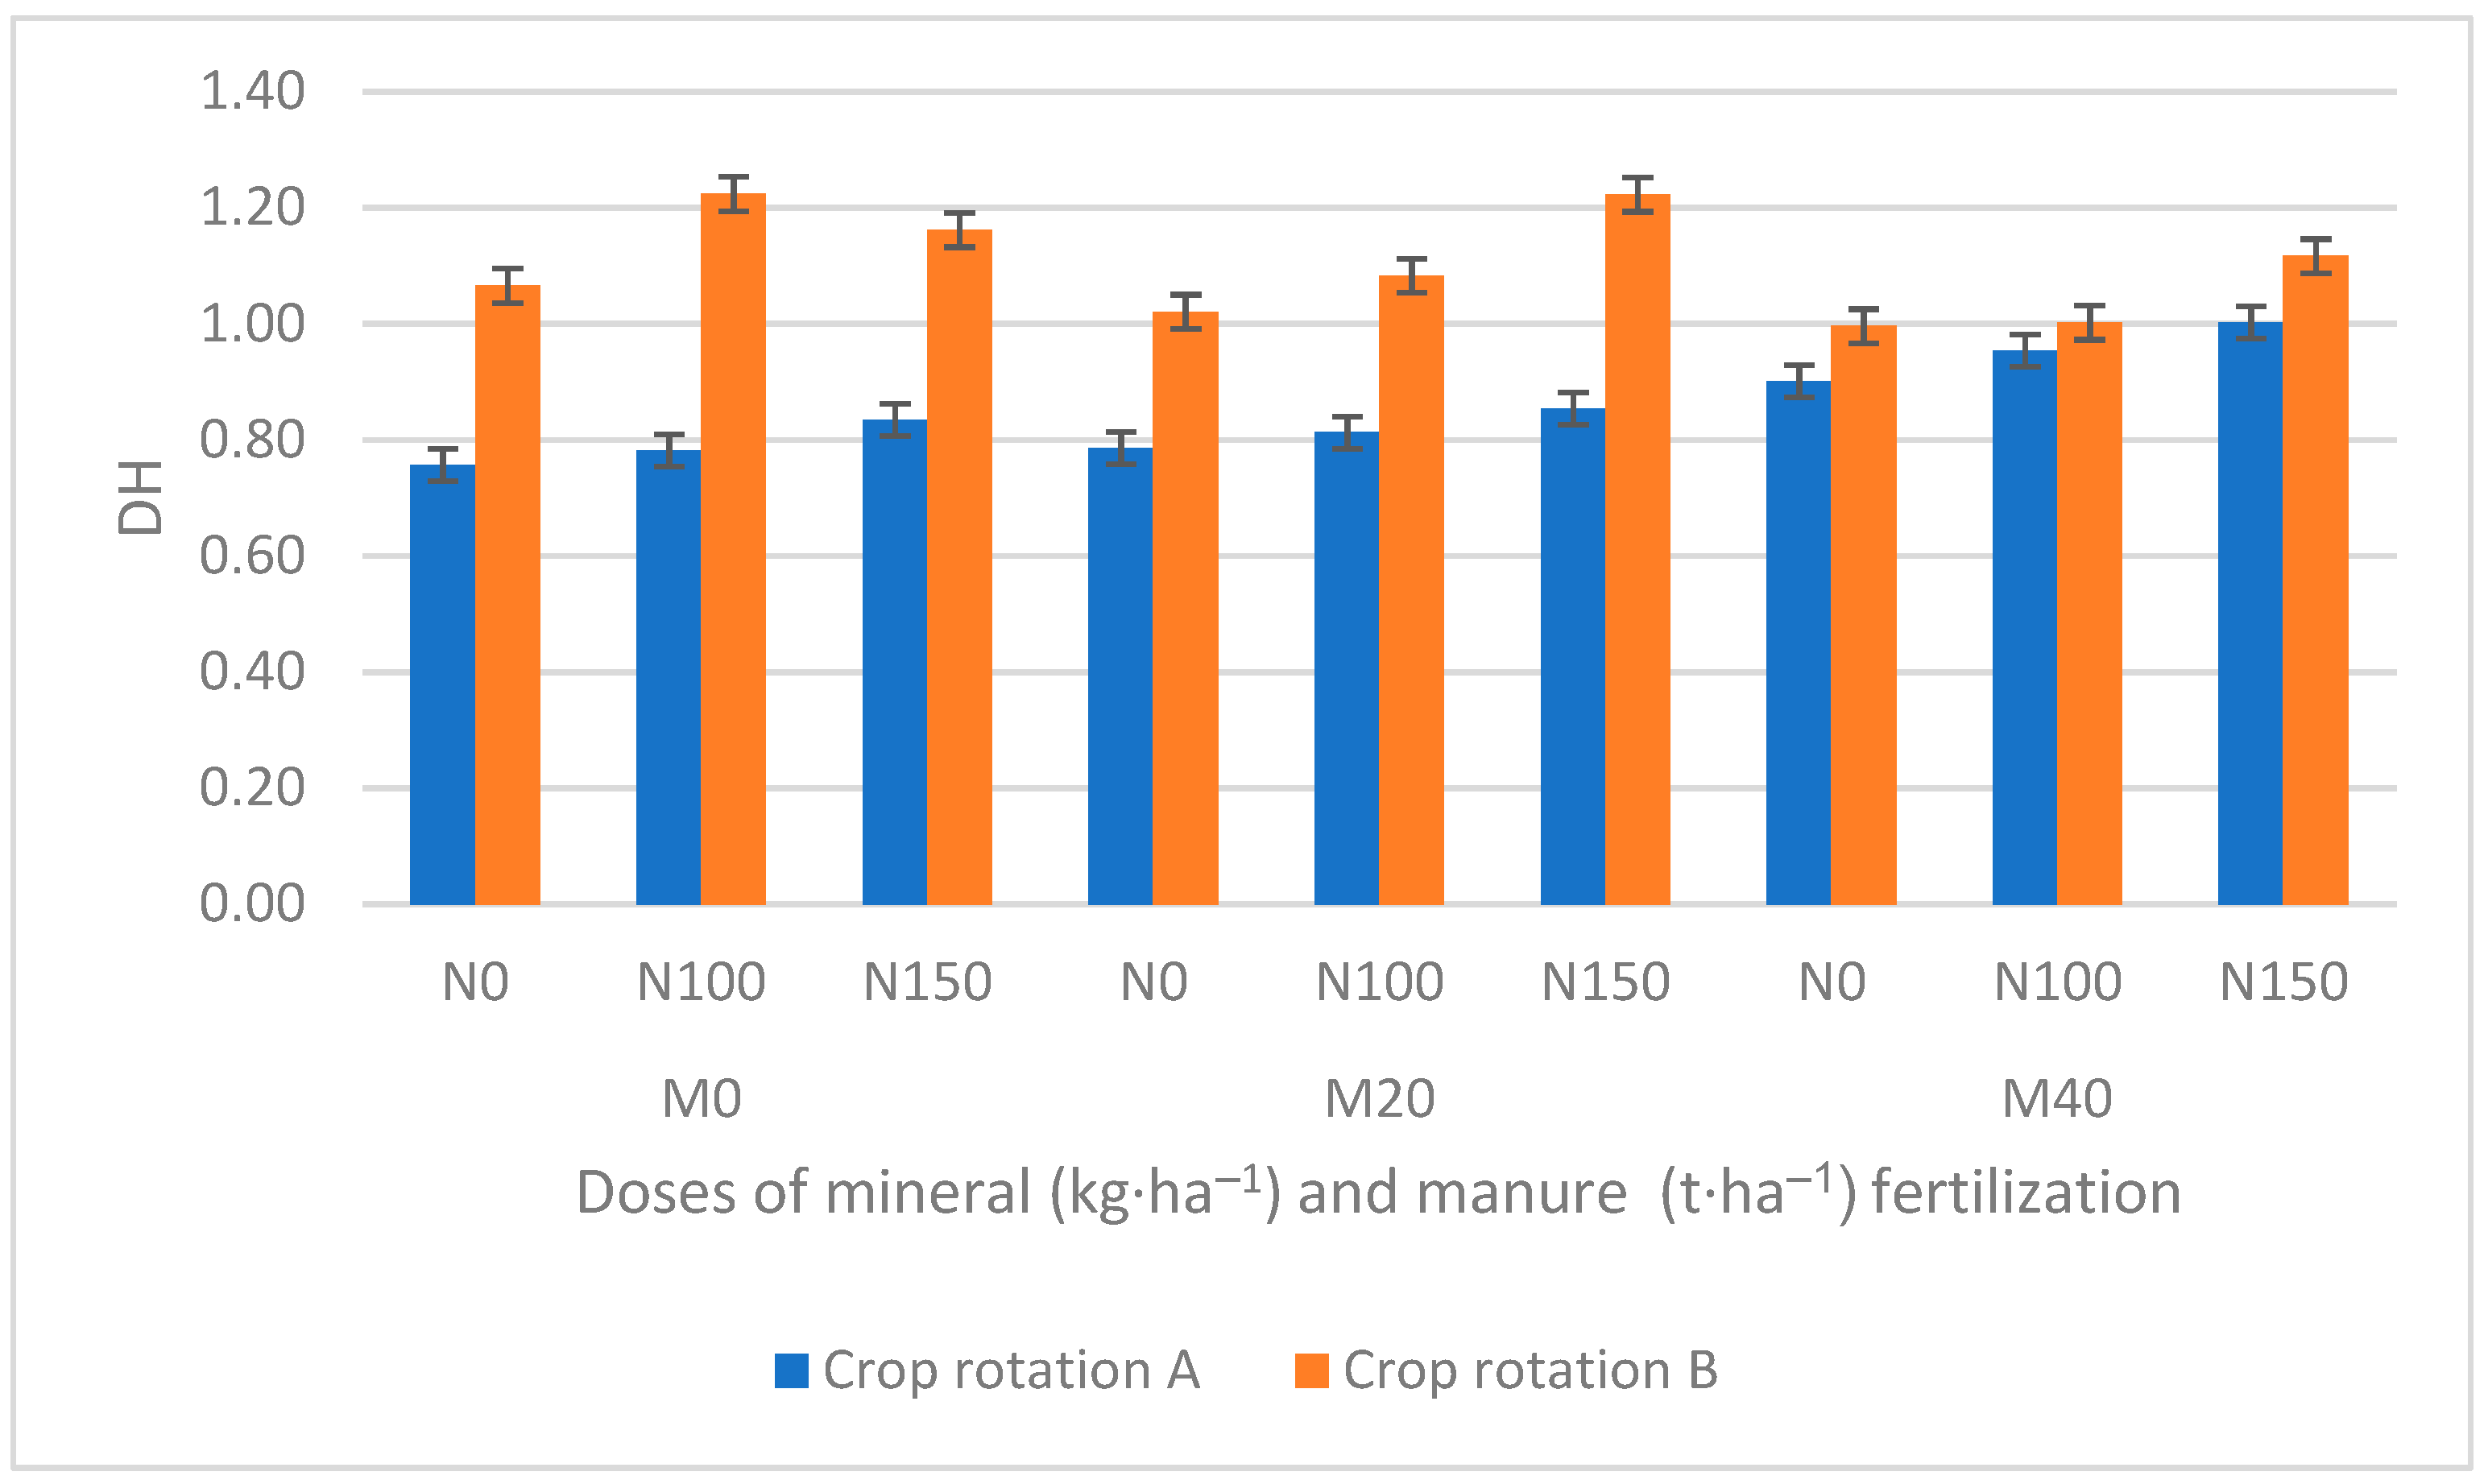
Several indexes can be used to describe the intensity of humic substances transformation in soils. The humification intensity of organic matter can also be determined by the degree of humification (DH) index [46]. This parameter is a measure of the proportion of humic components that form labile compounds with relatively rapid rate of transformation in soil, which are easily used as substrates by soil microorganisms. A low DH level may be related to a strong interaction between MOG and the mineral part of the soil, resulting in high stability of soil organic matter in the more stable humic fractions [46]. According to Liu [47] a high DH index indicates a relatively fertile soil with good capacity of water infiltration, aggregate stability, microbial activity and abundance of nutrients [1]. All three factors of crop rotation, manure application, and inorganic N fertilizer affected the value of this ratio and the interactions between them were proven. (Figure 8). Lower values of the DH were obtained in crop rotation A (overall mean 0.85) while in crop rotation B the degree of humification reached the value −1.10). In crop rotation A, values of this parameter were higher after manure fertilizer application compared with untreated plots. The DH values in the case of plots without manure at crop rotation A ranged from 0.79 in the N-0 treatment to 0.82 and 0.95 when 20 t·ha−1 and 40 t·ha−1 of FYM were applied, respectively. The DH values in the unmanured plots of crop rotation B had lower values, which were 1.11 and 1.04 for FYM-20 and 40 t·ha−1, respectively (Figure 8). Manure application affected the degree of humification regardless of crop rotation, but in crop rotation A the values of this index were lower in the case of plots without manure. The DH values in the case of plots with manure of crop rotation A ranged from 0.76 in the N-0 treatment to 0.78 and 8.3 when 100 kg·ha−1 and 150 kg·ha−1 of N were applied, respectively. The DH index in crop rotation B indicates the potential higher mobility of carbon in the soil system compared to soil under crop rotation A (the stable SOM as well as higher intensity of organic matter humification associated with better transformation of fresh organic matter into stable soil organic matter forms [1].
4. Conclusions
Research results showed that manure applied regularly to light soil has different effects on the accumulation and composition of humus compounds depending on the plant selected to cultivation in the crop rotation. The manure application together with mineral fertilizers stabilizes the organic carbon content in the soil and creates favorable conditions for more crop residues to remain in the soil. However, when large amounts of fresh organic matter are added to the soil, the accumulation of stable forms of humus is not promoted. Furthermore, lower soil pH in such crop rotation has a negative effect on the percentage composition of humus compounds in the soil (i.e. in this condition, the humic acids fraction decreases and the content of fulvic acids increases). Long-term maintenance of light soils without liming treatments may consequently reduce the quality of soil organic matter and lead to mineralization of the solid humus fraction. This study shows that organic matter from manure is more difficult to decompose in soils with lower pH, as well as with an inflow of post-harvest residues of legumes and mustard. This high amount of organic matter from these plants may hinder its transformation into permanent humus. These results, presented after almost 40 years of experimentation, confirm the positive effect of organic fertilization and crop rotations, including legume—grass mixtures, on SOM reproduction in light soils.
Supplementary Materials
The following supporting information can be downloaded at: https://0-www-mdpi-com.brum.beds.ac.uk/article/10.3390/agronomy12102385/s1, Table S1: SOC, CD, HA,FA, H, HA/FA, DH contents in in the topsoil layer (0–30 cm) as influenced by crop rotation, manure application and inorganic N rate in the long-term field experiment at Grabow, Poland; Table S2: pH (KCl) contents in in the topsoil layer (0–30 cm) as influenced by crop rotation, manure application and inorganic N rate in the long-term field experiment at Grabow, Poland.
Author Contributions
Conceptualization, D.P.; methodology, D.P.; formal analysis, D.P. and O.C.; investigation, D.P.; data curation, D.P. and O.C.; writing—D.P.; original draft preparation, D.P.; writing—review and editing, D.P.; visualization, D.P. All authors have read and agreed to the published version of the manuscript.
Funding
This work was supported by the Task 2.05 of the subvention for maintenance of research potential financed by the Ministry of Education and Science.
Institutional Review Board Statement
Not applicable.
Informed Consent Statement
Own research.
Data Availability Statement
Own research and data.
Conflicts of Interest
The authors declare no conflict of interest. The funders had no role in the design of the study; in the collection, analyses or interpretation of data; in the writing of the manuscript or in the decision to publish the results.
References
- Guimarães, D.V.; Gonzaga, M.I.S.; da Silva, T.O.; da Silva, T.L.; Dias, N.D.S.; Matias, M.I.S. Soil organic matter pools and carbon fractions in soil under different land uses. Soil Tillage Res. 2013, 126, 177–182. [Google Scholar] [CrossRef] [Green Version]
- Paul, E.A.; Collins, H.P.; Leavitt, S.W. Dynamics of resistant soil carbon of Midwestern agricultural soils measured by naturally-occurring 14C abundance. Geoderma 2001, 104, 239–256. [Google Scholar] [CrossRef]
- Orlov, D.S. Humus Acids of Soils; A.A. Balkema: Rotterdam, The Netherlands, 1985. [Google Scholar]
- Jaskulska, I.; Jaskulski, D. Influence of many years’fertilization on the dynamics of soil properties. Adv. Agric. Sci. 2003, 4, 21–31. [Google Scholar]
- VDLUFA; Körschens, M. Humusbilanzierung. Methode zur Beurteilung und Bemessung der Humusversorgung von Ackerland. Standpunkt VDLUFA, Bonn, 2004. Humusbilanzierung Eine Methode zur Analyse und Bewertung der Humusversorgung von Ackerland. Available online: https://www.vdlufa.de/download/Humus/Standpunkt_Humusbilanzierung.pdf (accessed on 7 March 2014).
- Körschens, M. Importance of Soil Organic Matter (SOM) for Biomass Production and Environment (a review). Arch. Agron. Soil Sci. 2002, 48, 89–94. [Google Scholar] [CrossRef]
- Mockeviciene, I.; Repsiene, R.; Amaleviciute-Volunge, K.; Karcauskiene, D.; Slepetiene, A.; Lepane, V. Effect of long-term application of organic fertilizers on improving organic matter quality in acid soil. Arch. Agron. Soil Sci. 2022, 68, 1192–1204. [Google Scholar] [CrossRef]
- Maćkowiak, C. The effect of plant selection in the crop rotation, manure and mineral fertilizers on the organic carbon content in the soil and the productivity of the rotations. Fertil. Fertil. 2000, 4, 91–102. (In Polish) [Google Scholar]
- Pikuła, D.; Rutkowska, A. Effect of leguminous crop and fertilization on soil organic carbon in 30-years field experiment. Plant Soil Environ. 2014, 60, 507–511. [Google Scholar] [CrossRef]
- Mercik, S.; Stępień, W.; Lenart, S. Soil fertility in three fertilization languages: Mineral, organic and organic−mineral−in long-term experiment. Part I.24. Physical and physicochemical properties of soils. Folia Pomeranae Universitatis Technologiae Stetinensis, 11. Agricultue 2000, 84, 311–316, (In Polish with English abstract). [Google Scholar]
- Garbuio, F.J.; Jones, D.L.; Alleoni, L.R.; Murphy, D.V.; Caires, E.F. Carbon and nitrogen dynamics in an Oxisol as affected by liming and crop residues under no-till. Soil Biol. Biochem. Soil Sci. Soc. Am. 2011, 75, 1723–1730. [Google Scholar] [CrossRef]
- Montauliak, G. On the characterisation of soil organic matter in Central German arable soil (Zur Charakterisierung der organischen Bodensubstanz in mitteldeutschen Ackerboden). Poczwowiedien 1960, 3. Available online: https://0-scholar-google-com.brum.beds.ac.uk/scholar?hl=zh-CN&as_sdt=0%2C5&q=Zur+Charakterisierung+der+organischen+Bodensubstanz+in+mitteldeutschen+Ackerboden%29.+&btnG= (accessed on 11 July 2022).
- Mercik, S.; Stępień, W.; Gębski, M. Plant yields and some chemical properties of soils in 75-year fertilizer experiments in Skierniewice. Adv. Agric. Sci. Probl. Issues 1999, 465, 39–49. [Google Scholar]
- Łabza, T. Organic carbon content of loess soils under crop-livestock management conditions. Adv. Agric. Sci. Probl. Issues 1999, 421, 261–266. [Google Scholar]
- Łabętowicz, J.; Korc, M.; Szulc, W. Accumulation of soil organic matter under the influence of mineral fertilization on light soil. Sci. J. Agric. Acad. Szczec. 172 Rol. 1996, 62, 296–303. [Google Scholar]
- Łakomieć, I. Effect of many-years fertilizer treatment on the compositions of humus compounds in podzols. Soil Sci. Ann. 1996, 16, 131–155. [Google Scholar]
- Wojnowska, T.; Sienkiewicz, S.; Wojtas, A. Dynamics of CO2 release from soil depending on manure and NPK fertilization and the crops grown. Adv. Agric. Sci. Probl. Issues 1993, 411, 101–106. [Google Scholar]
- Haynes, R.J.; Naidu, R. Infuence of lime, fertilizer and manure application on soil organic matter content and soil physical conditions: A review. Nutr. Cycl. Agroecosyst. 1998, 51, 123–137. [Google Scholar] [CrossRef]
- Rutkowska, A.; Pikuła, D. Effect of crop rotation and nitrogen fertilization on the quality and quantity of soil organic matter. In Soil Processes and Current Trends in Quality Assessment; Hernandez Soriano, M.C., Ed.; InTech: London, UK, 2013; pp. 249–268. ISBN 978-953-51-1029-3. [Google Scholar]
- Tejada, M.; Gonzalez, J.L.; Garcia-Martinez, A.M.; Parrado, J. Application of a green manure and green manure composted with beet vinasse on soil restoration: Effects on soil properties. Bioresour. Technol. 2008, 99, 4949–4957. [Google Scholar] [CrossRef]
- Smoliński, S.; Kotwica, K.; Jaskulski, D.; Tomalak, S. Effect of stubble crop on soil microbial activity. Changes in the abundance of bacteria involved in C and N transformations. Mat. conf. scient. Microbes in the environment. Occur. Act. Signif. 1997, 625–630. Available online: https://yadda.icm.edu.pl/yadda/element/bwmeta1.element.agro-article-412928aa-5139-48c8-b29d-1e9ae1943068/c/000010200700006000010004500056.pdf (accessed on 11 July 2022).
- Xu, R.K.; Coventry, D.R. Soil pH changes associated with lupin and wheat plant materials incorporated in a red-brown earth soil. Plant Soil 2003, 250, 113–119. [Google Scholar] [CrossRef]
- Gonet, S.S. Properties of Humic Acids of Soils with Diversified Fertilization, Dissertations 33; Technical and Agricultural Academy of Bydgoszcz: Bydgoszcz, Poland, 1989; p. 55. [Google Scholar]
- Dziadowiec, H.; Gonet, S.S. Methodological Guide to Soil Organic Matter Surveys. Proc. Sci. Comm. PTG 1999, 120, 42–43. [Google Scholar]
- IUSS Working Group WRB. World Reference Base for Soil Resources 2014. In International Soil Classification System for Naming Soils and Creating Legends for Soil Maps, 3rd ed.; FAO: Rome, Italy, 2014; ISBN 978-92-5-108370-3. Available online: https://0-scholar-google-com.brum.beds.ac.uk/scholar?hl=zh-CN&as_sdt=0%2C5&q=World+Reference+Base+for+Soil+Resources+2014.+International+soil+classification+system+for+naming+soils+and+creating+legends+for+soil+maps&btnG= (accessed on 11 July 2022).
- Council Directive 91/676/EEC of 12 December 1991 Concerning the Protection of Waters against Pollution Caused by Nitrates from Agricultural Sources. Available online: https://www.eea.europa.eu/policy-documents/council-directive-91-676-eec (accessed on 12 December 1991).
- Stefanescu, M. Researches regarding the influence of manure in wheat-maize rotation. Biol. Biodiversitate Timis. 2002, 243. [Google Scholar]
- Gonet, S.S.; Wegner, K. Influence of fertilization on soil humus. Sci. J. Agric. Univ. Wroc. Agric. 1990, 53, 127–135. [Google Scholar]
- Adamus, M.; Drozd, J.; Stanisławska, E. Effect of varying organic and mineral fertilisation on some elements of soil fertility. Soil. Sci. Ann. 1989, 40, 101–110. [Google Scholar]
- Körschens, M.; Erhard, A.; Armbruster, M.; Barkusky, D.; Baumecker, M.; Behle-Schalk, L.; Bischoff, R.; Čergan, Z.; Ellmer, F.; Herbst, F.; et al. Effect of mineral and organic fertilization on crop yield, nitrogen uptake, carbon and nitrogen balances, as well as soil organic carbon content and dynamics: Results from 20 European long-term field experiments of the twenty-first century. Arch. Agron. Soil Sci. 2013, 59, 1–24. [Google Scholar] [CrossRef]
- Bruni, E.; Guenet, B.; Huang, Y.; Clivot, H.; Virto, I.; Farina, R.; Kätterer, T.; Ciai, P.; Martin, M.; Chenu, C. Additional carbon inputs to reach a 4 per 1000 objective in Europe: Feasibility and projected impacts of climate change based on Century simulations of long-term arable experiments. BG 2021, 18, 3981–4004. [Google Scholar] [CrossRef]
- Trawczyński, C. Balance of nitrogen, phosphorus and potassium in the second cycle of crop rotation in organic production system on the sandy soil. Fragm. Agron. 2015, 32, 87–96. [Google Scholar]
- Martyniuk, S.; Pikuła, D.; Kozieł, M. Soil properties and productivity in two long-term crop rotations differing with respect to organic matter management on an Albic Luvisol. Sci. Rep. 2019, 9, 1878. [Google Scholar] [CrossRef] [PubMed] [Green Version]
- Łoginov, W.; Andrzejewski, J.; Janowiak, J. The role of organic fertilization in maintaining soil organic matter resources. Soil Sci. Ann. 1991, 42, 19–25. [Google Scholar]
- Panak, H.; Nowak, G. Effect of intensive mineral fertilization on the decomposition of soil organic matter. Soil Sci. Ann. 1989, 40, 39–52. [Google Scholar]
- Wiśniewski, W.; Gonet, S.S. The effect of fertilization with mineral nitrogen and manure on the fractional composition of organic soil matter, the state of humus in the soil in long-term static fertilization experiments. Pamięt. Puławski–Puławski’s Diary 1986, 87, 19–29. [Google Scholar]
- Cambardella, C.E.; Gajda, A.M.; Doran, J.W.; Wienhold, B.J.; Kettler, T.A. Estimation of particulate and total organic matter by weight-loss-on ignition. In Assessment Methods for Soil Carbon; Lal, R., Kimble, J.F., Follet, R.F., Stewart, B.A., Eds.; CRC Press: Boca Raton, FL, USA, 2001; pp. 349–359. [Google Scholar]
- Strosser, E. Methods for determination of labile soil organic matter: An overview. J. Agrobiol. 2010, 27, 49–60. [Google Scholar] [CrossRef]
- Kaiser, K.; Kalbitzb, K. Cycling downwards—dissolved organic matter in soils. Soil Biol. Biochem. 2012, 52, 29–32. [Google Scholar] [CrossRef]
- Suwara, I.; Gawrońska-Kulesza, A.; Kuszelewski, L. Influence of manure fertilization and liming on selected soil physical properties. Sci. J. Agric. Acad. 1996, 62, 491–495. [Google Scholar]
- Sollins, F.; Homann, P.; Caldwell, B.A. Stabilization and destabilization of soil organic matter: Mechanisms and controls. Geoderma 1996, 74, 65–105. [Google Scholar] [CrossRef]
- Lal, R. Tillage effects on soil degradation, soil resilience, soil quality, and sustainability. Soil Tillage Res. 1993, 27, 1–8. [Google Scholar] [CrossRef]
- Gonet, S.S.; Dębska, B. Properties of humic acids producted during decomposition of plant residues in soil. Rostl. Vyroba 1999, 45, 455–460. [Google Scholar]
- Franzluebbers, A.J. Soil organic matter stratification ratio as an indicator of soil quality. Rostl. Vyroba Res. 2002, 66, 95–106. [Google Scholar] [CrossRef]
- Muñoz, C.; Paulino, L.; Monreal, C.; Erick, Z. Greenhouse gas (CO2 and N2O) emissions from soils: A review. Chil. J. Agr. Res. 2010, 70, 485–497. [Google Scholar] [CrossRef] [Green Version]
- Ukalska-Jaruga, A.; Smreczak, B.; Strzelecka, J. Influence of organic matter on the quality of agriculturally used soils. Stud. Rep. IUNG-PIB 2017, 54, 25–39. (In Polish) [Google Scholar] [CrossRef]
- Liu, H. Relationship between organic matter humification and bioavailability of sludge-borne copper and calcium during long-term sludge amendment to soil. Sci. Total Environ. 2016, 566, 8–14. [Google Scholar] [CrossRef]
Figure 1.
Soil organic carbon (SOC) contents in in the topsoil layer (0–30 cm) as influenced by crop rotation (I), manure application (II) and inorganic N rate (III) in the long-term field experiment at Grabow, Poland. Error bars denote standard deviations (n = 3). LSD (p ≤ 0.05): for I = 0.023, II = 0.016, III = 0.015, Interactions: II/I = n.s., I/II = n.s., III/I = 0.021, I/III = 0.027, III/II = 0.025,II/III = 0.026.

Figure 2.
Soil pH (KCl) contents in in the topsoil layer (0–30 cm) as influenced by crop rotation (I), manure application (II) and inorganic N rate (III) in the long-term field experiment at Grabow, Poland. Error bars denote standard deviations (n = 3). LSD (p ≤ 0.05): for I = 0.076, II = 0.135, III = n.s., II/I = 0.191, I/II = 0.172, III/I = 0.075, I/III = 0.094, III/II = 0.092, II/III = 0.155.

Figure 3.
Humic acids (HA) contents in in the topsoil layer (0–30 cm) as influenced by crop rotation (I), manure application (III) and mineral N rate (III) in the long-term field experiment at Grabow, Poland. Error bars denote standard deviations (n = 3). LSD (p ≤ 0.05): for I = 0.318, II = 0.509, III 0.459, II/I = 0.720, I/II = 0.661, III/I = 0.650, I/III = 0.606, III/II = 0.796, II/III = 0.824.

Figure 4.
Fulvic acids (FA) contents in in the topsoil layer (0–30 cm) as influenced by crop rotation (I) manure application (III) and inorganic N rate (III) in the long-term field experiment at Grabow, Poland. Error bars denote standard deviations (n = 3). LSD (p ≤ 0.05): for I = 0.992, II = 0.448, III = 0.412, II/I = 0.634, I/II = 1.100, III/I = n.s., I/III = n.s., III/II = 0.713, II/III = 0.733.

Figure 5.
Humins (H) contents in in the topsoil layer (0–30 cm) as influenced by crop rotation (I), manure application (II) and inorganic N rate (III) in the long-term field experiment at Grabow, Poland. Error bars denote standard deviations (n = 3). LSD (p ≤ 0.05): for I = 3.261, II = 2.623, III = 1.017, II/I = 3.710, I/II = 4.361, III/I = n.s., I/III = n.s., III/II = n.s., II/III = n.s.

Figure 6.
Carbon in extracts after soil decalcification (CD) contents in in the topsoil layer (0–30 cm) as influenced by crop rotation (I), manure application (II) and inorganic N rate (III) in the long-term field experiment at Grabow, Poland. Error bars denote standard deviations (n = 3). LSD (p ≤ 0.05): for I = 0.088, II = 0.07. C = n.s., II/I = 0.104, I/II = 0.120, III/I = 0.087, I/III = 0.109, III/II = 0.106, II/III = 0.113.

Figure 7.
HA/FA ratio contents in in the topsoil layer (0–30 cm) as influenced by crop rotation (I), manure application (II) and inorganic N rate (III) in the long-term field experiment at Grabow, Poland. Error bars denote standard deviations (n = 3). LSD (p ≤ 0.05): for I = 0.051, II = 0.047, III = n.s., II/I = 0.067, I/II = 0.073,III/I = 0.055, I/III = 0.065, III/II = n.s., II/III = n.s.

Figure 8.
The degree of humification (DH) index as influenced by crop rotation, manure application and inorganic N rate in the long-term field experiment at Grabow, Poland. Error bars denote standard deviations (n = 3). LSD (p ≤ 0.05): for I = 0.021, II = 0.023, III = 0.015, II/I = 0.032, I/II = 0.033, III/I = 0.021, I/III = 0.026, III/II = 0.026, II/III = 0.031.


Table 1.
Mineral fertilization for crop rotation A and B.
| Crop Rotation | Crops | Mineral Fertilization [kg·ha−1] | |||||
|---|---|---|---|---|---|---|---|
| N0 | N1 | N2 | N3 | P | K | ||
| A | Grain maize | 0 | 50 | 100 | 150 | 24 | 133 |
| Winter wheat | 0 | 50 | 100 | 150 | 24 | 83 | |
| Spring barley | 0 | 30 | 60 | 90 | 24 | 71 | |
| Maize for silage | 0 | 50 | 100 | 150 | 24 | 100 | |
| B | Grain maize | 0 | 50 | 100 | 150 | 24 | 133 |
| Winter wheat | 0 | 50 | 100 | 150 | 24 | 83 | |
| Spring barley | 0 | 30 | 60 | 90 | 24 | 71 | |
| Clover—grass mixture | 0 | 50 | 100 | 150 | 24 | 96 | |
Publisher’s Note: MDPI stays neutral with regard to jurisdictional claims in published maps and institutional affiliations. |
© 2022 by the authors. Licensee MDPI, Basel, Switzerland. This article is an open access article distributed under the terms and conditions of the Creative Commons Attribution (CC BY) license (https://creativecommons.org/licenses/by/4.0/).
Share and Cite
MDPI and ACS Style
Pikuła, D.; Ciotucha, O. The Composition of the Organic Matter Fractions of Loamy Sand after Long-Term FYM Application without Liming. Agronomy 2022, 12, 2385. https://0-doi-org.brum.beds.ac.uk/10.3390/agronomy12102385
AMA Style
Pikuła D, Ciotucha O. The Composition of the Organic Matter Fractions of Loamy Sand after Long-Term FYM Application without Liming. Agronomy. 2022; 12(10):2385. https://0-doi-org.brum.beds.ac.uk/10.3390/agronomy12102385
Chicago/Turabian StylePikuła, Dorota, and Olga Ciotucha. 2022. "The Composition of the Organic Matter Fractions of Loamy Sand after Long-Term FYM Application without Liming" Agronomy 12, no. 10: 2385. https://0-doi-org.brum.beds.ac.uk/10.3390/agronomy12102385
Note that from the first issue of 2016, this journal uses article numbers instead of page numbers. See further details here.