

Differences in the Concentration of Micronutrients in Young Shoots of Numerous Cultivars of Wheat, Maize and Oilseed Rape


Abstract
:1. Introduction
2. Materials and Methods
2.1. Sample Collection
2.2. Soil and Climate Characteristic
2.3. Chemical Analysis
2.4. Statistical Analysis
3. Results
3.1. Average Soil Micronutrient Content
3.2. Average Concentration of Micronutrients in the Shoots of the Studied Species
3.3. Average Concentration of Micronutrients in the Different Cultivars of the Species Tested
3.3.1. Wheat
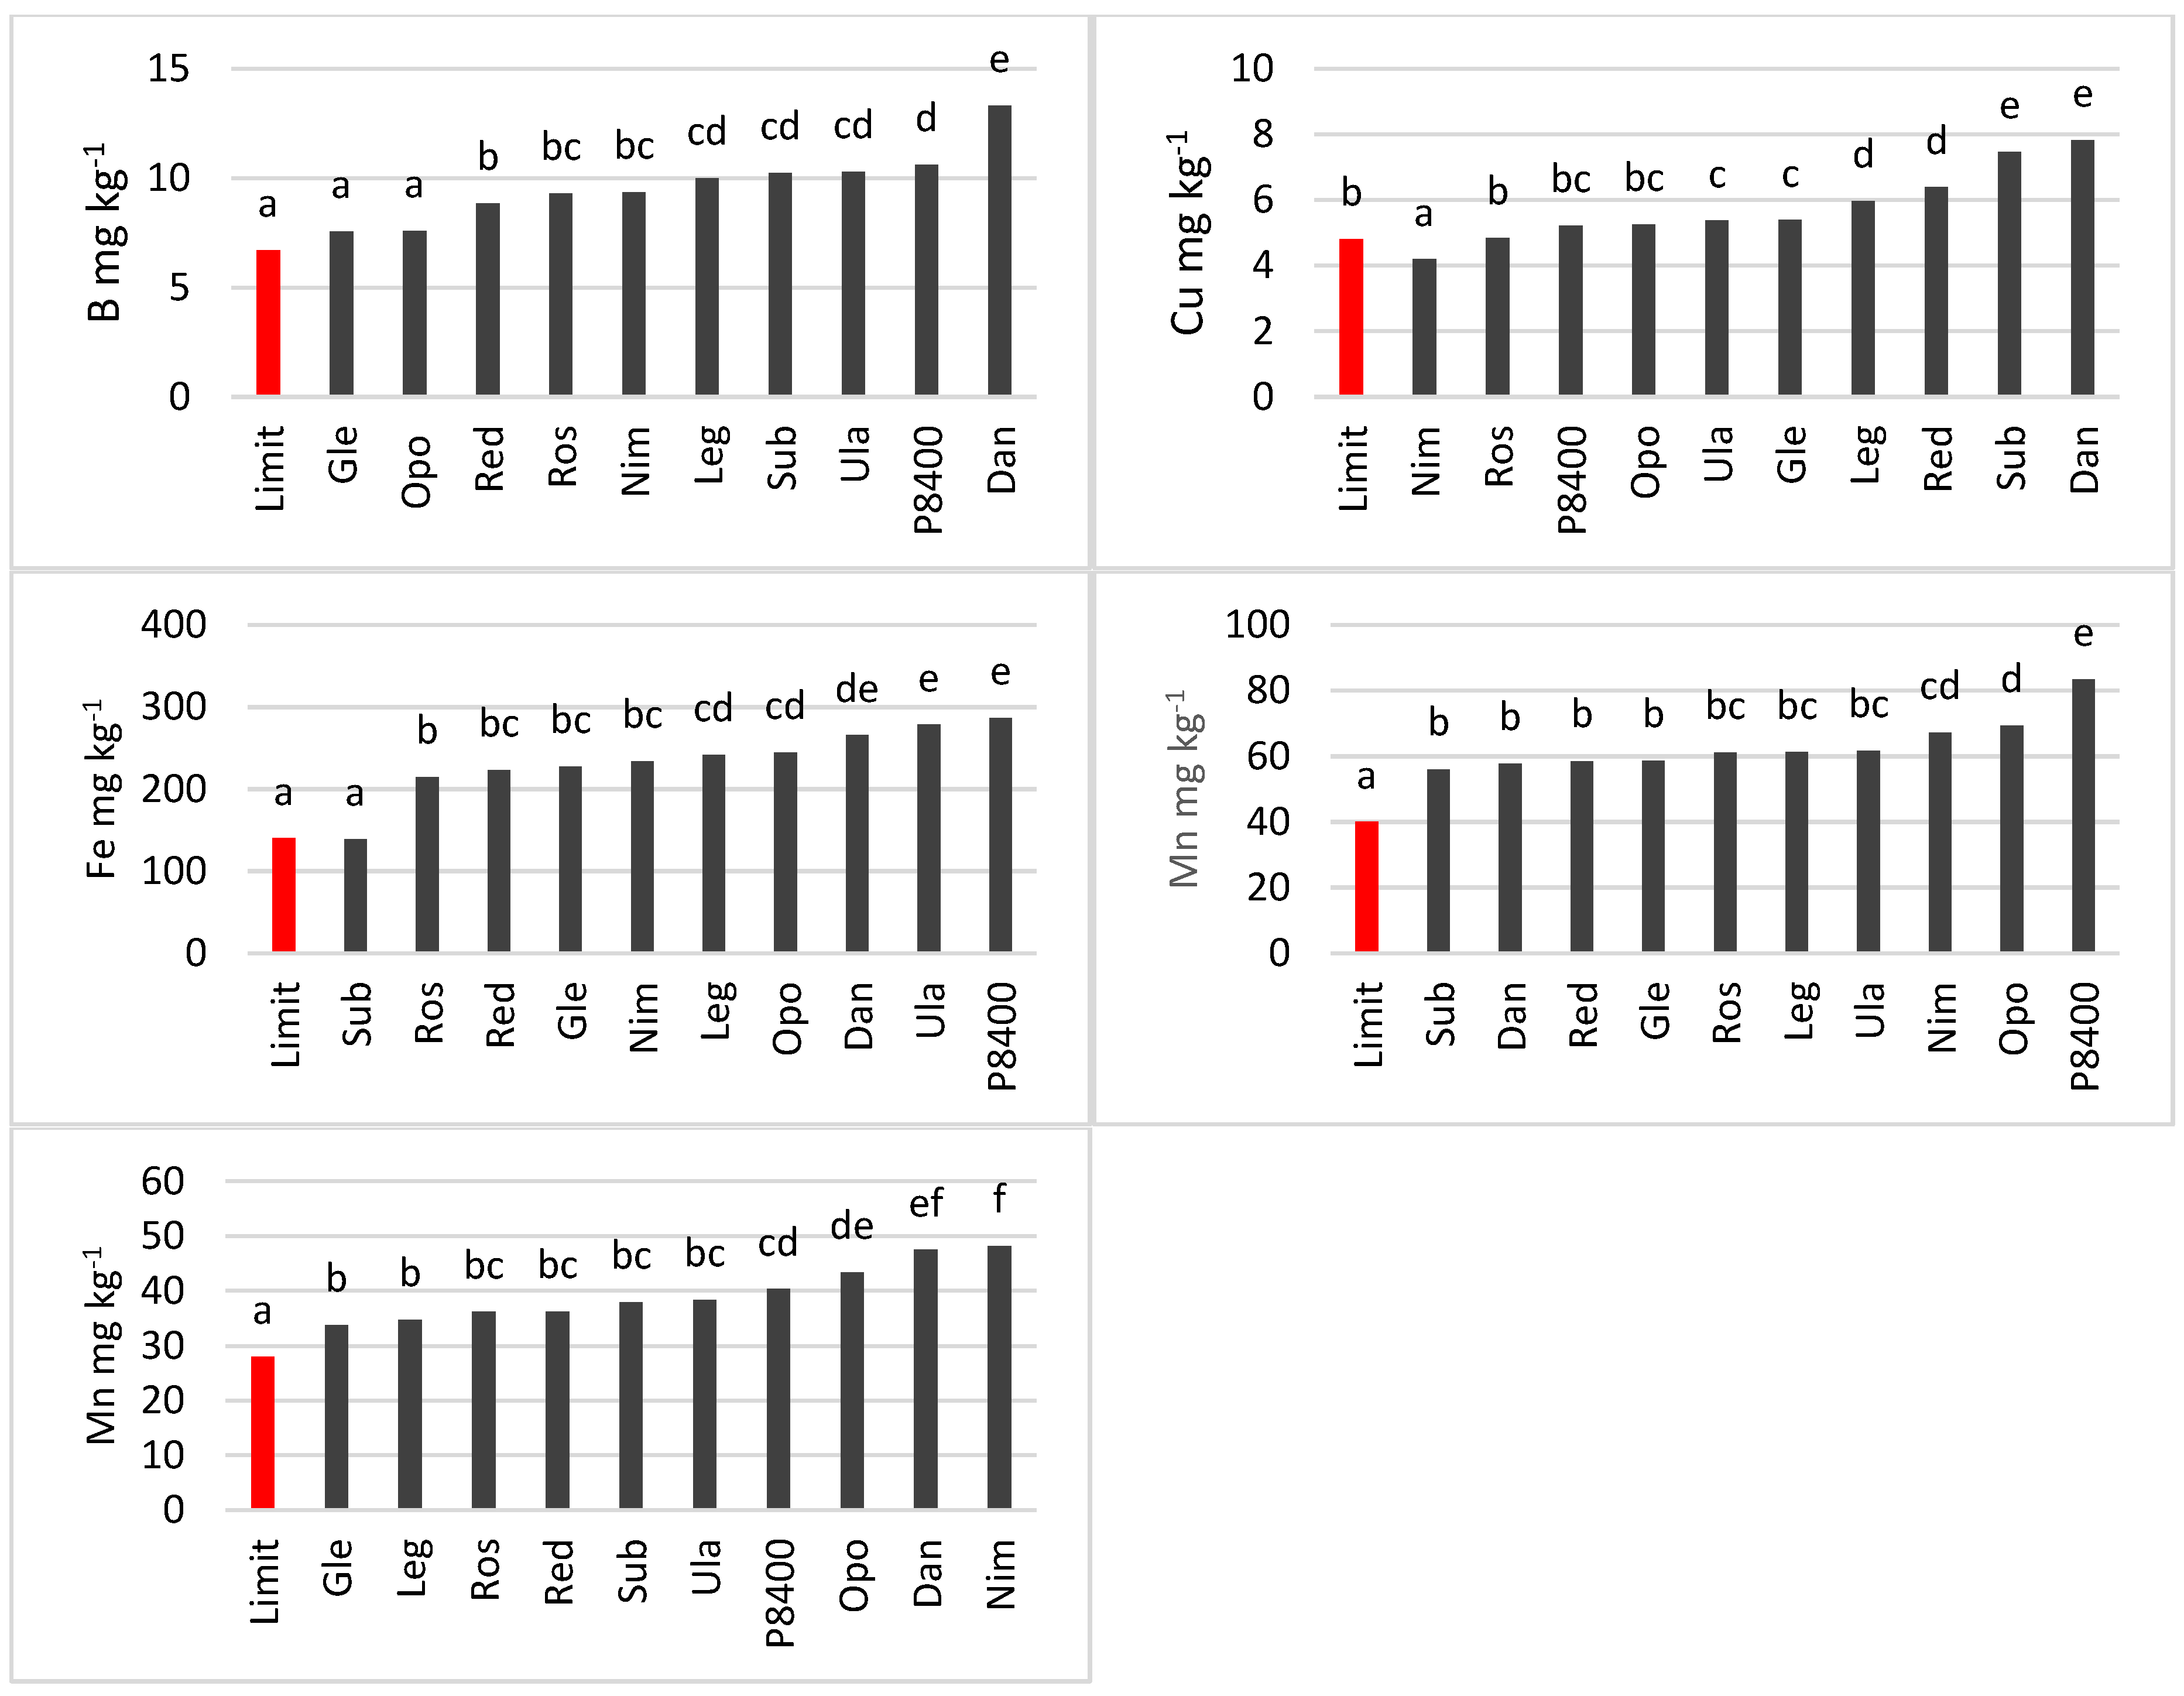
3.3.2. Maize
3.3.3. Oilseed Rape
3.4. Comparison of Cultivar and Species Diversity
4. Discussion
4.1. Soil and Weather Conditions
4.2. Concentration of Micronutrients in the Plant Species Studied
4.3. Differences in Micronutrient Content among Cultivars and Species
5. Conclusions
Author Contributions
Funding
Informed Consent Statement
Data Availability Statement
Acknowledgments
Conflicts of Interest
References
- Bell, R.W.; Dell, B. Micronutrients for Sustainable Food, Feed, Fibre and Bioenergy Production; International Fertilizer Industry Association: Paris, France, 2008; pp. 1–175. [Google Scholar]
- Lowe, N.M. The global challenge of hidden hunger: Perspectives from the field. Proc. Nutr. Soc. 2021, 80, 283–289. [Google Scholar] [CrossRef] [PubMed]
- Morgounov, A.; Gomez-Becerra, H.F.; Abugalieva, A.; Dzhunusova, M.; Yessimbekova, M.; Muminjanov, H.; Zelenskiy, Y.; Ozturk, L.; Cakmak, I. Iron and zinc grain density in common wheat grown in Central Asia. Euphytica 2007, 155, 193–203. [Google Scholar] [CrossRef] [Green Version]
- Lockyer, S.; White, A.; Buttriss, J.L. Biofortified crops for tackling micronutrient deficiencies–what impact are these having in developing countries and could they be of relevance within Europe? Nutr. Bull. 2018, 43, 319–357. [Google Scholar] [CrossRef] [Green Version]
- Ramzan, Y.; Hafeez, M.B.; Khan, S.; Nadeem, M.; Batool, S.; Ahmad, J. Biofortification with zinc and iron improves the grain quality and yield of wheat crop. Int. J. Plant Prod. 2020, 14, 501–510. [Google Scholar] [CrossRef]
- Kenzhebayeva, S.; Abekova, A.; Atabayeva, S.; Yernazarova, G.; Omirbekova, N.; Zhang, G.; Turasheva, S.; Asrandina, S.; Sarsu, F.; Wang, Y. Mutant lines of spring wheat with increased iron, zinc, and micronutrients in grains and enhanced bioavailability for human health. Biomed. Res. Int. 2019, 2019, 1–10. [Google Scholar] [CrossRef] [Green Version]
- Hochmuth, G.; Maynard, D.; Vavrina, C.; Hanlon, E.; Simonne, E. Plant tissue analysis and interpretation for vegetable crops in Florida. In Nutrient Management of Vegetable and Row Crops Handbook; University of Florida press: Gainesville, FL, USA, 2012; pp. 45–92. [Google Scholar]
- Meyer, R.D.; Marcum, D.B.; Orloff, S.B. Understanding micronutrient fertilization in alfalfa. In Proceedings of the Western Alfalfa and Forage Symposium, Sparks, NV, USA, 11–13 December 2002; Available online: https://alfalfa.ucdavis.edu/+symposium/proceedings/2002/02-087.pdf (accessed on 5 October 2022).
- Sarangthem, I.L.; Sharma, D.; Oinam, N.; Punilkumar, L. Evaluation Of Critical Limit Of Zinc In Soil And Plant. Int. J. Curr. Res. Life Sci. 2018, 7, 2584–2586. [Google Scholar]
- Schulte, E.E.; Kelling, K.A. Plant Analysis: A diagnostic Tool; Cooperative Extension Service; Purdue University: West Lafayette, IN, USA, 1991; Available online: https://www.extension.purdue.edu/extmedia/nch/nch-46.html (accessed on 5 October 2022).
- Bergmann, W. Nutritional Disorders of Plants-Development, Visual and Analytical Diagnosis; Gustav Fischer Verlag: Jena, Germany; Stuttgart, Germany; New York, NY, USA, 1992; pp. 343–361. [Google Scholar]
- Jones, J.B.; Wolf, B.; Mills, H.A. Plant Analysis Handbook; Micro-Macro Publishing Inc.: Athens, GA, USA, 1991; pp. 1–213. [Google Scholar]
- Korzeniowska, J.; Stanislawska-Glubiak, E.; Lipinski, W. New limit values of micronutrient deficiency in soil determined using 1 M HCl extractant for wheat and rapeseed. Soil Sci. Annu. 2020, 71, 205–214. [Google Scholar] [CrossRef]
- Maganti, S.; Swaminathan, R.; Parida, A. Variation in iron and zinc content in traditional rice genotypes. Agr. Res. 2020, 9, 316–328. [Google Scholar] [CrossRef]
- Ray, H.; Bett, K.; Tar’an, B.; Vandenberg, A.; Thavarajah, D.; Warkentin, T. Mineral micronutrient content of cultivars of field pea, chickpea, common bean, and lentil grown in Saskatchewan, Canada. Crop. Sci. 2014, 54, 1698–1708. [Google Scholar] [CrossRef]
- Tran, B.T.T.; Cavagnaro, T.R.; Able, J.A.; Watts-Williams, S.J. Bioavailability of zinc and iron in durum wheat: A trade-Off between grain weight and nutrition? Plants People Planet 2021, 3, 627–639. [Google Scholar] [CrossRef]
- Korzeniowska, J. Response of ten winter wheat cultivars to boron foliar application in a temperate climate (South-West Poland). Agron. Res. 2008, 6, 471–476. [Google Scholar]
- Korzeniowska, J.; Stanislawska-Glubiak, E. The effect of foliar application of copper on content of this element in winter wheat grain. Pol. J. Agron. 2011, 4, 3–6. [Google Scholar]
- Genc, Y.; McDonald, G.K.; Graham, R.D. Critical deficiency concentration of zinc in barley genotypes differing in zinc efficiency and its relation to growth responses. J. Plant Nutr. 2002, 25, 545–560. [Google Scholar] [CrossRef]
- Becerra, H.F.G.; Yazici, A.; Ozturk, L.; Budak, H.; Peleg, Z.; Morgounov, A.; Fahima, T.; Saranga, Y.; Cakmak, I. Genetic variation and environmental stability of grain mineral nutrient concentrations in Triticum dicoccoides under five environments. Euphytica 2010, 171, 39–52. [Google Scholar] [CrossRef]
- Statistics Poland (GUS). Land Use and Sown Area in 2019. 2020. Available online: https://stat.gov.pl/obszary-tematyczne/rolnictwo-lesnictwo/rolnictwo/uzytkowanie-gruntow-i-powierzchnia-zasiewow-w-2019-roku,8,15.html (accessed on 5 October 2020).
- Meier, U. Growth Stages of Mono- and Dicotyledonous Plants, BBCH Monograph, 2nd ed.; Blackwell Science: Berlin, Germany, 2001; pp. 1–158. [Google Scholar]
- Kabata-Pendias, A.; Pendias, H. Trace Elements in Soils and Plants; CRC Press: Boca Raton, FL, USA, 2001; pp. 1–413. [Google Scholar]
- Climate of Poland 2020; Institute of Meteorology and Water Management-National Research Institute: Warsaw, Poland, 2021; pp. 1–43. Available online: https://www.imgw.pl/sites/default/files/2021-04/imgw-pib-klimat-polski-2020-opracowanie-final-rozkladowki-min.pdf (accessed on 5 October 2020).
- PN-R 04014:1991; Agrochemical Plant Analyse. Methods of Mineralization of Plant Material for Determination Macro- and Microelements. Polish Committee for Standardization: Warsaw, Poland, 1991. (In Polish)
- Korzeniowska, J.; Stanislawska-Glubiak, E. Comparison of 1 M HCl and Mehlich 3 for assessment of the micronutrient status of polish soils in the context of winter wheat nutritional demands. Commun. Soil Sci. Plan. 2015, 46, 1263–1277. [Google Scholar] [CrossRef]
- Korzeniowska, J.; Stanislawska-Glubiak, E.; Lipinski, W. Development of the limit values of micronutrient deficiency in soil determined using Mehlich 3 extractant for Polish soil conditions. Part, I. Wheat. Soil Sci. Annu. 2019, 70, 314–323. (In Polish) [Google Scholar] [CrossRef]
- Mehlich, A. Mehlich 3 soil test extractant: A modification of Mehlich 2 extractant. Commun. Soil Sci. Plan. 1984, 15, 1409–1416. [Google Scholar] [CrossRef]
- ISO 10390:2005; Soil quality: Determination of pH. International Standardization Organization: Geneva, Switzerland, 2005.
- PN-ISO 14235:2003; Soil quality: Determination of Organic Carbon in Soil by Sulfochromic Oxidation. Polish Committee for Standardization: Warsaw, Poland, 2003. (In Polish)
- PN-EN ISO/IEC 17025:2018-02; General Requirements for the Competence of Testing and Calibration Laboratories. Polish Committee for Standardization: Warsaw, Poland, 2018. (In Polish)
- Korzeniowska, J.; Stanislawska-Glubiak, E.; Jadczyszyn, J.; Lipinski, W. Fertilization of Agricultural Crops with Microelements. New Limit Values for the Assessment of Micronutrients in Soil; IUNG-PIB: Pulawy, Poland, 2021; pp. 1–26, (In Polish). Available online: https://schr.gov.pl/download/NAWOZENIE-MIKROELEMENTY.pdf (accessed on 5 October 2022).
- Kabata-Pendias, A.; Mukherjee, A.B. Trace Elements from Soil to Human; Springer: Berlin, Heidelberg, 2007; pp. 1–550. [Google Scholar]
- Wall, D.P.; O’Sullivan, L.; Creamer, R.; McLaughlin, M.J. Soil Fertility and Nutrient Cycling. In The Soils of Ireland; Creamer, R., O’Sullivan, L., Eds.; World Soils Book Series; Springer: Cham, Switzerland, 2018; pp. 223–234. [Google Scholar]
- Alexander, A.; Gondolf, N.; Orlovius, K.; Paeffgen, S.; Trott, H.; Wissemeier, A.H. Mikronährstoffe in der Landwirtschaft Und Im Gartenbau Bedeutung-Mangelsymptome-Düngung; Bundesarbeitskreis Düngung (BAD): Frankfurt am Main, Germany, 2013; pp. 1–64. [Google Scholar]
- Katyal, J.C.; Randhawa, N.S. Micronutrient. FAO Fertil. Plant Nutr. Bull 1983, 7, 1–82. [Google Scholar]
- Korzeniowska, J.; Stanislawska-Glubiak, E.; Kantek, K.; Lipinski, W.; Gaj, R. Micronutrient status of winter wheat in Poland. J. Cent. Eur. Agric. 2015, 16, 54–64. [Google Scholar] [CrossRef]
- Korzeniowska, J. Comparison of different winter wheat cultivars in respect to their copper fertilization requirements. Zesz. Probl. Postępów Nauk. Rol. 2009, 541, 255–263. (In Polish). Available online: https://www.researchgate.net/profile/Jolanta-Korzeniowska-2/publication/259100834_Comparison_of_different_winter_wheat_cultivars_with_respect_to_their_copper_fertilization_demand/links/0c960529f737f2537c000000/Comparison-of-different-winter-wheat-cultivars-with-respect-to-their-copper-fertilization-demand.pdf (accessed on 5 October 2022).
- Stanislawska-Glubiak, E.; Sienkiewicz, U. Response of spring barley cultivars to soil acidity, liming and molybdenum fertilization. Zesz. Probl. Postępów Nauk. Rol. 2004, 502, 349–356. (In Polish). Available online: https://agro.icm.edu.pl/agro/element/bwmeta1.element.agro-article-a9b5dc8b-975f-430c-a2b2-bb9a7c5ce240/c/Zeszyt_Probl_Poste_Nau_Rol_r.2004_t.502_s.349-356.PDF (accessed on 5 October 2022).
- Wróbel, S.; Korzeniowska, J. Assessment of the need to fertilize maize with boron. Stud. I. Rap. IUNG-PIB 2007, 8, 127–142. (In Polish). Available online: http://iung.pulawy.pl/sir/zeszyt08_11.pdf (accessed on 5 October 2022).


| No. | Cultivar | Usage 1 | Year 2 | Breeder | No. of Samples | |
|---|---|---|---|---|---|---|
| 1 | Arkadia | Ark | A | 2011 | DANKO Hodowla Roślin sp. z o.o., Poland | 100 |
| 2 | Bamberka | Bam | A | 2009 | Hodowla Roślin Strzelce sp. z o.o., Poland | 46 |
| 3 | Bogatka | Bog | B | 2004 | DANKO Hodowla Roślin sp. z o.o., Poland | 14 |
| 4 | Hondia | Hon | A | 2014 | DANKO Hodowla Roślin sp. z o.o., Poland | 11 |
| 5 | Julius | Jul | A | - | KWS Lochow GmbH, Germany | 88 |
| 6 | Linus | Lin | A | 2011 | RAGT 2 n, France | 30 |
| 7 | Muszelka | Mus | B | 2008 | DANKO Hodowla Roślin sp. z o.o., Poland | 11 |
| 8 | Ostroga | Ost | A | 2008 | DANKO Hodowla Roślin sp. z o.o., Poland | 48 |
| 9 | Ozon | Ozo | B | 2010 | KWS Lochow GmbH, Germany | 26 |
| 10 | Sailor | Sai | A | 2011 | DANKO Hodowla Roślin sp. z o.o., Poland | 30 |
| 11 | Skagen | Ska | A | 2009 | W. von Borries-Eckendorf GmbH & Co. KG, Germany | 44 |
| 12 | Tonacja | Ton | A | 2001 | Hodowla Roślin Strzelce sp. z o.o., Poland | 33 |
| Total | 481 | |||||
| No. | Cultivar | FAO | Usage 1 | Year 2 | Breeder | No. of Samples | |
|---|---|---|---|---|---|---|---|
| 1 | Danubio | Dan | 240–250 | S | 2013 | Saatbau Linz eGen, Austria | 10 |
| 2 | Glejt | Gle | 230 | G | 2001 | HR Smolice, Poland | 16 |
| 3 | Legion | Leg | 260–270 | S | 2014 | HR Smolice, Poland | 11 |
| 4 | Nimba | Nim | 260 | S | 1996 | HR Smolice, Poland | 10 |
| 5 | Opoka | Opo | 240 | S | 2006 | HR Smolice, Poland | 11 |
| 6 | P8400 | P8400 | 240 | G | 2013 | Pionner, USA | 14 |
| 7 | Reduta | Red | 230 | G | 2000 | HR Smolice, Poland | 14 |
| 8 | Rosomak | Ros | 250–260 | G | 2013 | HR Smolice, Poland | 22 |
| 9 | Subito | Sub | 260 | G | 2008 | HR Smolice, Poland | 10 |
| 10 | Ulan | Ula | 270 | G | 2011 | HR Smolice, Poland | 23 |
| Total | 141 | ||||||
| No. | Cultivar | Year 1 | Breeder | No. of Samples | |
|---|---|---|---|---|---|
| 1 | Abacus (HY) | Aba | 2009 | Norddeutsche Pflanzenzucht Hans-Georg Lembke KG, Germany | 22 |
| 2 | Alexander (HY) | But | - | Limagrain Europe, France | 21 |
| 3 | Alvaro (HY) | Alv | 2015 | KWS Saat SE & Co. KGaA, Germany | 20 |
| 4 | Exquisite (HY) | Exq | 2011 | Monsanto Technology LLC, USA | 14 |
| 5 | Garou (HY) | Gar | 2013 | Norddeutsche Pflanzenzucht Hans-Georg Lembke KG, Germany | 16 |
| 6 | Kuga (HY) | Kug | 2015 | Norddeutsche Pflanzenzucht Hans-Georg Lembke KG, Germany | 19 |
| 7 | Marcopolos (HY) | Mar | 2012 | KWS Saat SE & Co. KGaA, Germany | 23 |
| 8 | Mercedes (HY) | Mer | 2013 | Norddeutsche Pflanzenzucht Hans-Georg Lembke KG, Germany | 16 |
| 9 | Monolith (OP) | Mon | 2008 | Hodowla Roślin Strzelce sp. z o.o. IHAR Group, Poland | 71 |
| 10 | Rohan (HY) | Roh | 2008 | Norddeutsche Pflanzenzucht Hans-Georg Lembke KG, Germany | 30 |
| 11 | Sherlock (OP) | She | 2010 | KWS Saat SE & Co. KGaA, Germany | 46 |
| 12 | Visby (HY) | Vis | 2008 | Norddeutsche Pflanzenzucht Hans-Georg Lembke KG, Germany | 30 |
| Total | 328 | ||||
| Soil Feature | Wheat (n = 481) | Maize (n = 141) | Rape (n = 328) | ||||||
|---|---|---|---|---|---|---|---|---|---|
| Mean | SE | Range | Mean | SE | Range | Mean | SE | Range | |
| pH in KCl | 6.1 | 0.03 | 5–7 | 6.0 | 0.06 | 5–7 | 6.1 | 0.03 | 5–7 |
| Sand 2.00–0.05 mm, %. | 61 | 0.79 | 2.5–84.8 | 64 | 1.22 | 13.5–83.6 | 64 | 0.73 | 22.7–83.4 |
| Silt 0.05–0.002 mm, %. | 36 | 0.77 | 13.8–94.6 | 33 | 1.14 | 14.7–84.0 | 33 | 0.68 | 15.2–72.2 |
| Clay <0.002 mm, % | 3 | 0.05 | 0.0–6.4 | 3 | 0.10 | 1.3–8.6 | 3 | 0.06 | 1.0–9.8 |
| Fraction <0.02 mm, % | 20.5 | 0.29 | 10–35 | 19.5 | 0.55 | 10–35 | 20.0 | 0.35 | 10–35 |
| TOC % | 1.3 | 0.03 | 0.5–9.8 | 1.2 | 0.05 | 0.3–4.1 | 1.2 | 0.03 | 0.3–3.6 |
| Element | Wheat | Maize | Oilseed Rape | |||||||||
|---|---|---|---|---|---|---|---|---|---|---|---|---|
| Cultivar | n | Mean | Difference | Cultivar | n | Mean | Difference | Cultivar | n | Mean | Difference | |
| mg kg−1 | mg kg−1 | mg kg−1 | ||||||||||
| B | Ton | 33 | 2.8 | Gle | 16 | 7.5 | Alex | 21 | 32 | |||
| Jul | 88 | 5.2 | 2.4 | Dan | 10 | 13.3 | 5.8 | Mer | 16 | 57 | 25 | |
| Cu | Ska | 44 | 4.6 | Nim | 10 | 4.2 | Mar | 23 | 6 | |||
| Lin | 30 | 6.4 | 1.8 | Dan | 10 | 7.8 | 3.6 | Gar | 16 | 7.8 | 1.7 | |
| Fe | Bog | 14 | 79 | Sub | 10 | 139 | Vis | 30 | 126 | |||
| Hon | 11 | 167 | 88 | P8400 | 14 | 287 | 148 | Kug | 19 | 267 | 141 | |
| Mn | Mus | 11 | 33 | Sub | 10 | 56 | She | 46 | 46 | |||
| Ton | 33 | 49 | 16 | P8400 | 14 | 83 | 27 | Alex | 21 | 71 | 25 | |
| Zn | Ska | 44 | 22 | Gle | 16 | 34 | Gor | 16 | 50 | |||
| Ton | 33 | 30 | 9 | Nim | 10 | 48 | 14 | Kug | 19 | 62 | 12 | |
| Element | Species | Mean | Difference | Species | Mean | Difference | Species | Mean | Difference |
|---|---|---|---|---|---|---|---|---|---|
| mg kg−1 | mg kg−1 | mg kg−1 | |||||||
| B | Wheat | 4.0 | 5.7 | Wheat | 4.0 | 37.1 | Maize | 9.7 | 31.4 |
| Maize | 9.7 | Rape | 41.1 | Rape | 41.1 | ||||
| Cu | Wheat | 5.2 | 0.6 | Wheat | 5.2 | 1.7 | Maize | 5.8 | 1.1 |
| Maize | 5.8 | Rape | 6.9 | Rape | 6.9 | ||||
| Fe | Wheat | 117 | 119 | Wheat | 117 | 58 | Maize | 236 | 61 |
| Maize | 236 | Rape | 175 | Rape | 175 | ||||
| Mn | Wheat | 40 | 24 | Wheat | 40 | 16 | Maize | 64 | 8 |
| Maize | 64 | Rape | 56 | Rape | 56 | ||||
| Zn | Wheat | 27 | 13 | Wheat | 27 | 28 | Maize | 40 | 15 |
| Maize | 40 | Rape | 55 | Rape | 55 | ||||
| Crop | Micronutrient | pH | Fraction <0.02 mm | Corg |
|---|---|---|---|---|
| Wheat n = 481 | B | ns | −0.16 *** | −0.11 * |
| Cu | ns | ns | ns | |
| Fe | ns | ns | ns | |
| Mn | −0.30 *** | ns | ns | |
| Zn | ns | ns | ns | |
| Maize n = 141 | B | ns | ns | ns |
| Cu | 0.19 ** | 0.18 * | ns | |
| Fe | ns | ns | −0.18 * | |
| Mn | −0.31 ** | ns | ns | |
| Zn | −0.18 * | 0.17 * | ns | |
| Rape n = 328 | B | ns | 0.19 *** | ns |
| Cu | ns | ns | ns | |
| Fe | ns | ns | ns | |
| Mn | ns | −0.16 ** | −0.14 * | |
| Zn | ns | ns | ns |
Publisher’s Note: MDPI stays neutral with regard to jurisdictional claims in published maps and institutional affiliations. |
© 2022 by the authors. Licensee MDPI, Basel, Switzerland. This article is an open access article distributed under the terms and conditions of the Creative Commons Attribution (CC BY) license (https://creativecommons.org/licenses/by/4.0/).
Share and Cite
Korzeniowska, J.; Stanislawska-Glubiak, E. Differences in the Concentration of Micronutrients in Young Shoots of Numerous Cultivars of Wheat, Maize and Oilseed Rape. Agronomy 2022, 12, 2639. https://0-doi-org.brum.beds.ac.uk/10.3390/agronomy12112639
Korzeniowska J, Stanislawska-Glubiak E. Differences in the Concentration of Micronutrients in Young Shoots of Numerous Cultivars of Wheat, Maize and Oilseed Rape. Agronomy. 2022; 12(11):2639. https://0-doi-org.brum.beds.ac.uk/10.3390/agronomy12112639
Chicago/Turabian StyleKorzeniowska, Jolanta, and Ewa Stanislawska-Glubiak. 2022. "Differences in the Concentration of Micronutrients in Young Shoots of Numerous Cultivars of Wheat, Maize and Oilseed Rape" Agronomy 12, no. 11: 2639. https://0-doi-org.brum.beds.ac.uk/10.3390/agronomy12112639