Article

Genome-Wide Identification, Structural Characterization, and Gene Expression Analysis of BES1 Transcription Factor Family in Tartary Buckwheat (Fagopyrum tataricum)

College of Agriculture, Guizhou University, Guiyang 550025, China
*
Author to whom correspondence should be addressed.
Submission received: 16 October 2022 / Revised: 28 October 2022 / Accepted: 1 November 2022 / Published: 3 November 2022

Abstract

:
The transcription factor (TFs) BES1, which mediates brassinosteroid (BR) signaling, regulates plant growth and development. However, BES1 genes have not yet been reported in Tartary buckwheat. Here, ten FtBES1 genes were identified in the Tartary buckwheat genome, and they were named FtBES1-1 to FtBES1-10. These genes were divided into four groups according to the classification in Arabidopsis thaliana. Multiple sequence alignment indicated that all BES1 gene members contained the BES1_N structural domain. Phylogenetic relationship FtBES1 genes in the same group had similar gene structures and motifs. An analysis of cis-acting elements demonstrated that the BES1 TFs contains many light-responsive, hormonal, and abiotic stress-responsive elements, etc. The 10 FtBES1 genes were located on four chromosomes of Tartary buckwheat, and gene distribution and synteny analysis revealed that segmental duplications have played important roles in FtBES1 gene family expansion. Tissue specificity revealed that all of the ten FtBES1 members expressed highly in two periods, and relatively high expression levels were observed in mature leaves. Gene expression profiles under different hormone treatments demonstrated that FtBES1 gene family participated in the hormone stress response. This study enriches our knowledge of the Tartary buckwheat BES1 gene family and provides a theoretical basis for analyzing the biological functions and stress tolerance mechanisms of the Tartary buckwheat BES1 transcription factors.

1. Introduction

Brassinosteroids (BRs) belong to a natural class of phytosterol hormones that play a crucial role in plant growth, development, and biotic or abiotic stress responses. BRs have biological functions, such as enhancing seed germination, promoting cell elongation, vascular differentiation, stomatal formation, regulating flowering and male fertility, participating in photomorphogenesis, resisting plant senescence, and improving stress resistance [1,2,3]. The molecular mechanism of BR signaling has now been clearly elucidated—BR is sensed by the receptor kinase BRl1 on the plasma membrane to regulate the BR signaling pathway gene expression by activating the transcriptional activity of downstream BZR/BES1 TFs [4]. BRs regulate the expression of BR genes through phosphorylation and dephosphorylation of BZR/BES1 proteins and affecting their activity [5,6].
BES1 is a key TFs that primarily regulates and binds to target genes downstream of BR signaling. The N-terminal bHLH domain of BES1 can bind target genes specifically to the promoter region E-box (CANNTG) sequence or the BRRE element (CGTGT/CG), and BES1 can also directly activate some direct target genes and repress other gene expressions [2]. As reported in previous studies on BES1 function, BES1 can also directly activate some direct target genes and repress other gene expression. BES1 synergizes with the target AtMYB30 to promote the expression of downstream target genes and enhance BR signaling [7]. The conserved N-terminal DNA-binding structural domain of the BZR1/BES1 gene, or indirectly through the MYB factor, binds to thioglucoside biosynthesis genes and is involved in regulating BR signaling in the thioglucoside synthesis in Arabidopsis [8]. The WRKY TFs interact with BES1 to synergistically regulate BR signaling and play a redundant role in the BR pathway and positively regulate plant growth [9]. AGB1 synergistically regulates the expression of the BES1 target genes CPD and DWF4 and promotes cell elongation [10]. The RD26 transcription factor has an antagonistic relationship with BES1, and the two interact to suppress RD26 regulatory functions in response to drought stress [11].
The BES1 transcription factor not only mediates BR signaling but also plays a key role in other signaling pathways. Dephosphorylated BES1 and TPL-HDA19 form a transcriptional repressor complex that inhibits the transcription of the abscisic acid (ABA) signaling pathway-associated ABI3 and ABI5 to promote seedling development [12]. ABl5 interacts with BES1 to promote Arabidopsis seed germination [13]. In an investigation of the molecular mechanism of light and the BR signaling antagonism, the red-light receptor phyB was found to inhibit the expression of BES1 target genes to balance light and BR signaling [14]. Wang et al. [15] demonstrated that strigolactones (SL) and BR signaling pathways regulate the same BES1 TFs and that BES1 interacts with MAX2 to regulate the expression of SL-responsive genes to regulate specific developmental processes. In addition, BES1 can bind directly to the heat shock HSF TFs in the absence of BR signaling, and HSF can interact with BES1 and promote HSE-binding activity. This suggests that BES1 can promote heat stress protection in plants subjected to heat stress [16]. These studies suggest that BES1 TFs are involved in mediating different signaling pathways to regulate plant growth and developmental processes and respond to adversity with vital functional roles.
Tartary buckwheat is a traditionally important medicinal crop, rich in flavonoids, amino acids, vitamins, dietary fiber and other nutrients, known as the “king of grains”, and is susceptible to biotic and abiotic stresses during growth, resulting in reduced quality and yield. Though there is plenty of research on TFs in Tartary buckwheat, there is no research on the BES1 TF family. Our study identified FtBES1 genes based on the Tartary buckwheat genome data, and analyzed their physicochemical properties, multiple sequence analysis, gene structure, evolutionary relationships, cis-acting elements, and tissue specificity in two periods of expression patterns. Furthermore, we also analyzed the expression of the FtBES1 gene in response to hormone stressors, e.g., abscisic acid (ABA), gibberellic (GA), methyl Jasmonate (MeJA), and salicylic acid (SA), at different points in time and with different tissue. The results will help to further clarify the function of FtBES1. In addition, BR is also an important plant growth hormone and regulates a variety of crop agronomic traits. The study of Tartary buckwheat BES1 TFs can improve our understanding of the mechanism of BR signaling in the plant, enabling us to enhance the plant’s stress resistance and improve crop quality and yield.

2. Materials and Methods

2.1. Genome-Wide Identification and Sequence Analysis of FtBES1 Family Members

Tartary buckwheat genome information was downloaded from TBGP (http://www.mbkbase.org/Pinku 1/, accessed on 9 September 2022), TAIR (https://www.Arabidopsis.org/, accessed on 9 September 2022), RGAP (http://rice.plantbi-ology.msu.edu/, accessed on 9 September 2022) websites for Arabidopsis and the amino acid sequences of all members of the BSE1 gene family in rice. First, Arabidopsis and Rice BES1 amino acid sequences were used as probes to obtain candidate genes by the Blast of the whole Tartary buckwheat genome using TBtools software [17]. Second, the candidate genes were obtained from the Pfam database for the BES1 structural domain (Pfam ID: DUF822) using TBtools software Hmmer Search, the two results were combined, and redundant sequences were removed. Finally, the conserved domains of the candidate genes were analyzed using the CDD database (http://0-www-ncbi-nlm-nih-gov.brum.beds.ac.uk/, accessed on 12 September 2022), and SMART Tool (http://SMART.emblheidelberg.de/, accessed on 13 September 2022) to identify FtBES1 family members. The physicochemical properties and subcellular localization of the identified FtBES1 family members were predicted using the online websites ProtParam (http://web.expasy.org/protparam/, accessed on 15 September 2022) and WoLF PSORT (http://www.genscript.com/wolf.psort.html, accessed on 15 September 2022).

2.2. Phylogenetic Analysis and Multiple Sequence Alignments of FtBES1 Family Members

The amino acid sequences of the identified Tartary buckwheat FtBES1 and other species (Arabidopsis, tobacco, tomato, and rice) were analyzed by multiple sequence alignment using Clustal X and trimmed using TBtools software. This was followed by the construction of a Tartary buckwheat FtBES1 and other species’ (Arabidopsis, tobacco, tomato, and rice) phylogenetic tree using the neighbor joining method of MEGA7.0 software with the bootstrap value set to 1000 and other parameters set as default. Tartary buckwheat BES1 family members were classified with reference to the Arabidopsis member classification method, and an evolutionary tree was established using the online website ChiPlot.

2.3. Gene Localization and Chromosome Duplication Analysis of FtBES1 Family Members

Based on Tartary buckwheat whole genome files, the gene location information of FtBES1 was plotted by Visualize Gene Structure in TBtools software. Meanwhile, Genome files were downloaded from NCBI (grape, tomato, and tobacco),with Gene circle mapping using TBtools, One-Step Mcscanx analysis FtBES1 covariance with other species, and Multiple Synteny Plot for visualization.

2.4. Analysis of Conserved Motifs and Cis-Acting Elements of FtBES1 Family Members

The gene structure of FtBES1 family members was analyzed using the Gene Structure in TBtools software, and the FtBES1amino acid sequences were submitted to MEME (http://meme-suite.org/tools/meme accessed on 20 September 2022) for analysis of conserved motifs. Cis-acting element analysis was performed using PlantCARE (http://bioinformatics.psb.ugent.be/webtools/plant-care/html/, accessed on 20 September 2022) for FtBES1 family member promoter (upstream 2000 of ATG) sequence prediction.

2.5. Plant Materials and Stress Treatment

The planted Tartary buckwheat variety ‘Sichuan Buckwheat No. 2′ was provided by the Sichuan Liangshan Prefecture Institute of Agricultural Sciences. To analyze the Tartary buckwheat FtBES1 tissue specificity, root, stem, leaf, and flower samples were collected at the seedling (three leaves and one heart) and flowering stages, and three biological replicates were used for each sample. Hormone-treated seedling material was grown in the histopathology laboratory of the College of Agriculture, Guizhou University, and hormone treatments were applied to the seedlings with three leaves and one heart of young leaves by spraying 100 μM each of ABA, SA, GA, and MeJA to the leaves. Seedling roots, stems, and leaves were sampled after 3, 12, and 24 treatments, and a blank control is set for each treatment time. Three biological replicates were used for each sample, and samples frozen in liquid nitrogen were immediately stored at −80 °C to extract the total RNA.

2.6. RNA Extraction and Gene Expression Analysis

Sample RNA was extracted using a plant RNA kit (TIANGEN, Beijing, China); the cDNA was synthesized by the reverse transcription using Hiscript III SuperMix (Vazyme, Nanjing, China). cDNA was diluted to 100 ng/μL for qRT-PCR. The qRT-PCR specific primers were designed using the online software Primer Blast (Primer designing tool (nih.gov)) (Supplementary Table S1). A reaction system of 20 μL was configured according to the ChamQ universal SYBR QPCR Master Mix (Vazyme, Nanjing, China) kit, including 10 μL 2 × ChamQ universal SYBR QPCR Master Mix, 0.4 μL forward primer, 0.4 μL reverse primer, 1 μL cDNA, and 1 μL dd H2O. The reaction program was set up on a CFX96 (Bio-Rad, Hercules, CA, USA) instrument with cycling conditions: 95 °C 30 s, 95 °C 10 s, 57.8 °C 30 s, 39 cycles, solubility curve conditions: 95 °C 30 s, 60 °C 60 s, 95 °C 10 s. FtF3H was used as the internal reference gene, and the expression level of the buckwheat FtBES1 gene in different tissues at different times during stress was calculated after the reaction using the 2−ΔΔCT method.

3. Results

3.1. Identification and Analysis of FtBES1

After using two blast methods to identify the BES1 genes in the Tartary buckwheat genome and removal of redundant sequences, a total of 10 BES1 genes were identified (named FtBES1-1 to FtBES1-10). Analysis of the physical and chemical properties of the FtBES1 family members are shown in Table 1. The CDS length ranged from 291 to 2100 bp, with FtBES1-7 and FtBES1-6 being the shortest and the longest sequence, respectively. The molecular weight and theoretical isoelectric point of FtBES1-6 ranged within 11–66 ka and 5.24–10.52, respectively. All the proteins were basic except FtBES1-6 and FtBES1-8, and GRAVY calculation showed that all proteins were hydrophilic proteins. The secondary structure demonstrated that all the proteins of the FtBES1 family members were unstable and hydrophobic, and the subcellular localization prediction results concluded that they were located in the nucleus.

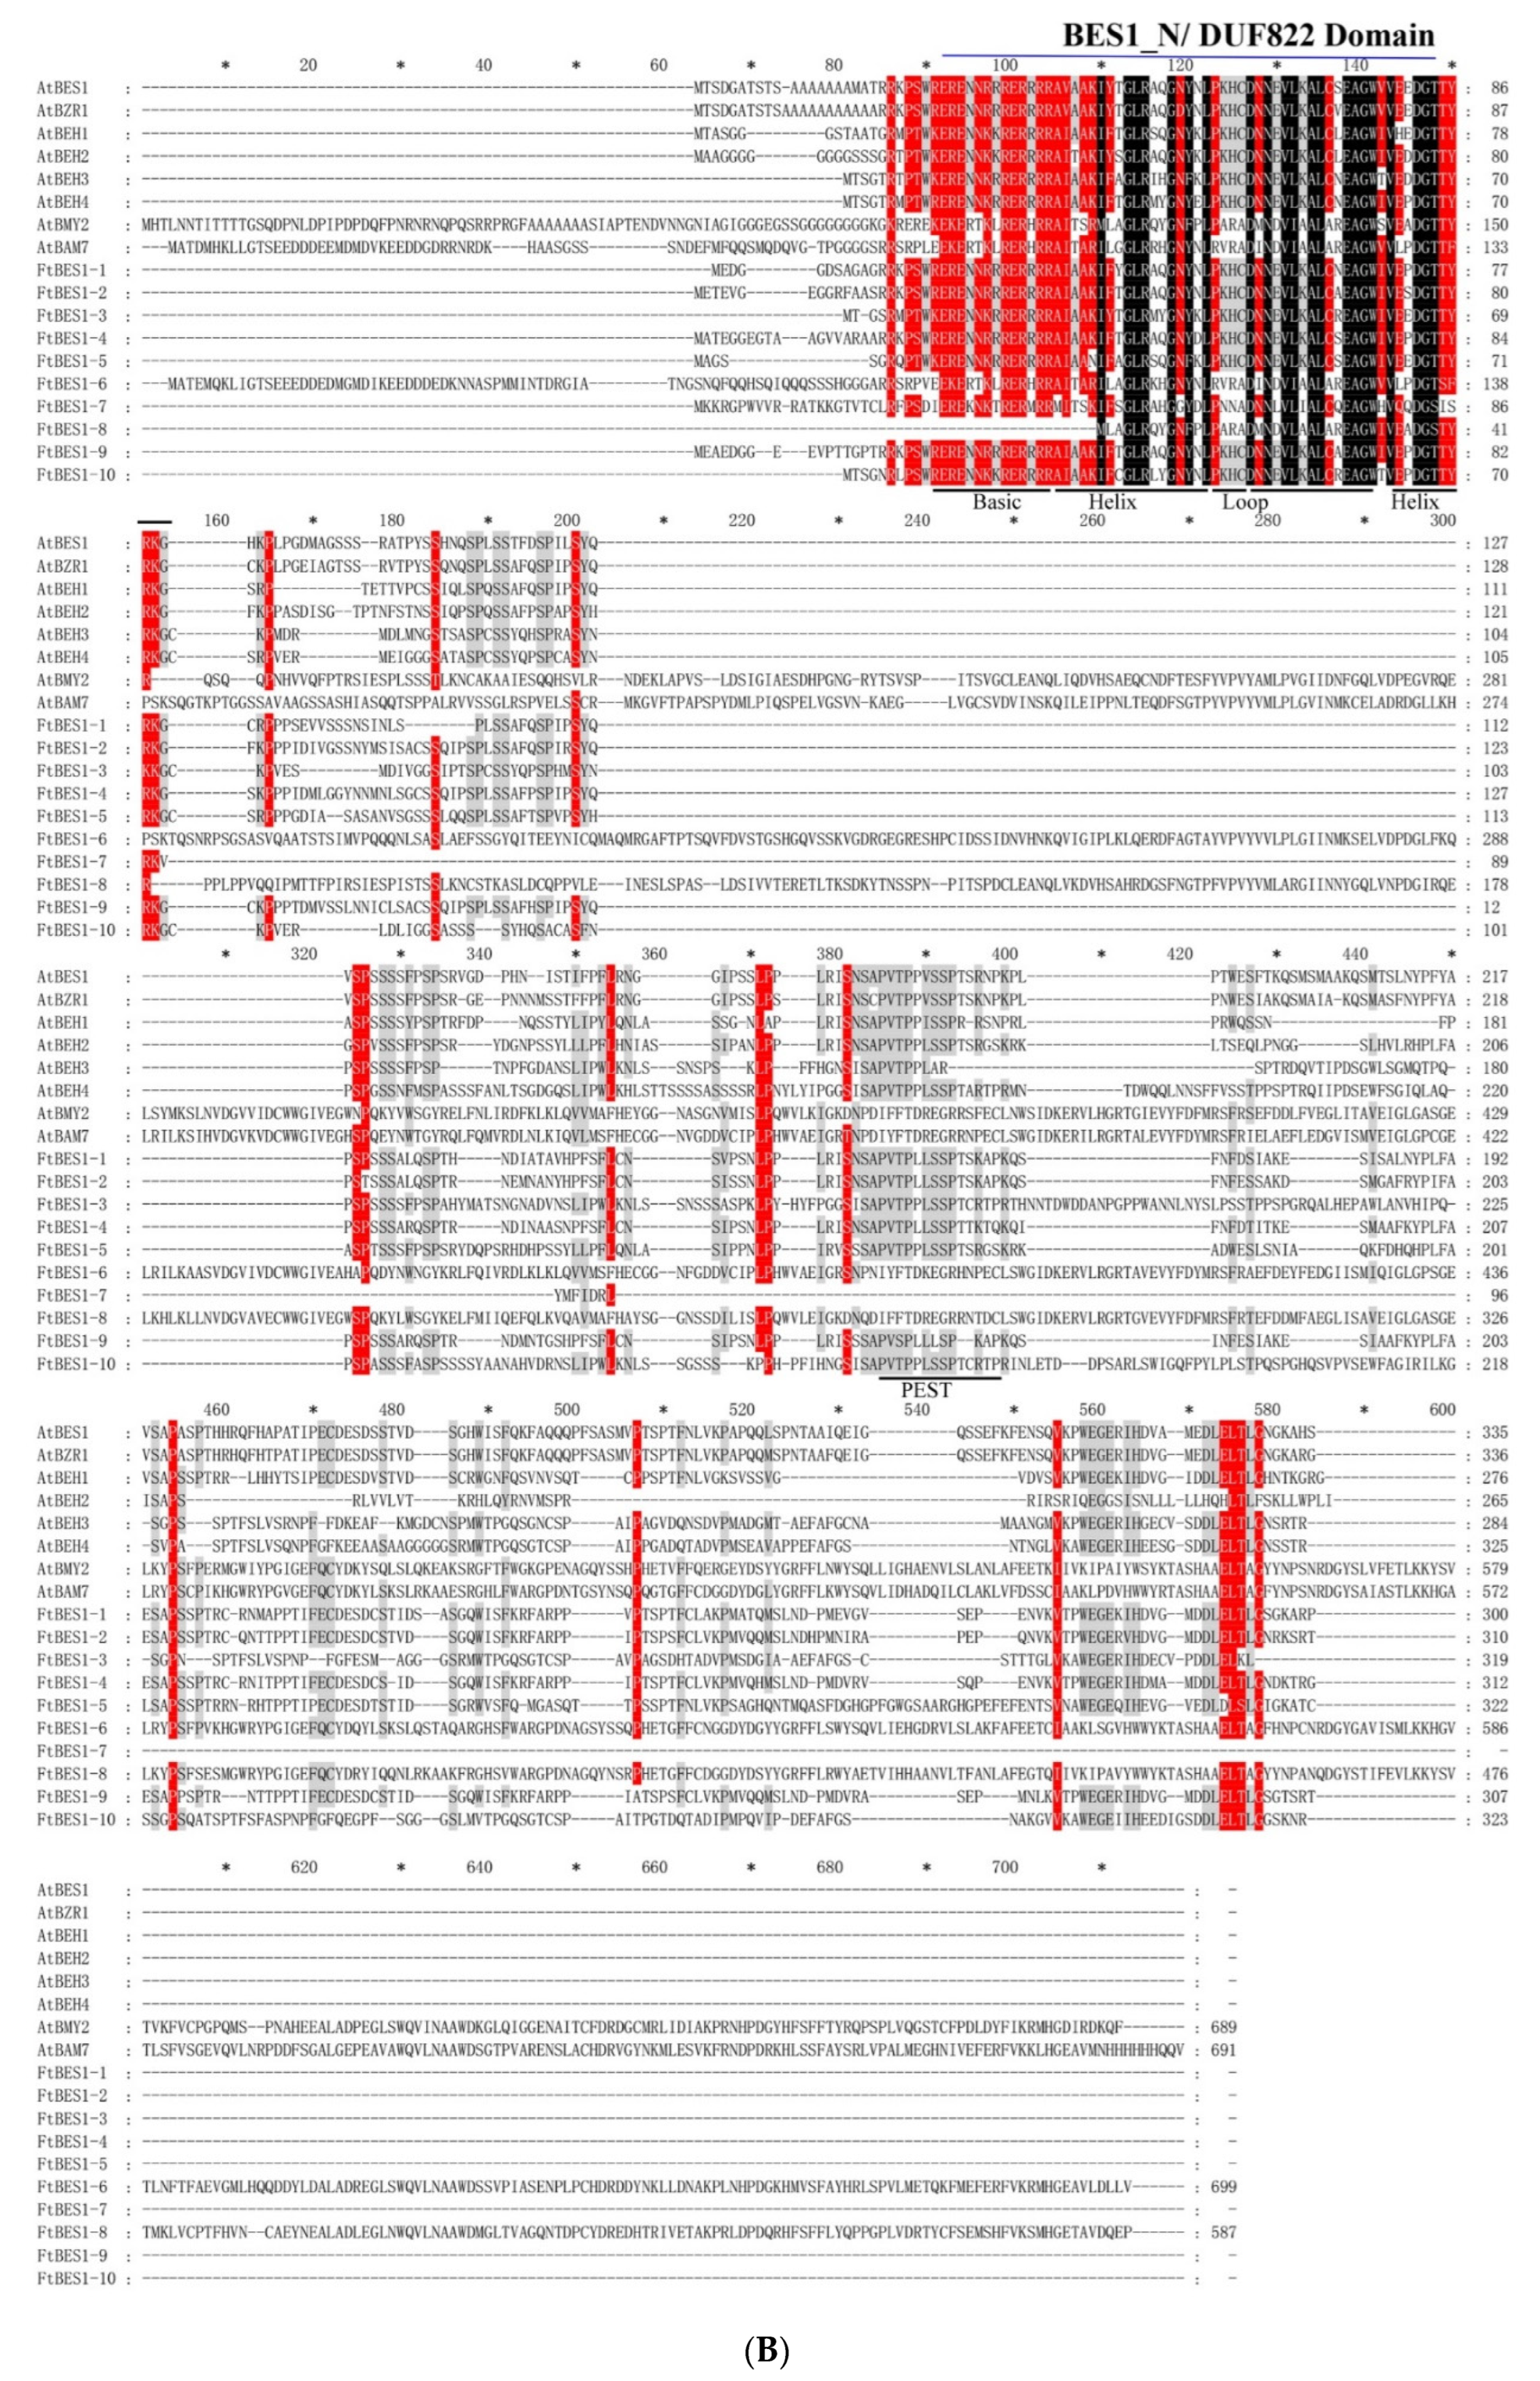
3.2. Phylogenetic and Multiple Sequence Analysis of FtBES1

To elucidate the phylogenetic relationships between FtBES1 and other species, the amino acid sequences of Arabidopsis, tobacco, rice, and tomato were downloaded (Supplementary Table S2), and a phylogenetic tree was constructed using MEGA7.0 (Figure 1A). The 47 genes were divided into four groups, the group I included FtBES1-1, FtBES1-2, FtBES1-4 and FtBES1-9, the group II included FtBES1-5, the group III included FtBES1-6, FtBES1-7 and FtBES1-8, and the group IV included FtBES1-3 and FtBES1-10. Based on the evolutionary tree, it was also found that the FtBES1 gene is more similar to the evolutionary members of tomato genes. Overall, the BES1 protein is relatively conserved in plant evolution, but the phylogenies of different species have obvious species-specific characteristics.
It is well known that BES1 TFS own a conserved BES1_N domain; we compared the amino acid sequences of FtBES1 and AtBES1/BZR, and the results demonstrated that most FtBES1 proteins contained BES1_N and the basic helix-loop-helix DNA binding site (bHLH) domain. Meanwhile, PEST domain contributes to controlling protein stability. Except for the FtBES1-6, FtBES1-7 and FtBES1-8 gene, other genes included the PEST domain.

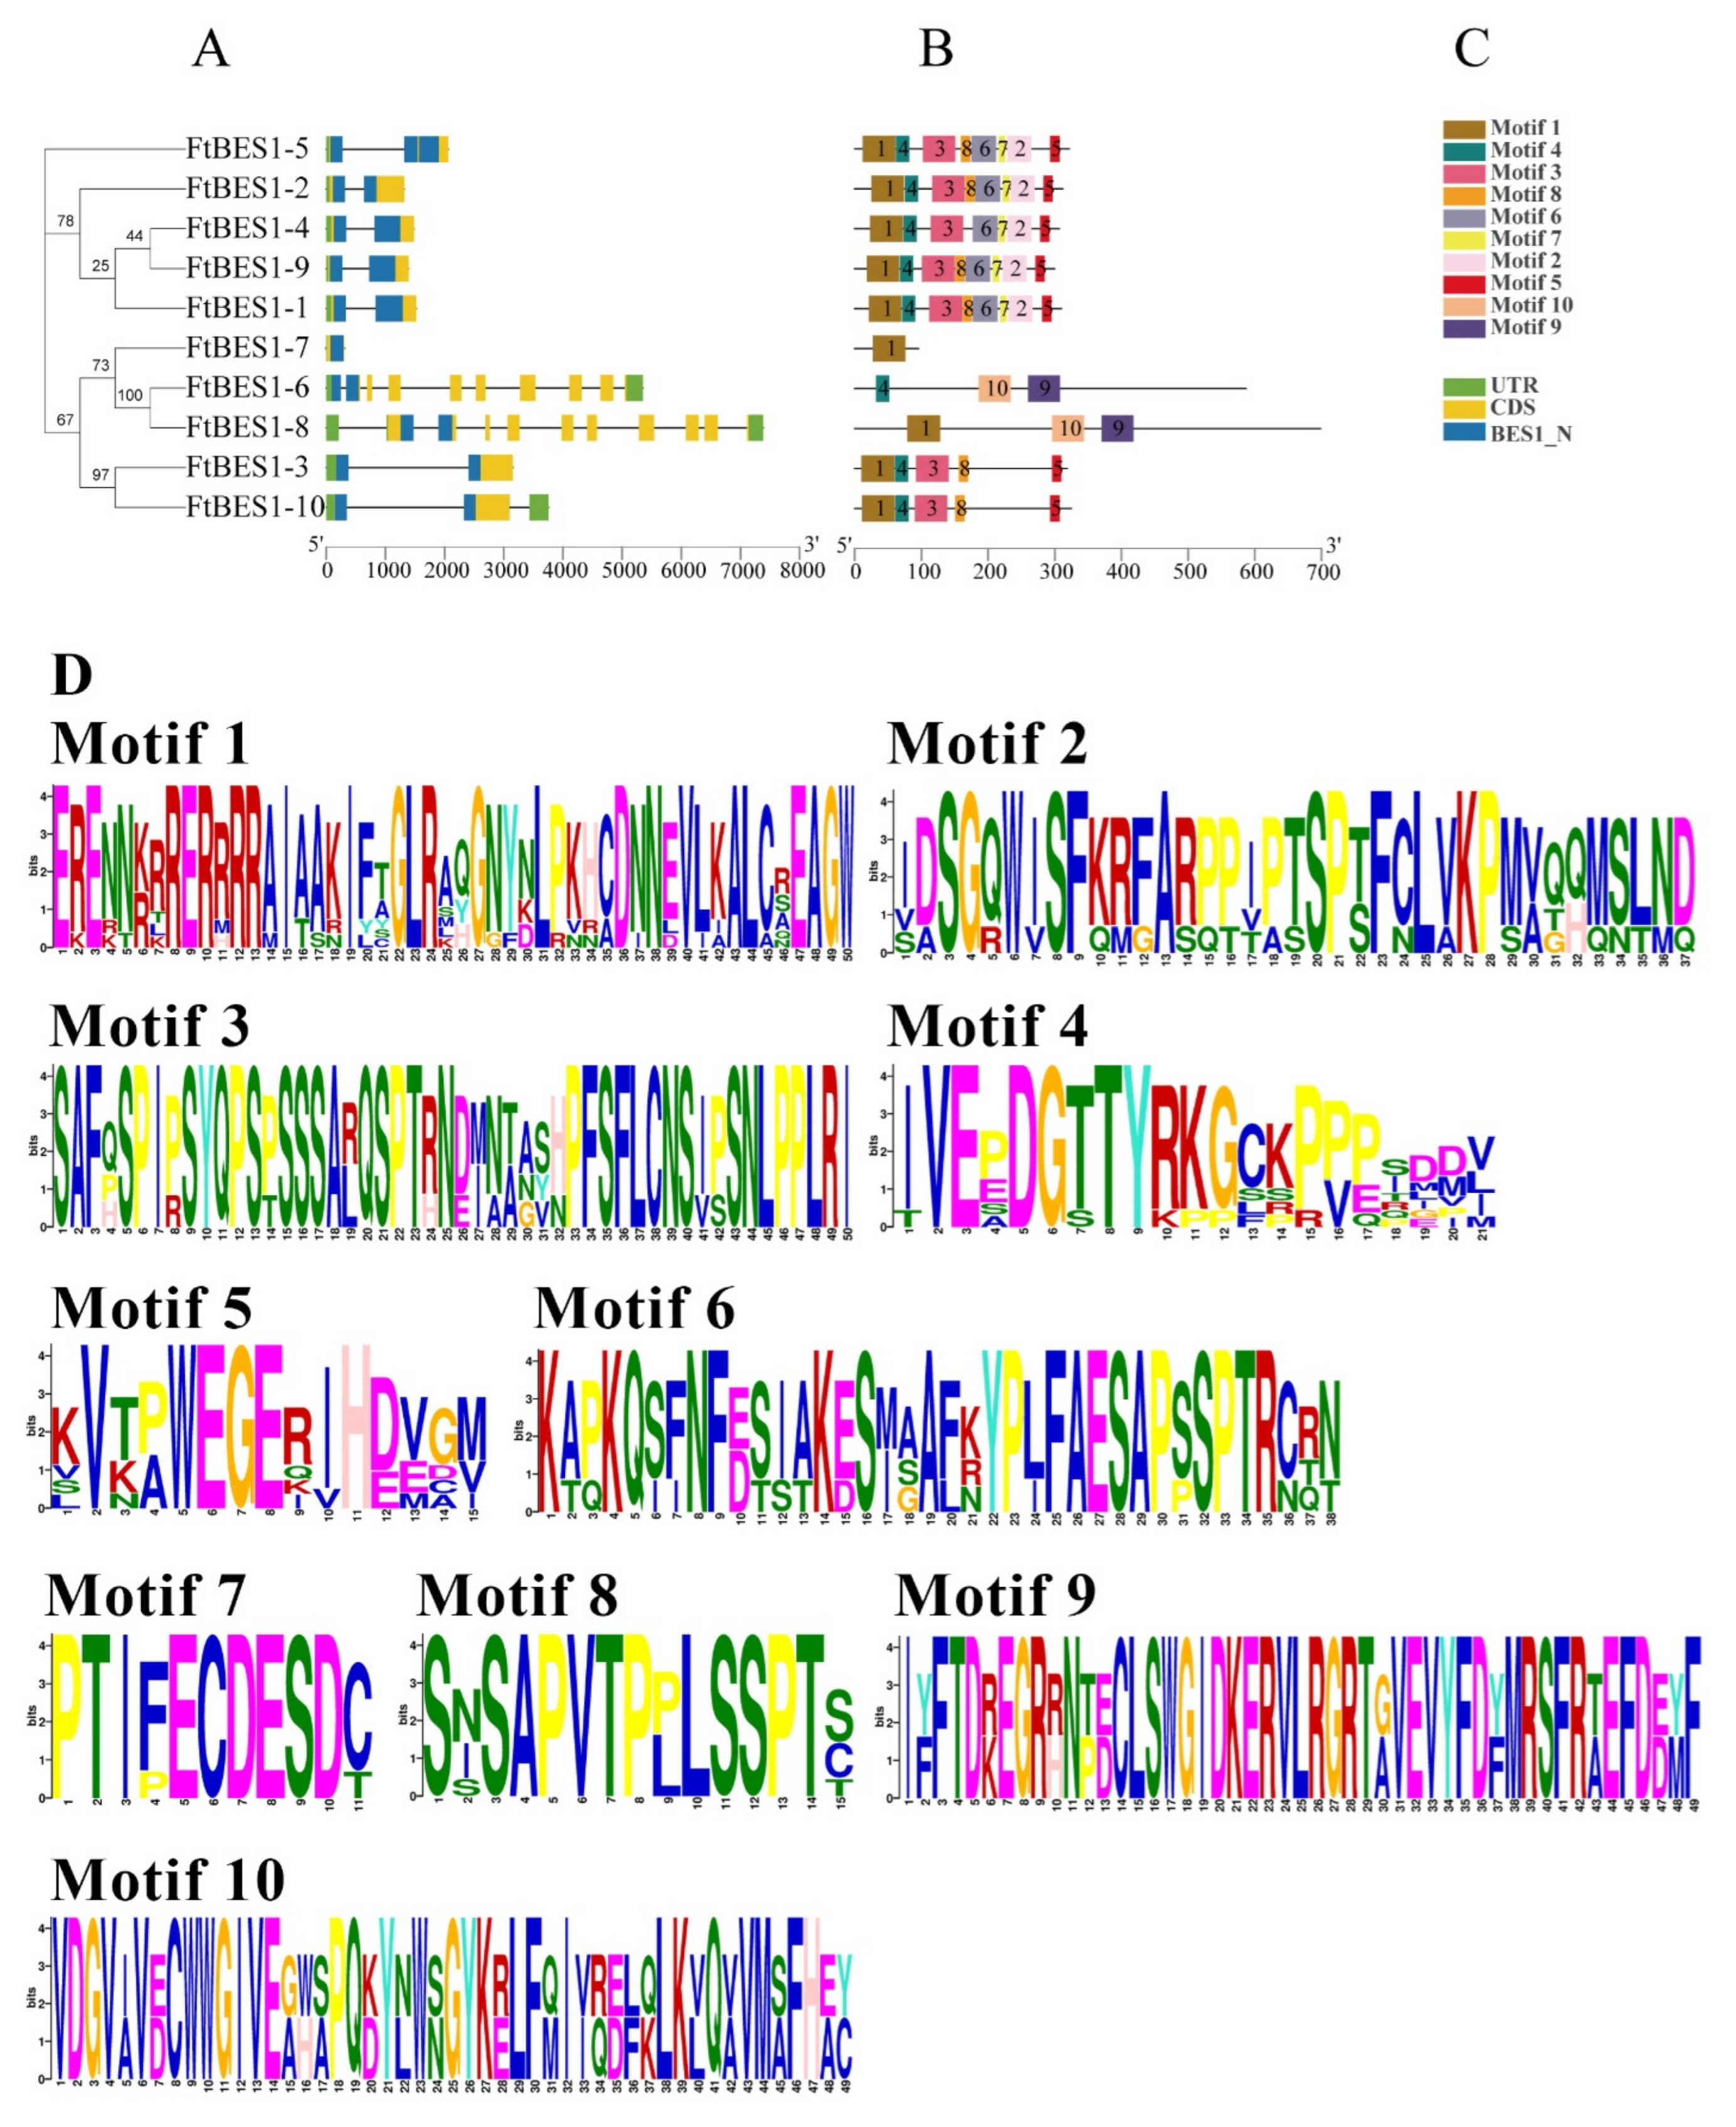
3.3. Analysis of FtBES1 Gene Structure and Motif

The gene structure and protein-conserved regions are important bases for studies on gene function. To elucidate the gene structure and protein-conserved regions of the FtBES1 gene, the untranslated region (UTR) and CDS of the FtBES1 gene were obtained from the Tartary buckwheat genome files, while the FtBES1 gene protein motifs were analyzed using the MEME online software, and the results were visualized using TBtools software (Figure 2). The gene structure of the FtBES1 gene demonstrated that, except for the FtBES1-6 and FtBES1-8 genes, others contain mainly one to three exons, FtBES1-6 contains 10 exons, FtBES1-8 contains nine exons, and FtBES1-3 contains only one exon. In addition, all FtBES1 genes contain UTR and BES1_N structural domains.
The conserved protein structural domain indicates the conserved function of this gene. Motif analysis identified a total of ten motifs in the FtBES1 gene, except for the FtBES1-8 gene, which mainly contains Motif 4, Motif 10, and Motif 9, all of which share Motif 1. Whereas the FtBES1-7 gene only contains Motif 1, indicating that one and four motifs are the main conserved motifs in the protein structural domain. The numbers and type of conserved motifs contained in different protein sequences differed, and the difference in the distribution of conserved motifs may reveal the different functions possessed by each gene. In addition, the analysis demonstrated that the closely related motifs contained the same motif, and specific motifs appeared within different evolutionary branches, suggesting that the appearance of specific motifs during the evolutionary process is likely to be the cause of the functional differentiation of genes.

3.4. Analysis of Cis-Acting Elements in the FtBES1 Promoter

The combination of cis-acting elements and transcription factors in the gene promoter sequence jointly regulates the transcriptional initiation of genes, and the differences and distribution patterns of cis-acting elements may affect regulatory transcriptional efficiency and gene function. To further understand the possible regulatory mechanisms of FtBES1, the cis-acting elements in the promoter sequence of FtBES1 were predicted and analyzed. Twenty-three cis-acting elements potentially involved in the regulation of FtBES1 gene were identified in the promoter of the FtBES1 gene, and the results were visualized by TBtools software (Figure 3), including those that respond to phytohormones, stresses and adversities, growth and development, light response, flavonoid biosynthesis, etc. The largest number of cis-acting elements of light responsive elements, including phytohormone responsive elements, are mainly ABA, MeJA, SA, GA, and IAA, indicating that FtBES1 may respond to these hormones involved in the regulation of Tartary buckwheat growth and development; stress adversity, including drought stress, low temperature stress, and other response elements, revealing that FtBES1 also has an important function in Tartary buckwheat in response to biotic and abiotic stress responses. In addition, FtBES1-9 found an MBSI element, which is an MYB-binding site involved in the regulation of flavonoid biosynthesis genes, indicating that the FtBES1-9 gene may be involved in the regulation of Tartary buckwheat flavonoid anabolism.

3.5. Chromosome Mapping, Gene Duplication, and Evolutionary Analysis

Referring to the Tartary buckwheat genomic file, the FtBES1 gene was mapped to Tartary buckwheat chromosomes using the TBtools software (Figure 4A). Based on their physical location, we found that FtBES1 gene members were unevenly distributed among buckwheat chromosomes, and only on the upper and lower arms of chromosomes 2, 3, 4, and 5. In terms of distribution, the FtBES1 gene is regional in nature. Gene duplication events are an important factor in the functional differentiation of the species’ genes. Gene duplication analysis of the FtBES1 gene (Figure 4B) revealed no gene tandem duplication, and only one gene pair FtBES1-1/FtBES1-2 was identified as segmental duplication. Segmental duplication is an important pathway to generate gene amplification, indicating that segmental duplication is the main reason for the functional differentiation of the FtBES1 gene. The Ka/Ks value can indicate the time when gene duplication occurs and the evolutionary pressure on the gene. The Ka/Ks value of the gene pair FtBES1-1/FtBES1-2 as calculated by TBtools (Simple Ka/Ks Calculator) was <1 (Supplementary Table S3), indicating that the FtBES1 gene is under the purifying selection pressure. In order to further infer the phylogenetic process of the FtBES1 gene, Tartary buckwheat was constructed with three other representative species (Arabidopsis, tomato, and grape) covariance (Figure 4C). With respect to Arabidopsis, the tomato had six genes co-related to FtBES1, followed by five genes co-related to grape. These results indicated that the FtBES1 gene phylogeny may be related to species, and the phylogenetic relationship of the FtBES1 gene may be related to the differential phylogeny between species.

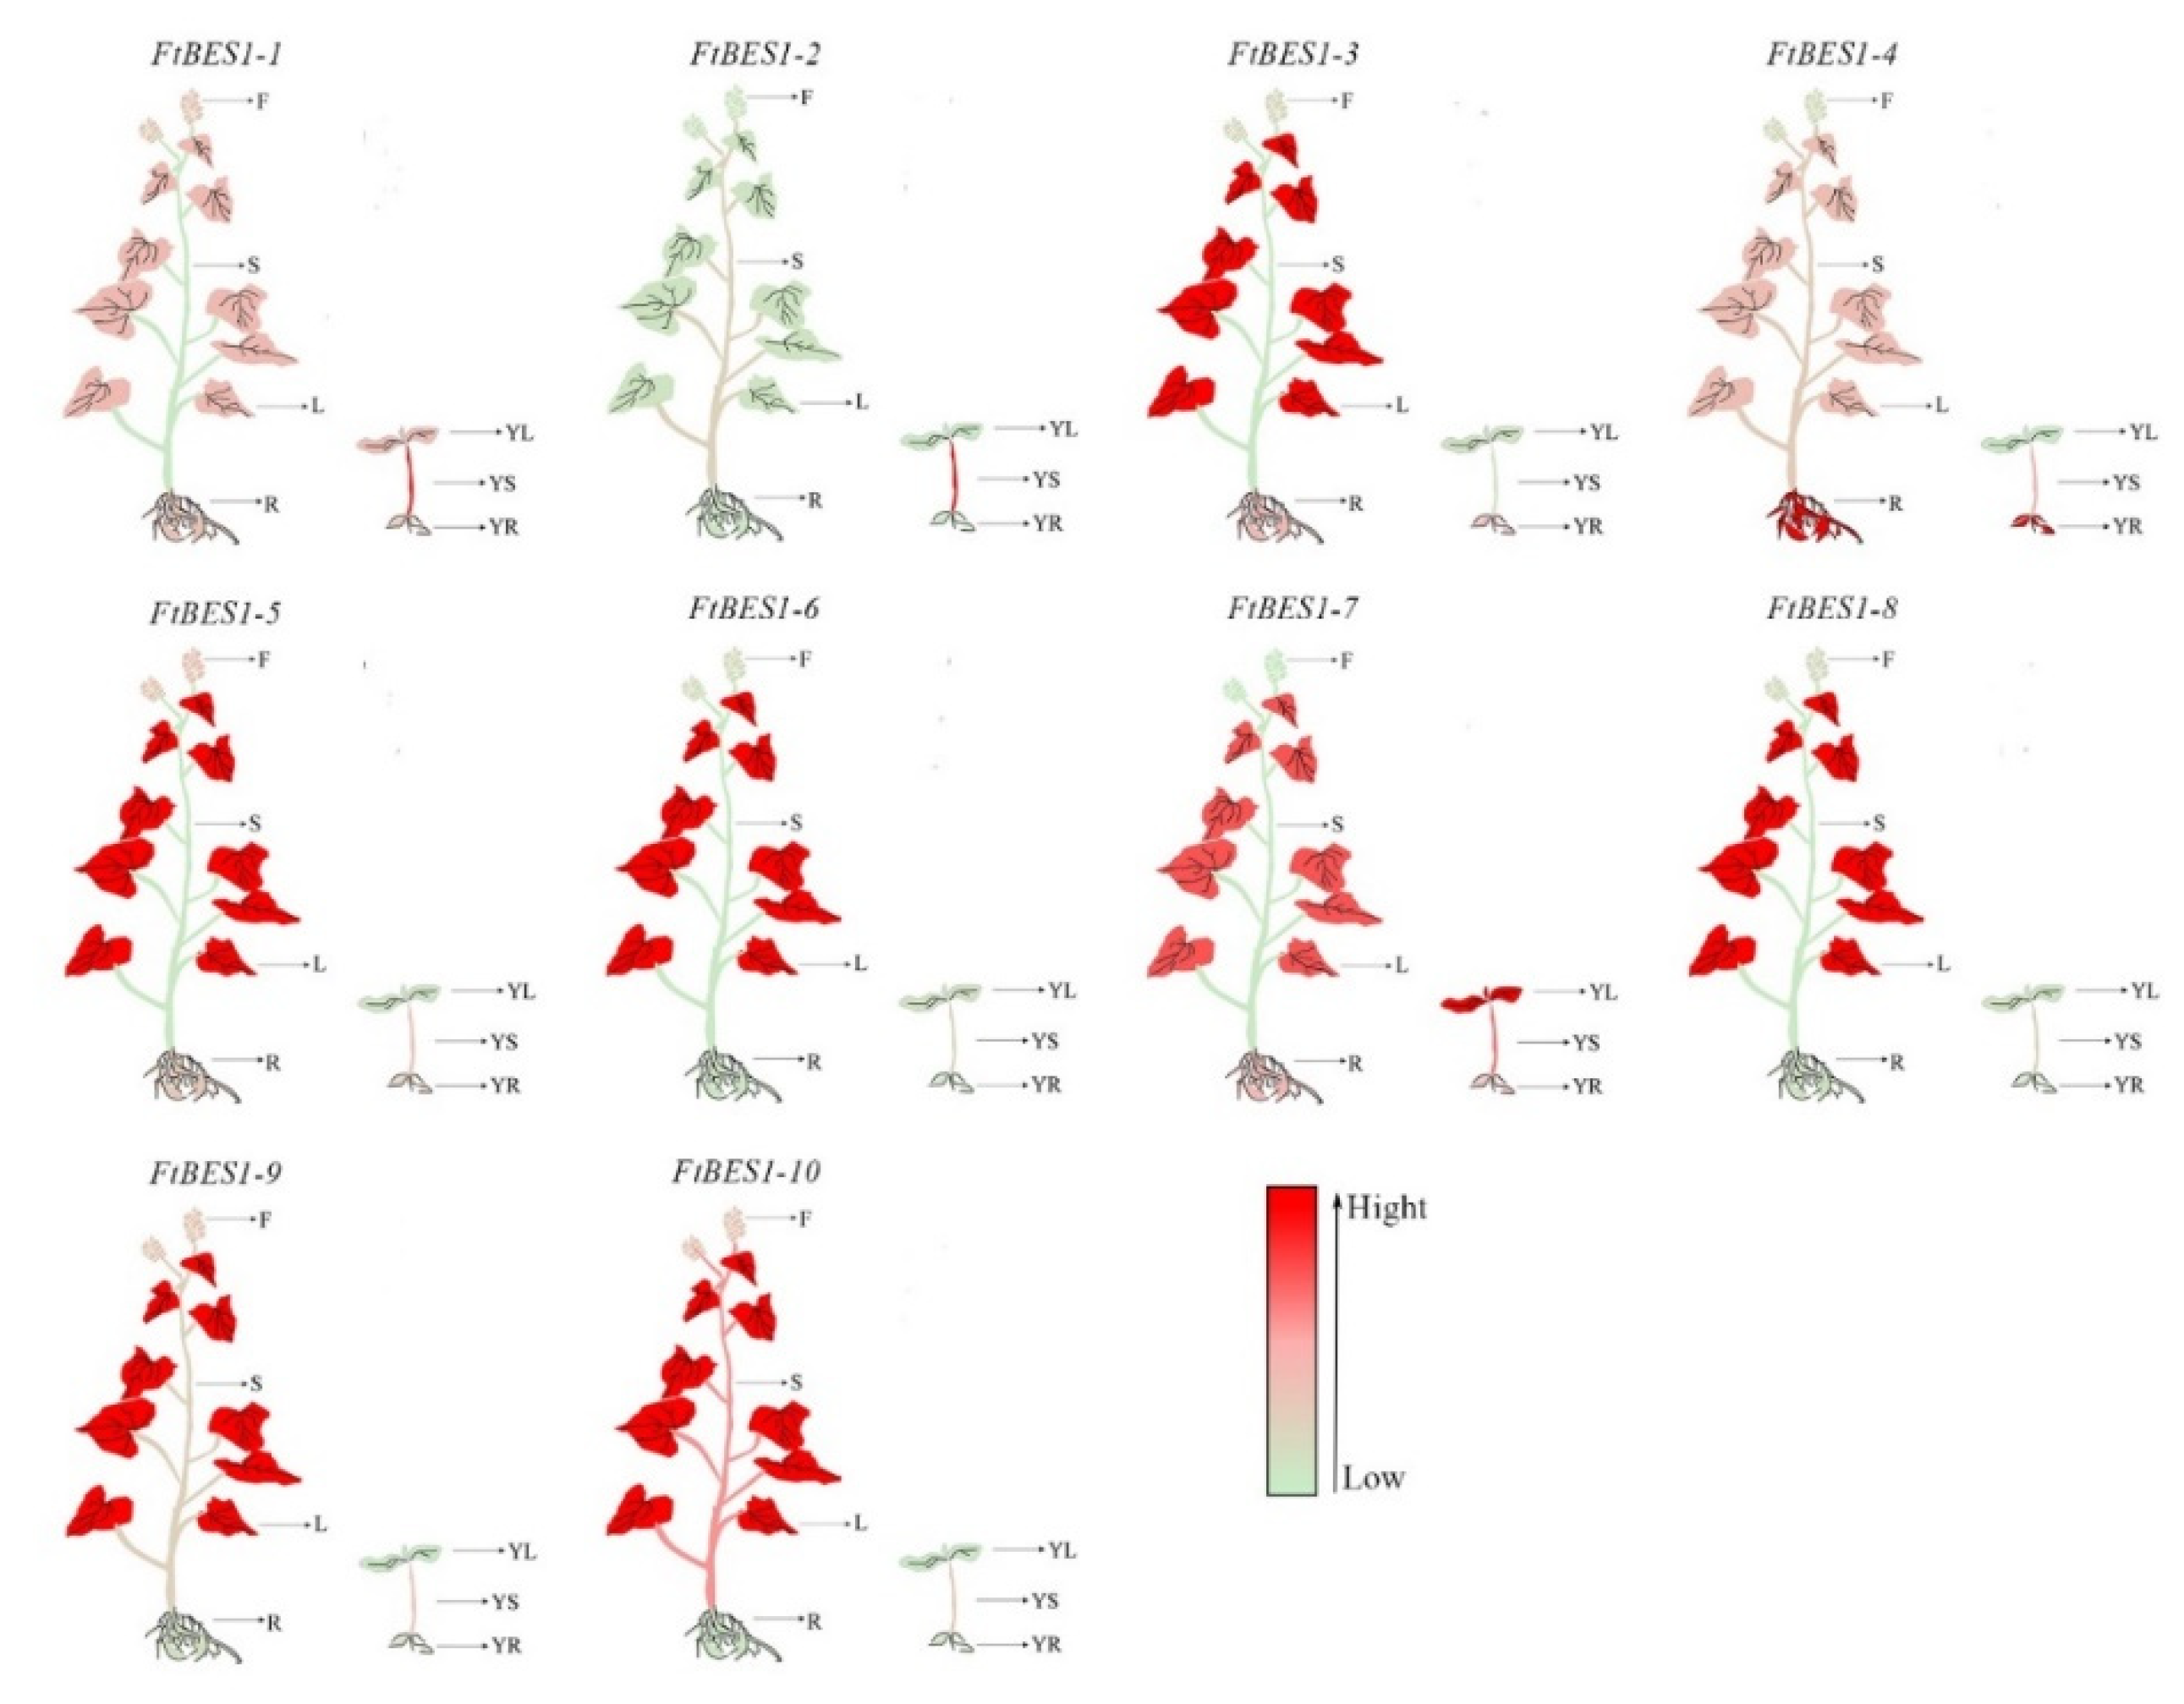
3.6. Expression Pattern of FtBES1 Gene in Different Tissues

BES1 transcription factors are involved in the regulation of plant growth and development. To comprehensively analyze and explore the possible functions of the FtBES1 gene in the growth and development of Tartary buckwheat, the expression levels of FtBES1 gene family members in different tissues at different times were analyzed by qRT-PCR (Figure 5). Except for the FtBES1-2 gene members, the flowering stage FtBES1 gene expression pattern was mainly in the leaves and seedling; the FtBES1 gene expression pattern was mainly in the stem, indicating that there is significant variability in the level of the FtBES1 gene expression in different tissues at different times. The FtBES1-1 gene was mainly expressed in the roots, stems, and flowers at the flowering stage, and mainly in the stems and leaves at the seedling stage, indicating that FtBES1-1 is involved in the regulation of Tartary buckwheat throughout the growth developmental period. FtBES1-3 and FtBES1-7 genes during the seedling and flowering stage in the root were expressed at higher levels than those in the stem, indicating that these genes may play an important role in the growth of Tartary buckwheat roots. The same subgroup of FtBES1 genes with similar expression patterns such as FtBES1-6 and FtBES1-8, gene segmental duplication of genes for FtBES1-1 and FtBES1-2 in tissue specificity, demonstrated different expression patterns, indicating that gene segmental duplication is the main reason affecting the FtBES1 gene amplification and functional differentiation. Although the expression patterns and expression levels of different genes in different tissues are not consistent, the relatively high expression levels in different tissues suggest that these genes may be involved in the regulation of Tartary buckwheat growth and development.

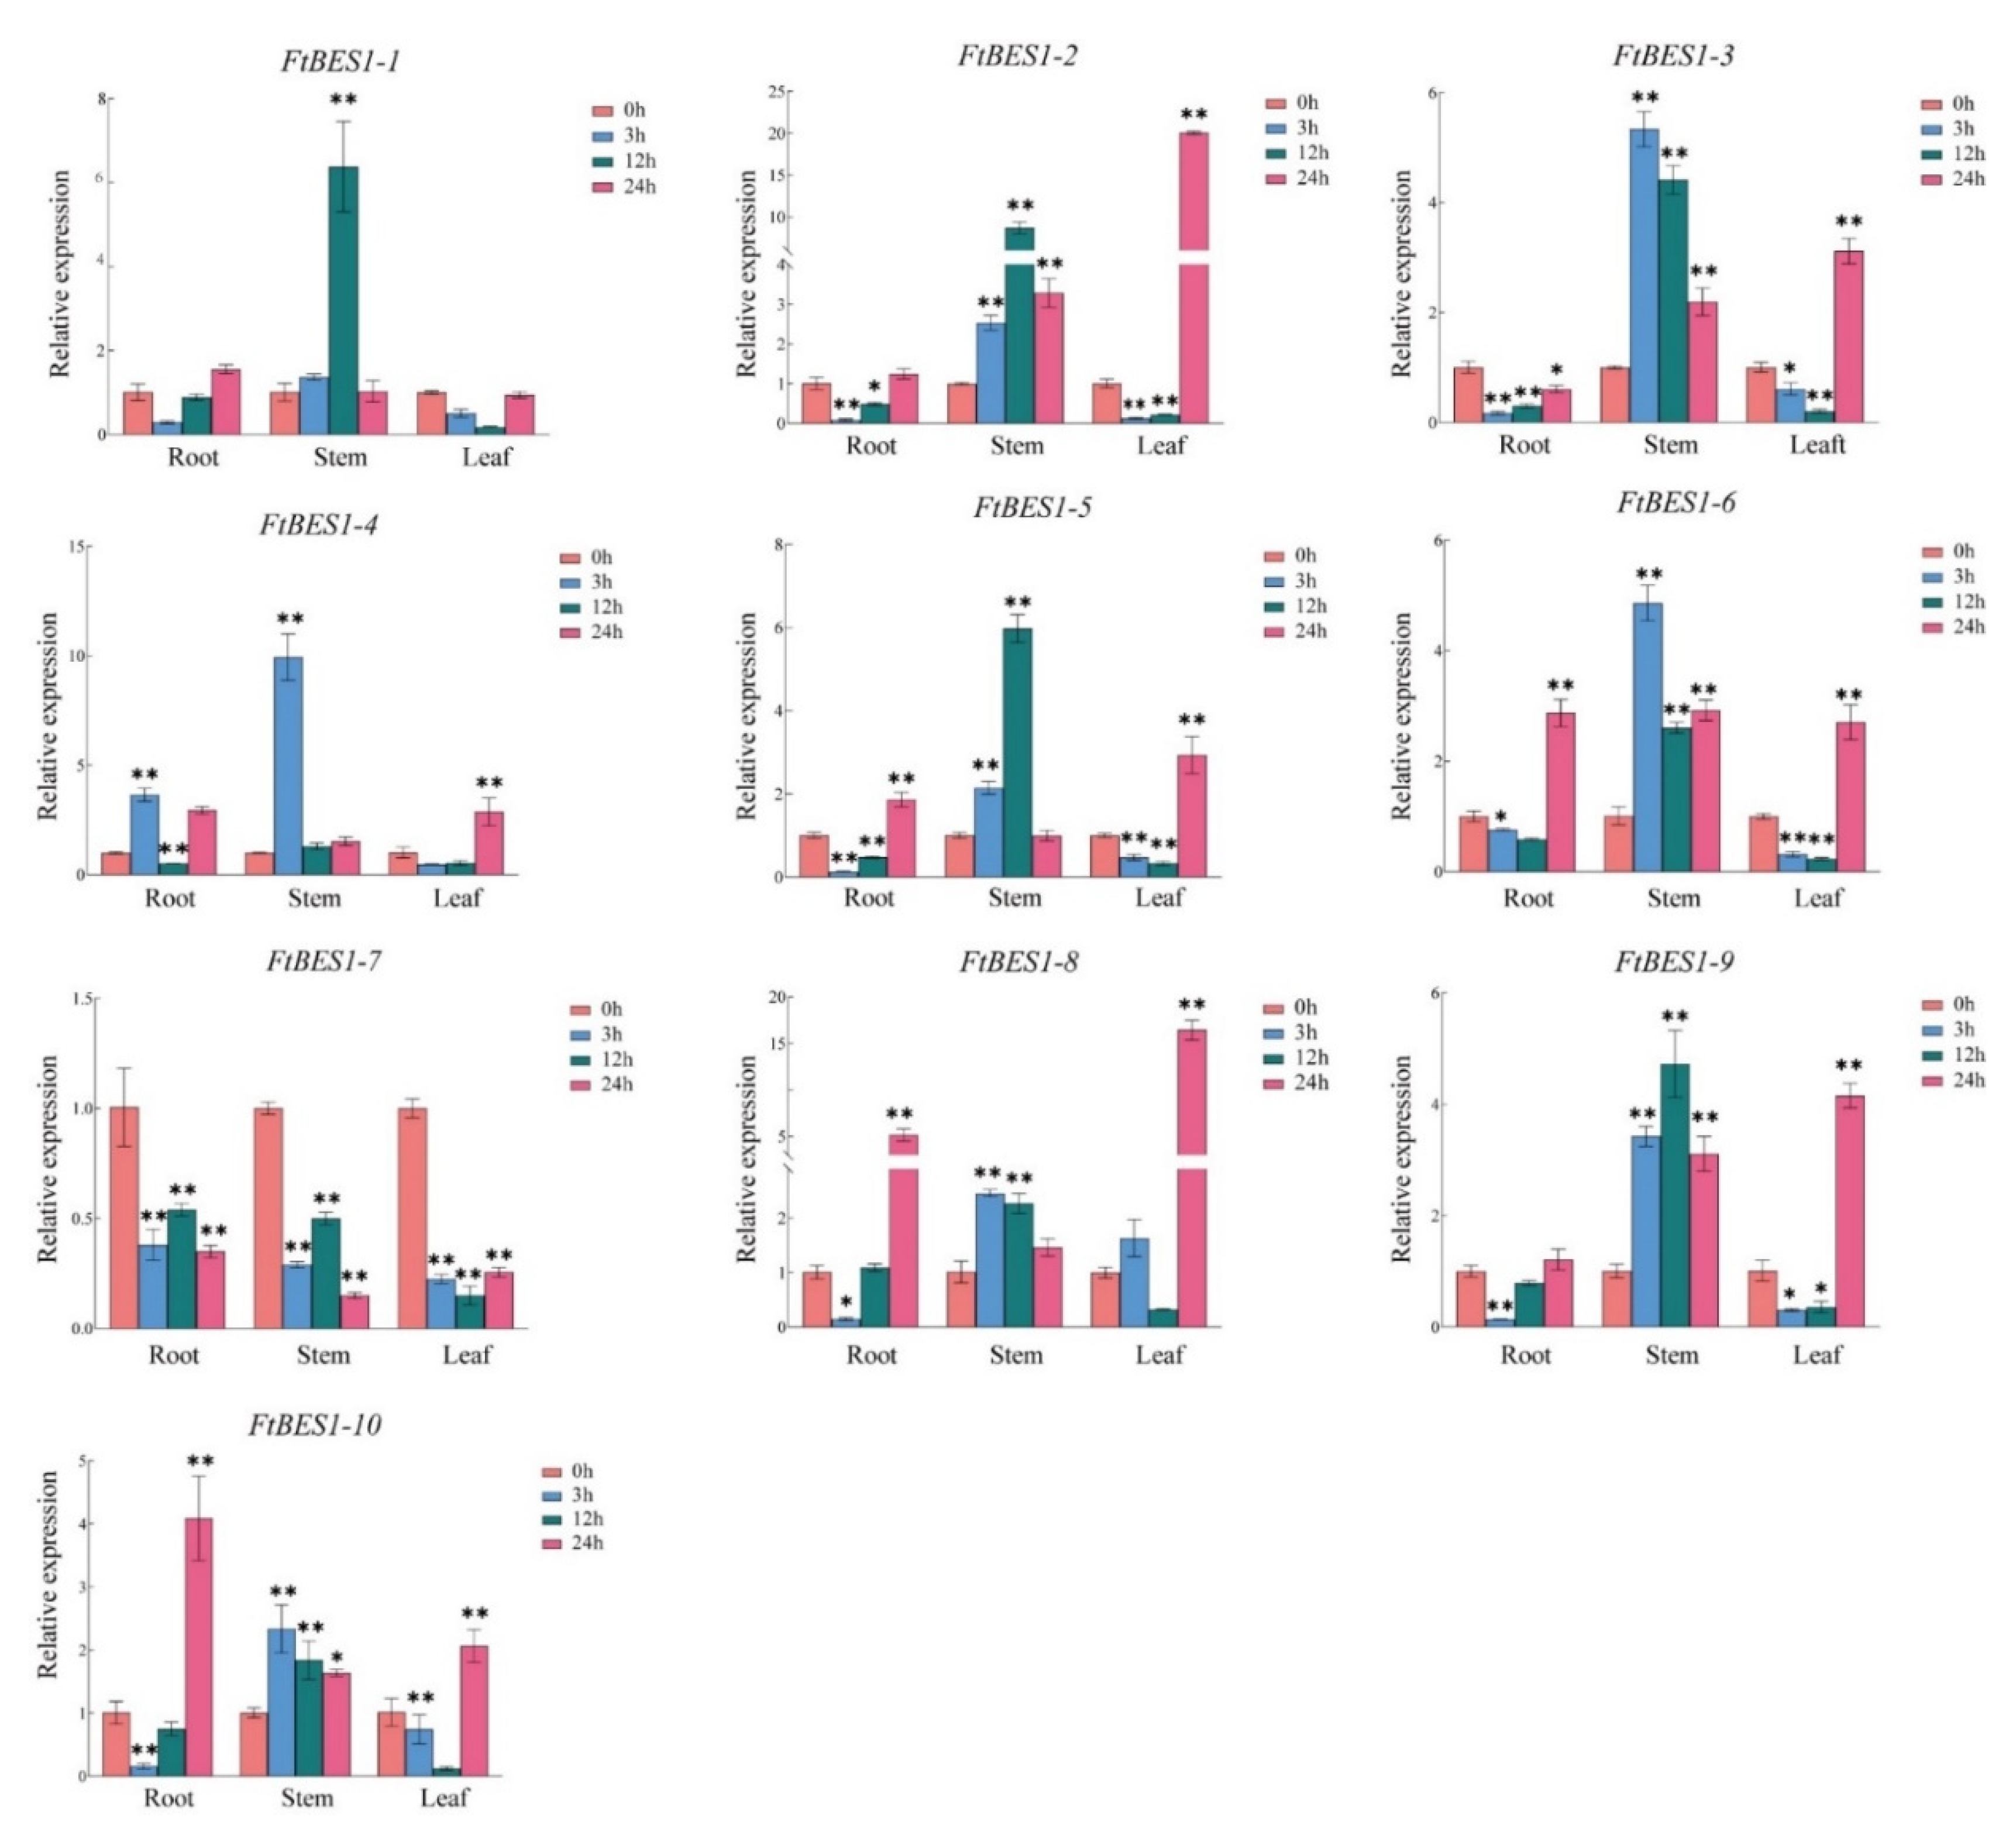
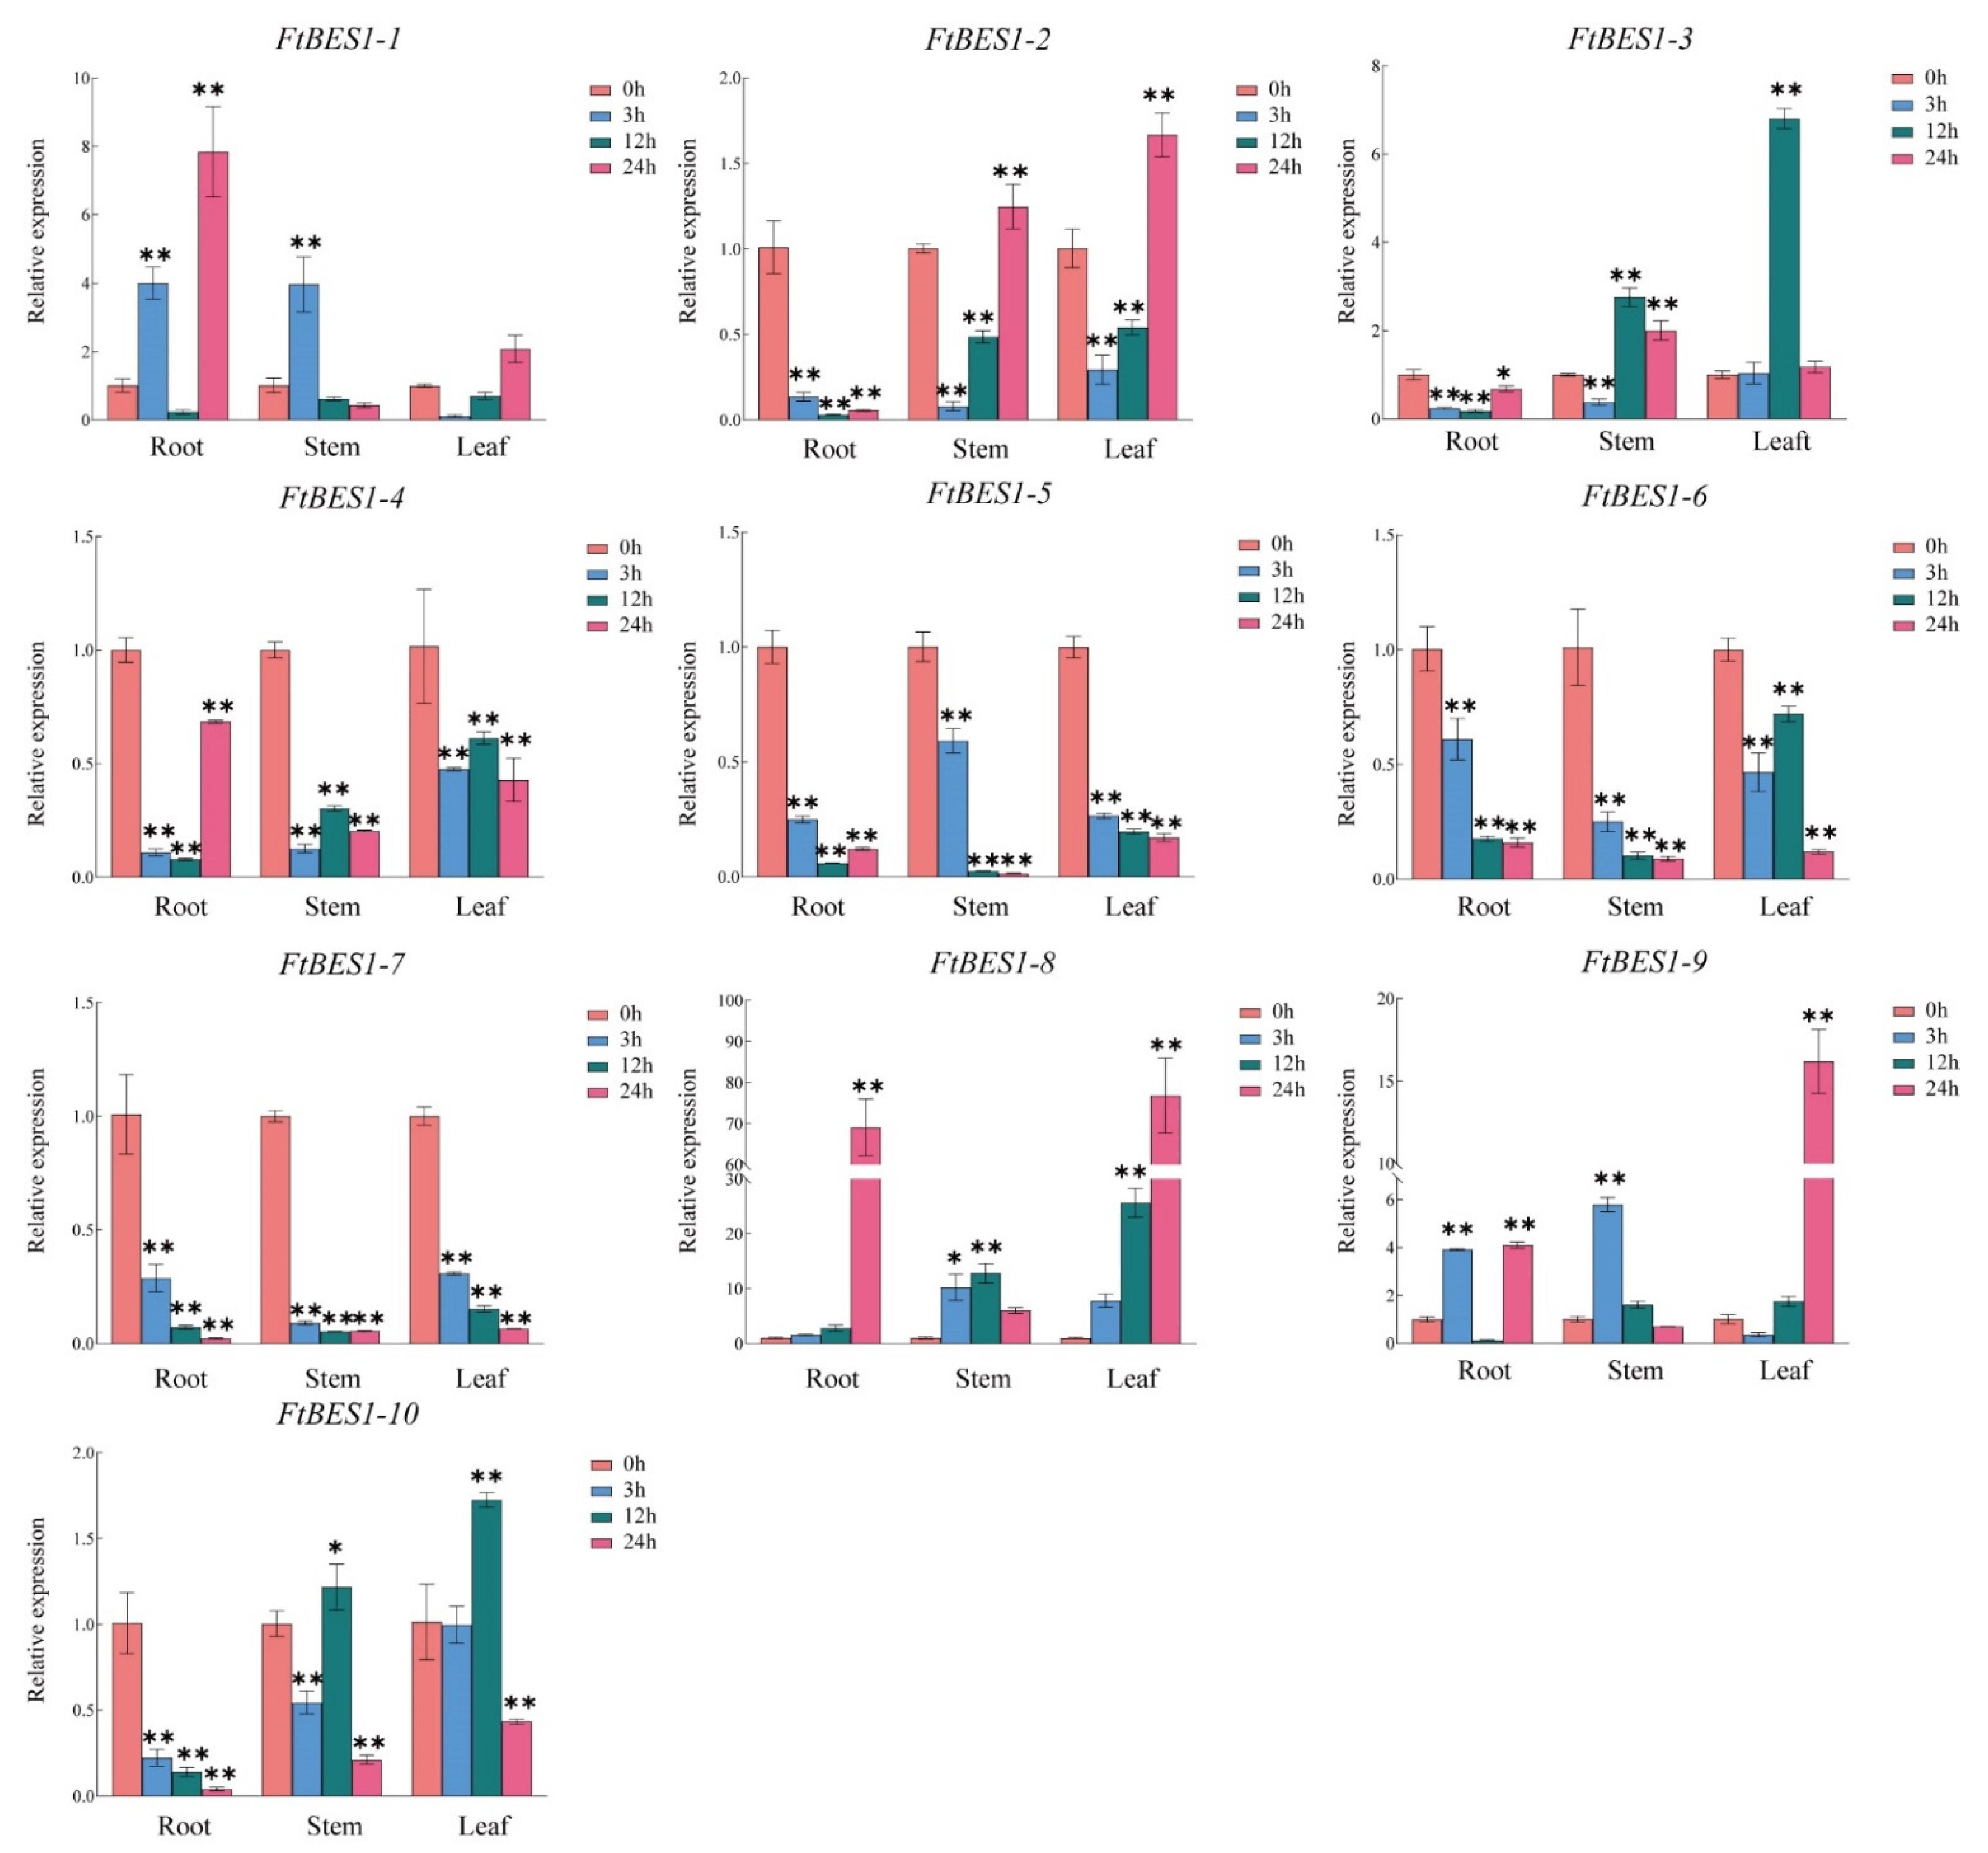
3.7. Expression Analysis of FtBES1 Gene in Response to Hormone Treatment

Promoter cis-acting element analysis of the FtBES1 genes revealed to contain ABA, MeJA, GA, and SA hormone response elements, indicating that the FtBES1 gene might respond to MeJA, GA, and SA jointly involved in the regulation of Tartary buckwheat growth and development. ABA, MeJA, GA, and SA regulate the growth and development of Tartary buckwheat. In order to further investigate the role of FtBES1 gene in the response mechanism of the four hormones, FtBES1 gene expression patterns were analyzed using the qRT-PCR analysis in the growth of two weeks Tartary buckwheat seedlings following ABA, MeJA, GA, and SA treatment for 3, 12, and 24 h. The analysis results (Figure 6, Figure 7, Figure 8 and Figure 9) demonstrated that different genes responded differently under different hormone treatments. Under ABA treatment, FtBES1-2 and FtBES1-8 genes had the highest expression levels in the leaves after 24 h of treatment compared to other genes. FtBES1-7 gene expression levels were significantly reduced in different tissues at each time period. Under GA treatment, the expression levels of FtBES1-5 and FtBES1-8 genes were highest in the leaves after 24 h of treatment. FtBES1-3 gene had the highest expression level in stems after 24 h of treatment under MeJA treatment. FtBES1-8 gene had the highest expression level in leaves after 24 h of treatment under SA treatment. Overall, FtBES1-8 and FtBES1-7 genes responded most evidently to ABA, GA, and SA hormones. FtBES1-8 was mainly expressed in the leaves in response to ABA, GA, and SA hormones, indicating its involvement in the leaves to regulate the growth and development of buckwheat, while FtBES1-7 gene expression levels were generally suppressed under ABA, MeJA, GA, and SA treatments.

4. Discussion

BRs are widespread steroid hormones in plants that play important roles in growth and development during stress [18]. BES1 is a key specific transcription factor in the downstream pathway of the BR signal transduction. BES1 TFs are commonly found in various plant tissues and participate in various physiological and biochemical functions in plants by regulating the genes of related pathways [7]. Numerous BES1 gene functions have been demonstrated in Arabidopsis [19], tobacco [20], rape (Brassica napus) [21], wheat [22], tomato [23], apple [24], cotton [25], and maize [26]. For example, Chen et al. [27] identified BZRs in Arabidopsis as an indispensable transcription factor required for BR signaling. TaBZR2 in wheat exhibits positive regulatory effects in BR signaling, and it interacts directly with the gene promoter to activate TaGST1 expression and plays an active role in drought response [28]. SlBZR1D positively regulates salt tolerance and upregulates the expression of several stress-related genes in the tomato, and the overexpression of SlBZR1D enhances the BR response in Arabidopsis [29]. In cotton, GhBZR3 was identified as a negatively regulated cell elongation gene that restricts cotton fiber development mainly by reducing the biosynthesis of very long chain fatty acids [30].
However, no BES1 gene has been reported in Tartary buckwheat; therefore, this study identified ten FtBES1 genes using its whole genome. Based on the Arabidopsis classification method, the ten FtBES1 genes were divided into four groups. The gene structure and motif analysis (Figure 2) demonstrated that the members of the first and fourth groups contained only one intron, and except for FtBES1-9 (which had one less motif 9), the number as well as the type of motif were consistent. The gene structure and motif of the members of the second group differed from the other three groups, in which the structure of FtBES1-7 member genes demonstrated no introns and only one motif 1, while FtBES1-6 and FtBES1-8 genes demonstrated different types of motifs compared with the other genes. Some events of addition or loss of introns (or motifs) may have occurred during the evolution of the genes, and the various structures may impact gene differentiation gene duplication and amplification, which are beneficial to improve species resistance and adaptation during evolution. An analysis of FtBES1 gene duplication events revealed that only one segmental duplication gene pair was found among FtBES1 gene members. This observation suggested that segmental duplication plays an important role in the FtBES1 gene family amplification, and the gene family may exhibit low evolutionary rates, which is consistent with the results obtained in the Brassica napus [21].
The cis-acting elements of promoter sequences play a crucial role in the regulation of gene expression profiles, and analysis of cis-acting elements of the FtBES1 gene allows further speculative dissection of its potential functions (Figure 3). The light responsive element was the most abundant element. Light signals and BRs are external and internal factors in plant growth and development, and both complement each other in many physiological responses in the plant life cycle. Together, they coordinate to regulate the growth and development of seedlings. The light-signaling PIF4 TFs and BZR1 interact to synergistically regulate a large number of target genes to promote responses to BR signals and cell growth, suggesting that plant growth can be regulated by a combination of hormonal and environmental signals [31]. Kim et al. [32] reported that the light-signaling repressor COP1 can capture and degrade the inactive form of BZR1, thereby promoting BR signaling and hypocotyl growth in Arabidopsis. Li et al. [33] demonstrated that Arabidopsis BZR1 interacts with the light-signaling promoter HY5 to regulate cotyledon development and promote seedling photomorphogenesis. In addition to light responsive elements, ABA, MeJA, GA, SA, and IAA hormone responsive elements, MYB, and stress responsive elements were also identified, indicating that the FtBES1 gene is involved in multiple stress responses. In addition, an MBSI element was found in FtBES1-9, which is mainly involved in flavonoid metabolism. Liang et al. [34] reported that BR, which induces active BES1, inhibits flavonol synthesis in Arabidopsis, whereas represses BES1 expression after binding to MYB11, MYB12, and MYB111 promoters, thereby enhancing flavonol biosynthesis. This suggests that FtBES1-9 may synergistically regulate the Tartary buckwheat flavonoid synthesis in combination with specific transcription factors or structural genes in the flavonoid metabolic pathway. BES1 regulates physiological responses throughout the life cycle of plants. Analysis of the expression pattern of FtBES1 in different tissues at different times demonstrated that most of the genes were expressed at high levels in leaves and in stems at the flowering and seedling stage, respectively, indicating that the FtBES1 gene at different times may play different biological functions in Tartary buckwheat growth.
BR signaling interacts with other signaling pathways to regulate plant growth and development, and BES1 transcription factors bind to the promoters of key genes in other signaling pathways, resulting in different response mechanisms in plant growth, BR biosynthesis, and abiotic stresses [35]. Analysis of FtBES1 cis-acting elements revealed hormone responsive elements such as ABA, MeJA, GA, and SA. BR and ABA signaling can jointly regulate and control the expression of hundreds of genes to regulate plant growth and development. The BES1-mediated BR signaling pathway specifically attenuates ABA signaling during early seedling development, and the BR-activated BES1-TPL-HDA19 repressor complex inhibits ABI3 transcription, thereby promoting seedling development [12]. Roots are a major source of BR signaling, and BES1-mediated BR regulates root stem cell maintenance and differentiation by regulating root growth and development [36]. In our study, at 24 h of ABA treatment, root and stem expression levels were significantly upregulated in the most pronounced response, except for FtBES1-7, which was significantly reduced in each tissue type under ABA treatment. Therefore, we hypothesized that, in addition to FtBES1-7, exogenous ABA upregulated FtBES1 gene-mediated BR signaling to regulate buckwheat root and stem growth, which is consistent with the results obtained in rubber trees [37]. BR and GA are the main hormones that promote seedling growth, and the transcription factors downstream of these two signaling pathways are interrelated and integrate information from the plant growth network [38]. In Arabidopsis, BR promotes plant growth by inducing the GA biosynthesis gene GA20ox to upregulate GA levels [39]. In rice, BR promotes cell elongation and GA accumulation by regulating the expression of the GA metabolism genes [40]. BR promotes cell elongation by regulating the GA content and cellulose accumulation in carrot petioles [41]. Tomato SlBES1.8 represses SlGA2ox2 and SlGA2ox6 transcripts, thereby affecting tomato leaf morphogenesis [42]. In this study, exogenous GA treatment for 3 h significantly upregulated FtBES1 gene expression levels in stems, except for the FtBES1-7 gene, and GA treatment for 24 h significantly upregulated FtBES1 gene expression levels in roots and stems. This indicates that exogenous GA may upregulate the FtBES1 gene expression and thus regulate the Tartary buckwheat growth. In addition to being essential plant hormones for plant growth and development, MeJA and SA are also involved in the synthesis of secondary metabolites. In Tartary buckwheat, exogenous MeJA and SA play an important role in promoting the anabolic pathway of flavonoid substances [43,44]. The expression levels of FtBES1 under MeJA and SA treatment (Figure 8 and Figure 9) in this study is consistent with the result of a previous study in tomatoes, where different FtBES1 genes were induced to different degrees [23]. This indicates that there may be a mechanism of action between MeJA and SA signaling and BR signaling to regulate plant growth, which needs to be explored in further studies. Overall, FtBES1-7 gene expression levels were significantly reduced in different tissues under the four hormone treatments, which may be negatively regulated by ABA, GA, MeJA, and SA involved in BR signaling to regulate the growth and development of Tartary buckwheat.

5. Conclusions

In this study, we analyzed all FtBES1 genes through the whole genome, and analyzed phylogenetic relationships, gene structure, cis-acting elements, and gene replication. A total of ten FtBES1 gene family members were identified, with their genes divided into four groups; members of the FtBES1 gene in the same group have the same domain and motif. Segmental duplication plays an important role in the FtBES1 gene family amplification. In addition, we analyzed the expression patterns of these genes in tissue-specific and four hormone stresses, indicating that FtBES1 has an important role in the regulation of plant growth and development as well as in hormone stress responses. This is the first report to identify BES1 genes in Tartary buckwheat. The comprehensive analysis of FtBES1 can further provide insight about their function and molecular breeding of Tartary buckwheat.

Supplementary Materials

The following supporting information can be downloaded at: https://0-www-mdpi-com.brum.beds.ac.uk/article/10.3390/agronomy12112729/s1, and includes Tables S1–S3.

Author Contributions

Experimental design, A.G. and J.R.; data analysis, A.G., C.M. and W.W. (Weijiao Wu); validation, Q.B., J.R. and J.C.; charting, X.Y., A.G. and C.M.; first draft, A.G., R.X. and W.W. (Wenfeng Weng); edited and revised paper, J.R. and A.G. All authors have read and agreed to the published version of the manuscript.

Funding

This work was supported by the National Science Foundation of China (32161143005, 32160669), and the Guizhou Science and Technology Support Program (Qian Ke He Support [2020] 1Y051).

Data Availability Statement

Data are contained within the article or in Supplementary Materials.

Acknowledgments

We acknowledge the College of Agronomy, Guizhou University, Guiyang, China, for providing the experimental facilities and other necessary materials for this study. We are also thankful for the Fagopyrum tataricum breeders provided by the Institute of Crop Science, Chinese Academy of Agriculture Science, Beijing, China.

Conflicts of Interest

The authors declare no conflict of interest.

References

  1. Gonzalez-Garcia, M.P.; Vilarrasa-Blasi, J.; Zhiponova, M.; Divol, F.; Mora-Garcia, S.; Russinova, E.; Cano-Delgado, A.I. Brassinosteroids control meristem size by promoting cell cycle progression in Arabidopsis roots. Development 2011, 138, 849–859. [Google Scholar] [CrossRef] [PubMed] [Green Version]
  2. Wang, Z.Y.; Bai, M.Y.; Oh, E.; Zhu, J.Y. Brassinosteroid signaling network and regulation of photomorphogenesis. Annu. Rev. Genet. 2012, 46, 701–724. [Google Scholar] [CrossRef] [PubMed]
  3. Yu, X.F.; Li, L.; Zola, J.; Aluru, M.; Ye, H.X.; Foudree, A.; Guo, H.Q.; Anderson, S.; Aluru, S.; Liu, P.; et al. A brassinosteroid transcriptional network revealed by genome-wide identification of BESI target genes in Arabidopsis thaliana. Plant J. 2011, 65, 634–646. [Google Scholar] [CrossRef]
  4. Yin, Y.; Vafeados, D.; Tao, Y.; Yoshida, S.; Asami, T.; Chory, J. A new class of transcription factors mediates brassinosteroid-regulated gene expression in Arabidopsis. Cell 2005, 120, 249–259. [Google Scholar] [CrossRef] [Green Version]
  5. Clouse, S.D. Brassinosteroid signal transduction: From receptor kinase activation to transcriptional networks regulating plant development. Plant Cell 2011, 23, 1219–1230. [Google Scholar] [CrossRef] [PubMed] [Green Version]
  6. Yang, C.J.; Zhang, C.; Lu, Y.N.; Jin, J.Q.; Wang, X.L. The mechanisms of brassinosteroids’ action: From signal transduction to plant development. Mol. Plant 2011, 4, 588–600. [Google Scholar] [CrossRef] [Green Version]
  7. Li, L.; Yu, X.F.; Thompson, A.; Guo, M.; Yoshida, S.; Asami, T.; Chory, J.; Yin, Y. Arabidopsis MYB30 is a direct target of BES1 and cooperates with BES1 to regulate brassinosteroid-induced gene expression. Plant J. 2009, 58, 275–286. [Google Scholar] [CrossRef] [Green Version]
  8. Guo, R.F.; Qian, H.M.; Shen, W.S.; Liu, L.H.; Zhang, M.; Cai, C.X.; Zhao, Y.T.; Qiao, J.J.; Wang, Q.M. BZR1 and BES1 participate in regulation of glucosinolate biosynthesis by brassinosteroids in Arabidopsis. J. Exp. Bot. 2013, 64, 2401–2412. [Google Scholar] [CrossRef] [Green Version]
  9. Chen, J.N.; Nolan, T.M.; Ye, H.X.; Zhang, M.C.; Tong, H.N.; Xin, P.Y.; Chu, J.F.; Chu, C.C.; Li, Z.H.; Yin, Y.H. Arabidopsis WRKY46, WRKY54, and WRKY70 Transcription Factors Are Involved in Brassinosteroid-Regulated Plant Growth and Drought Responses. Plant Cell 2017, 29, 1425–1439. [Google Scholar] [CrossRef] [Green Version]
  10. Zhang, T.; Xu, P.; Wang, W.; Wang, S.; Caruana, J.C.; Yang, H.Q.; Lian, H. Arabidopsis G-Protein beta Subunit AGB1 Interacts with BES1 to Regulate Brassinosteroid Signaling and Cell Elongation. Front. Plant Sci. 2017, 8, 2225. [Google Scholar] [CrossRef]
  11. Ye, H.X.; Liu, S.Z.; Tang, B.Y.; Chen, J.N.; Xie, Z.L.; Nolan, T.M.; Jiang, H.; Guo, H.Q.; Lin, H.Y.; Li, L.; et al. RD26 mediates crosstalk between drought and brassinosteroid signalling pathways. Nat. Commun. 2017, 8, 13. [Google Scholar] [CrossRef] [Green Version]
  12. Ryu, H.; Cho, H.; Bae, W.; Hwang, I. Control of early seedling development by BES1/TPL/HDA19-mediated epigenetic regulation of ABI3. Nat. Commun. 2014, 5, 4138. [Google Scholar] [CrossRef] [PubMed] [Green Version]
  13. Zhao, X.; Dou, L.R.; Gong, Z.Z.; Wang, X.F.; Mao, T.L. BES1 hinders ABSCISIC ACID INSENSITIVE5 and promotes seed germination in Arabidopsis. New Phytol. 2019, 221, 908–918. [Google Scholar] [CrossRef] [PubMed] [Green Version]
  14. Wu, J.; Wang, W.X.; Xu, P.B.; Pan, J.; Zhang, T.; Li, Y.; Li, G.W.; Yang, H.Q.; Lian, H.L. phyB Interacts with BES1 to Regulate Brassinosteroid Signaling in Arabidopsis. Plant Cell Physiol. 2019, 60, 353–366. [Google Scholar] [CrossRef]
  15. Wang, Y.; Sun, S.Y.; Zhu, W.J.; Jia, K.P.; Yang, H.Q.; Wang, X.L. Strigolactone/MAX2-Induced Degradation of Brassinosteroid Transcriptional Effector BES1 Regulates Shoot Branching. Dev. Cell 2013, 27, 681–688. [Google Scholar] [CrossRef] [PubMed] [Green Version]
  16. Albertos, P.; Dündar, G.; Schenk, P.; Carrera, S.; Cavelius, P.; Sieberer, T.; Poppenberger, B. Transcription factor BES1 interacts with HSFA1 to promote heat stress resistance of plants. EMBO J. 2022, 41, e108664. [Google Scholar] [CrossRef]
  17. Chen, C.J.; Chen, H.; Zhang, Y.; Thomas, H.R.; Frank, M.H.; He, Y.H.; Xia, R. TBtools: An Integrative Toolkit Developed for Interactive Analyses of Big Biological Data. Mol. Plant 2020, 13, 1194–1202. [Google Scholar] [CrossRef]
  18. Jiang, J.J.; Zhang, C.; Wang, X.L. A Recently Evolved Isoform of the Transcription Factor BES1 Promotes Brassinosteroid Signaling and Development in Arabidopsis thaliana. Plant Cell 2015, 27, 361–374. [Google Scholar] [CrossRef] [Green Version]
  19. Yin, Y.; Wang, Z.Y.; Mora-Garcia, S.; Li, J.; Yoshida, S.; Asami, T.; Chory, J. BES1 accumulates in the nucleus in response to brassinosteroids to regulate gene expression and promote stem elongation. Cell 2002, 109, 181–191. [Google Scholar] [CrossRef] [Green Version]
  20. Chen, X.W.; Wu, X.Y.; Qiu, S.Y.; Zheng, H.Y.; Lu, Y.W.; Peng, J.J.; Wu, G.W.; Chen, J.P.; Rao, S.F.; Yan, F. Genome-Wide Identification and Expression Profiling of the BZR Transcription Factor Gene Family in Nicotiana benthamiana. Int. J. Mol. Sci. 2021, 22, 10379. [Google Scholar] [CrossRef]
  21. Sarwar, R.; Geng, R.; Li, L.; Shan, Y.; Zhu, K.M.; Wang, J.; Tan, X.L. Genome-Wide Prediction, Functional Divergence, and Characterization of Stress-Responsive BZR Transcription Factors in B. napus. Front. Plant Sci. 2021, 12, 790655. [Google Scholar] [CrossRef] [PubMed]
  22. Liu, D.; Cui, Y.J.; Zhao, Z.L.; Li, S.Y.; Liang, D.; Wang, C.L.; Feng, G.; Wang, J.H.; Liu, Z.L. Genome-wide identification and characterization of the BES/BZR gene family in wheat and foxtail millet. BMC Genom. 2021, 22, 14. [Google Scholar] [CrossRef] [PubMed]
  23. Su, D.D.; Xiang, W.; Wen, L.; Lu, W.; Shi, Y.; Liu, Y.D.; Li, Z.G. Genome-wide identification, characterization and expression analysis of BES1 gene family in tomato. BMC Plant Biol. 2021, 21, 17. [Google Scholar] [CrossRef] [PubMed]
  24. Cao, X.; Khaliq, A.; Lu, S.; Xie, M.; Ma, Z.; Mao, J.; Chen, B. Genome-wide identification and characterization of the BES1 gene family in apple (Malus domestica). Plant Biol. 2020, 22, 723–733. [Google Scholar] [CrossRef] [PubMed]
  25. Liu, Z.; Qanmber, G.; Lu, L.L.; Qin, W.Q.; Liu, J.; Li, J.; Ma, S.Y.; Yang, Z.E.; Yang, Z.R. Genome-wide analysis of BES1 genes in Gossypium revealed their evolutionary conserved roles in brassinosteroid signaling. Sci. China Life Sci. 2018, 61, 1566–1582. [Google Scholar] [CrossRef] [PubMed]
  26. Yu, H.; Feng, W.; Sun, F.; Zhang, Y.; Qu, J.; Liu, B.; Lu, F.; Yang, L.; Fu, F.; Li, W. Cloning and characterization of BES1/BZR1 transcription factor genes in maize. Plant Growth Regul. 2018, 86, 235–249. [Google Scholar] [CrossRef]
  27. Chen, L.-G.; Gao, Z.; Zhao, Z.; Liu, X.; Li, Y.; Zhang, Y.; Liu, X.; Sun, Y.; Tang, W. BZR1 Family Transcription Factors Function Redundantly and Indispensably in BR Signaling but Exhibit BRI1-Independent Function in Regulating Anther Development in Arabidopsis. Mol. Plant 2019, 12, 1408–1415. [Google Scholar] [CrossRef]
  28. Cui, X.Y.; Gao, Y.; Guo, J.; Yu, T.F.; Zheng, W.J.; Liu, Y.W.; Chen, J.; Xu, Z.S.; Ma, Y.Z. BES/BZR Transcription Factor TaBZR2 Positively Regulates Drought Responses by Activation of TaGST1. Plant Physiol. 2019, 180, 605–620. [Google Scholar] [CrossRef] [Green Version]
  29. Jia, C.G.; Zhao, S.K.; Bao, T.T.; Zhao, P.Q.; Peng, K.; Guo, Q.X.; Gao, X.; Qin, J.C. Tomato BZR/BES transcription factor SlBZR1 positively regulates BR signaling and salt stress tolerance in tomato and Arabidopsis. Plant Sci. 2021, 302, 110719. [Google Scholar] [CrossRef]
  30. Shi, Z.M.; Chen, X.; Xue, H.D.; Jia, T.T.; Meng, F.N.; Liu, Y.F.; Luo, X.M.; Xiao, G.H.; Zhu, S.W. GhBZR3 suppresses cotton fiber elongation by inhibiting very-long-chain fatty acid biosynthesis. Plant J. 2022, 111, 785–799. [Google Scholar] [CrossRef]
  31. Oh, E.; Zhu, J.Y.; Wang, Z.Y. Interaction between BZR1 and PIF4 integrates brassinosteroid and environmental responses. Nat. Cell Biol. 2012, 14, 802–809. [Google Scholar] [CrossRef] [PubMed] [Green Version]
  32. Kim, B.; Jeong, Y.J.; Corvalan, C.; Fujioka, S.; Cho, S.; Park, T.; Choe, S. Darkness and gulliver2/phyB mutation decrease the abundance of phosphorylated BZR1 to activate brassinosteroid signaling in Arabidopsis. Plant J. 2014, 77, 737–747. [Google Scholar] [CrossRef] [PubMed] [Green Version]
  33. Li, Q.F.; He, J.X. BZR1 Interacts with HY5 to Mediate Brassinosteroid- and Light-Regulated Cotyledon Opening in Arabidopsis in Darkness. Mol. Plant 2016, 9, 113–125. [Google Scholar] [CrossRef] [PubMed] [Green Version]
  34. Liang, T.; Shi, C.; Peng, Y.; Tan, H.; Xin, P.; Yang, Y.; Wang, F.; Li, X.; Chu, J.; Huang, J.; et al. Brassinosteroid-Activated BRI1-EMS-SUPPRESSOR 1 Inhibits Flavonoid Biosynthesis and Coordinates Growth and UV-B Stress Responses in Plants. Plant Cell 2020, 32, 3224–3239. [Google Scholar] [CrossRef]
  35. Guo, H.Q.; Li, L.; Aluru, M.; Aluru, S.; Yin, Y.H. Mechanisms and networks for brassinosteroid regulated gene expression. Curr. Opin. Plant Biol. 2013, 16, 545–553. [Google Scholar] [CrossRef] [PubMed]
  36. Kim, Y.; Song, J.H.; Park, S.U.; Jeong, Y.S.; Kim, S.H. Brassinosteroid-Induced Transcriptional Repression and Dephosphorylation-Dependent Protein Degradation Negatively Regulate BIN2-Interacting AIF2 (a BR Signaling-Negative Regulator) bHLH Transcription Factor. Plant Cell Physiol. 2017, 58, 227–239. [Google Scholar] [CrossRef] [Green Version]
  37. Guo, B.; Yang, H.; Dai, L.; Zhao, X.; Wang, L.F. Genome-wide identification and response stress expression analysis of the BES1 family in rubber tree (Hevea brasiliensis Muell. Arg.). PeerJ 2022, 10, e13189. [Google Scholar] [CrossRef]
  38. Lilley, J.L.S.; Gan, Y.B.; Graham, I.A.; Nemhauser, J.L. The effects of DELLAs on growth change with developmental stage and brassinosteroid levels. Plant J. 2013, 76, 165–173. [Google Scholar]
  39. Unterholzner, S.J.; Rozhon, W.; Papacek, M.; Ciomas, J.; Lange, T.; Kugler, K.G.; Mayer, K.F.; Sieberer, T.; Poppenberger, B. Brassinosteroids Are Master Regulators of Gibberellin Biosynthesis in Arabidopsis. Plant Cell 2015, 27, 2261–2272. [Google Scholar] [CrossRef] [Green Version]
  40. Tong, H.N.; Xiao, Y.H.; Liu, D.P.; Gao, S.P.; Liu, L.C.; Yin, Y.H.; Jin, Y.; Qian, Q.; Chu, C.C. Brassinosteroid Regulates Cell Elongation by Modulating Gibberellin Metabolism in Rice. Plant Cell 2014, 26, 4376–4393. [Google Scholar] [CrossRef] [Green Version]
  41. Que, F.; Khadr, A.; Wang, G.L.; Li, T.; Wang, Y.H.; Xu, Z.S.; Xiong, A.S. Exogenous brassinosteroids altered cell length, gibberellin content, and cellulose deposition in promoting carrot petiole elongation. Plant Sci. 2018, 277, 110–120. [Google Scholar] [CrossRef] [PubMed]
  42. Su, D.D.; Xiang, W.; Liang, Q.; Wen, L.; Shi, Y.; Song, B.Q.; Liu, Y.D.; Xian, Z.Q.; Li, Z.G. Tomato SlBES1.8 Influences Leaf Morphogenesis by Mediating Gibberellin Metabolism and Signaling. Plant Cell Physiol. 2022, 63, 535–549. [Google Scholar] [CrossRef] [PubMed]
  43. Ding, M.Q.; He, Y.Q.; Zhang, K.X.; Li, J.B.; Shi, Y.L.; Zhao, M.Y.; Meng, Y.; Georgiev, M.I.; Zhou, M.L. JA-induced FtBPM3 accumulation promotes FtERF-EAR3 degradation and rutin biosynthesis in Tartary buckwheat. Plant J. 2022, 111, 323–334. [Google Scholar] [CrossRef] [PubMed]
  44. Sun, Z.; Hou, S.; Yang, W.; Han, Y. Exogenous application of salicylic acid enhanced the rutin accumulation and influenced the expression patterns of rutin biosynthesis related genes in Fagopyrum tartaricum Gaertn leaves. Plant Growth Regul. 2012, 68, 9–15. [Google Scholar] [CrossRef]
Figure 1. (A) Phylogenetic trees of the BES1 genes of Tartary buckwheat, Arabidopsis, tomato, tobacco, and rice. Neighbor joining evolutionary trees with 1000 replicate values were constructed using MEGA7.0 and embellished using the online tool Chiplot. BES1 gene family members were divided into four categories and represented using different colors, and BES1 gene members of different species were distinguished using different icons. (B) Multiple sequence alignment of BES1 proteins in Tartary buckwheat and Arabidopsis. The blue line represents N-terminal DUF822. The black line represents basic-helix1-loop-helix2 (bHLH) and PEST domain. * Indicates an interval of 10 amino acids.
Agronomy 12 02729 g001aAgronomy 12 02729 g001b
Figure 2. Phylogenetic tree, gene structure map, and motif analysis of FtBES1 gene members. (A) Phylogenetic tree of FtBES1 gene members with a duplicate value of 1000 using MEGA7.0 soft armor was constructed. (B) Gene structure of Tartary buckwheat FtBES1, green box indicates 5′ and 3′ end UTRs, yellow box indicates exons, black line indicates introns, and blue box indicates structural domain BES1_N. (C) Motif composition of Tartary buckwheat FtBES1 protein; different motifs are indicated by different colors. (D) Sequence logo of the FtBES1 proteins motifs.
Agronomy 12 02729 g002
Figure 3. (A) Analysis of cis-acting elements of FtBES1 gene promoter; different colors indicate different elements. (B) List of functions for each cis-element.
Agronomy 12 02729 g003
Figure 4. FtBES1 chromosome localization, genome duplication and covariance of BES1 between buckwheat FtBES1 and different species. (A) Distribution of FtBES1 gene in Tartary buckwheat chromosomes. (B) Analysis of covariance within the Tartary buckwheat FtBES1, the same color indicates the Tartary buckwheat chromosomes in the duplication of segments. The gray background indicates the Tartary buckwheat genome common line region and Tartary buckwheat each chromosome with a different color distinction; the outer circle indicates the chromosomal gene density. (C) Analysis of covariance between Tartary buckwheat FtBES1 and Arabidopsis, tomato and grape. Red lines indicate covariance BES1 gene pairs; gray lines indicate covariance gene pairs in the genomes of Tartary buckwheat, Arabidopsis, tomato and grape.
Agronomy 12 02729 g004
Figure 5. Expression levels of FtBES1 gene in different tissues at two different periods. YL; young leaf; YS: young stem; YL: young root; F: Flower; S: Stem; L: Leaf; R: Root. The average expression values of different tissues at two different periods were calculated from three independent biological replicates relative to the root expression levels.
Agronomy 12 02729 g005
Figure 6. Expression levels of FtBES1 gene in different tissues after 100 μM ABA treatment. Different colors indicate different times of stress treatment. Three biological replicates were considered for each experiment. Error lines indicate standard errors of three independent biological replicates. * In the figure indicates significant differences calculated by t-test (* p < 0.05, ** p < 0.01).
Agronomy 12 02729 g006
Figure 7. Expression levels of FtBES1 gene in different tissues after 100 μM GA treatment. Different colors indicate different time of stress treatment. Three biological replicates were considered for each experiment. Error lines indicate standard errors of three independent biological replicates. * In the figure indicates significant differences calculated by t-test (* p < 0.05, ** p < 0.01).
Agronomy 12 02729 g007
Figure 8. Expression levels of FtBES1 gene in different tissues after 100 μM MeJA treatment. Different colors indicate different time of stress treatment. Three biological replicates were considered for each experiment. Error lines indicate the standard error of three independent biological replicates. * In the figure indicates significant differences calculated by t-test (* p < 0.05, ** p < 0.01).
Agronomy 12 02729 g008
Figure 9. Expression levels of FtBES1 gene in different tissues after 100 μM SA treatment. Different colors indicate different time of stress treatment. Three biological replicates were considered for each experiment. Error lines indicate standard errors of three independent biological replicates. * In the figure indicates significant differences calculated by t-test (* p < 0.05, ** p < 0.01).
Agronomy 12 02729 g009
Table 1. Physicochemical properties of FtBES1 gene family members.
Gene NameFull Length
(bp)
CDS
(bp)
Amino Acid (aa)MolecularpIGRAVYPredicted Subcellular LocalizationAlpha HelixBeta Turn Random Coil
FtBES1-1139190330032,678.698.1−0.573Nucleus14.33%3.33%70.67%
FtBES1-2152193331034,426.719.25−0.66Nucleus13.23%4.52%73.87%
FtBES1-3315396031934,435.377.1−0.645Nucleus17.87%5.02%69.91%
FtBES1-4130393931234,388.889.03−0.604Nucleus19.87%5.77%67.31%
FtBES1-5206596932234,830.48.29−0.725Nucleus14.91%6.52%66.77%
FtBES1-67386210069978,544.065.69−0.476Nucleus34.76%6.58%45.64%
FtBES1-73152919611,16310.52−0.644Nucleus36.46%13.54%34.38%
FtBES1-85353176458766,318.775.24−0.32Nucleus31.86%6.64%49.57%
FtBES1-9148292430733,720.088.36−0.585Nucleus14.98%5.21%70.68%
FtBES1-10375697832534,807.818.45−5.02Nucleus16.92%4.31%68.62%
Publisher’s Note: MDPI stays neutral with regard to jurisdictional claims in published maps and institutional affiliations.

