Article

A Two-Year Study on Yield and Yield Components of Maize-White Bean Intercropping Systems under Different Sowing Techniques

1
College of Economics and Management, Northeast Agricultural University, Harbin 150030, China
2
Department of Agriculture, Biological, Environment and Energy Engineering, College of Engineering, Northeast Agricultural University, Harbin 150030, China
3
Faculty of Agricultural Engineering & Technology, PMAS-Arid Agriculture University, Rawalpindi 46000, Pakistan
4
Department of Plant Breeding and Genetics, University of Agriculture, Faisalabad 38040, Pakistan
5
School of Economics and Management, Chongqing University of Arts and Sciences, Chongqing 402160, China
6
Department of Agricultural Engineering, Khwaja Fareed University of Engineering and Information Technology, Rahim Yar Khan 64200, Pakistan
7
Department of Chemistry, College of Science, King Khalid University, Abha 61413, Saudi Arabia
*
Author to whom correspondence should be addressed.
Submission received: 14 August 2021 / Revised: 10 January 2022 / Accepted: 13 January 2022 / Published: 18 January 2022

Abstract

:
Food security is directly coupled with enhanced production under optimized cropping intensity. Intercropping is a diversified and sustainable agricultural technique with optimized cropping intensity. Intercropping is used to obtain a higher yield and more balanced products per unit area. This study was performed at Aidyn Research Institute, Nur Sultan, Kazakhstan, in 2018 and 2019 to identify the effects of different sowing patterns on maize-white bean (Zea mays–Phaseolus vulgaris) sowing systems. The field experiment was arranged in a randomized complete block design with three replications. Göynük-98 was used for white beans, and SY Miami was used for maize, with 20 cm and 40 cm row spaces for maize, and 10 cm and 20 cm row spaces for white bean and sole maize, sole white bean, maize-white bean-maize-white bean, maize-white bean-white bean-maize and white bean-maize-maize-white bean sowing systems. The results showed that wide row spacing was better than narrow row spacing in terms of land equivalent ratio (LER) for both maize and white beans, but grain yield was higher in narrow row spacing. Yield items for both maize and white beans showed higher values in intercropping. Grain yield was higher in sole sowing. The maize-white bean-white bean-maize sowing system for maize and the white bean-maize-maize-white bean sowing system for white beans were determined as the best sowing systems according to the yield components.

1. Introduction

Intercropping is a sustainable agricultural technique employed to yield more balanced products by sowing multiple crops in the same field; it is also termed polyculture or mixed cropping [1]. It is an economically viable agricultural production technique within a sustainable agricultural system [2]. Intercropping is commonly used in small landholder farmers in developing countries due to its higher land and nutrient use efficiency [3,4], as well as a lower occurrence of pests and disease [5,6] compared with sole crops [7,8]. The most apparent advantage of sowing two crops in the same field and season is the significant risk reduction caused by total product loss, market instability and improved cropping intensity [9]. Intercropping is used to obtain a higher yield and more balanced products from the unit area and to decrease the production of weeds [10].
Various studies have been undertaken on cereal/legume sowing systems through field investigations in Latin America, Africa, Europe and Asia [11,12,13,14]. These studies have exhibited that intercropping has yield advantages produced through the processes of interspecific cooperation (or complementarity) and/or competitive production principles [15,16]. Due to the complementarity and cooperation between cereal/cereal, species and cereal/legume sowing systems, intercropping has been extensively utilized and encouraged for the sustainable development of agriculture [15,17,18]. Legume intercropping improves soil efficiency through biological nitrogen fixation and improves soil conservation. However, in intercropping, two different crops compete for water, light and nutrients; therefore, appropriate varieties and suitable intercropping techniques are required to achieve the expected benefits [12,19].
Intercropping improves the water-holding capacity of the soil due to an increase in leaf area index over a short period [20]. A study in South Africa found that maize yield was not adversely affected in the intercropping of maize and white beans [21]. A study in Gevaş-Van, Turkey, revealed that two white bean + two maize was the best planting arrangement in mixed white bean and maize sowing [22]. Another study conducted in Gurgentepe Ordu, Turkey, reported that maize mixed with white beans produced high cob and grain yields, possibly due to the nitrogen contributed by the white beans [23]. A further study found that intercropping maize and legumes significantly reduced the density of weeds compared with maize planted alone, indicating that this decrease may be due to the reduction in light being taken by weeds [24]. However, not much is known about the effect of different sowing patterns on maize-white bean sowing systems. Therefore, this study was conducted at the Aydin Research Institute, Nur Sultan, Kazakhstan, in 2018 and 2019 to identify the effects of different sowing patterns on maize-white bean (Zea maysPhaseolus vulgaris) sowing systems.
Maize legumes are cultivated together in Nur Sultan, Kazakhstan. However, it is not common practice in the Central Russian region; therefore, the objective of this research is to examine the effects of different sowing patterns on maize-white bean intercropping in Nur Sultan, Kazakhstan, using the yield and yield components of maize and white beans.

2. Materials and Methods

2.1. Study Area Location

This research was carried out at the Aydin Research Institute, Faculty of Agriculture, Nur Sultan University, Kazakhstan, during two consecutive cropping periods in 2018–2019. The study area is located at 30°28′ eastern longitude and 39°45′ northern latitude.

2.2. Soil Characteristics

Soil samples were collected according to procedures authorized by the Ministry of Agriculture and Forestry. Sample analysis was carried out in the Soil and Water Analysis Laboratory. According to the soil analysis results, the soil type was clay loam. The research field was almost neutral with a pH range of 7.71–7.66, with low salinity (0.07–0.08%), low organic matter (1.51% to 1.82%), moderate phosphorus (85.21 to 109.11 kg/ha) and high potassium (1130 to 1952 kg/ha), as shown in Table 1.

2.3. Climatic Characteristics of Study Area

The climatic data collected from the regional meteorological directorate are presented in Table 2. It was observed that precipitation in June and September was higher than the mean monthly rainfall for the previous years for the plant growth period of 2018 and 2019. The mean monthly rainfall for the sowing season (May to September) in the study location ranged between 26 mm and 78 mm. The mean monthly average temperature ranged between 14.29 °C and 21.9 °C, and the relative humidity values were 45.7% to 55%.

2.4. Experimental Layout

The Göynük-98 white bean variety was obtained from the Gate Belt Agricultural Research Institute, and the SY Miami maize variety was acquired from Syngenta (LLC Seinar Group, Nur Sultan, Kazakhstan). Seedbed preparation included ploughing, disk harrowing and sowing. The trials were conducted in three replications, according to the trial pattern under a completely randomized design (CRD). The selected treatments for the two planted crops with their descriptions are given in Table 3.
For sole planting, the maize was sown in 4 rows with 70 cm line spacing, and the white beans were sown in 8 rows with a line distance of 35 cm. In the trial, the plot sizes were 8 m × 6 m. The sowing systems that were applied in the trial are shown in Table 4. Planting took place on 13 May 2018 and 3 May 2019. Sowing was performed manually by planting twice more seeds than the expected plant densities, and then the rows were thinned to the required densities. Nitrogen and phosphorous fertilizers were applied at the time of sowing and when the maize was in the anthesis–silking interval. In both years, 120 kg/ha N, 120 kg/ha P2O5 and 120 kg/ha K2 fertilizers were applied to all the treatments. As a base fertilizer before planting, 140 kg/ha DAP (diammonium phosphate) was also applied before sowing. The plots were irrigated as needed with 75 mm per application at tillering, jointing and grain-filling. Weed control was performed manually (hand pulling and hoeing). The most dominant weeds were Amaranthus retroflexus, Chenopodium album, Echinochloa crus-galli and Solanum nigrum.
The maize was harvested at complete maturity, and the white bean plants were harvested when most pods were fully matured. In the first year, the harvesting of the white beans was performed on 25 November 2018, while the maize harvesting was undertaken on 20 November 2018. In the second year, the harvesting of the white beans was completed on 13 November 2019, while the maize harvesting was conducted on 5 November 2019. The plots were trimmed to remove border effects, and the remaining 7 m × 5 m were harvested.

2.5. Data Acquisition Related to Crop Growth, Yield and Its Analysis

During the maize harvesting, five plants were randomly selected from each sowing system (treatment), and the number of cobs in the plant was calculated. The cobs’ weight, length, number of rows, number of grains, grain weight, hectoliter weight and 1000-grain weight were determined from selected cobs from each sowing system. The grains obtained from cobs in the harvested treatments were corrected according to 15% of the moisture, and the grain yield was then calculated [25].
From the white beans, five plants were randomly selected from each treatment, and the biological yield, number of pods, number of grains and grain yield for each plant were ascertained, along with a calculation of the number of grains in the pods. Among the selected five plants, the length of five randomly selected pods was determined. Each treatment was harvested separately by hand, and the biological yield and blended grain yields were determined. The harvesting index using the rate of grain yield and biological yield was calculated [26].
In the samples taken from each treatment for both maize and white beans, the nitrogen content was detected using the Kjeldahl method [27], and the amount of nitrogen found as a result of the analysis was multiplied by a coefficient of 6.25, which calculated the raw protein ratios contained in grains [28].
The criteria of land equivalent ratio (LER) was adopted to evaluate the competitive effects among the component crops and to determine the intercropping yield in mixture and sole crops. The LER was calculated as the sum of the relative yields of maize and white bean in the intercropping sowing plots to the mono-cropping plots using Equation (1). In the equation, the LERmaize and LERwhite bean were defined as the partial land equivalent ratios of maize and white bean, respectively. The LER was calculated using Equation (1):
L E R = L E R m a i z e + L E R w h i t e   b e a n = Y a b Y a a + Y b a Y b b .  
where Y a b and Y b a are the yields (t/ha) of two different crops using intercropping, while Y a a and Y b b are the yields (t/ha) of the same crops in sole cultures. If LER > 1, intercropping is better than sole cropping, and if LER < 1, sole sowing is better.
The obtained data were evaluated by variance analysis using MSTAT-C (https://www.canr.msu.edu/afre/projects/microcomputer_statistical_package_mstat._1983_1985, accessed on 1 June 2018, Michigan State University, East Lansing, MI, USA) to test the effects of year, row spacing and sowing systems, and all possible interactions in a completely randomized design. When the differences among the sowing systems or the interactions were significant, Duncan’s multiple range test was used for means separation.

3. Results and Discussion

It is worth noting that Table 5 and Table 6 show the main effect of means and results of the statistical analysis. By analyzing the significant interactions involving year, we determined that those interactions were mostly of magnitude, with minor differences among treatments between the years that were not likely to be biologically significant. Even for some of those interactions, the differences within treatments were consistent across treatments. The yields of maize and white bean can be differentiated by either the row spacing or sowing system. This interaction showed that weather factors had a greater influence on the value of the obtained grain yields, as grain yield was determined mainly by the weather conditions. The most favorable thermal and precipitation conditions prevailed in the period of formation of cobs and pods and seed maturation in the first year (2018) of the study, which resulted in the highest yield. This indicated that the maize and white bean yields were dependent on the weather conditions during the growing seasons, and on the stress caused by a water deficit in the soil over the years, in particular during the seed formation phase.

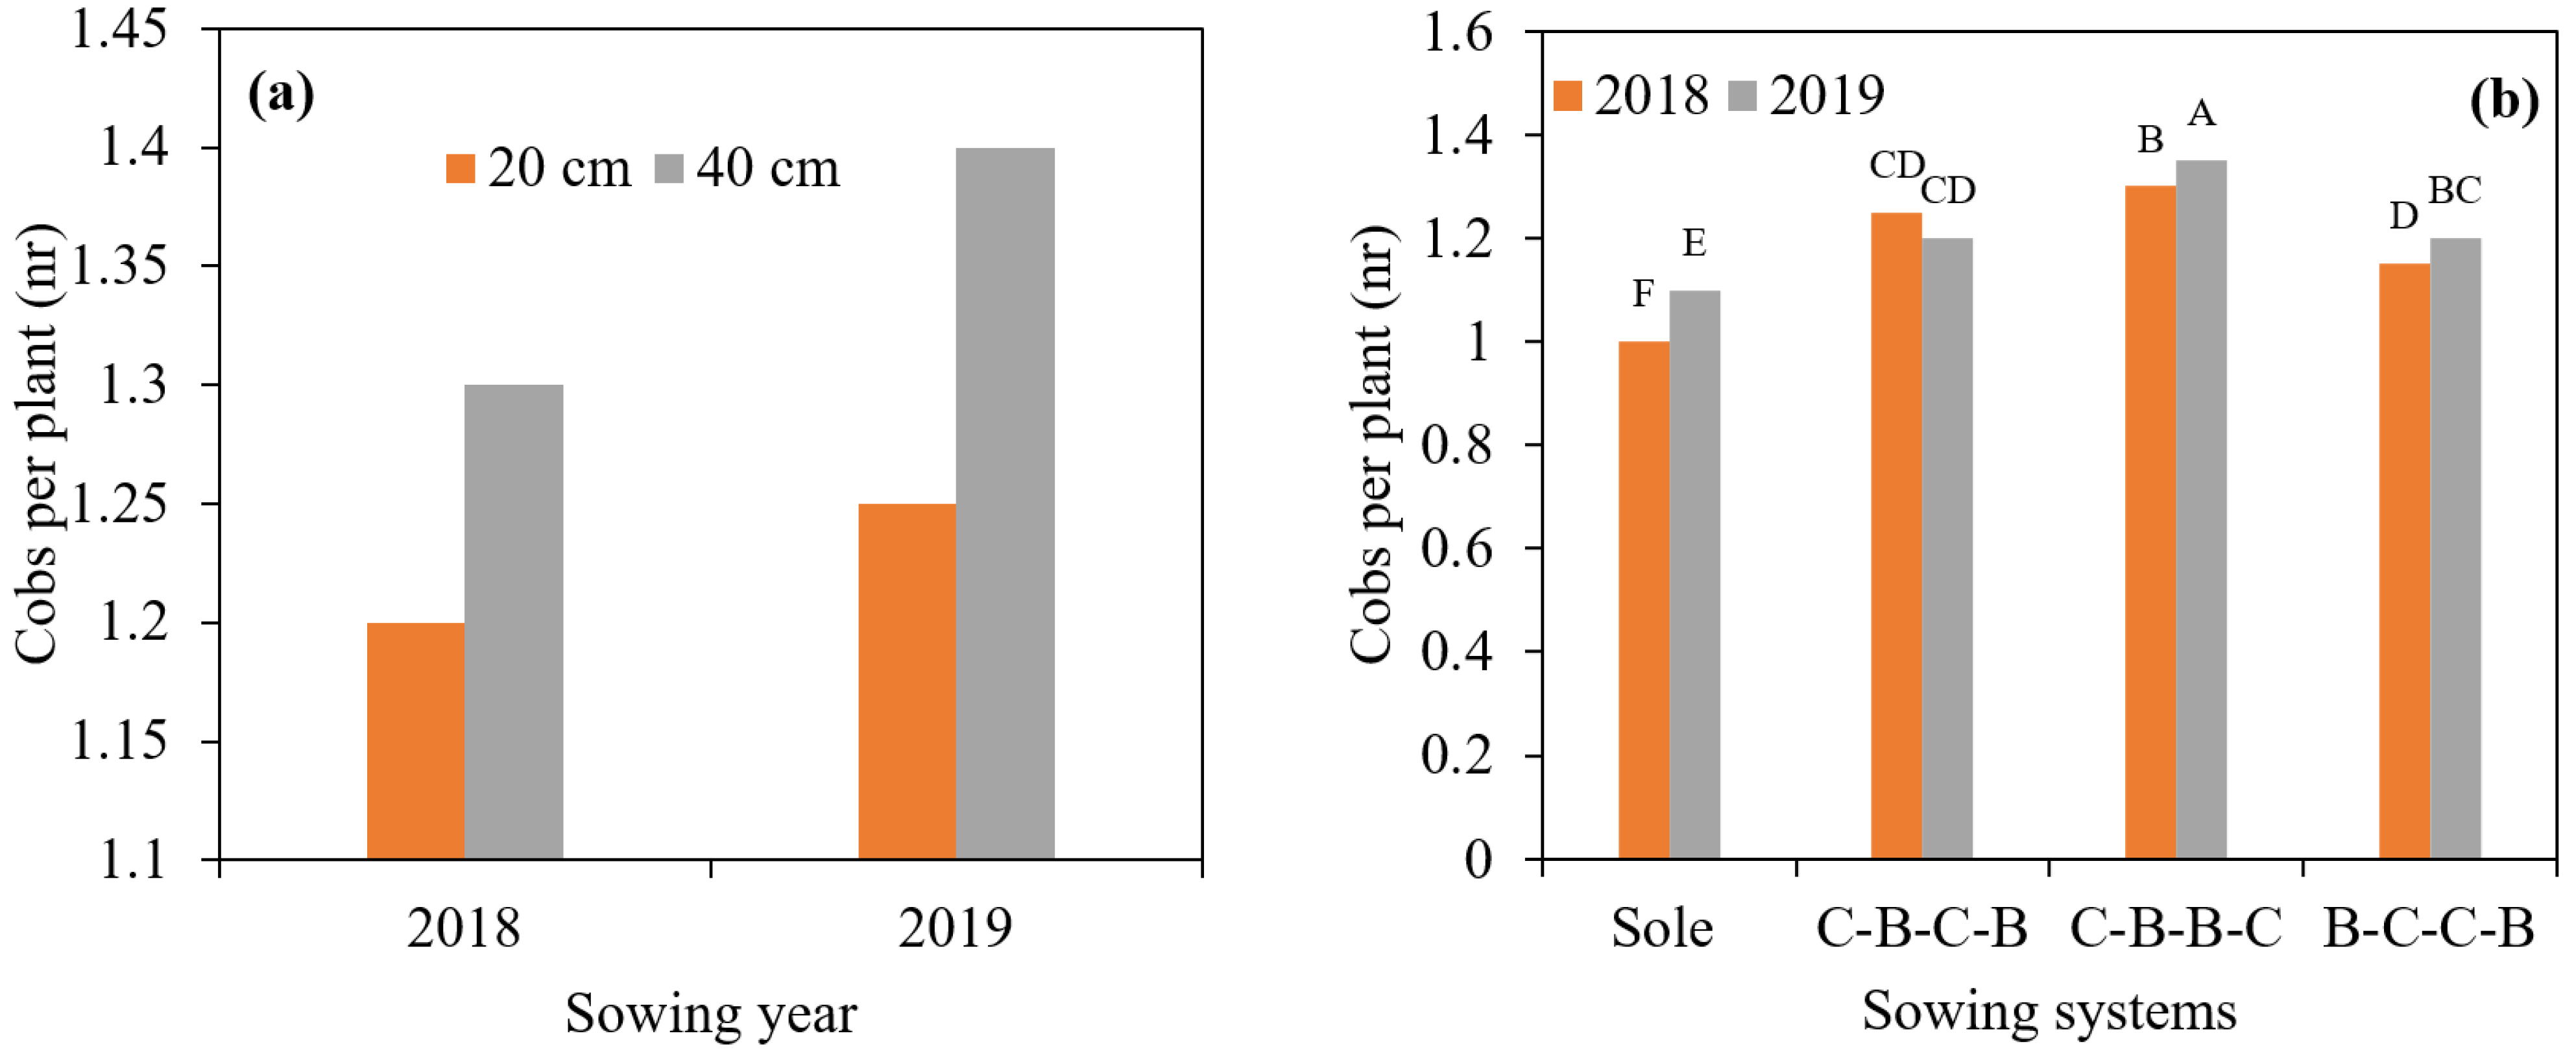
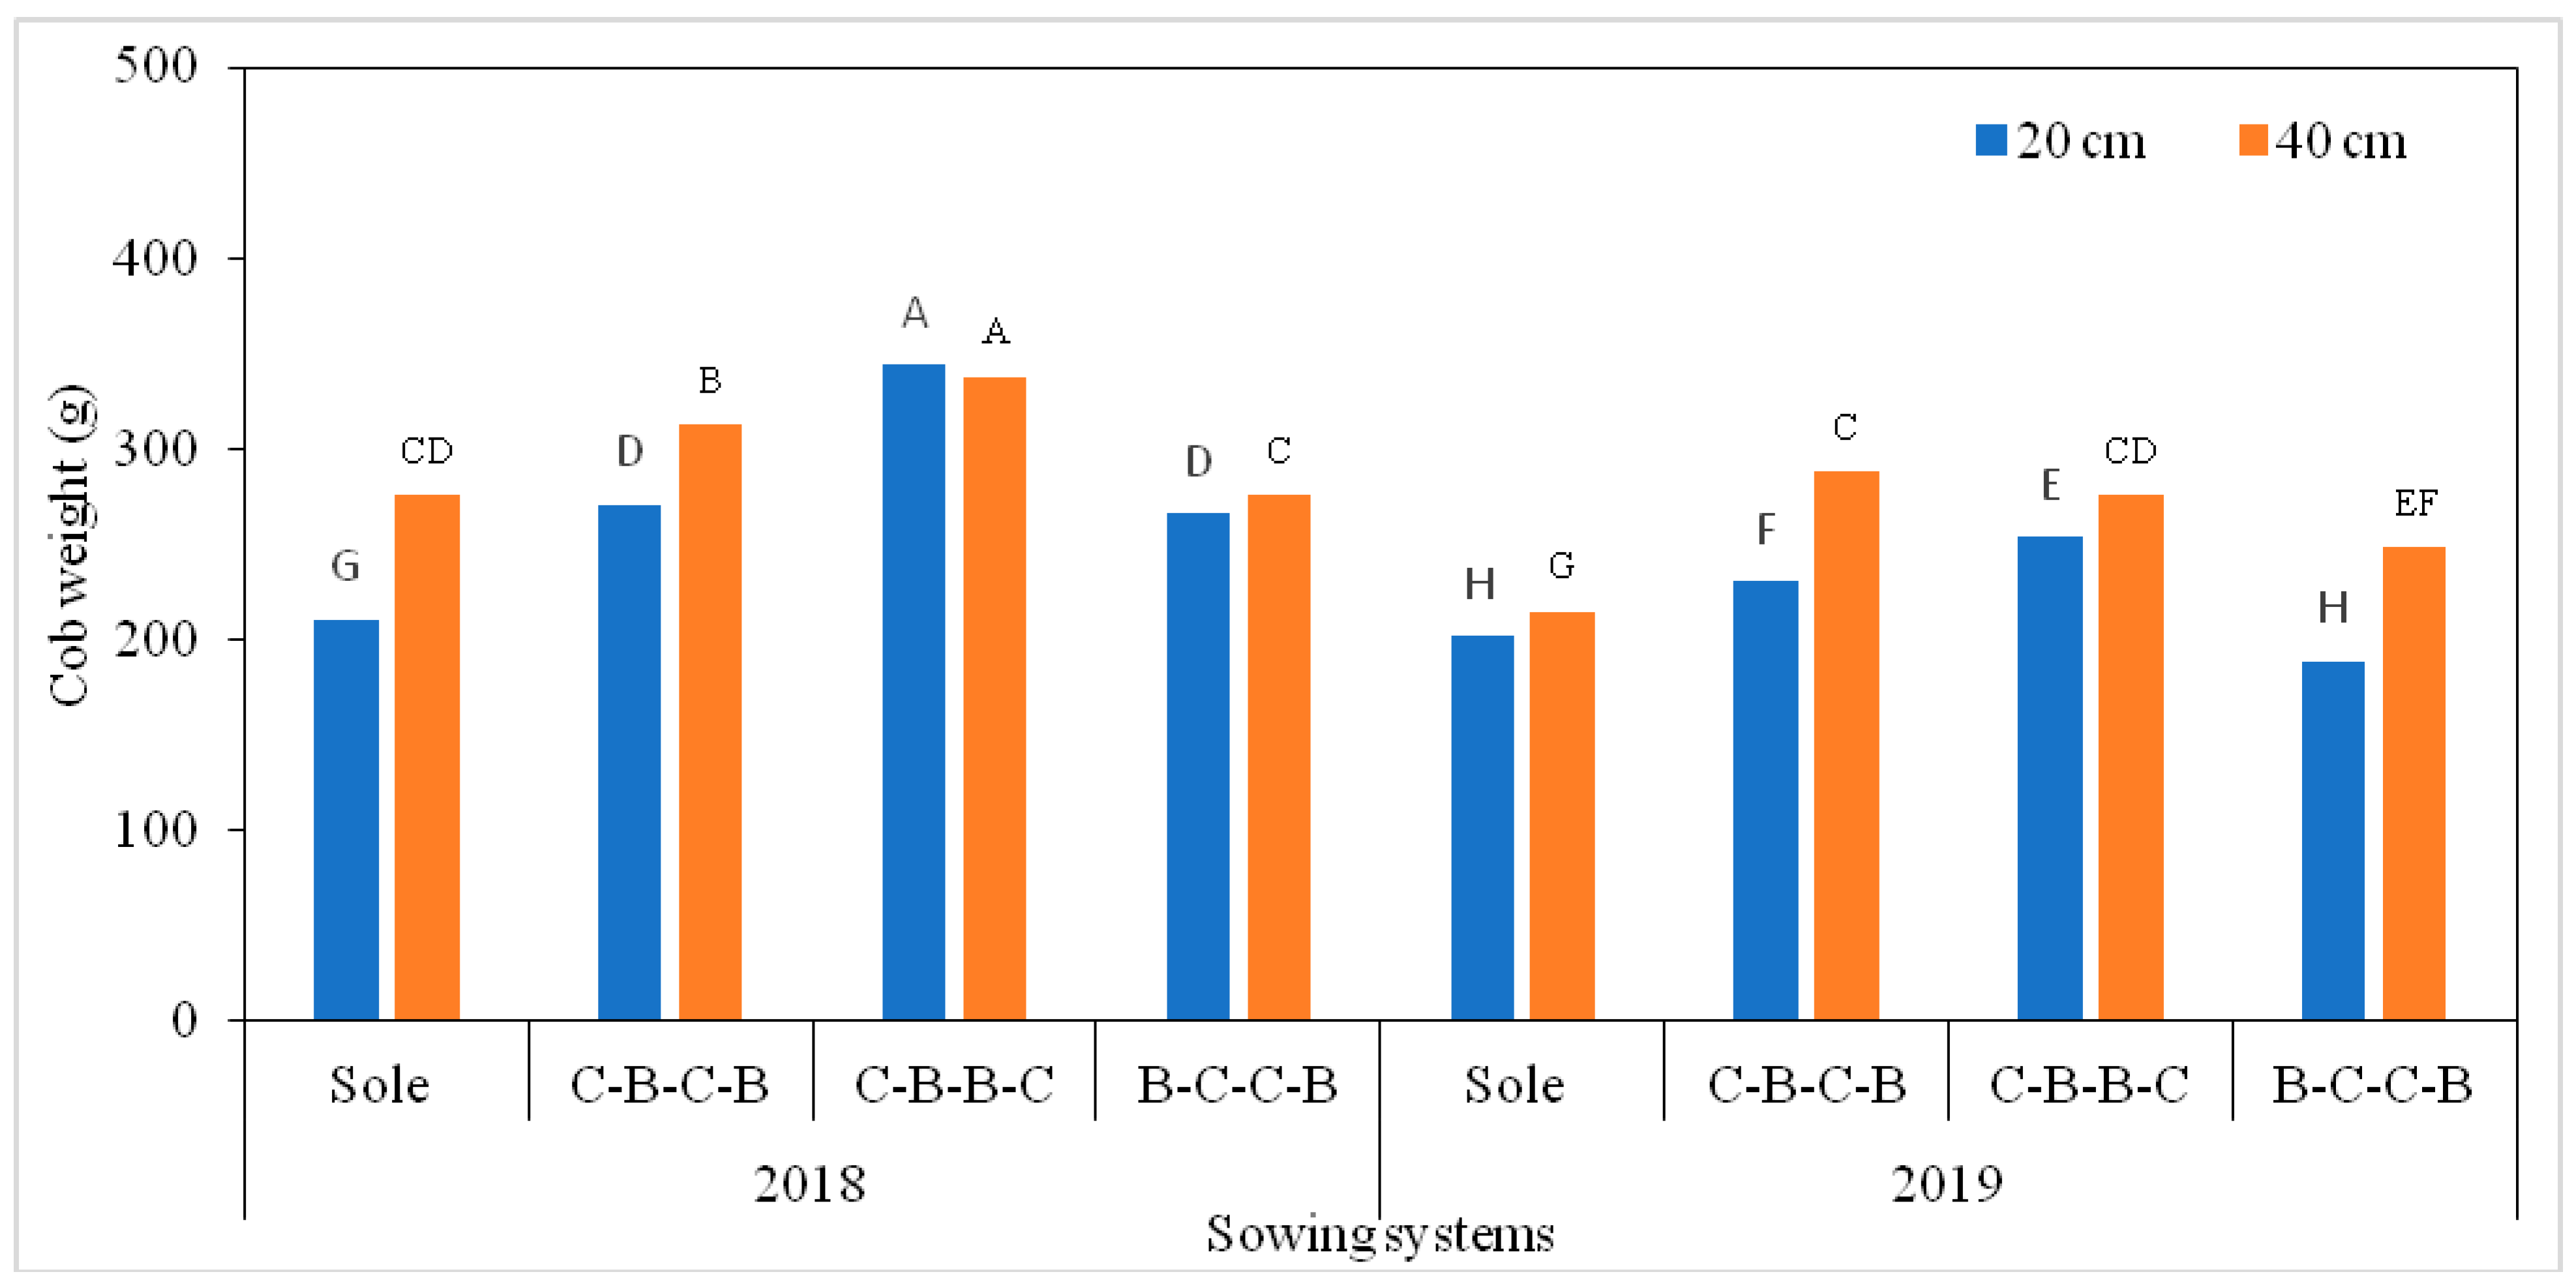
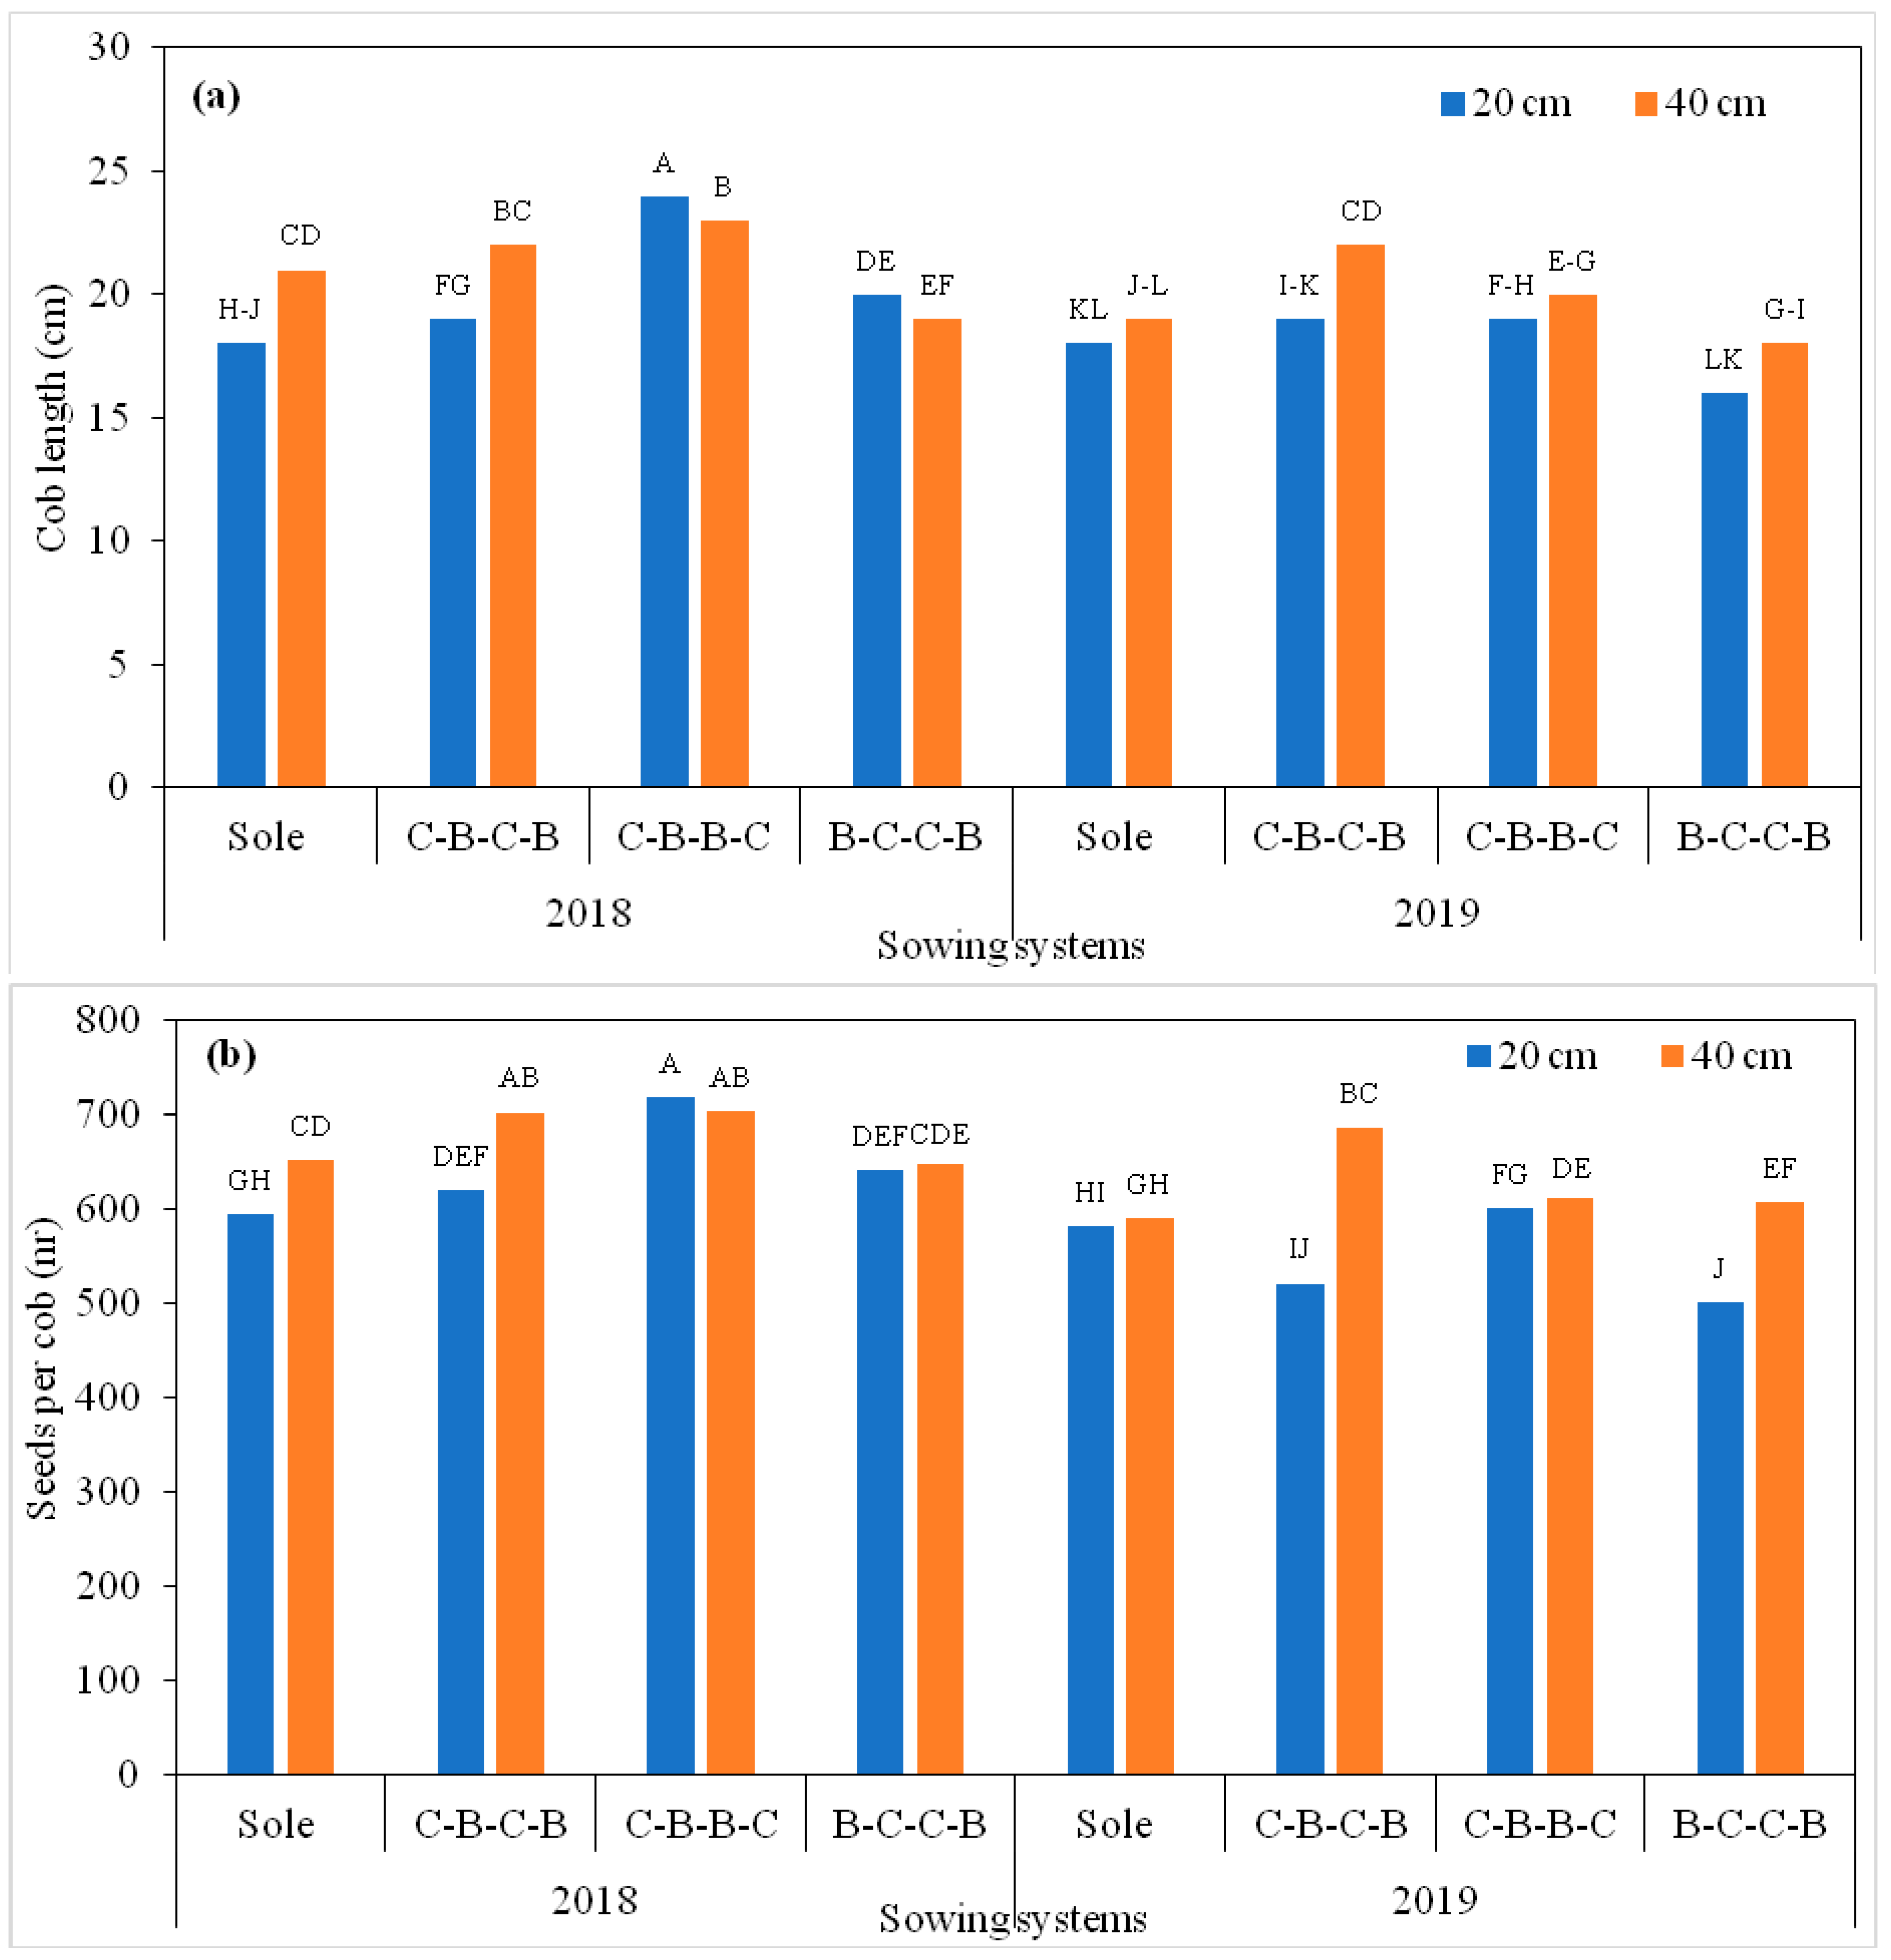
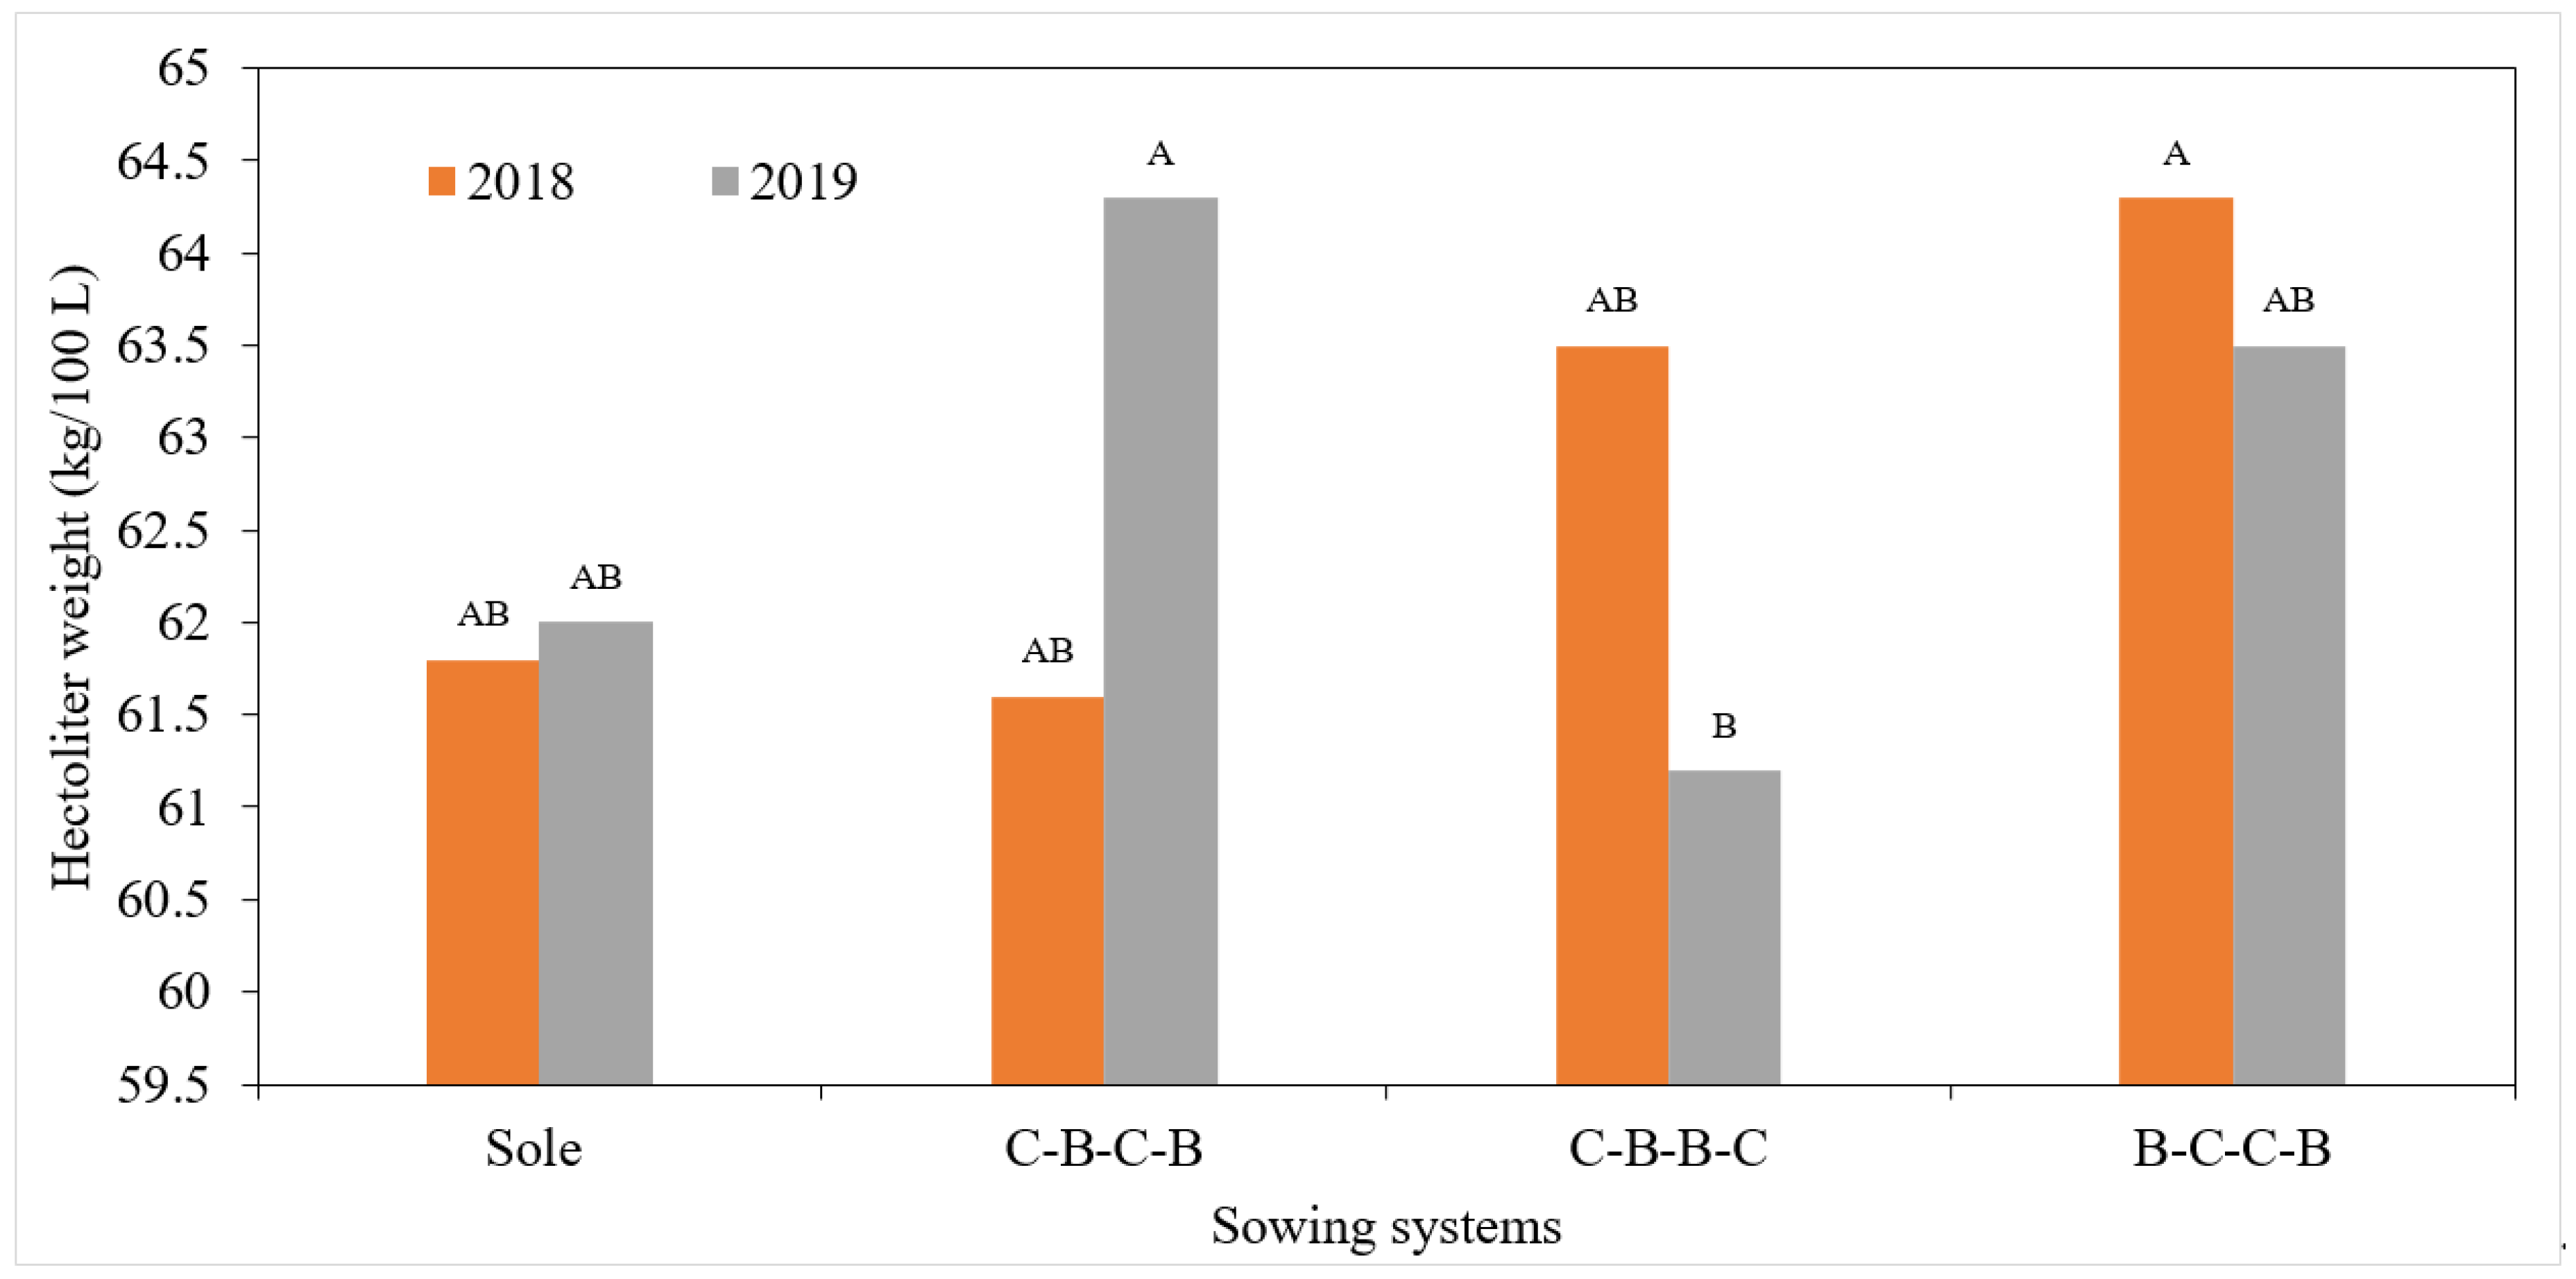
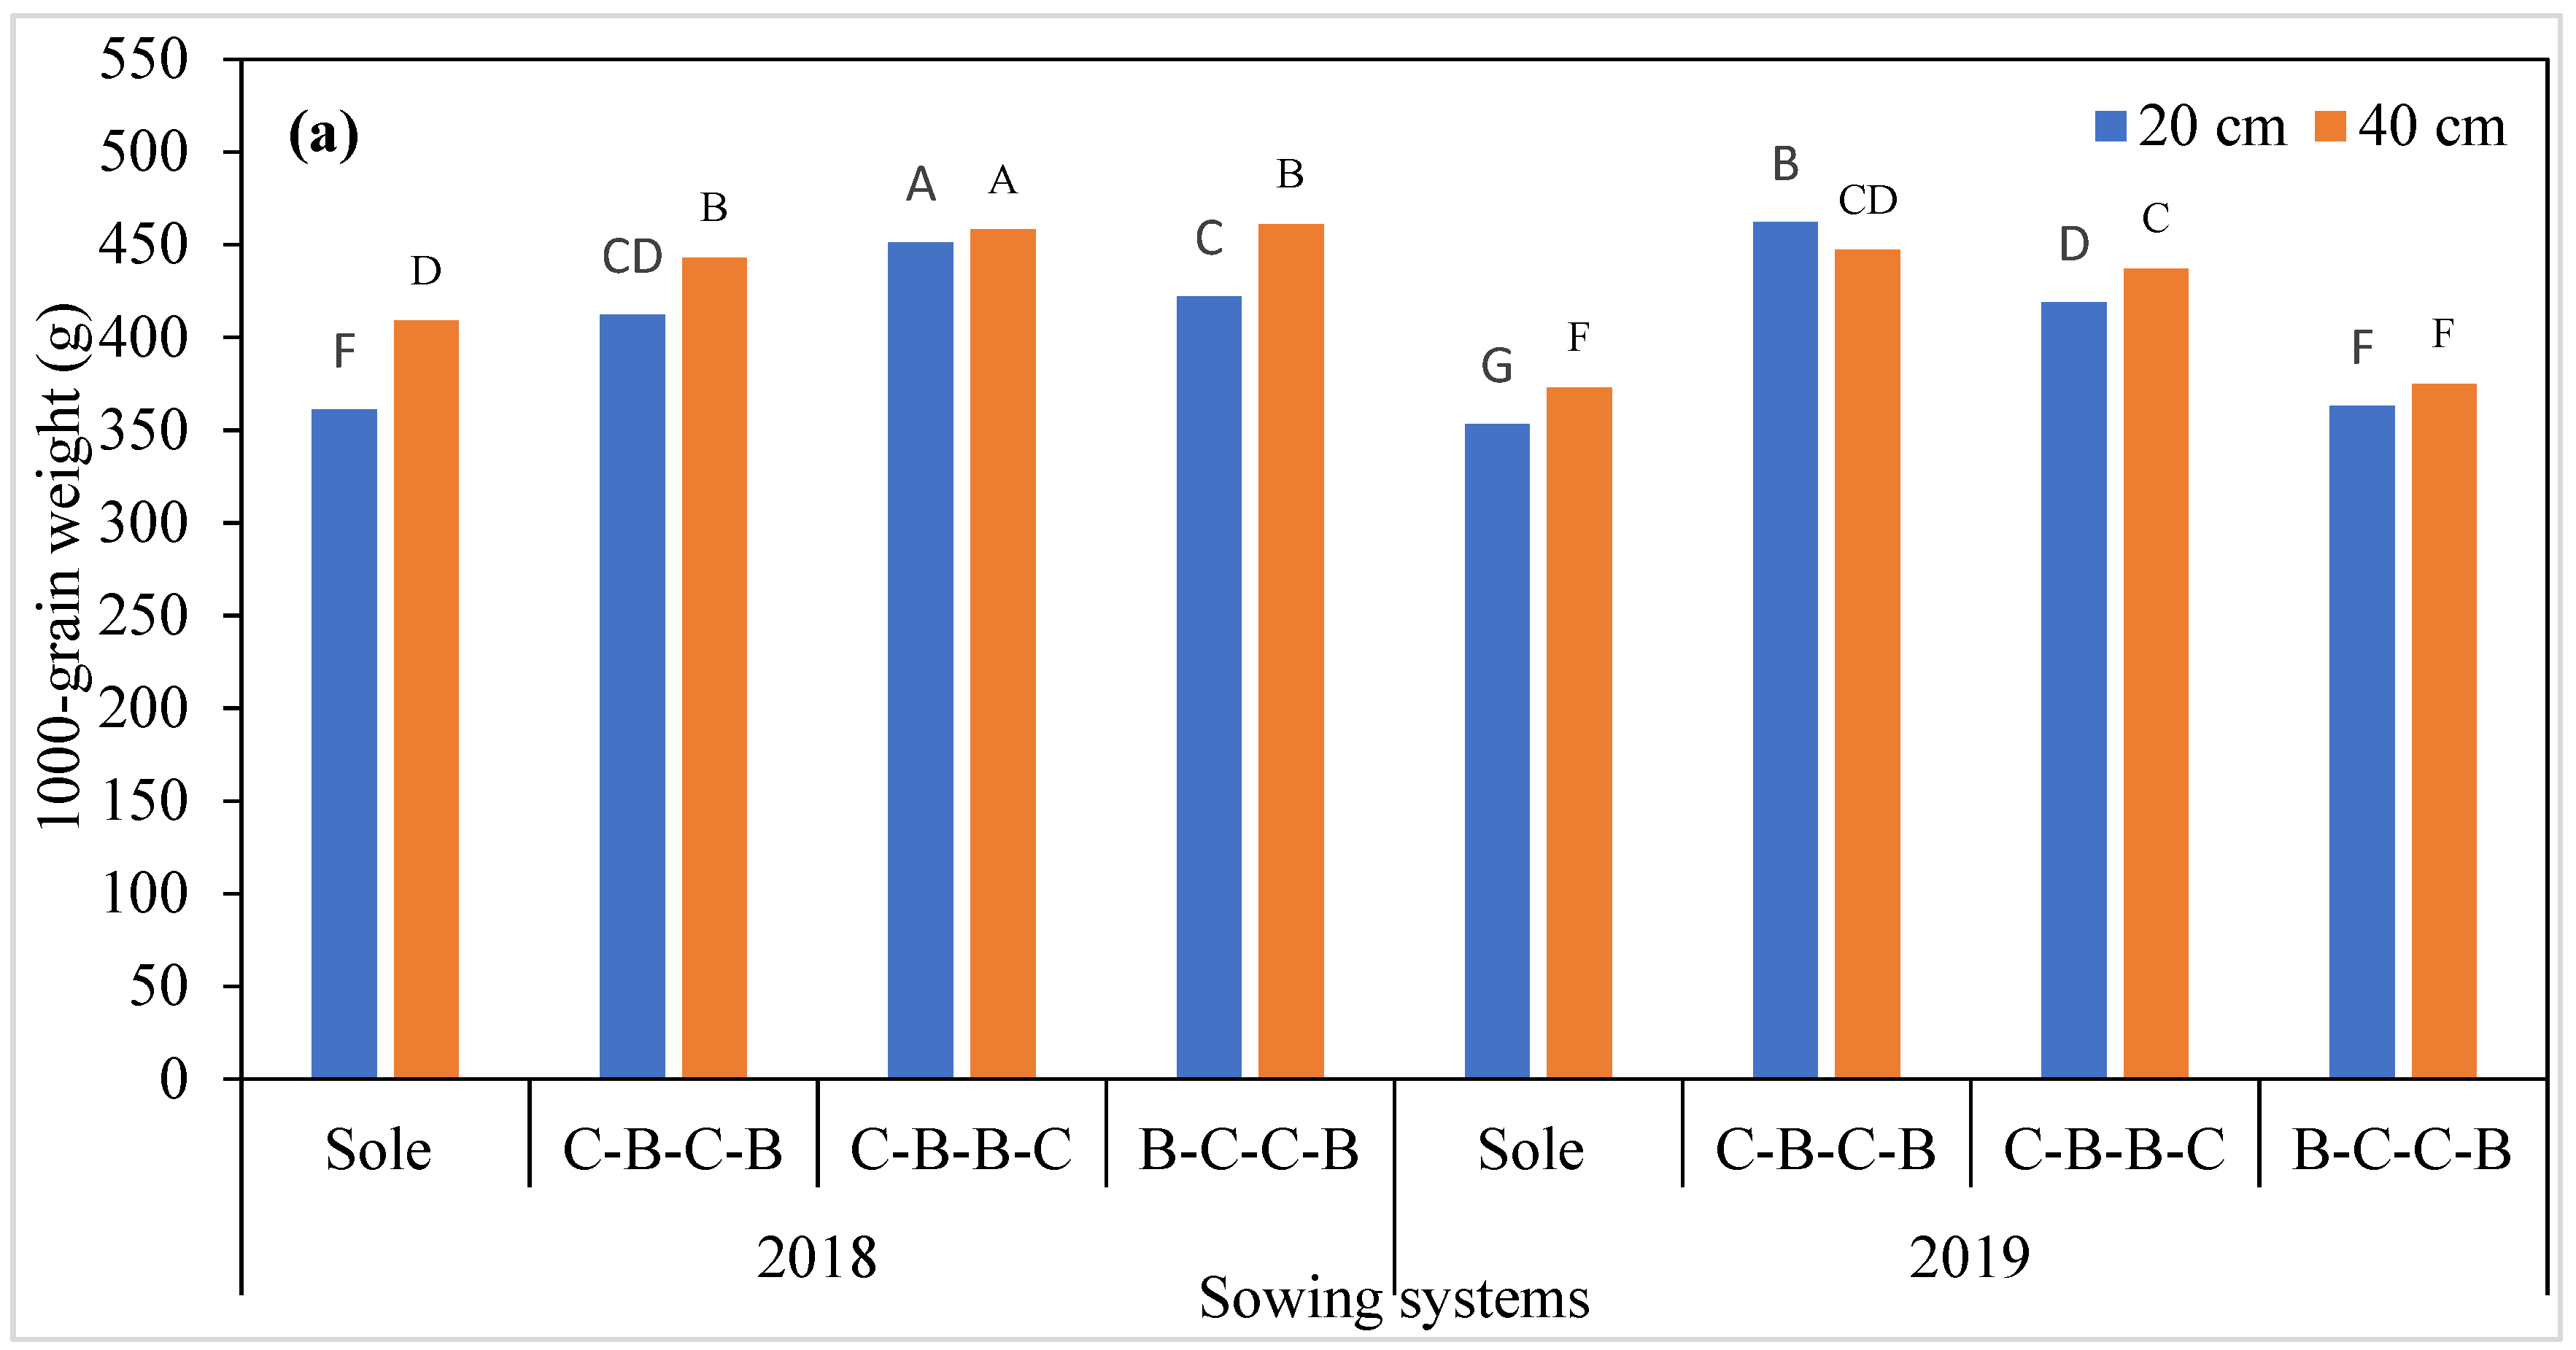
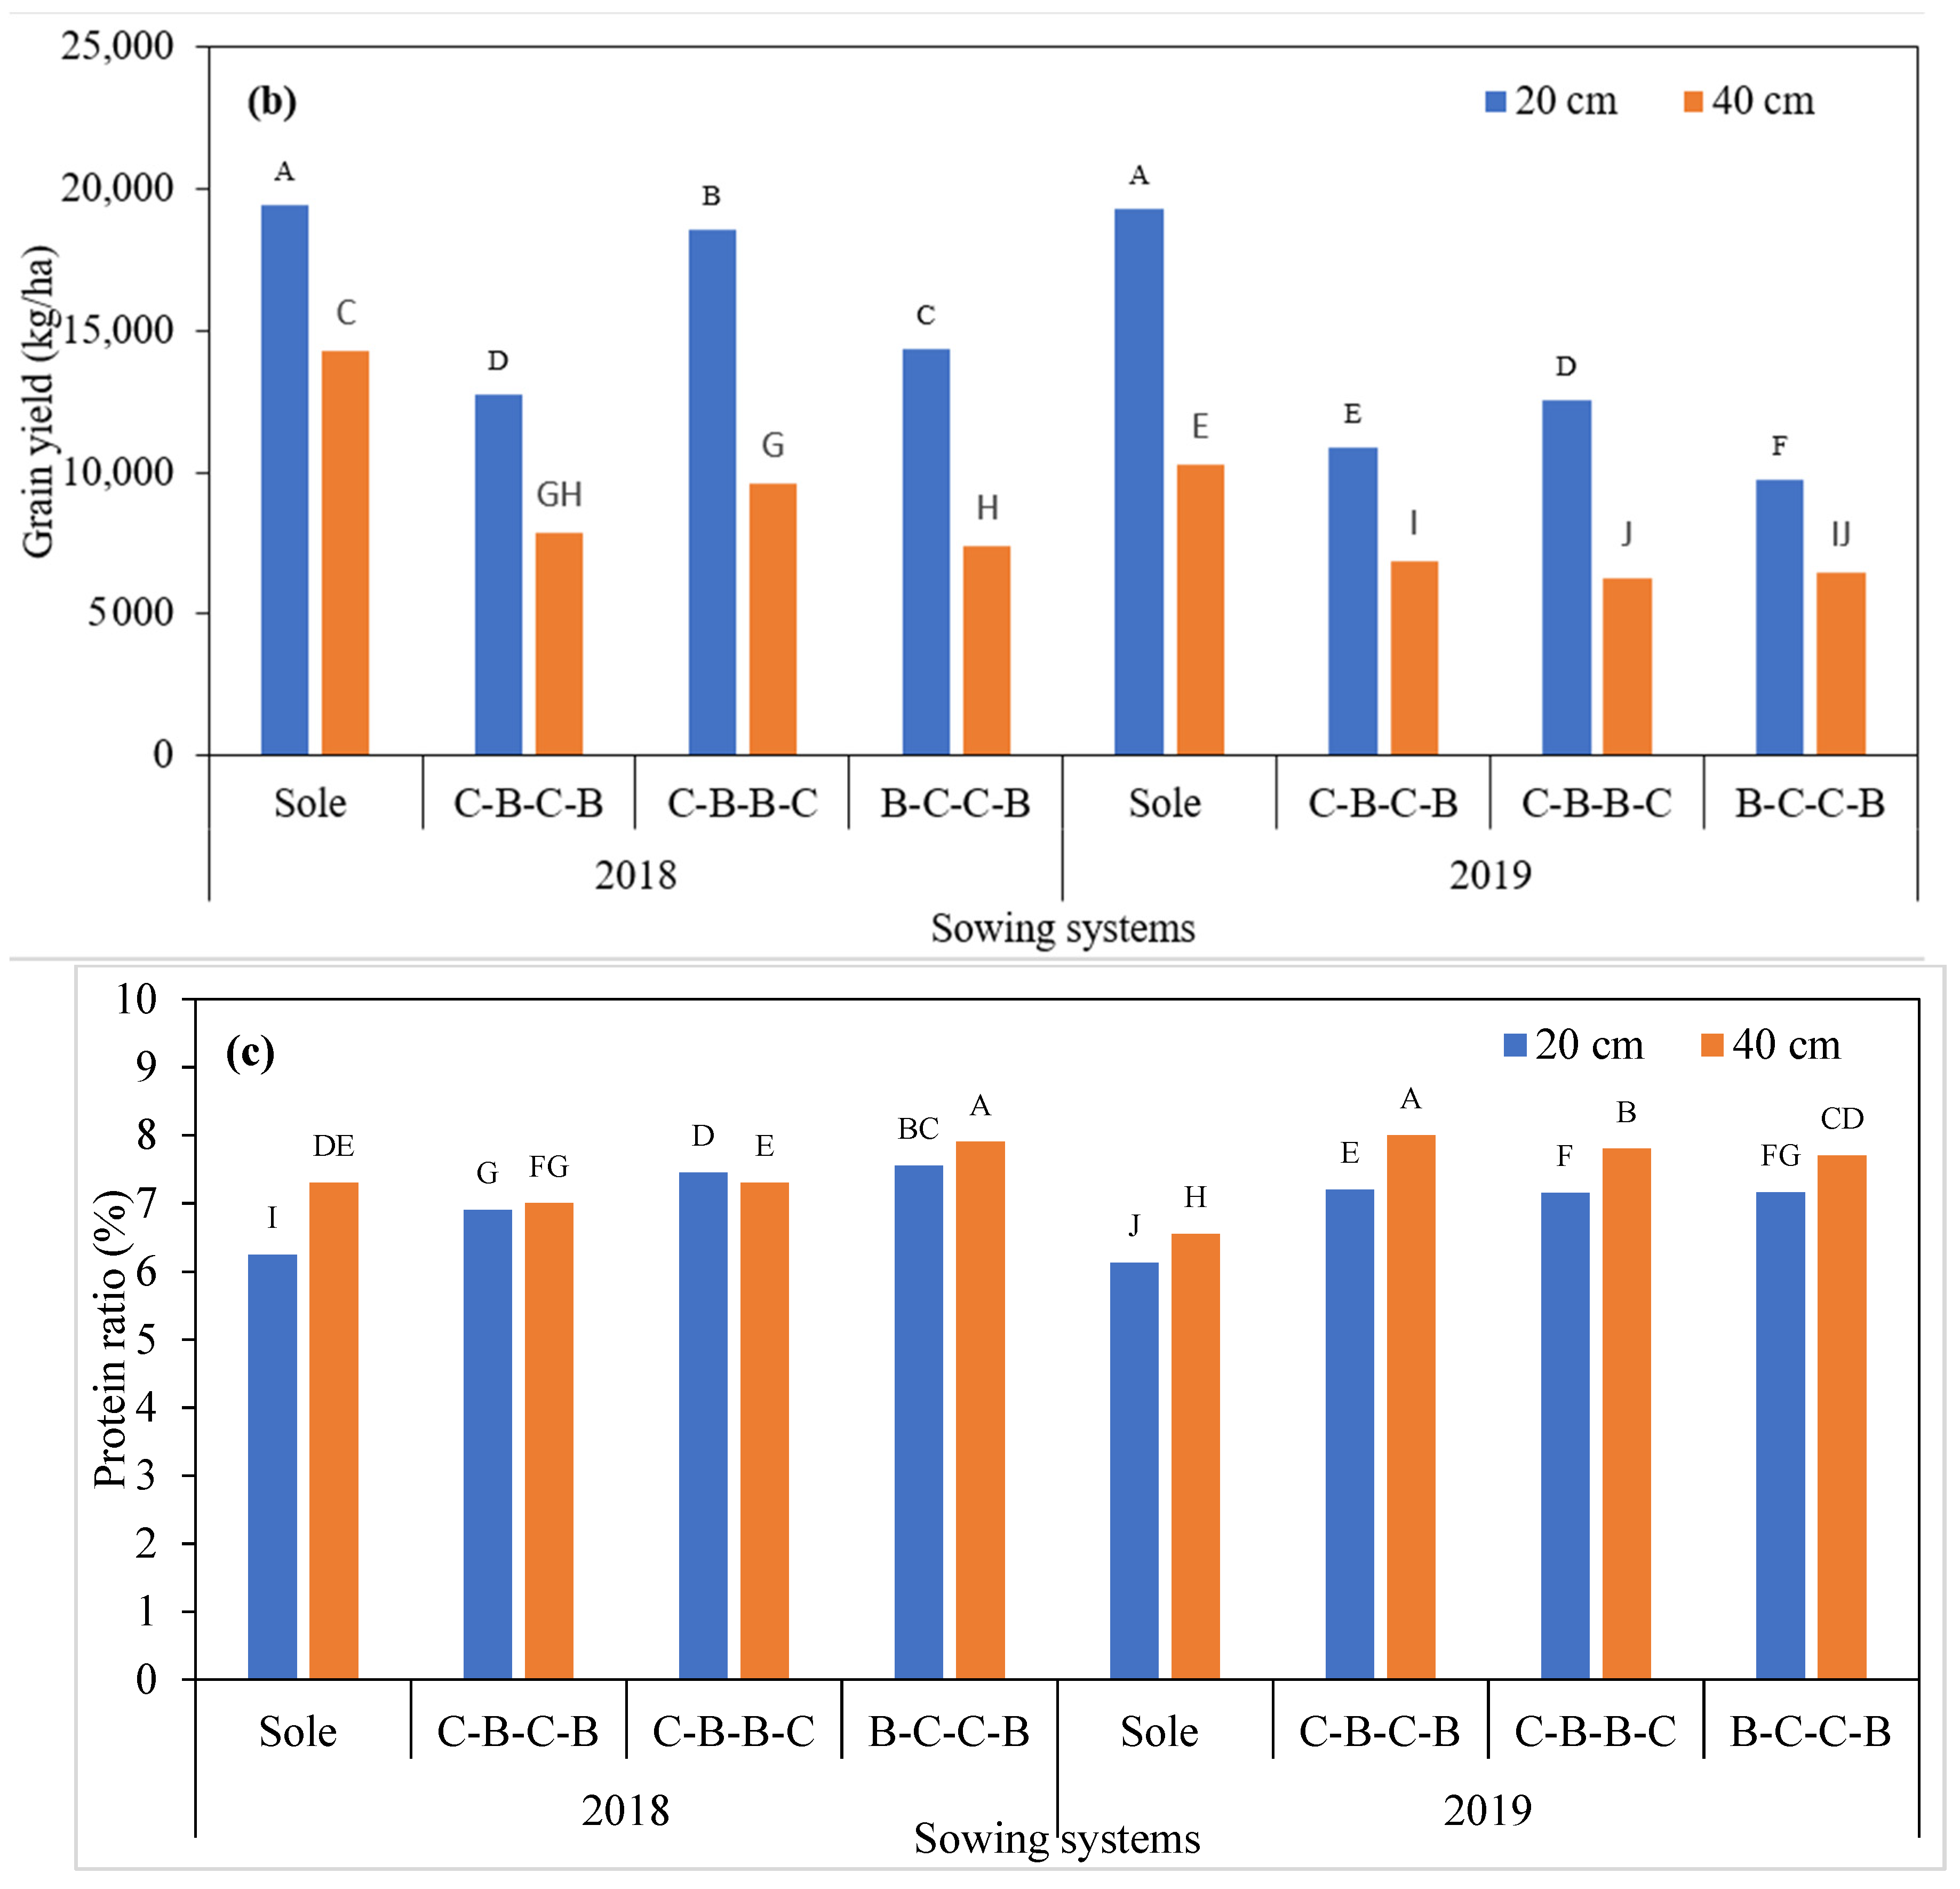
3.1. Yield Characteristics of Maize

This study was performed on a different range of mixed sowing systems, along with sole crops of maize and white beans (Table 3 and Table 4). It was found that there were differences in hectoliter weight between the years and row spacing, and interactions other than the year × sowing system interactivity and the effects outside the years in terms of the number of rows were found to be statistically insignificant. Apart from this characteristic, the differences in all other examined features of the maize between the years, row spacing and sowing systems were found to be significant (Table 5).
In this research, it was discovered that all the examined characteristics were higher in the 2018 sowing season than in 2019, except for the number of cobs per plant (Table 5). A possible reason may be the temperature effect on maize cobs. According to climate data of the study area, it was observed that the average air temperature in September was higher in 2018 than in 2019, while in the same month, the maize grain-filling period started (Table 2). The higher temperature is an external stress that may have reduced the grain-filling period in the study area. The same findings have been reported by Broka et al. [29]. According to the study in [29], the reduction in cob weight was mostly due to high temperatures during the grain development periods in Kazakhstan. Moosavi reported that high-temperature stress reduced the cob diameter [30]. Rasul et al. noted that high temperatures reduced the number of grains in the cob [31]. Çakir [32] recorded a decrease of 1000-grain weight in maize due to high temperatures [33]. Climatic conditions and sowing techniques significantly affect the yield components in Kazakhstan [34].
The sowing systems also affect yield and yield components, as noted by Hassan [35]. Different scientists found that the cob length, number of cobs and weight of cobs in maize crops were higher in some sowing systems [36,37,38,39,40]. Similar to our results, Licht reported that the rate of protein decreased in maize when using sowing systems [41]. Clearly, grain yield was observed to be higher in close spacing because there are more plants per unit area. Rahmani et al., Farhadi-afshar et al. and Bhatt reported that sowing using close spacing also increases the cob yield [42,43,44]. The maximum grain yield was obtained from sole maize sowing in this study, while the hectoliter weight and protein ratio were the highest in white bean-maize-maize-white bean (B-C-C-B) sowing. The remaining yield items showed maximum values in maize-white bean-white bean-maize (C-B-B-C) sowing. Cob weight, length and number of kernels were maximum in the C-B-B-C sowing. In the sowing process, we adopted a reasonable distance between maize plants that resulted in more sunlight benefiting the cobs’ development. The lowest values of these properties were obtained in sole maize sowing. Due to a lack of sunlight, the photosynthesis process decreased, causing a lower delivery of carbohydrates to the cobs [37,45]. Babu et al. reported a maximum cob length in the sowing system in their study [46]. In Malhotra, the findings indicated that the number of grains and the weight of 1000 cobs was higher in intercropping than in sole sowing [47]. Our study contradicted these findings in the literature, with a maximum grain yield in sole sowing. Other studies support our findings and report that the grain yield of maize was maximized in sole sowing compared with intercropping [37,48,49,50]. Rao reported that, in intercropping, the yield might be lower compared with sole sowing due to an increase in inter-species competition in the root zone, which is caused by the proximity of the root zone of plants [51]. In this study, the number of plants per m2 in intercropping and sole sowing was the same, but the yield was higher in sole plantations, possibly due to competition in mixed sowing. In contrast, Muoneke reported that the grain yield of maize was higher in intercropping [52]. This may have been due to the difference in cultivars and sowing systems used in the trials. In our study, higher protein content was found in sowing systems. Sarlak reported that in maize-white bean intercropping, the protein ratio in maize was higher in sowing systems than in sole sowing due to nitrogen being supplemented from white beans [53].
The analysis related to the number of cobs per plant indicated that 20 cm sowing distances showed higher values in the second year than in the first year (Figure 1a). The magnitude of difference between 40 cm spacing in 2018 and 2019 was greater than the magnitude of difference between 20 cm across years; however, there was no difference in 2019, while there was a difference in 2018. Spacing of 40 cm always showed a greater number of cobs/plant than 20 cm spacing. There was a slight difference in magnitude within years that led to a significant interaction (Table 5). There were more cobs per plant in 2019 for all treatments except the maize-white bean-maize-white bean (C-B-C-B) sowing system (Figure 1b), for which there was no difference.
These different responses may be the reason why year × sowing systems’ interactions are important. In all adopted sowing systems, 20 cm row spacing showed lower values than 40 cm row spacing. These different responses indicated the significance of the interaction of row × sowing systems (Figure 2). Sole sowings other than C-B-B-C were higher in the first year. This represented the significance of interactions of sowing systems × year × row spacing (Figure 2).
Cob length was higher in sole sowings than in C-B-B-C and B-C-C-B in the first year, which represented the significant interactions of sowing systems over the row x years (Figure 3a). Utilizing the C-B-B-C sowing system resulted in a higher number of seeds per cob in the first year (Figure 3b). Hectoliter weight was higher in the C-B-C-B mixed sowing system in the second year, while in other systems, hectoliter weight showed lower values in the second year (Figure 4). Figure 4 show the interaction of rank based on whether the crops were planted in adjacent rows, alternate rows or as monocultures.
In terms of 1000-grain weight, the results for sole sowings were higher, except for C-B-C-B in the second year. Using C-B-B-C sowing resulted in a higher 1000-grain weight in the first year. These responses indicated significant interactions of sowing systems over the year x rows (Figure 5a). In terms of grain yield, sole sowing showed higher values in both years (Figure 5b). The protein ratio was higher in B-C-C-B sowing in 2018, while in the second year, it was higher in the C-B-C-B sowing system (Figure 5c).

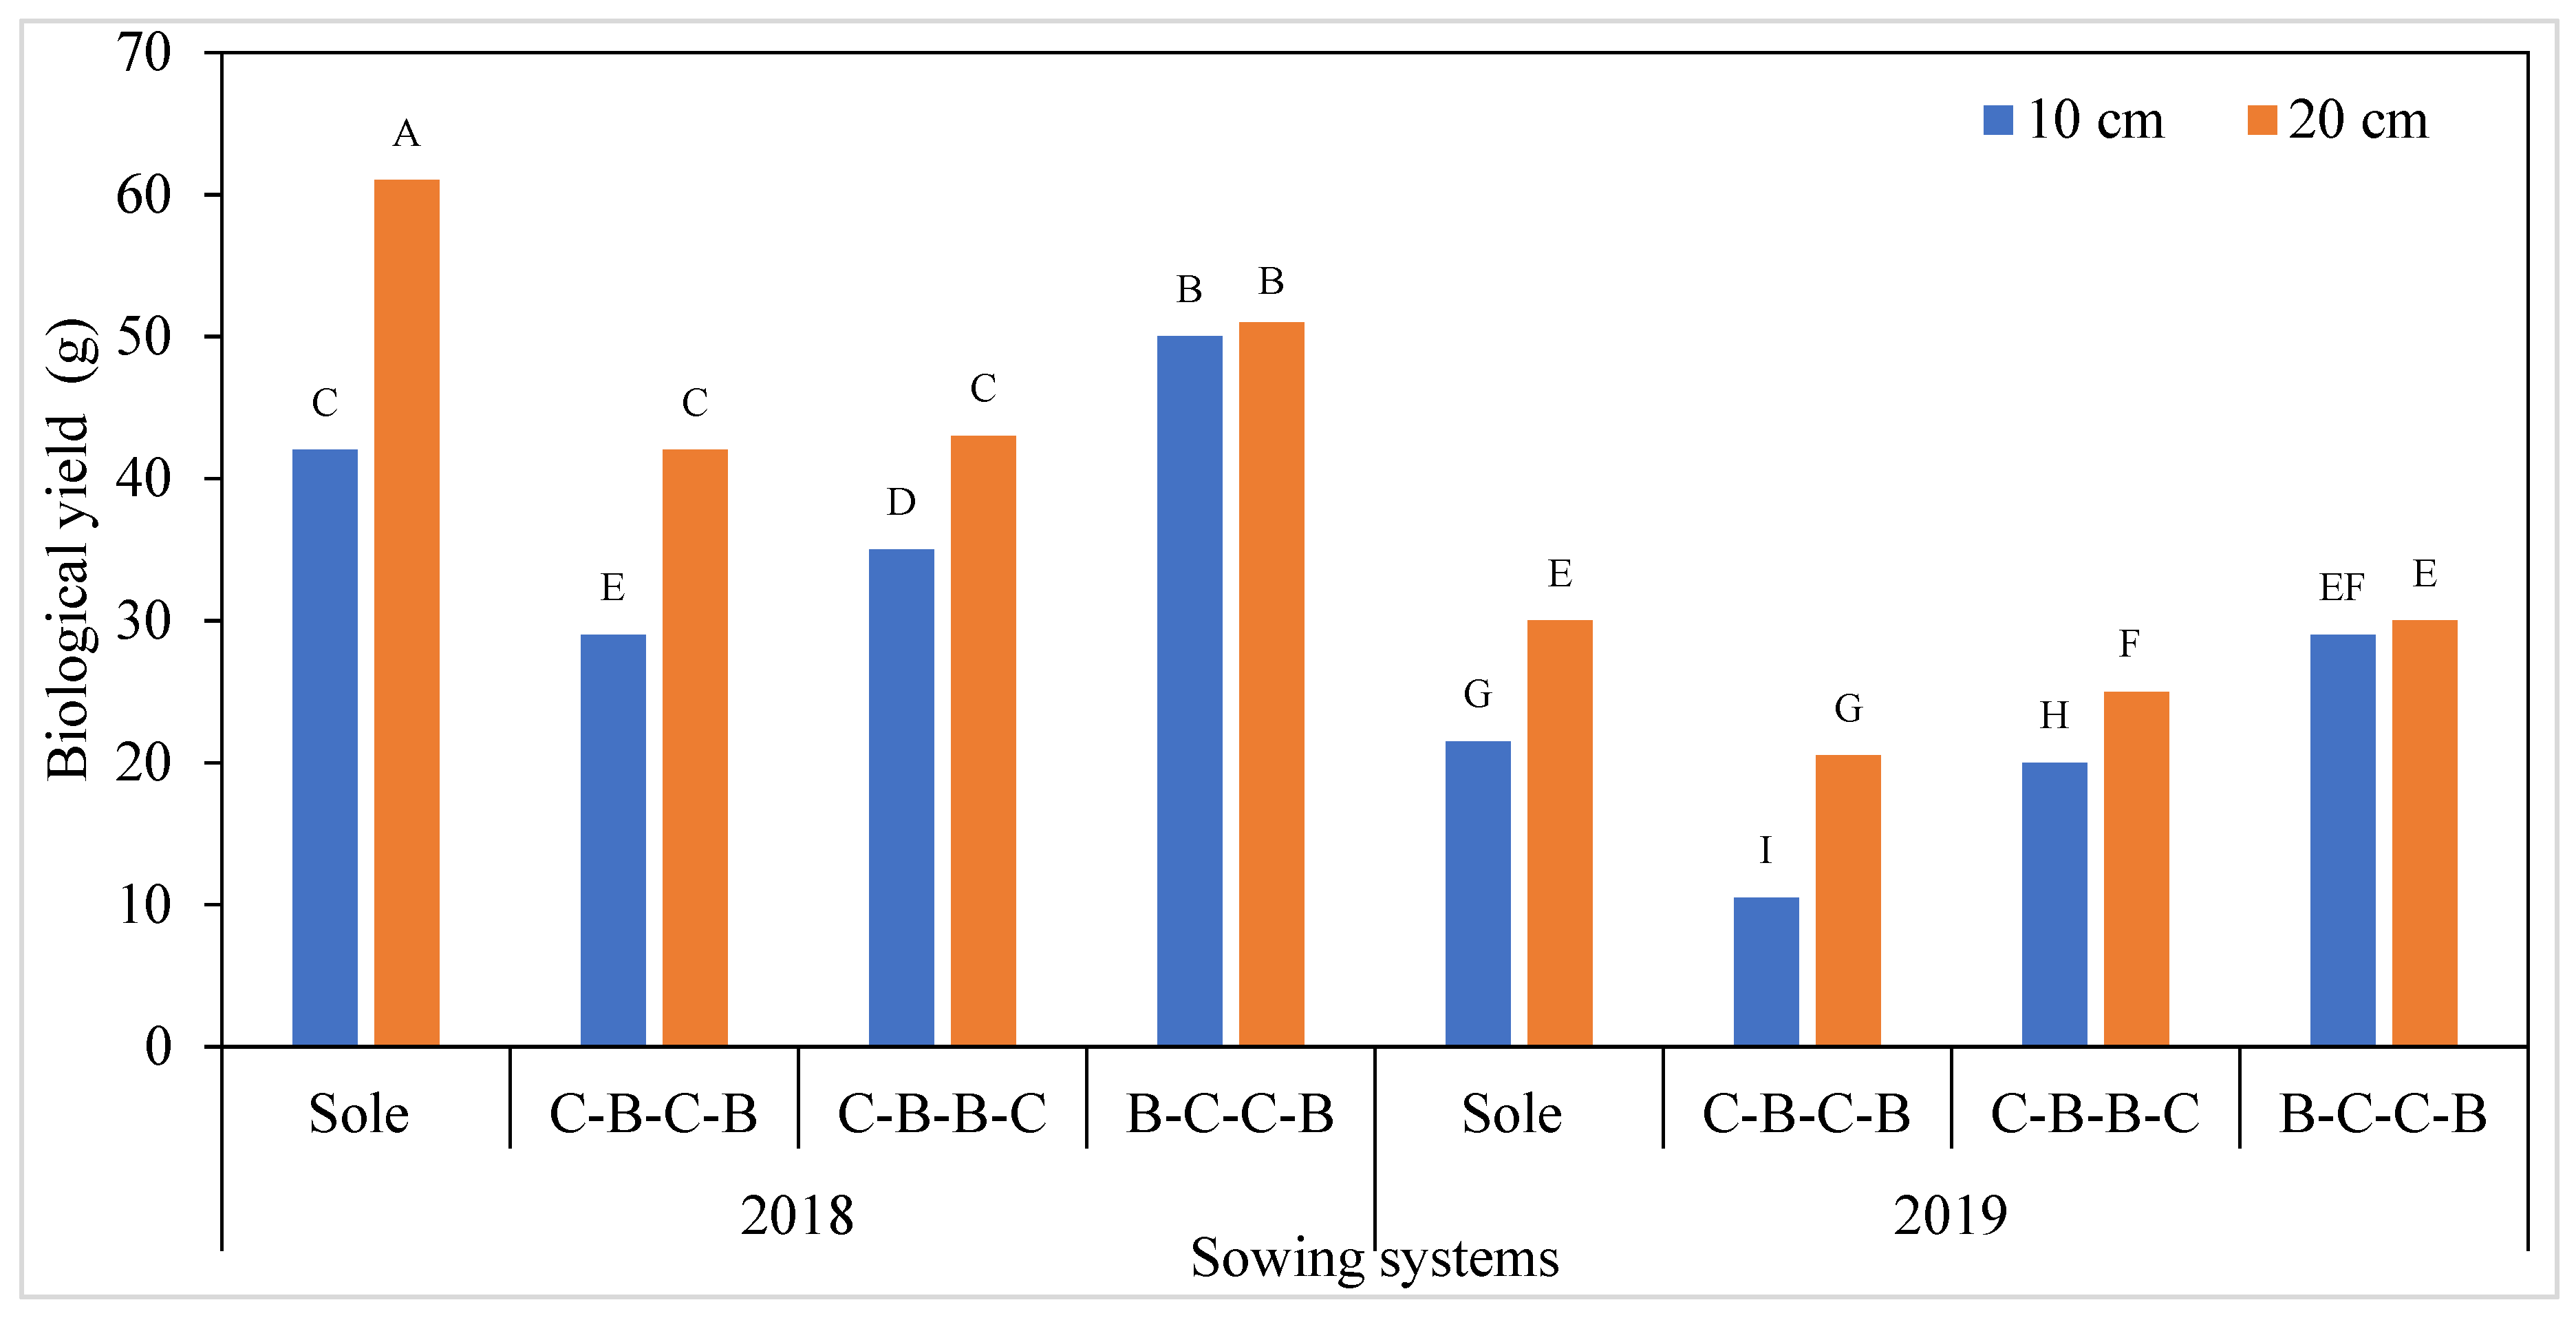
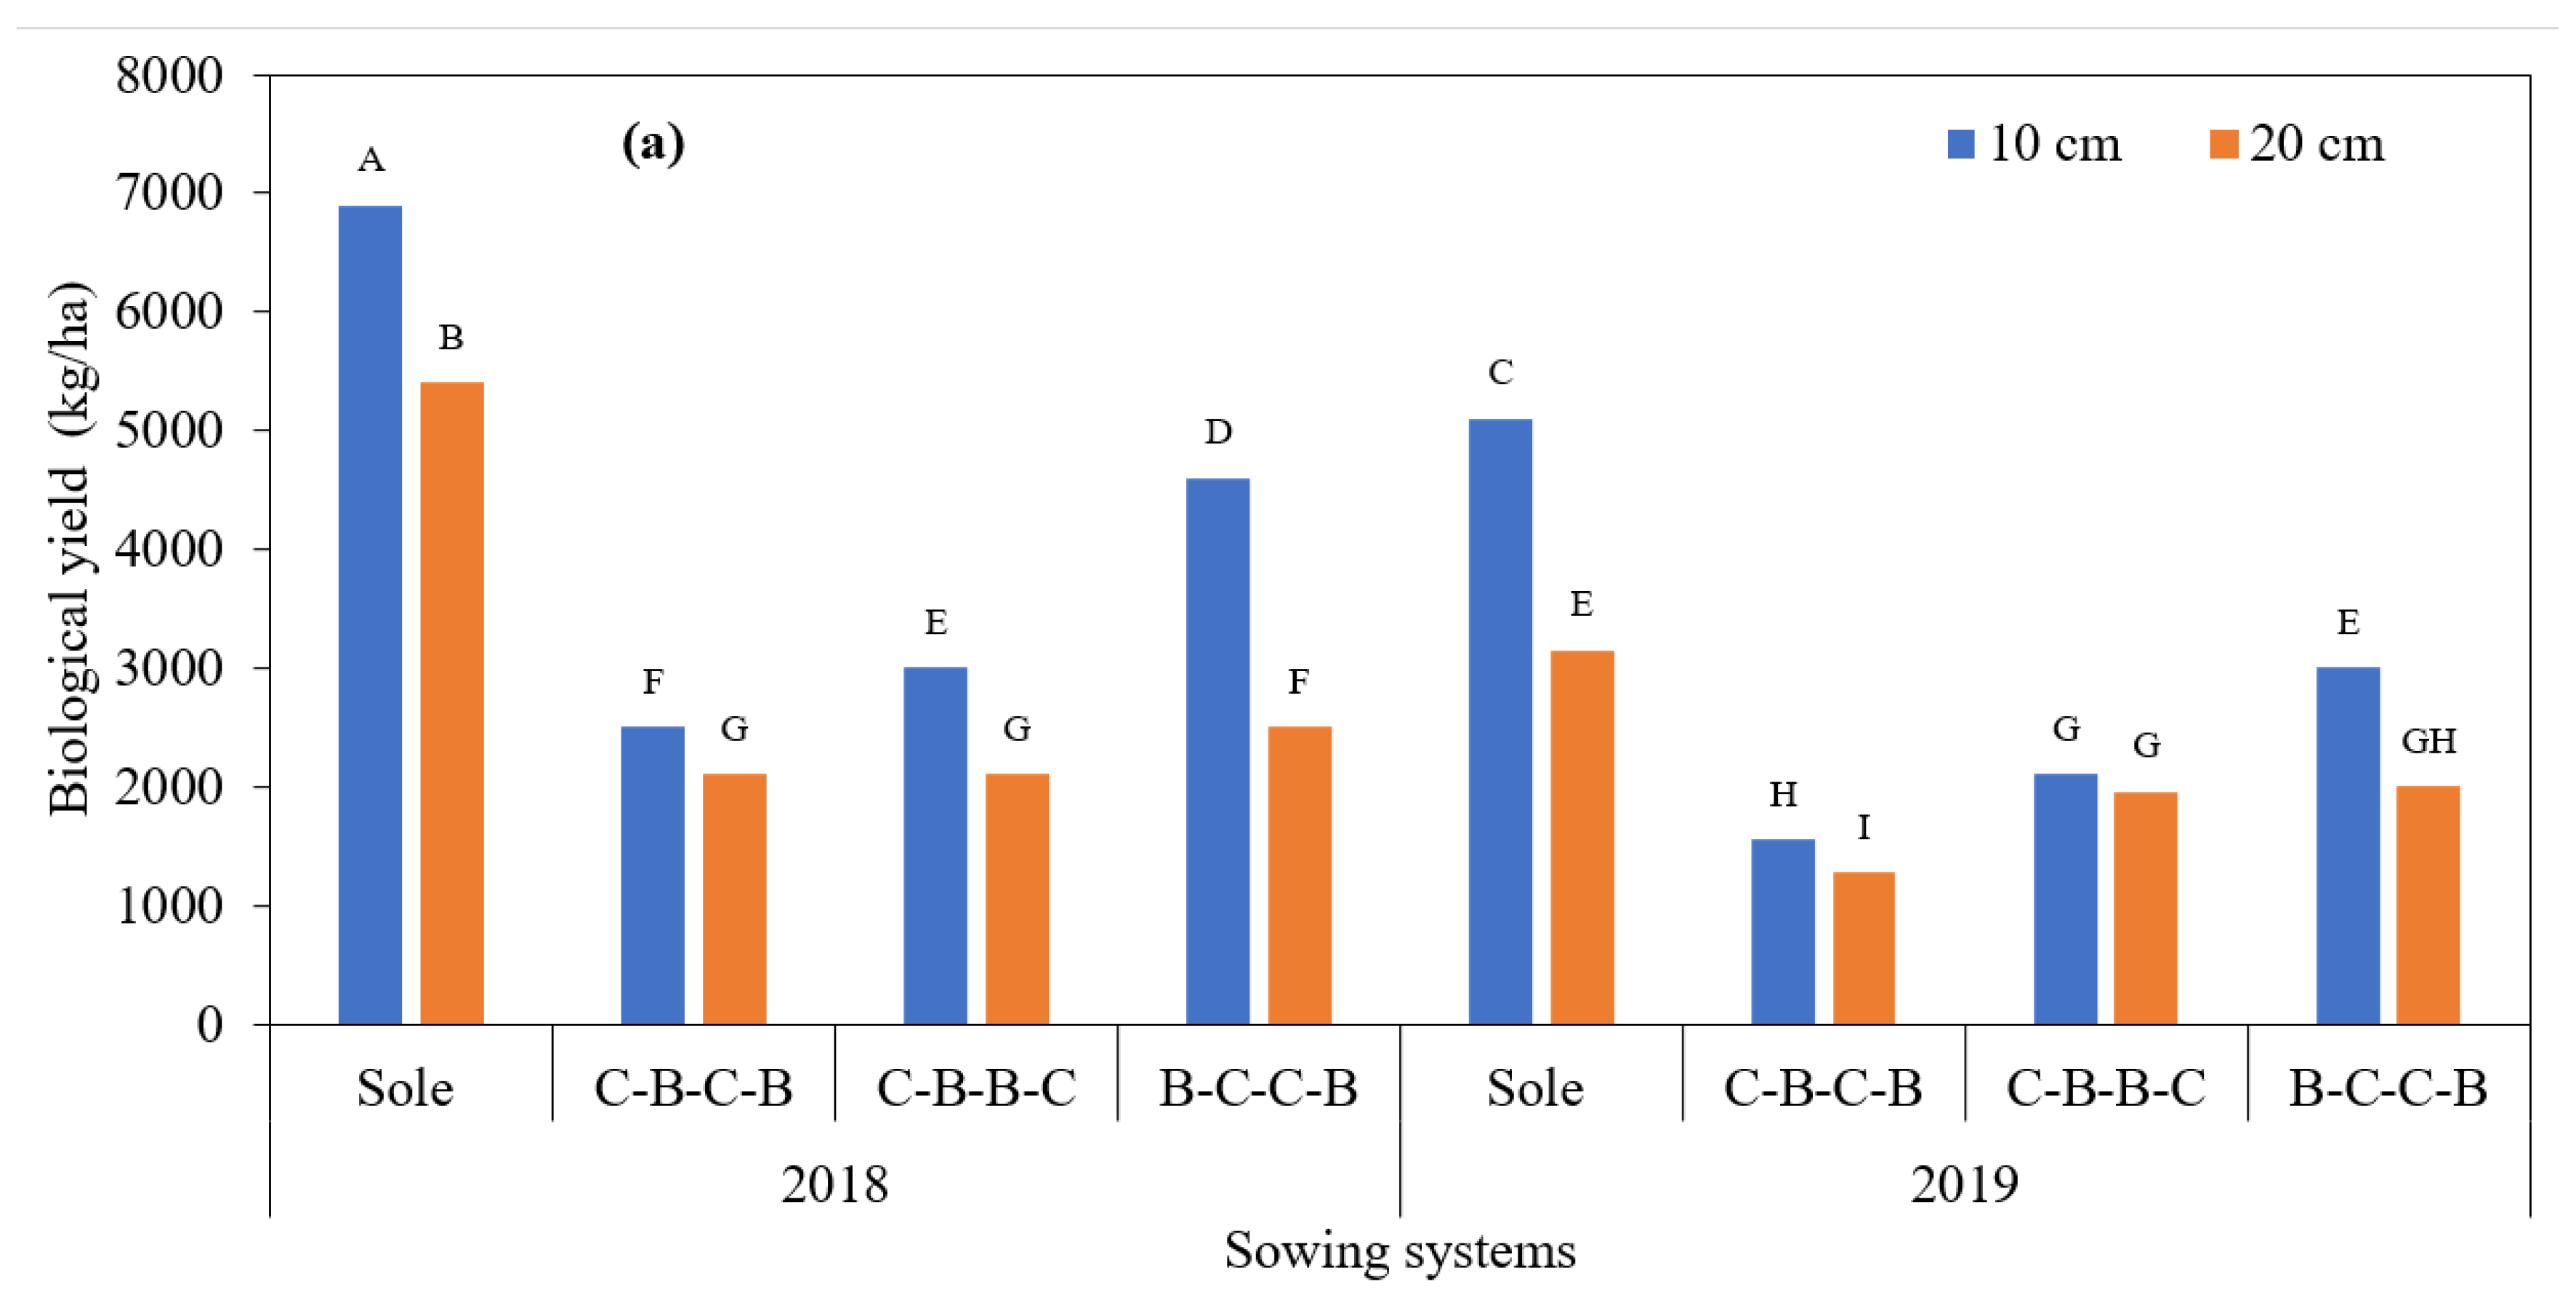
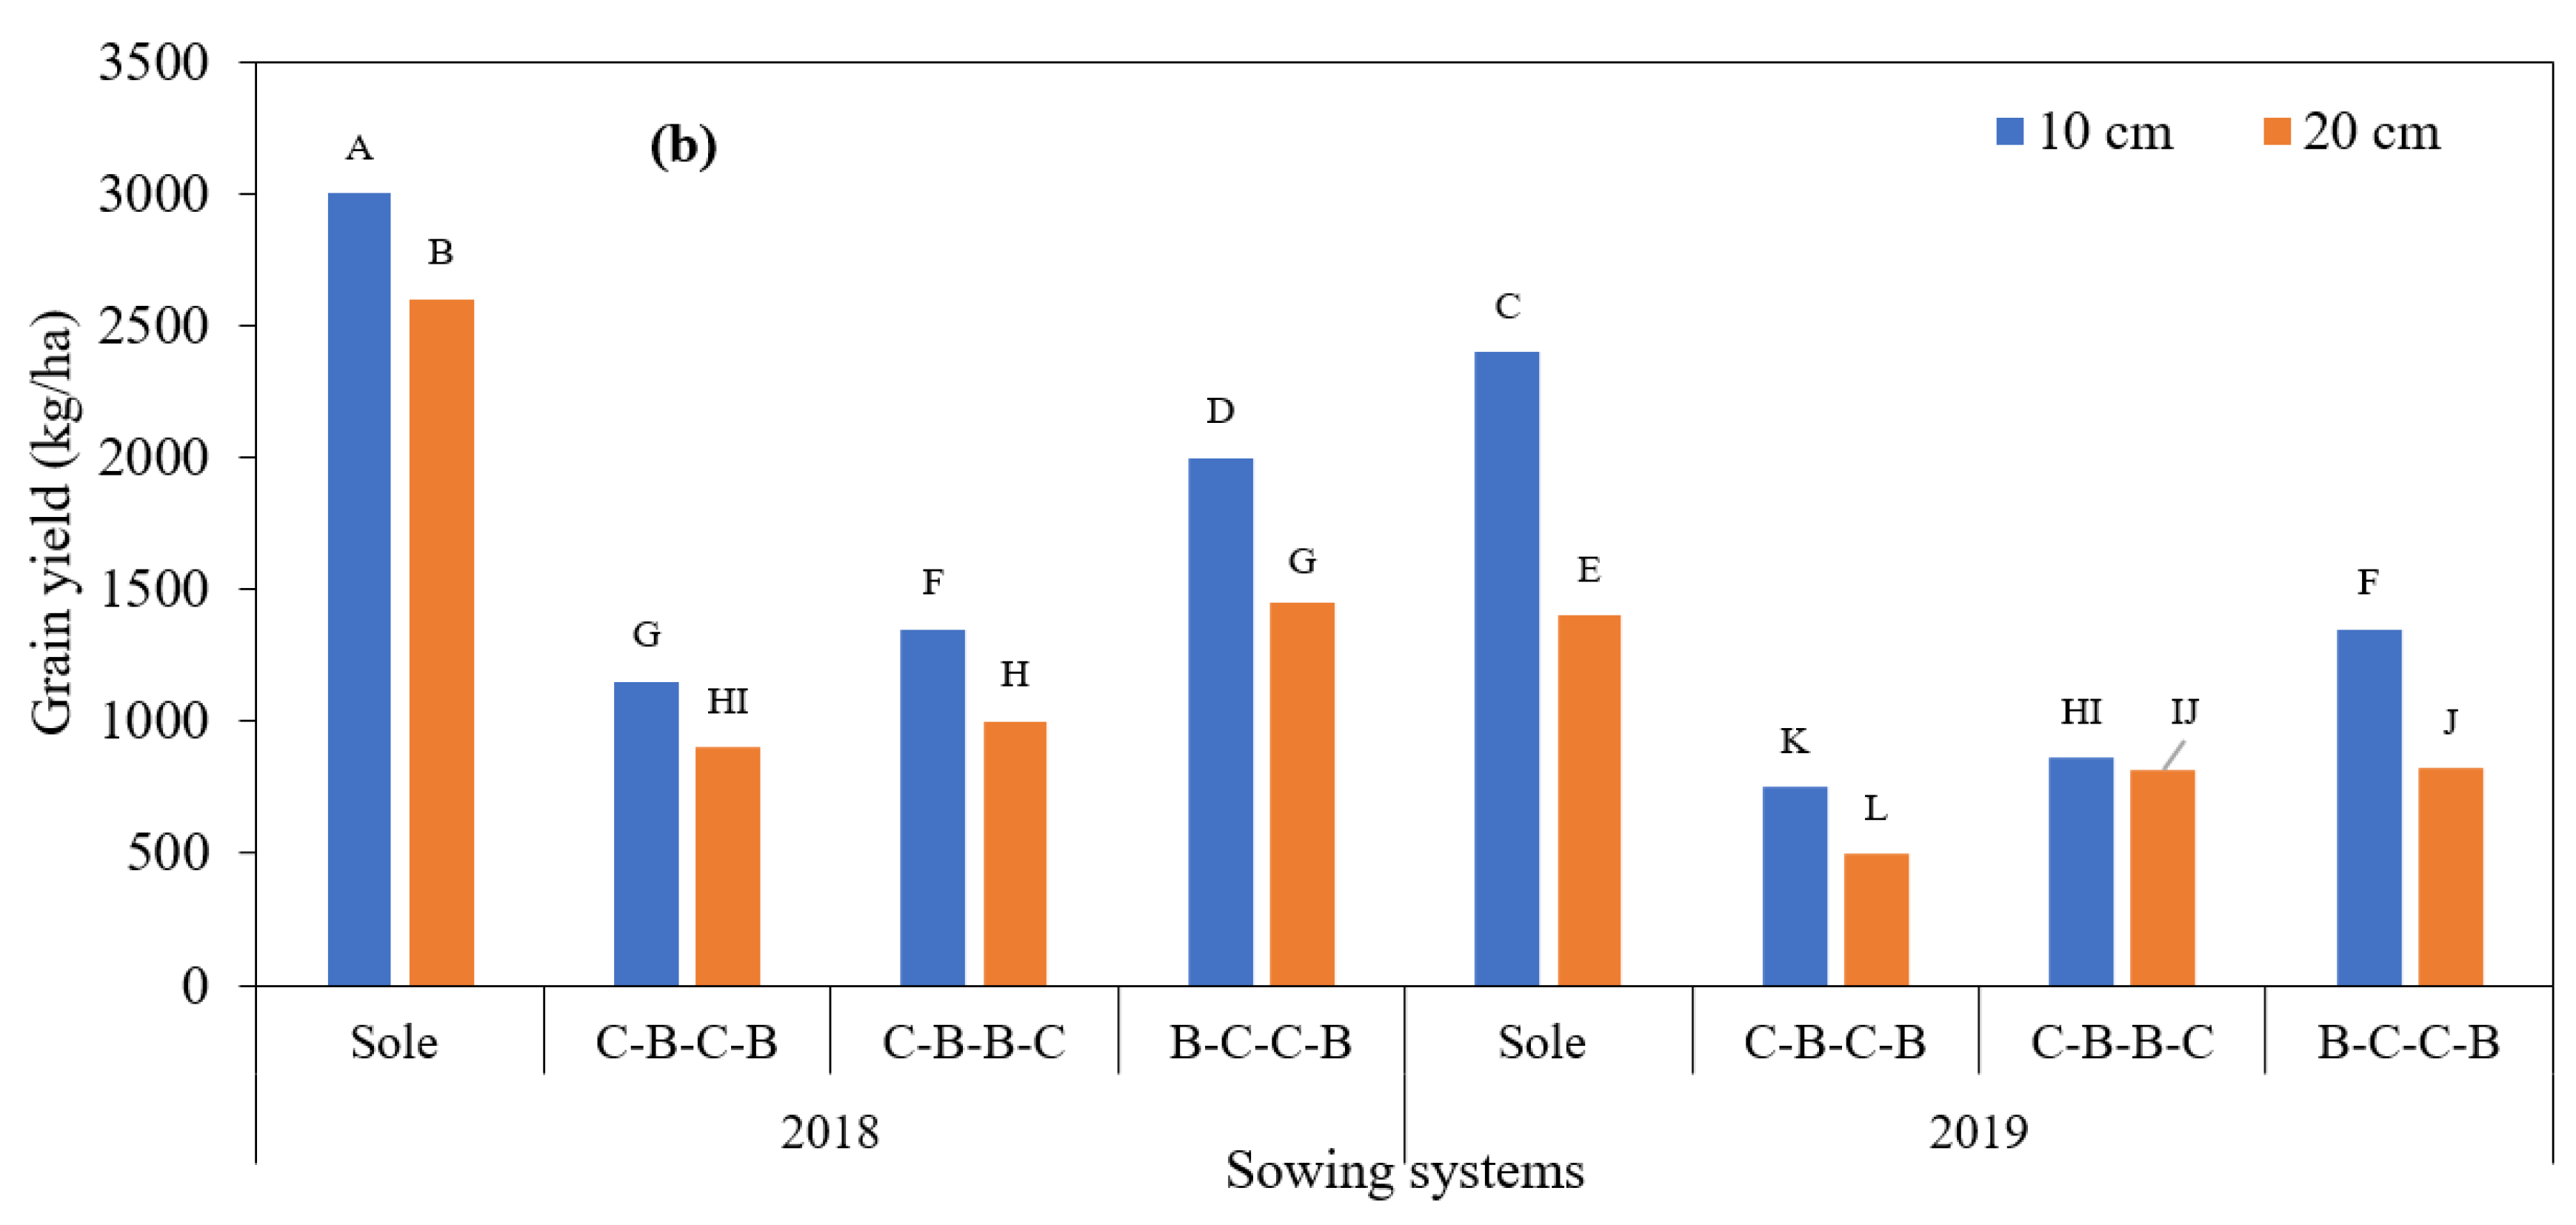
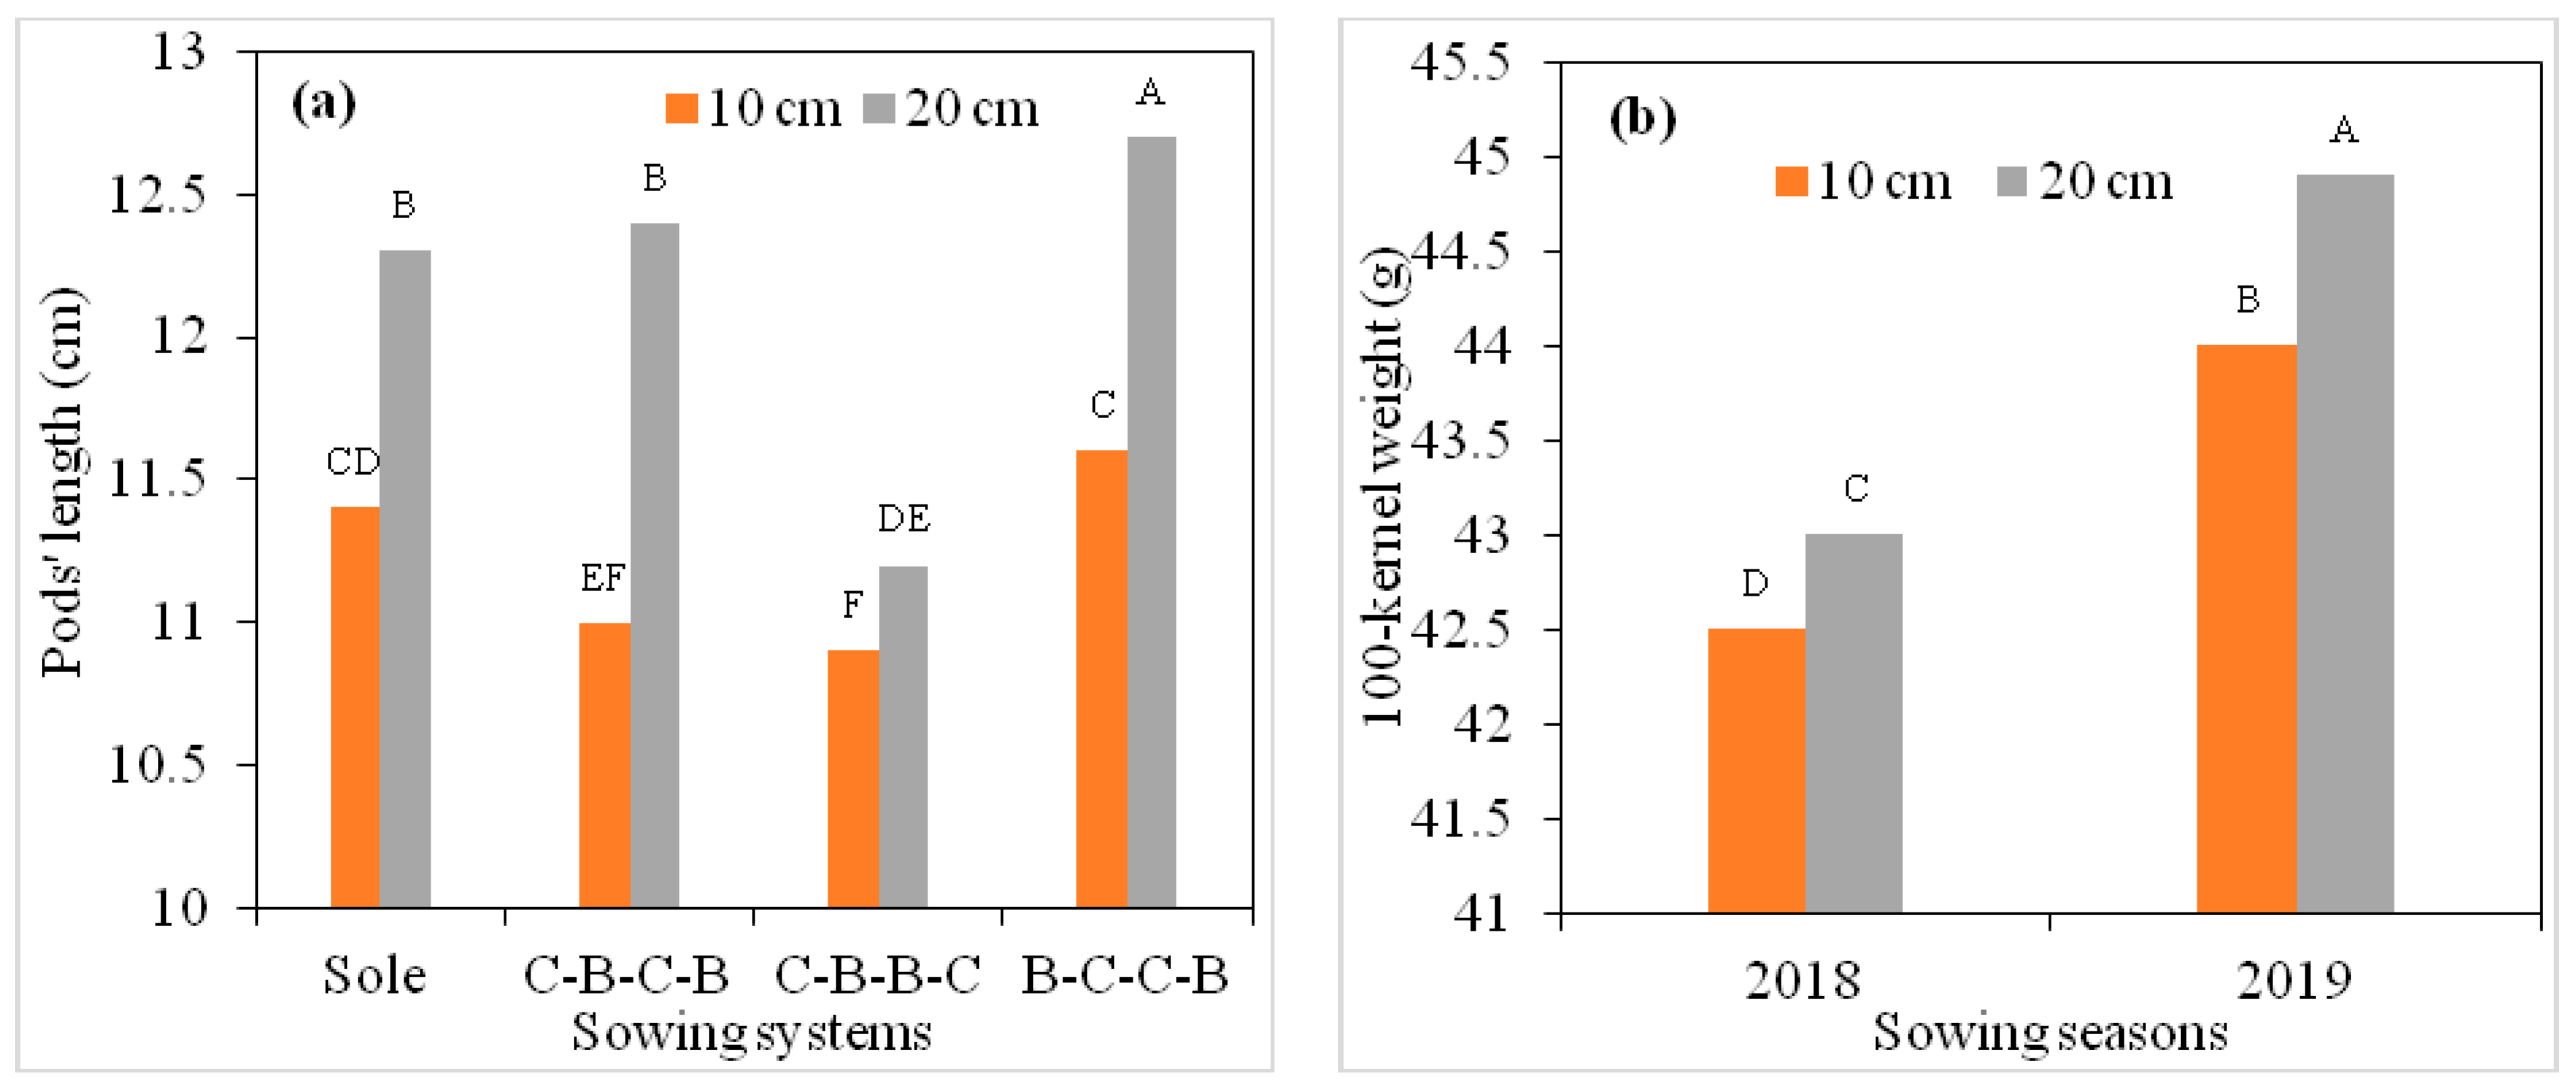
3.2. Yield Characteristics of White Bean

Table 6 interpreted that 1000-kernel weight and protein ratio showed higher values in the second year of white beans, while other yield items showed higher values in the first year. Rai et al. determined 517 g of 1000 grains in dry white bean varieties in the first-year trial, while it decreased to 373 g in the second year due to hot weather [54]. In our study, the white bean grain was wet during harvesting and, due to the hot weather in the first year (Table 2), the 1000-grain weight dropped. In the second year of research, the average June temperature was lower than the first year June temperature, and in the same month was the first development phase that inversely affected the 1000-kernel weight. Summerfield et al. reported that there is a positive linear relationship between plant development after seedling emergence and air temperature [55]. In the second year of our study, there was low air temperature during the first development phase, which was one of the reasons for lower values of grain yield (Table 2 and Table 6).
In terms of the harvest index for white beans, the differences between row spacing and sowing systems were found to be statistically insignificant, while the year × row spacing and year × sowing system interaction was determined as significant using the data of the number of pods and pod length. The biological yield and grain yield of white beans were high in the plots planted at 10 cm intervals, while other examined properties were higher in the plots planted at 20 cm intervals (Figure 6). It is expected that yield elements will be low in plants within thin branches [56]. For thin plants per unit area, the extent of the plants’ grain-filling is greater when using appropriate soil nutrients and sunlight, and as a result, the grain yield is higher [57]. In our analysis, we found that pod length, 100-kernel weight, biological yield, grain yield and protein ratio were higher with sole sowing (Table 6).
In our study, biological yield and grain yield were higher in plants that were planted frequently (Table 6). The competition between plants related to water, nutrients, light, etc., was observed to be low in wide row spacing [58]. After subsequent plantations, the field remained empty, and the yield of unit area decreased significantly; accordingly, the grain yield was higher when the row spacing was less for white beans [58,59].
Thilakarathna et al. reported the same findings as in our research regarding the effect of mixed cropping in terms of light, nutrients and water [60]. It was discovered that in the B-C-C-B sowing system, the grain yield was significantly lower compared with other arrangements due to the shading effects of maize plants. Yildiz et al. [61] noted that the number of pods in the plant was higher in mixed sowings [62]. Nassary et al. stated that, due to shading effects in mixed sowings, the grain weight is affected [62]. Verkuijl et al. reported that the maize protein ratio decreased in intercropping compared with sole sowing [63]. Similarly, in our study, the weight of 100 grains and the protein ratio was higher in sole sowing.
Nassary et al. reported that maize blocked the sunlight landing on intercropping crops such as white beans, which adversely affected the white bean yield compared with the maize yield [62]. Other factors that may contribute to a reduction in grain yield are water, nutrients and the competition between intercropping crops (Figure 7). In our research, the number of plants per m2 was approximately twice more in sole sowing than in mixed sowing. A high number of plants per unit area may also lead to a high grain yield in sole sowing.
The 100-kernel weight and protein ratio of white beans planted at 20 cm row distance showed higher values in the second year than at 10 cm row distance as shown in Figure 8b and Figure 9a, respectively. These responses showed significant interaction over the row × row and year. White bean pod length, grain weight and protein ratio showed higher values under 20 cm row spacing in all sowing systems than under 10 cm row spacing (Figure 8a, Figure 10b and Figure 11). Figure 7a show little difference in row spacing for C-B-B-C compared with the other sowing systems. These responses represent the importance of interactions on row x sowing systems. Protein ratio and 100-kernel weight showed high values in the second year in all sowing systems, while they showed lower values in the first year (Figure 9b and Figure 10a). These findings indicated that year × sowing system interactions are significant. In terms of biological yield and grain yield, intercropping showed lower values, while sole sowing showed higher values (Figure 9a,b). For this reason, interactions of sowing systems, × year × rows, may have been significant. In terms of pod length, higher values were obtained in B-C-C-B (Figure 7a).

3.3. Land Equivalent Ratio (LER) of Maize-White Bean Intercropping Sowing Systems

The LER for grain yield is presented in Table 7. The relative grain yields of maize (LERmaize) were 0.68–0.95, and white bean (LERwhite bean) were 0.63–0.99. The intercropped maize and white bean yields were consistently lower than the mono-cropped maize and white bean yields in all sowing systems (Table 5 and Table 6). Generally, the yield difference between mono-cropping and intercropping sowing of maize was relatively small, while the intercropped white bean yield tended to be suppressed to a greater extent as the adjacent maize plants received more sunlight, water, fertilizer, etc. (Table 5 and Table 6). The LER value was 1.31–1.94 and significantly above 1 in all treatments.
The highest value of LER was obtained in both row spacing systems (10–20 cm and 20–40 cm for white beans and maize) of the B-C-C-B sowing system with 1.79 and 1.94, respectively. The lowest LER value was obtained in the C-B-C-B sowing system with 1.31–1.52 (Table 7). Through this analysis, it can be concluded that the B-C-C-B mixed sowing method is more advantageous in terms of unit area efficiency than the other sowing methods. Tanveer et al. reported that LER values are indicators of field use efficiency that may differ according to the sowing systems used in different studies [64].

4. Conclusions

This study examined the performance of maize-white bean sowing systems at Aydin Research Institute, Nur Sultan, Kazakhstan. The present study revealed that various row spacing and sowing methods affect the productivity of maize and white bean directly, depending on the thermal and precipitation factors in a given region. Sole sowing provided the highest grain yield for both maize and white beans as the photosynthetic area per plant is more in sole sowing. According to the adopted sowing systems, C-B-B-C for maize and B-C-C-B for white beans were the best systems for yield and its components. An evaluation of the different treatments of sowing systems using the LER showed that, in all of the treatments, the value of LER was more than one. From a relative comparison of the LER values for all treatments, the B-C-C-B maize-white bean sowing system demonstrated the most advantageous productivity at this study site. These findings indicate that a maize-white bean sowing system could be a beneficial way to introduce white beans while ensuring subsistent maize production in humid continental climate regions.

Author Contributions

Conceptualization, A.Z., R.S.N. and G.W.; methodology, A.Z. and G.W.; formal analysis, A.Z. and R.S.N.; investigation and resources, G.W.; data curation, A.Z. and R.S.N.; writing—original draft preparation A.Z. and R.S.N.; writing—review and editing, R.S.N., A.N.S., M.M.W., S.U., and A.I.K.; visualization, G.W.; supervision, G.W. All authors have read and agreed to the published version of the manuscript.

Funding

This research received no external funding.

Data Availability Statement

All data is provided in the manuscript.

Acknowledgments

The authors would like to thank College of Economics and Management Northeast Agricultural University Harbin for assistance. Authors also would acknowledge Waqas Aslam (UIMS, PMAS-Arid Agriculture University, Rawalpindi) and Sami Ullah, Deanship of Scientific Research at King Khalid University RGP.2/169/42, Saudi Arabia, for their significant contributions in this research publication.

Conflicts of Interest

The authors declare no conflict of interest.

References

  1. Maitra, S.; Hossain, A.; Brestic, M.; Skalicky, M.; Ondrisik, P.; Gitari, H.; Brahmachari, K.; Shankar, T.; Bhadra, P.; Palai, J.B.; et al. Intercropping—A low input agricultural strategy for food and environmental security. Agronomy 2021, 11, 343. [Google Scholar] [CrossRef]
  2. Waha, K.; Dietrich, J.P.; Portmann, F.T.; Siebert, S.; Thornton, P.K.; Bondeau, A.; Herrero, M. Multiple cropping systems of the world and the potential for increasing cropping intensity. Glob. Environ. Chang. 2020, 64, 102131. [Google Scholar] [CrossRef] [PubMed]
  3. Agegnehu, G.; Ghizaw, A.; Sinebo, W. Yield performance and land-use efficiency of Barley and Faba White Bean mixed cropping in Ethiopian highlands. Eur. J. Agron. 2006, 25, 202–207. [Google Scholar] [CrossRef]
  4. Li, L.; Li, S.; Sun, J.; Zhou, L.; Bao, X.; Zhang, H.; Zhang, F. Diversity Enhances Agricultural Productivity via Rhizosphere Phosphorus Facilitation on Phosphorus-Deficient Soils. Proc. Natl. Acad. Sci. USA 2007, 104, 11192–11196. [Google Scholar] [CrossRef] [PubMed] [Green Version]
  5. Trenbath, B.R. Intercropping for the management of pests and diseases. Field Crops Res. 1993, 34, 381–405. [Google Scholar] [CrossRef]
  6. Zhu, Y.; Chen, H.; Fan, J.; Wang, Y.; Li, Y.; Chen, J.; Fan, J.X.; Yang, S.; Hu, L.; Leung, H.; et al. Genetic diversity and disease control in Rice. Nature 2000, 406, 718–722. [Google Scholar] [CrossRef] [PubMed]
  7. Rusinamhodzi, L.; Corbeels, M.; Nyamangara, J.; Giller, K.E. Field crops research maize-grain legume intercropping is an attractive option for ecological intensification that reduces climatic risk for smallholder farmers in central Mozambique. Field Crops. Res. 2012, 136, 12–22. [Google Scholar] [CrossRef] [Green Version]
  8. Huang, C.; Liu, Q.; Heerink, N.; Stomph, T.; Li, B.; Liu, R.; Zhang, H.; Wang, C.; Li, X.; Zhang, C.; et al. Economic performance and sustainability of a novel sowing system on the North China Plain. PLoS ONE 2015, 10, e0135518. [Google Scholar] [CrossRef] [Green Version]
  9. Altieri, M.A.; Nicholls, C.I. An agroecological basis for designing diversified cropping systems in the tropics. J. Crop Improv. 2004, 11, 81–103. [Google Scholar] [CrossRef]
  10. Paulsen, H.M.; Schochow, M.; Ulber, B.; Kuhne, S.; Rahmann, G. Mixed cropping systems for biological control of weeds and pests in organic oilseed crops. Asp. Appl. Biol. 2006, 79, 215–219. [Google Scholar]
  11. Knörzer, H.; Graeff-hönninger, S.; Guo, B.; Wang, P. Climate Change, Intercropping, Pest Control and Beneficial Microorganisms; Springer: Dordrecht, The Netherlands, 2009. [Google Scholar] [CrossRef]
  12. Lithourgidis, A.S.; Dordas, C.A.; Damalas, C.A.; Vlachostergios, D.N. Annual intercrops: An alternative pathway for sustainable agriculture. Aust. J. Crop Sci. 2011, 5, 396–410. [Google Scholar]
  13. Stanisławska-Glubiak, E.; Korzeniowska, J. Effect of excessive zinc content in soil on the phosphorus content in wheat plants. Electron. J. Pol. Agric. Univ. 2005, 8, 1–11. [Google Scholar]
  14. Li, L.; Zhang, L.; Zhang, F. Crop mixtures and the mechanisms of overyielding. In Encyclopedia of Biodiversity, 2nd ed.; Elsevier Inc.: Amsterdam, The Netherlands, 2013; pp. 382–395. [Google Scholar] [CrossRef]
  15. Zhang, F.; Li, L. Using competitive and facilitative interactions in intercropping systems enhances crop productivity and nutrient-use efficiency. Ann. Oper. Res. 2003, 248, 305–312. [Google Scholar] [CrossRef]
  16. Vandermeer, J.H. The Ecology of Intercropping; Cambridge University Press: Cambridge, UK, 1989. [Google Scholar] [CrossRef]
  17. Hauggaard-Nielsen, H.; Jensen, E.S. Evaluating pea and barley cultivars for complementarity in intercropping at different levels of soil n availability. Field. Crop. Res. 2001, 72, 185–196. [Google Scholar] [CrossRef]
  18. Loreau, M.; Hector, A. Partitioning selection and complementarity in biodiversity experiments. Nature 2001, 412, 72–76. [Google Scholar] [CrossRef]
  19. Oliveira, M.; Barré, P.; Trindade, H.; Virto, I. Different efficiencies of grain legumes in crop rotations to improve soil aggregation and organic carbon in the short-term in a sandy cambisol. Soil Tillage Res. 2019, 186, 23–35. [Google Scholar] [CrossRef]
  20. Ogindo, H.O.; Walker, S. Comparison of measured changes in seasonal soil water content by rainfed maize-white bean intercrop and component cropping systems in a semi-arid region of Southern Africa. Phys. Chem. Earth 2005, 30, 799–808. [Google Scholar] [CrossRef]
  21. Tsubo, M.; Walker, S.; Ogindo, H.O. A simulation model of cereal-legume intercropping systems for semi-arid regions: Ii. model application. Field. Crop. Res. 2005, 93, 23–33. [Google Scholar] [CrossRef]
  22. O’Callaghan, J.R.; Maende, C.; Wyseure, G.C.L. Modelling the intercropping of maize and white beans in Kenya. Comput. Electron. Agric. 1994, 11, 351–365. [Google Scholar] [CrossRef]
  23. Subedi, K.D.; Ma, B.L. Maize Crop Production: Growth, Fertilization and Yield; Nova Publisher: Hauppauge, NY, USA, 2009. [Google Scholar] [CrossRef]
  24. Bilalis, D.; Papastylianou, P.; Konstantas, A.; Patsiali, S.; Karkanis, A.; Efthimiadou, A. Weed-suppressive effects of maize-legume intercropping in organic farming. Int. J. Pest Manag. 2010, 56, 173–181. [Google Scholar] [CrossRef]
  25. Mutungi, C.; Muthoni, F.; Bekunda, M.; Gaspar, A.; Kabula, E.; Abass, A. Physical quality of maize grain harvested and stored by smallholder farmers in the northern highlands of Tanzania: Effects of harvesting and pre-storage handling practices in two marginally contrasting agro-locations. J. Stored Prod. Res. 2019, 84, 101517. [Google Scholar] [CrossRef]
  26. Laghari, G.M.; Oad, F.C.; Tunio, S.; Chachar, Q.; Gandahi, A.W.; Siddiqui, M.H.; Waseem, S.; Hassan, U.L.; Ali, A. Growth and yield attributes of wheat at different seed rates. Sarhad J. Agric. 2011, 27, 177–183. [Google Scholar]
  27. Yates, P.L. Food and Agriculture Organization of the United Nations. J. Farm Econ. 1946, 28, 54. [Google Scholar] [CrossRef] [Green Version]
  28. Pansu, M.; Gautheyrou, J. Inorganic forms of Nitrogen. In Handbook of Soil Analysis; Springer: Berlin/Heidelberg, Germany, 2006; pp. 767–792. [Google Scholar] [CrossRef]
  29. Broka, S.; Giertz, Å.; Christensen, G.; Rasmussen, D.; Morgounov, A.; Fileccia, T.; Rubaiza, R. Kazakhstan: Agricultural Sector Risk Assessment; Report Number 103076-KZ; World Bank: Washington, DC, USA, 2016. [Google Scholar]
  30. Moosavi, S.G. The effect of water deficit stress and nitrogen fertilizer levels on morphology traits, yield and leaf area index in maize. Pakistan J. Bot. 2012, 44, 1351–1355. [Google Scholar]
  31. Rasul, G.; Chaudhry, Q.Z.; Mahmood, A.; Hyder, K.W. Effect of temperature rise on crop growth & productivity. Pak. J. Meteorol. 2002, 8, 53–62. [Google Scholar]
  32. Çakir, R. Effect of water stress at different development stages on vegetative and reproductive growth of maize. Field. Crop. Res. 2004, 89, 1–16. [Google Scholar] [CrossRef]
  33. Ajah, J.; Nmadu, J.N. Socio-economic factors influencing the output of small-scale maize farmers in Abuja, Nigeria. Kasetsart J. Soc. Sci. 2012, 33, 333–341. [Google Scholar]
  34. Undp, K. Building the Climate Resilience of Grain Farming in Northern Kazakhstan; United Nations Development Programme: New York, NY, USA, 2019. [Google Scholar]
  35. Hassan, A. Effect of plant population density on yield and yield components of eight Egyptian maize hybrids. Bull. Fac. Agric. Univ. Cairo 2000, 51, 1–16. [Google Scholar]
  36. Khan, A. Evaluation of maize hybrids for grain yield in D.I. Khan. Pakistan J. Biol. Sci. 1999, 2, 413–414. [Google Scholar] [CrossRef]
  37. Thakur, D.R.; Prakash, O.M.; Kharwara, P.C.; Bhalla, S.K. Effect of nitrogen and plant spacing on growth, yield and economics of baby maize (Zea Mays). Indian J. Agron. 1997, 42, 479–483. [Google Scholar]
  38. Masood, T.; Gul, R.; Munsif, F.; Jalal, F.; Hussain, Z.; Noreen, N.; Khan, H.H. Effect of different phosphorus levels on the yield and yield components of maize. Sarhad J. Agric. 2011, 27, 167–170. [Google Scholar]
  39. Zamir, M.S.I.; Ahmad, A.H.; Javeed, H.M.R.; Latif, T. Growth and yield behaviour of two maize hybrids (Zea Mays L.) towards different plant spacing. Cercet. Agron. Mold. 2013, 44, 33–40. [Google Scholar] [CrossRef] [Green Version]
  40. Kharazmshahi, H.A.; Zahedi, H.; Alipour, A. Effects of sowing date on yield and yield components in sweet maize (Zea Mays L.) hybrids. Maydica 2015, 60, 835–840. [Google Scholar]
  41. Licht, M.A. Influence of Maize Seeding Rate, Soil Attributes, and Topographic Characteristics on Grain Yield, Yield Components, and Grain Composition. Ph.D. Thesis, Iowa State University, Ames, IA, USA, 2015. [Google Scholar]
  42. Rahmani, A.; Alhossini, M.; Khorasani, S. Effect of planting date and plant densities on yield and yield components of sweet maize (Zea Mays L. Var Saccharata). Am. J. Exp. Agric. 2016, 10, 1–9. [Google Scholar] [CrossRef]
  43. Farhadi-afshar, H.R.; Madani, H.; Shirzadi, M.H.; Najafi, I. Archive of SID study of effects of cultivar, weeds and plant density on yield and yield components of sweet maize under Iranian warm environment. Arch. SID 2009, 3, 103–108. [Google Scholar]
  44. Bhatt, P.S. Response of sweet maize hybrid to varying plant densities and nitrogen levels. Afr. J. Agric. Res. 2012, 7, 6158–6166. [Google Scholar] [CrossRef] [Green Version]
  45. Leakey, A.D.B.; Uribelarreà, M.; Ainsworth, E.A.; Naidu, S.L.; Rogers, A.; Ort, D.R.; Long, S.P. Photosynthesis, productivity, and yield of maize are not affected by open-air elevation of CO2 concentration in the absence of drought. Plant Physiol. 2006, 140, 779–790. [Google Scholar] [CrossRef] [Green Version]
  46. Babu, S.; Singh, R.; Avasthe, R.K.; Yadav, G.S.; Das, A.; Singh, V.K.; Mohapatra, K.P.; Rathore, S.S.; Chandra, P.; Kumar, A. Impact of land configuration and organic nutrient management on productivity, quality and soil properties under baby maize in eastern Himalayas. Sci. Rep. 2020, 10, 16129. [Google Scholar] [CrossRef]
  47. Malhotra, S.K. Diversification in utilization of maize and production diversification in utilization of maize and production. Perspect. Maize Prod. Value Chain-A Compend. 2017, 5, 49–57. [Google Scholar]
  48. Chaudhary, D.P.; Kumar, A.; Kumar, R.; Singode, A.; Mukri, G.; Sah, R.P.; Tiwana, U.S.; Kumar, B. Evaluation of normal and specialty maize for fodder yield and quality traits. Range Manag. Agrofor. 2016, 37, 79–83. [Google Scholar]
  49. Xue, J.; Xie, R.Z.; Zhang, W.F.; Wang, K.R.; Hou, P.; Ming, B.; Gou, L.; Li, S. Research progress on reduced lodging of high-yield and -density maize. J. Integr. Agric. 2017, 16, 2717–2725. [Google Scholar] [CrossRef]
  50. Nyambo, P.; Chiduza, C.; Araya, T. Carbon input and maize productivity as influenced by tillage, crop rotation, residue management and biochar in a semiarid region in South Africa. Agronomy 2020, 10, 705. [Google Scholar] [CrossRef]
  51. Rao, M.R.; Willey, R.W. Effects of pigeonpea plant population and row arrangement in sorghum/pigeonpea intercropping. Field. Crop. Res. 1983, 7, 203–212. [Google Scholar] [CrossRef] [Green Version]
  52. Muoneke, C. Effect of maize planting density on the performance of maize/soy white bean intercropping system in a guinea savannah agroecosystem. Afr. J. Agric. Res. 2007, 2, 667–677. [Google Scholar]
  53. Sarlak, S. Effect of plant density and mixing ratio on crop yield in sweet maize/mung white bean intercropping. Pakistan J. Biol. Sci. 2011, 11, 2128–2133. [Google Scholar] [CrossRef] [PubMed]
  54. Rai, A.; Sharma, V.; Heitholt, J. Dry white bean [phaseolus vulgaris l.] growth and yield response to variable irrigation in the arid to semi-arid climate. Sustainability 2020, 12, 3851. [Google Scholar] [CrossRef]
  55. Summerfield, R.J.; Roberts, E.H.; Ellis, R.H.; Lawn, R.J. Towards the reliable prediction of time to flowering in six annual crops in the development of simple models for fluctuating field environments. Exp. Agric. 1991, 27, 11–31. [Google Scholar] [CrossRef]
  56. Souza, S.A.; Vieira, J.H.; dos Santos Farias, D.B.; da Silva, G.H.; Aleman, C.C. Impact of irrigation frequency and planting density on white bean’s morpho-physiological and productive traits. Water 2020, 12, 2468. [Google Scholar] [CrossRef]
  57. Ahmed, A.; Aftab, S.; Hussain, S.; Cheema, H.N.; Liu, W.; Yang, F.; Yang, W. Nutrient accumulation and distribution assessment in response to potassium application under maize-soywhite bean intercropping system. Agronomy 2020, 10, 725. [Google Scholar] [CrossRef]
  58. Craine, J.M.; Dybzinski, R. Mechanisms of plant competition for nutrients, water and light. Funct. Ecol. 2013, 27, 833–840. [Google Scholar] [CrossRef]
  59. Jafroudi, A.T.; Moghaddam, A.F.; Hasanzade, A.; Yazdifar, S.; Rahmanzade, S. Row spacing and inter row spacing effects on some agro-physiological traits of two common white bean (Phaseolous vulgaris L.) cultivars. Pakistan J. Biol. Sci. 2007, 10, 4543–4546. [Google Scholar] [CrossRef] [Green Version]
  60. Thilakarathna, M.S.; McElroy, M.S.; Chapagain, T.; Papadopoulos, Y.A.; Raizada, M.N. Belowground nitrogen transfer from legumes to non-legumes under managed herbaceous cropping systems. A review. Agron. Sustain. Dev. 2016, 36, 58. [Google Scholar] [CrossRef] [Green Version]
  61. Yildiz Tiryaki, G.; Cil, A.; Tiryaki, I. Revealing seed coat colour variation and their possible association with seed yield parameters in common vetch (Vicia sativa L.). Int. J. Agron. 2016, 2016, 1804108. [Google Scholar] [CrossRef] [Green Version]
  62. Nassary, E.K.; Baijukya, F.; Ndakidemi, P.A. Assessing the productivity of common white bean in intercrop with maize across agro-ecological zones of smallholder farms in the northern highlands of Tanzania. Agriculture 2020, 10, 117. [Google Scholar] [CrossRef] [Green Version]
  63. Verkuijl, H.; Mwangi, W.; Moshi, A.J.; Chilagane, A.; Kaswende, J.S. Adoption of Maize Production Technologies in Eastern Tanzania Adoption of Maize Production Technologies in 1998; International Maize and Wheat Improvement Center (CIMMYT), The United Republic of Tanzania, The Southern Africa Centre for Cooperation in Agricultural Research (SACCAR): Texcoco, Mexico, 1998. [Google Scholar]
  64. Tanveer, M.; Anjum, S.A.; Zahid, H.; Rehman, A.; Sajjad, A. Growth and development of maize (Zea mays L.). J. Agric. Res. 2014, 52, 511–523. [Google Scholar]
Figure 1. The interactions of maize-white bean sowing systems using cobs per plant for the year x row spacing interaction (a) and the year x sowing system interaction (b) at the study location in Nur Sultan, Kazakhstan. Letters on each bar represent a significance level at p < 0.01. Note: different letters denote significant differences, while the same letters indicate insignificantly different values.
Agronomy 12 00240 g001
Figure 2. The interactions of maize-white bean sowing systems on cob weight in the Nur Sultan, Kazakhstan study area. Letters on each bar represent a significance level at p < 0.01. Note: different letters denote significant differences, while the same letters indicate insignificantly different values.
Agronomy 12 00240 g002
Figure 3. The interactions of maize-white bean sowing systems on cob length (a) and seeds per cob (b) at Nur Sultan, Kazakhstan research station. Letters on each bar represent a significance level at p < 0.01. Note: different letters denote significant differences, while the same letters indicate insignificantly different values.
Agronomy 12 00240 g003
Figure 4. The interactions of maize-white bean sowing systems on hectoliter weight at Nur Sultan, Kazakhstan research station. Letters on each bar represent a significance level at p < 0.01. Note: different letters denote significant differences, while the same letters indicate insignificantly different values.
Agronomy 12 00240 g004
Figure 5. The interactions of maize-white bean sowing systems on 1000-kernel weight (a), grain yield (b) and protein ratio (c) at Nur Sultan, Kazakhstan research station. Letters on each bar represent a significance level at p < 0.01. Note: different letters denote significant differences, while the same letters indicate insignificantly different values.
Agronomy 12 00240 g005aAgronomy 12 00240 g005b
Figure 6. The interactions of maize-white bean sowing systems on protein ratio of maize and biological yield per white bean plant at Nur Sultan, Kazakhstan research station. Letters on each bar represent a significance level at p < 0.01. Note: different letters denote significant differences, while the same letters indicate insignificantly different values.
Agronomy 12 00240 g006
Figure 7. The interactions of maize-white bean sowing systems on biological yield (a) and grain yield (b) at Nur Sultan, Kazakhstan research station. Letters on each bar represent significance level at p < 0.01. Note: different letters denote significant differences, while the same letters indicate insignificantly different values.
Agronomy 12 00240 g007aAgronomy 12 00240 g007b
Figure 8. The interactions of maize-white bean sowing systems on pod length (a) and 100-kernel weight (b) at Nur Sultan, Kazakhstan research station. Letters on each bar represent significance level at p < 0.05 and p < 0.01.
Agronomy 12 00240 g008
Figure 9. The interactions of maize-white bean sowing systems on protein ratio (a,b) at Nur Sultan, Kazakhstan research station. Letters on each bar represent significance level at p < 0.05 and p < 0.01. Note: different letters denote significant differences, while the same letters indicate insignificantly different values.
Agronomy 12 00240 g009
Figure 10. The interactions of maize-white bean sowing systems on 100-kernel weight (a, b) at Nur Sultan, Kazakhstan research station. Letters on each bar represent significance level at p < 0.05 and p < 0.01. Note: different letters denote significant differences, while the same letters indicate insignificantly different values.
Agronomy 12 00240 g010
Figure 11. The interactions of maize-white bean sowing systems on protein ratio at Nur Sultan, Kazakhstan research station. Letters on each bar represent significance level at p < 0.05. Note: different letters denote significant differences, while the same letters indicate insignificantly different values.
Agronomy 12 00240 g011
Table 1. Physical and chemical properties of soil in the experimental area of Nur Sultan, Kazakhstan.
YearDepth
(cm)
pHLime
(%CaCO3)
Salinity
(%)
Organic Matter (%)P2O5−1
(kg/ha)
K2O−1
(kg/ha)
20180–307.712.690.071.8285.211133.0
20190–307.662.140.081.51109.111952.3
Table 2. Climatic data of Nur Sultan, Kazakhstan for the duration of the study and comparison with mean monthly data.
MonthPrecipitation (mm)Temperature (°C)Relative Humidity (%)
20182019Mean *20182019Mean *20182019Mean *
May58.219.440.511.4815.115.7154.536.745.67
June84.170.258.8919.4318.1320.9954.766.050.31
July64.757.27822.3523.4821.960.355.054.58
August130.940.748.9419.5821.2921.0764.749.450.28
September31.352.626.014.513.214.2957.356.650.31
* Represents mean monthly precipitation, temperature and relative humidity data of the study area in previous years (2008–2017).
Table 3. Different sowing systems and treatments adopted in the study area of Nur Sultan, Kazakhstan.
Selected CropsTreatmentsCrop Rotation
Maize (SY Miami)
White bean (Göynük-98)
T1S-CSole maize
T2S-BSole white bean
T3C-B-C-BMaize-white bean-maize-white bean
T4C-B-B-CMaize-white bean-white bean-maize
T5B-C-C-BWhite bean-maize-maize-white bean
Table 4. Different sowing systems at the research station, Nur Sultan, Kazakhstan.
Sowing SystemsRow Spacing (cm)Number of Plants Per m2
MaizeWhite BeanMaizeWhite Bean
Sole maize207
Sole white bean1028
Sole maize404
Sole white bean20 14
C-B-C-B2010714
C-B-C-B402047
C-B-B-C2010714
C-B-B-C402047
B-C-C-B2010714
B-C-C-B402047
C-B-C-B: maize-white bean-maize-white bean; C-B-B-C: maize-white bean-white bean-maize, B-C-C-B: white bean-maize-maize-white bean.
Table 5. Evaluating the effects of different sowing treatments on yield characteristics examined in maize in the study area of Nur Sultan, Kazakhstan.
Genotypes N.S.P.S.W. (g)S.U. (cm)N.O.S.N.S.S.S.W.S. (g)H.W. (kg/100 L)T.K.W. (g)G.Y. (kg/ha)P.R. (%)
20181.17 B357.10 A20.88 A16.95 A676.45 A292.12 A62.83430.50 A1242.92 A7.24 A
20191.21 A262.79 B18.41 B16.17 B601.49 B241.34 B62.70400.45 B989.92 B7.14 B
Mean1.19309.9419.6416.56638.97266.7362.76415.471116.427.19
20 cm1.13 B293.36 B19.12 B16.36610.46 B250.14 B62.58408.04 B1412.17 A6.99 B
40 cm1.25 A326.54 A20.17 A16.76667.48 A283.32 A62.95422.91 A820.67 B7.39 A
Mean1.19309.9419.6416.56638.97266.7362.76415.471116.427.19
Sole maize1.04 C272.28 D18.47 D16.68605.98 C229.62 D61.83 B378.16 D1572.25 A6.61 D
C-B-C-B1.21 B320.75 B19.95 B16.90650.61 B281.13 B63.00 EU432.75 B924.92 C7.28 C
C-B-B-C1.28 A354.38 A21.31 A16.58685.91 A303.75 A62.33 EU441.33 A1065.67 B7.37 B
B-C-C-B1.21 B292.39 C18.85 C16.09613.38 C252.43 C63.91 A409.66 C902.83 C7.51 A
Mean1.19309.9419.6416.56638.97266.7362.76415.471116.427.19
Years **********ns******
Row spacing ******ns****ns******
Sowing systems ******ns***********
Year × row spacing*****ns****ns******
Year × sowing systems******ns************
Row spacing × sowing system******ns****ns******
Year × row spacing × sowing systemns****ns****ns******
* p ≤ 0.05, ** p ≤ 0.01, ns, non-significant, N.S.P.: number of cobs per plant, S.W.: cob weight, S.U.: cob length, N.O.S.: number of orders per cob, N.S.S.: number of seeds per cob, S.W.S.: seed weight per cob, H.W.: hectoliter weight, T.K.W.: 1000-kernel weight, G.Y.: grain yield, P.R.: protein ratio. Note: different letters denote significant differences, while the same letters indicate insignificantly different values.
Table 6. Evaluating the effects of different sowing systems on yield characteristics examined in white beans in the study area in Nur Sultan, Kazakhstan.
Genotypes B.Y.P. (g)N.P.P.N.S.P.N.S. PodS.Y.P. (g)P.L. (cm)H.I. (%)T.K.W. (g)B.Y. (kg/ha)G.Y. (kg/ha)P.R. (%)
201845.54 a18.58 a46.40 a3.01 a19.86 a11.6143.72427.9 b3691.67 a1598.12 a24.39 b
201924.82 b12.10 b30.54 b2.59 b13.58 b11.7243.78444.2 a2592.08 b1121.29 b25.55 a
mean35.1815.3438.472.8016.7211.6643.75436.03141.871359.7024.97
10 cm39.22 a14.49 b34.30 b2.61 b14.79 b11.20 b43.55432.6 b3638.75 a1570.79 a24.77 b
20 cm31.15 b16.20 a42.63 a2.99 a18.65 a12.13 a43.96439.4 a2645.00 b1148.62 b25.18 a
mean35.1815.3438.472.8016.7211.6643.75436.03141.871359.7024.97
Sole white bean39.85 a14.83 c42.35 b3.09 a19.20 a11.82 b43.55459.2 a5147.50 a2226.75 a25.99 a
C-B-C-B28.05 c13.98 d31.57 d2.65 b13.49 c11.64 c43.82431.5 b1989.17 d857.83 d24.47 c
C-B-B-C32.07 b16.52 a35.40 c2.45 c14.93 b11.03 d43.95429.8 b2385.00 c1037.00 c24.77 b
B-C-C-B40.75 a16.05 b44.55 a3.00 a19.25 a12.18 a43.69423.6 c3045.83 b1317.25 b24.66 b
mean35.1815.3438.472.8016.7211.6643.75436.03141.871359.7024.97
Years **********nsns********
Row spacing ************ns********
Sowing systems ************ns********
Year × row spacing******ns**nsns******
Year × sowing systems******ns**nsns********
Row spacing × sowing system************ns******
Year × row spacing × sowing system*********nsnsns****ns
* p ≤ 0.05, ** p ≤ 0.01, B.Y.P.: biological yield per plant, N.P.P.: number of pods per plant, N.S.P.: number of seeds per plant, N.S. pod: number of seeds per pod, S.Y.P.: seed yield per plant, P.L.: pod length, H.I.: harvest index (ratio of grain yield to biological yield), T.K.W.: 1000-kernel weight, BY: biological yield (the whole plant biomass), G.Y.: grain yield, P.R.: protein ratio (the proportion of whole plant protein contained in the grain). Note: different letters denote significant differences, while the same letters indicate insignificantly different values.
Table 7. Land equivalent ratio (LER) of the maize-white bean sowing systems and the partial LER (LERmaize and LERwhite bean) as affected by row spacing at Nur Sultan, Kazakhstan research station.
Row SpacingSowing SystemsLERmaizeLERwhite beanLER
10–20 cmC-B-C-B0.680.631.31
C-B-B-C0.78 *0.76 *1.54
B-C-C-B0.82 **0.97 **1.79
20–40 cmC-B-C-B0.79 *0.73 *1.52
C-B-B-C0.91 **0.89 **1.80
B-C-C-B0.95 **0.99 **1.94
* p ≤ 0.05, ** p ≤ 0.01 and the LER values with underbars are significantly different from 1 at p < 5%.
Publisher’s Note: MDPI stays neutral with regard to jurisdictional claims in published maps and institutional affiliations.

