1. Introduction
The energy requirements of cow–calf operations worldwide are mostly based on natural grazing pastures that are affected primarily by climate conditions. Wise grazing management at optimal grazing intensity throughout the year can serve to maintain the forage at optimal conditions of maturity (young and productive, i.e., high metabolizable energy (ME) with high biomass production) [
1]. Consequently, it can also improve the grazing herd’s energy source for production and improve the grazing land’s ecological status [
1]. Daily remote monitoring of the herd’s energy balance (EB) components and of the grazing land’s forage quality and availability—calculated from the grazing behavior of the cattle and using grazing bout duration (GBD) as an index for biomass availability [
2,
3]—can significantly improve grazing-land management.
Daily remote monitoring of the grazing cows’ health and reproductive events, based on their behavior, can also significantly improve individual and herd health status. Such monitoring can provide early detection of estrus events, breeding bulls’ functioning, and cows’ conception and calving dates. It can also be used to identify predation events, extreme heat load, shortage of water, etc. Early response to these events can significantly improve herd production and grazing-land production efficiency.
Climate change and global warming are expected to affect traditional grazing management, such as stocking rate for each specific habitat. When the grazing animal’s total EB is measured and the concomitant grazing area (ha) is known (by using GPS information), the optimal stocking rate of the specific grazing-land habitat can be simply calculated. Using the suggested remote-monitoring information to determine the stocking rate for each specific grazing habitat could significantly improve grazing-land management, e.g., by preventing deterioration due to overgrazing or the fire damage that can result from too low grazing pressure.
In the last few decades, the measurement of heat production (HP) of free-range grazing animals using continuous heart-rate measurements calibrated to the HP via the heart rate–O2 pulse method has been well validated [
4,
5]. Measurements of free-grazing cows’ HP, ME intake (MEI) and forage ME have shown that the cow’s HP is significantly positively correlated with its MEI [
6]. Thus, for free-grazing cows, the herd’s average MEI can be significantly estimated from the HP measurement [
5]. This enables the estimation of the total EB of free-range grazing animals (MEI−HP−activity (walking and grazing) energy costs = recovered energy (RE)). The RE (MJ/day) represents the energy retained in the body plus milk energy.
A method that uses motion sensors and GPS to determine grazing cows’ activities was investigated and established [
7], which also enabled characterization of the animals’ foraging behavior on different grazed terrains and in different seasons [
8]. Studies in which the grazing cows’ behavior and location were simultaneously measured with HP and forage quality [
9,
10,
11,
12] opened the potential ability to determine cow’s EB variables from grazing cows’ behavioral activities. After analyzing the data in these studies, we found a high correlation between cows’ daily time spent grazing, EB components and the quality of the grazed forage. We found that the cow’s daily grazing time, dry matter intake (DMI), MEI, and RE increased with increasing forage ME. We explained this positive correlation by the dependence of cows’ DMI and MEI on their digestion rate, i.e., mean retention time of the digesta in the rumen. When forage quality increased, it was digested more rapidly in the rumen, i.e., the mean retention time decreased and consequently, the DMI and thus the MEI (DMI × ME) increased.
The hypotheses of this study were: (i) cows’ EB, grazing-land forage quality and availability status, and cow health and reproductive events can be determined from the daily cow behaviors of walking, grazing, resting, and average daily GBD (i.e., average daily meal length), and cow location; (ii) cow–calf grazed herd owner can use the real time information of grazing behavior parameters to improve grazing-land and herd management and consequently, to increase the herd performance; (iii) data analysis of the remote-monitoring information can be used to determine the optimal stocking rate for each combination of animal and grazing-land habitat, and consequently improve grazing-land management and production.
The study aims were: (i) to investigate the potential of using remote monitoring of the grazing herd for estimating the grazing-land forage quality and availability, and the energy balance variables of the herd in order to improve herd performance and grazing efficiency; (ii) to validate the estimation of grazing-land forage quality and availability, and the energy balance variables and HMS identification of cow health events of grazed herd cows; (iii) to test the potential of HMS output data to recommend the grazed cows’ optimal stocking-rate capacity for a specific grazing-land habitat.
2. Materials and Methods
2.1. Main Experimental Site and the Sites for Preliminary Measurement Data
The main study was conducted at the Karei Deshe Experimental Station situated on rocky basalt slopes near the junction of the Jordan River and Lake Kinneret (Sea of Galilee), Israel (lat. 32°55′ N, long. 35°35′ E, alt. 80–150 m above sea level). All the farm herds, including the study herd, grazed on the same soil, forage species variety, and weather conditions. The forage plants’ variety was not significantly different among farm grazing plots, including the study herd plot. The site has a Mediterranean climate, characterized by two distinct seasons: wet and mild rainy winters (October–April) and a dry, hot summer (May–September). The winters with mean minimum and maximum temperatures of 11 and 19 °C, respectively. The average annual rainfall is 570 mm, falling mostly in winter. The summer season is rather dry and hot, with mean minimum and maximum average temperatures of 22 and 34 °C, respectively. These dry conditions with no rain last for at least 6 months. The soil in the experimental area was basaltic, with slopes generally less than 10%, and shallow soil cover (rarely deeper than 60 cm) of the basaltic rock. The vegetation is characterized by species richness: a total of 166 herbaceous plant species were identified in the experimental plots from 1994 to 1997 [
13]. The area of the study plot was 77.86 ha, alt. 220–350 m; it was mainly trapeze-shaped, with a north base (the higher plot altitude) of width 1 km, and a south base (the lower plot altitude) of width 0.5 km, and 1 km between them. The grazing area had one water trough in the lower (south) area of the plot, near the feed trough for supplemented feed. A high eucalyptus grove of about 120 × 120 m
2, about 750 m from the water trough, supplied enough shade for the herd during their resting hours in the summer.
Along the study years when the study plot biomass was too low, we used alternative grazing plots. It occurred from 24 January 2017 to 12 May 2017 and from 14 April 2019 to 21 July 2019 when the respective GBD at the decision date (a week before plot changed) was 52 s and 38 s, and the respective measured biomass (a constant harvest section) was 340 and 829 (kg DM/ha) on 11 December 2016 and 3 March 2019. The first used alternative plot was an east neighboring plot (only a fence separate between the plots). The second alternative plot was 300 m south of the study plot; the respective plots sizes were 63.8 and 88.9 ha.
In this paper, we also use preliminary measurements data that were taken from the herds of Kibbutz GalEd and Kibbutz Kefar-Szold, located 60 km southwest and 30 km north, respectively, of the main study location. The main study’ metrological data of precipitation, ambient temperature, and relative humidity measurements were taken from a weather station located 100 m south of the southern edge of the study plot.
2.2. Collars and HMS Software
The collars used three axes of accelerometer output calculated as the sum of squares, and three thresholds for determining, every 4 s, cows’ daily activities: resting, grazing, walking, number of meals per day, and mastication at rest (h/day), i.e., the daily rumination length. Cow location was measured by GPS three times per day. The collar battery was recharged by solar panels. The data were transmitted, daily after midnight, by satellite (Globalstar
https://www.globalstar.com, assessed on 2 December 2021), analyzed in the MOOnitor server by the HMS, and arrived to the user (smartphone and PC) via the cloud. For research purposes, the collars recorded the cattle activities and locations in several frequency modes, throughout the day. Data were saved in the collar logger and downloaded to PC by radio-frequency (RF) module. The HMS calculates, summarizes and presents information daily (smartphone and PC) on the individual cows’ events, and herd actual consumed diet ME and energy balance data as described in
Section 1.
2.3. Animal Measurements, Herd Management and Feed Supplementation
All procedures involving animals in the present study were approved (approval no. 560/14 IL) by the Israeli Animal Experimentation Ethics Committee (Bet-Dagan, Israel; Volcani Center). In the first year of the study, all of the selected cows were pregnant. Later in the study, the herd performance was part of the study results.
All the cows in the study herd were managed as a unit; individual alerts were treated individually and were applied to the herd management when it was relevant. We did not test performance differences between collared and collarless cows (see tests in the
Supplemental file Figure S2).
Yearly management of the study cows was similar to the regular management of the Karei Deshe farm herds. However, the information received from the HMS output data on health events, nutrition state and cows’ EB, including forage availability as measured by GBD, were translated to herd management actions. Management decisions were mainly related to: (i) prevention of moving cows to another plot during the calving season, (ii) timing of supplement administration, (iii) date for moving the herd to another grazing plot, and (iv) early treatment of sick cows. For more detailed information, see the
supplemental file, the flow diagram schema, and its text.
For reproductive management, breeding bull fertility was tested before their introduction to the herd. Breeding bulls stayed with the herd from October to May. Cow pregnancy tests were conducted between August and October. Cows were weaned in May to June.
For feed supplementation, broiler poultry litter (PL; chicken dung) was routinely supplemented after weaning, or close to it, when the forage was dry and its quality low. PL supplementation was ended when the cows stopped eating it and started to graze on the newly germinated high-quality forage, about 10 days (depending on the temperature) after a significant amount of rainfall (about 20 mm in a week). The PL was given with no special pretreatment. PL intake was measured for all groups together. Wheat hay supplement (WH) was given when the GBD value and its slope of increasing at dry season showed that the forage biomass was insufficient and its rate of decrease is high, the cows were close to, or in the calving season (see, study first year, the loss calves event,
Section 3.5 of the manuscript) and an alternative grazing plot was less available. This happened mainly in summer to autumn 2018, and a small amount of WH supplement was also given in autumn 2020.
2.4. Forage and Fecal Sampling and Analyses
Forage plant sampling was performed 18 days after the cows entered the experimental plot. Vegetation sampling was performed approximately once every month or two throughout the experimental period. The tests were performed frequently when the changes in grazing conditions were large, (mainly throughout the rainy season and autumn) and at low frequency when the changes were small (spring end and summer start, i.e., the beginning of the dry season). Biomass and forage quality were not tested, when the cows were outside of the experimental plot and when the biomass (young green vegetation) was lower than the determination capacity (approximately less than 300 kg DM/ha).
Fresh fecal samples were taken from the cows in the field while sampling the forage plants.
Forage plant sampling for biomass and nutritional quality analysis was performed by harvesting 6 samples sections lines to represent the plot. The section line was 200 m in length with 20 samples squares of 25 × 25 cm each, a total of 120 squares samples for the plot. All harvest fresh plants squares were weighed. Fresh fecal samples (about 150 g wet) and the harvest fresh plants were dried in a ventilated oven at 60 °C until they were dry (3 to 4 days). Dry plants were weighed for DM content and biomass calculation. Dry plants and fecal were ground. The harvest squares dry plant samples were mixed to represent each samples line section for nutritional ingredients analysis.
Pasture cuttings of mixed plants, and the fecal samples (representing actual nutritional diet ingredients, including digestibility and forage ME calculation) were analyzed by near infrared spectroscopy (NIRS) calibrated to the plot plants’ nutritional composition and to fecal composition, to calculate actual nutritional quality of the consumed diet [
14].
During the periods when PL was given as a supplement, the PL samples were taken to determine (by NIRS analysis) its percentage of ash and nitrogen, which was used to calculate its protein contribution.
2.5. Cow and Herd Events
2.5.1. Health Events
Health events were determined by the HMS as: reduction in daily grazing time at the value of a% on day N (the day of the specific event) relative to the average of days (N-8 to N-4). We defined three levels of health events: (i) DMI decrease, a reduction of 30%; (ii) sickness, a reduction of 50%; (iii) severe sickness, when grazing plus walking duration from midnight to noon was less than 3.0 h. Alerts were sent to the farmer at noon and included the cow’s location coordinates.
A herd epidemic alert was sent to the farmer when the percentage of sick cows in the herd was above b% of the number of cows with collars in the herd. For the present study, we did not define the b% value. Thus, the epidemic alert was not applied automatically through the HMS, but it could be clearly identified by the farmers based on the number of sickness event alerts sent in a short period of time.
2.5.2. Reproductive Events
Reproductive events were separated into three alerts: (i) heat detection (estrus), (ii) cow conception (start of pregnancy) date, including the expected calving date, and (iii) identified calving events. Heat detection was determined according to the ratio of walking to resting on day N, corrected to (minus) the average of this ratio calculation for days N-7 to N-4. Conception date was the last heat-detection date. The expected date of calving was set at 280 days after conception, with minor variations relating to cow breed. Calving events could be determined from cows’ behavior and location relative to the herd’s average location, mainly when they were resting. Although those events were identified during the study, an algorithm relating also to cows’ location had not yet been developed in the HMS. For example, a calving event that was identified by the remote monitor: Cow 1206 on 28 January 2020 grazed 11.93 h/d, on 29 January 2020 grazed 6.7 h/d on 30 January 2020 grazed 2.27 h/d, in the morning hours and days before she grazed with the herd, but at evening (18:00) and night (23:00), she was alone 550 m from the closest cow of the herd; on 1 February 20 she grazed 13.12 h and was watched with calves in the herd; all cow locations were monitored by GPS and presented on the HMS.
2.5.3. Heat-Load Events
Heat-load events were defined as a significant reduction in daily grazing and walking activities of the entire herd. Heat load can be easily identified from measurements of cow respiration rate when they are resting. Respiration rate values were presented in real-time collar output mode but were not developed as an automatic algorithm output.
2.6. The Research Stages in Detail
The study was performed from 11 September 2016 to 25 May 2021, spanning almost five consecutive breeding cycles. The breeding cycle was defined from weaning to weaning (roughly the end of spring). PL supplementation started after weaning and stopped (by the cows) when green’ forage was available (in winter). This timing enabled, in four breeding cycles, the coordination of the calculation of yearly energy and nutrition details with the yearly reproductive cycle. Each breeding and nutrition cycle was started with 40 cows and the reproductive performance was calculated on the basis of those 40 cows. Yearly nutrition (grazed forage and supplement feed) and energy calculations were performed according to the actual summed integration of (cows) × (day) in the yearly cycle. On several minor occasional events throughout the study years, the number of cows exited temporarily out of the study herd. This was also happening when cows from neighbor plots entered the study plot. In addition, two breeding bulls were in the herd for several months each year. Thus, the total and daily consumed forage in the study plot and of the supplements were calculated according to the actual number of cattle that actually attended to the study plot.
2.7. Study Animals, Body Weight (BW) and BCS Measurements
The study group consisted of 40 Simmental mixed breed cows. The average age of the cows at the beginning of the experiment was 5.78 ± 0.20 years. Cow BW and BCS (scale 1–5, [
15]) were measured 19 times during the study, i.e., their changes were assessed for 18 periods. Cow weighing and BCS measurements were performed more frequently when changes in forage state (quality and biomass) were greater, and also depended on the herd’s regular treatments and owner availability. As used in regular mange commercial herds, cows in the herd were replaced for reasons of infertility or morbidity. The replaced cows (age, breed body conditions) were similar to the study herd—mature cows, of 4 to 6 calving seasons.
Twenty collars were mounted on the study herd. Collars were transferred to other cows in the herd only when a cow with a collar was culling out from the herd. The HMS documented the cows’ daily data throughout the study years. In addition, the collars measured one location per hour, and activity was recorded every 5 min. These data parameters were saved but are not presented in this article.
2.8. Analysis and Validation of the HMS Data
Translation of the cow’s activities by the HMS software should give the farmer most of the information he or she needs to improve herd and grazing-land management and consequently, performance and performance efficiency, i.e., more forage ME production and more weaned calves per unit of grazing land.
2.8.1. Actual Consumed Diet Quality (ME) and Its Validation to the HMS Calculation
This was calculated daily by the HMS. The HMS calculations were compared to the NIRS analyses of fecal samples. We tested this, and the present data taken before the main study (five years and 9 month) began. The diet quality determination represents the actual consumed (selected) forage and the mixing of the consumed forage and the supplemented PL when it was given to the cows.
2.8.2. Validation of the Herd Energy Balance Calculated by the HMS to Those Estimated by BCS Change and by ADG
Herd EB calculated by the HMS was compared to changes in BCS, and to the average daily gain (ADG). This was performed on a one-comparison basis, the ADG (g/day), i.e., the RE in the BW calculated by the HMS (REBWHMS) and the RE calculated from BCS changes present as BW change (g/day) that was mainly calculated as fat tissue (see the following calculations in detail). The calculations were performed for the period that ended at weaning. During this period (until the second trimester of the sequential pregnancy) cows’ gut fill is significantly stable because the cow is far from the calving day. In addition, in this period, the daily gain of the fetus and uterus tissues are minor, while in the last trimester of pregnancy, the fetus and the above tissues’ daily gain are high with a high proportion of protein. In regard to the season effect, the tested period ended at the beginning of the summer where there was sufficient forage biomass. When forage biomass is significantly low, gut fill decreases, and consequently, ADG decreases without direct calculated connection to the cows’ energy balance.
REBWHMS Calculated as Empty BW Changes (kg/day)
In each year in the above defined period (five periods), the RE in the cows’ bodies according the REBW
HMS/day (MJ/day) was calculated as: (cow RE (MJ/day) according to HMS)—milk energy (MJ/day)). The REBW
HMS/day values were calculated as the change in cows’ empty BW (kg/day) = (REBW
HMS, MJ/day)/24.35 MJ/kg). The energy value of 24.35 MJ/kg for empty BW changes was based on the NRC [
16], as also used by Brosh et al. [
17].
Daily BCS Changes Calculated as Empty BW Changes (ADGBCS, kg/day)
In each period, the ADG (kg/day) according to the changes in BCS was calculated as: (period BCS changes)/(period days) × (84.6 kg) × ((cows’ actual BW in kg)/583 kg). The calculation was based on the NRC [
18], according to which, for a cow weighing 583 kg, 1 BCS unit difference is 84.6 kg. We used only one value of the cows’ actual BW (503 kg) for the 15 periods. This was the cows’ average BW for study years 2 to 5, the cows’ average BW of all the 18 periods was similar (499 kg). The cows’ periodic BW changes do not reflect real empty BW changes.
For the expected differences between ADG estimated by HMS to those estimated by BCS changes, pregnancy requirements can use the fat reserve, i.e., decrease the BCS. Consequently, calculations of empty ADG (as fat tissue changes, based on BCS changes) of pregnant cows are expected to be lower than those estimated by the HMS. In early pregnancy, as was in the tested five periods, the energy needs for pregnancy are negligible.
2.8.3. Milk Energy
Average milk production (kg/day) of nursing cows during the nursing period was based on local knowledge of the used breeds. For the present study, we used a constant milk production value during the nursing period of 6.1 kg/day [
17]. The milk energy content was calculated as 2.97 MJ/kg.
Yearly milk production (kg/yearly nursing period) for each year was calculated as the daily number of nursing cows with collars as a percentage of all cows with collars.
Milk energy (MJ/day) in each of the days where cows were nursing was calculated as the fraction of the nursing cows (in the cows with collars) in this day multiplied by the milk energy MJ/day.
2.8.4. Individual Cows’ Health, Estrus and Calving Events
Health events were validated by direct observation of the cows. As the collars also transmit the sick cow’s locations, it was relatively easy to find. Estrus detection was only validated at Kibbutz GalEd and Kibbutz Kefar-Szold, by directly observing the cows’ behavior and using the Estrotect color sticker on the tail base (ESTROTECT TM HEAT DETECTOR, Dairymac Animal Health Products). Calving events were mainly recorded weekly; consequently, loss of calves at calving might not be recorded.
2.8.5. Herd Performance: Study Herd vs. Farm Herds
The study herd and the farm herd performances were calculated as (i) pregnancy ratio (number of pregnant cows/number of cows that were at the pregnancy test), and (ii) weaning ratio (number of weaned calves/number of cows in the herd when the herd exposed to the breeding bulls). The weaned calves were counted as those that were nursed by the attendance cows’ in the herd when it exposed to the breeding bulls. In the calculations, the cows from the study herd were excluded from the farm herd.
2.9. Calculations and Statistics
Results were subjected to either Student’s t test or Tukey’s HSD test using SPSS ver. 17 (SPSS Inc., Chicago, IL, USA). Pearson correlation coefficients (SPSS) were used between cows’ consumed dietary ME (MJ/kg DM) calculated by the HMS and that calculated using the fecal NIRS analysis, between the grazed forage quality (ME) to its protein concentration, between the HMS estimation of ADG and its estimation by daily BCS changes and by direct measured ADG, and for the effect of herd management by the HMS on the study herd weaning rate along the five-year period. Results are presented as means ± SE.
For validating the HMS estimation of ADG at the measurement periods (five periods that ended at weaning) (see
Section 3.9) we compared the HMS data to ADG calculated from BCS changes and to direct measured ADG. We tested it by using
t test: paired two samples of means.
3. Results and Discussion
3.1. Cows Replacement
Total cows replacement throughout the study included 19 cows out of 40 cows in the herd along 4.7 years—an average of 10% of cow replacement per year. However it was not distributed equally along years. The number of cows replaced along the study years were 13, 1, 0, 4, and 1 at years 1, 2, 3, 4, 5, where collared cow replacement was 4, 1, 0, 2, 1 respectively, with a total of 8 cows, which is similar to the cows’ replacement proportion of the collarless-11 cows.
3.2. Validation of the HMS Estimation of Actual Consumed Forage Quality
Prior to the main study, from 2 March 2015 to 18 April 2016, we tested the correlation between the consumed forage quality (ME) calculated by the HMS to that calculated by the NIRS analyses of fecal samples. The tested cows were located at two sites. In the first location, we used five collared cows (for the HMS data) and sampled their respective feces on four dates. The measurements were then continued with 20 collared cows and an additional seven sampling dates. At both sites, five fecal samples were randomly taken, fresh (hot) from the grazing floor and cleaned of all extraneous material. The correlation between the HMS and NIRS ME values (
Figure 1) was highly significant (
p < 0.001), with a slope of 1.029 and an intercept of −0.197 (MJ/kg DM), which was −10.3% of the average value (9.97 MJ/kg DM) of the 11 tested fecal samples.
3.3. Meteorological Data
The weather parameters of ambient temperature minimum and maximum (°C), relative humidity (RH, %), and calculated thermal humidity index (THI, °F) for heat load throughout the study (average of every 2 weeks) are presented in the
Supplemental file Figure S1.
The amounts of precipitation and their distribution during the rainy season (winter) have a great impact on grazing forage production. A monthly summary of the precipitation that accumulated during the rainy seasons of the study years is given in the
Supplemental file (Table S1).
Forage plant nutritional values are presented at the
supplemental file (Table S2). Forage plant nutritional values are mainly followed the start and end of the rainy season, its rhythms and intensity. Forage quality was highest in winter and lowest in autumn before the new rains. Forage quality (ME) was significantly correlated with its protein concentration (
rp = 0.864,
p < 0.001).
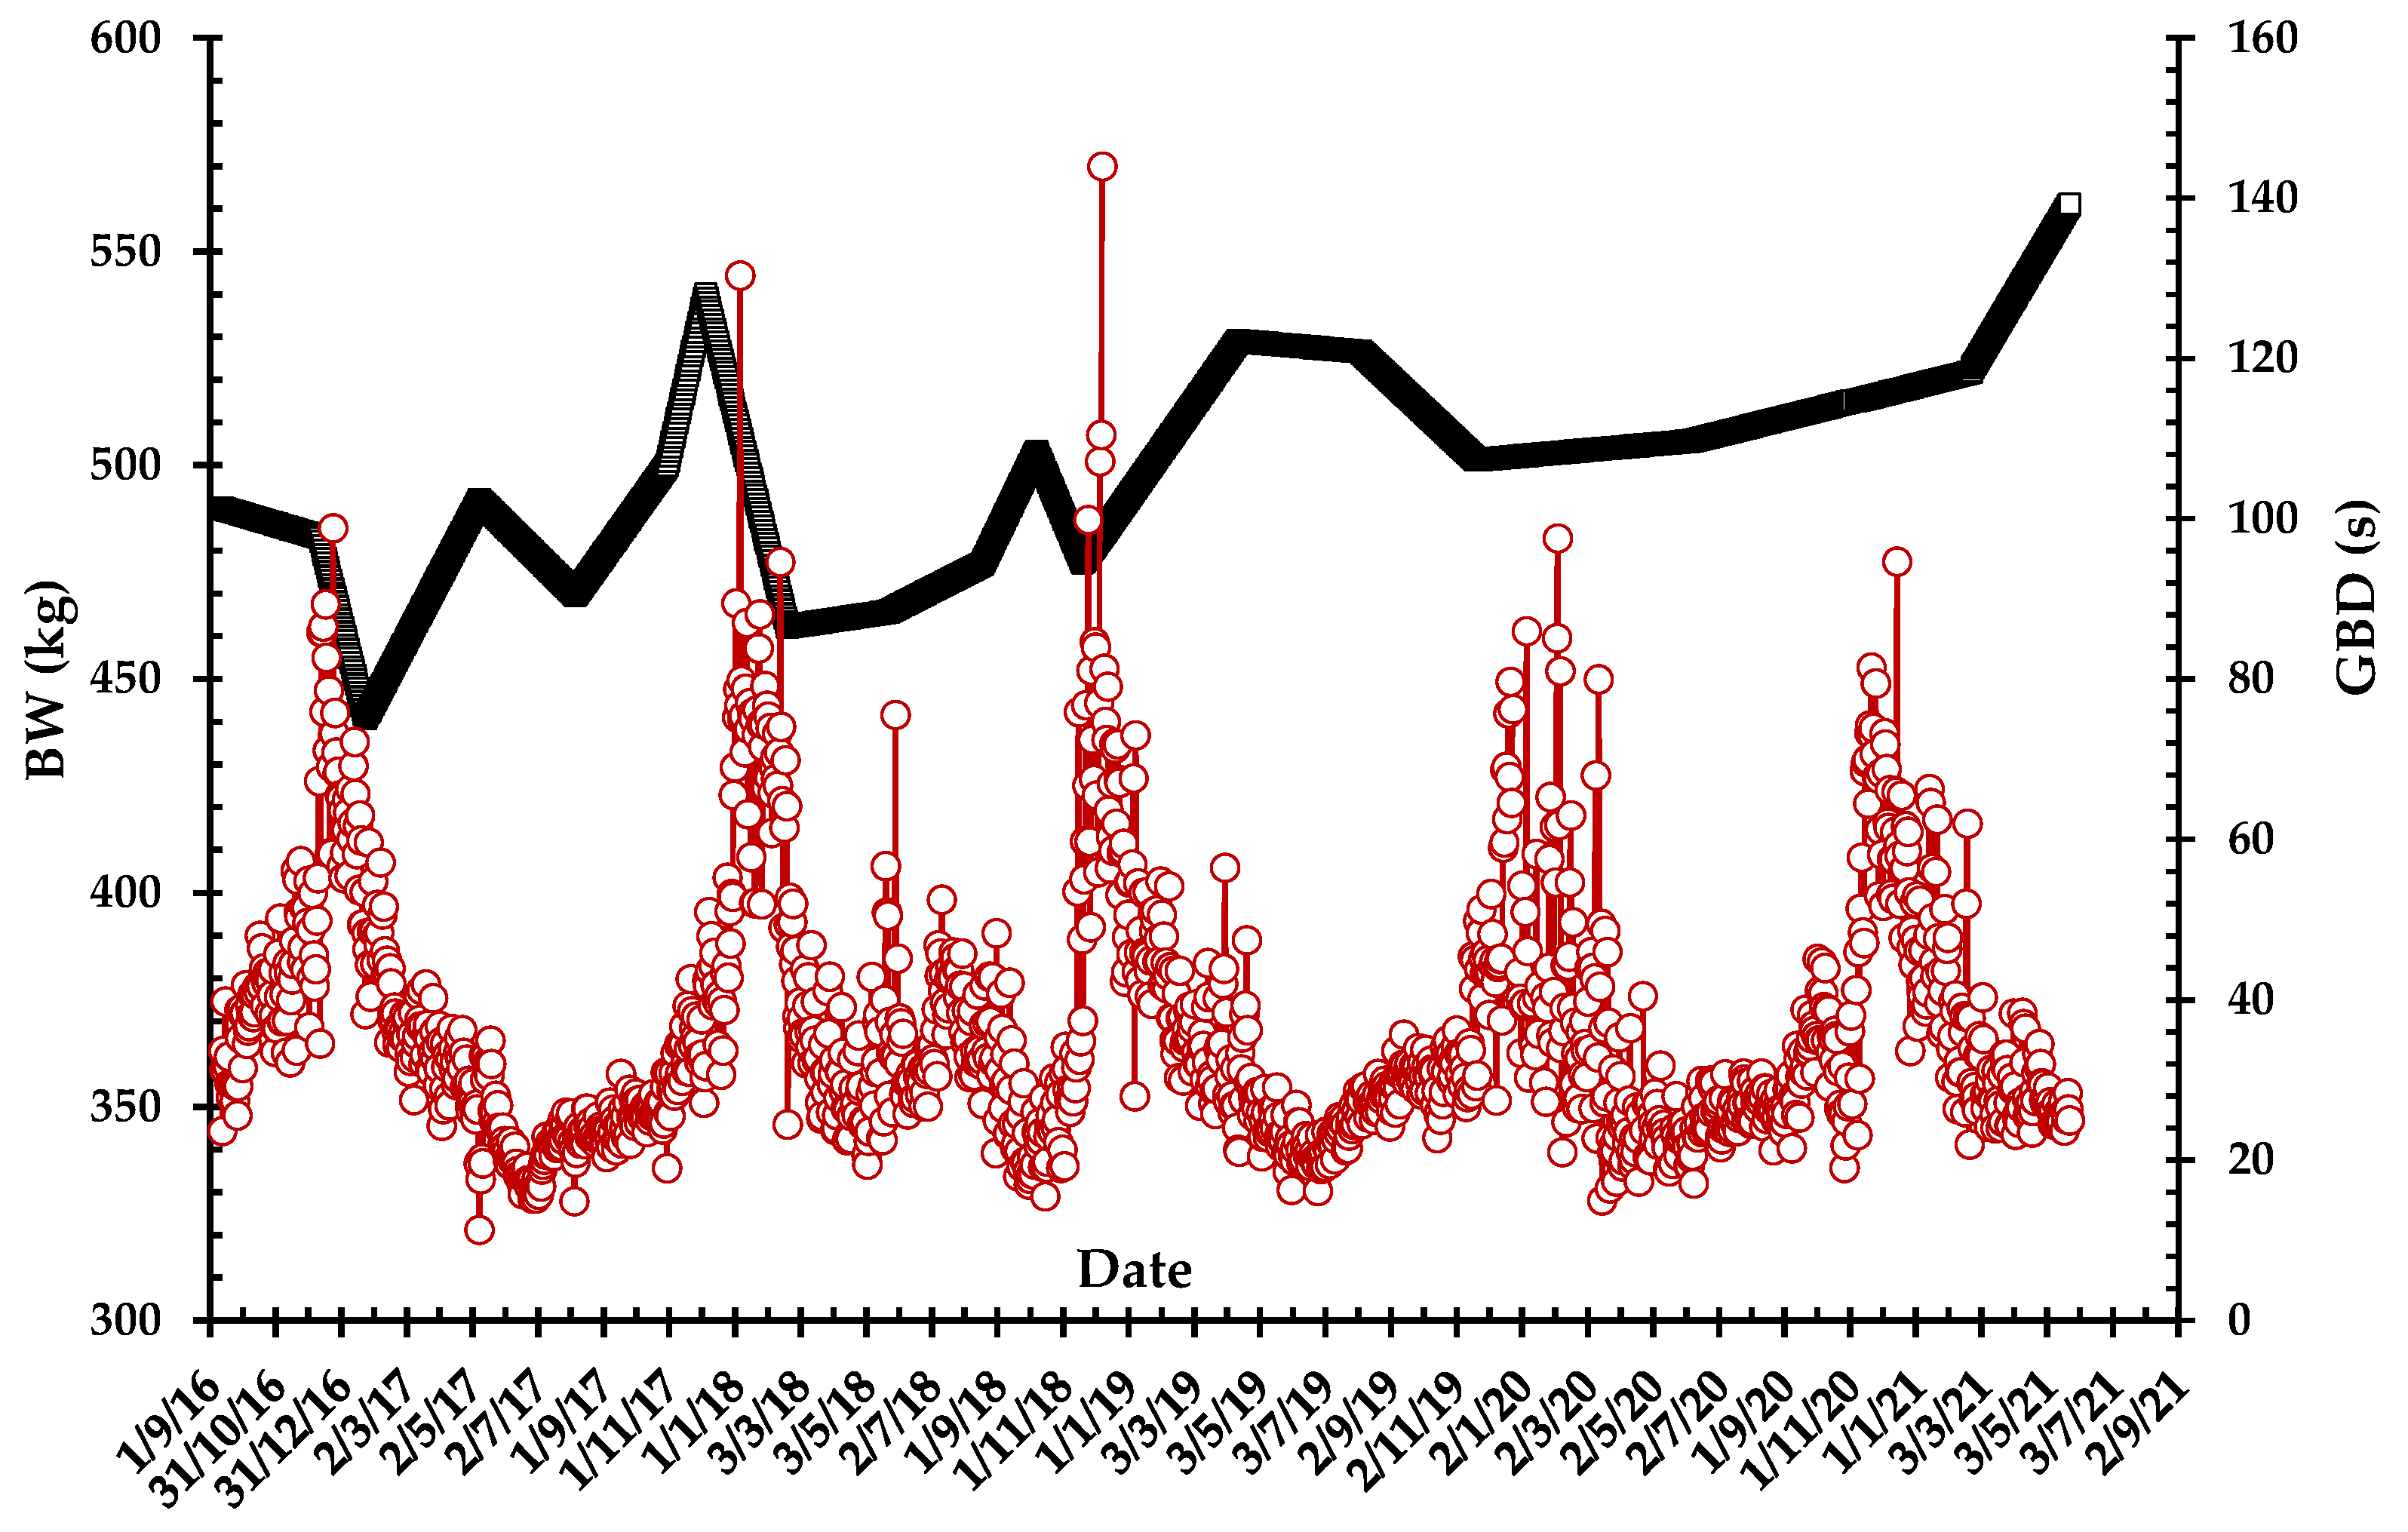
3.4. Cow BW and BCS throughout the Study and Daily Changes
A comparison of the study cows between collared and collarless cows of their ADG and daily BCS changes did not find any difference between the cows (
Supplemental file Figure S2). The study cows’ BW (kg) and ADG (g/day) were affected by the seasons and by the cows’ reproductive status (
Figure 2). The ADG was calculated for each cow individually. The average BW of all cows in the herd at the beginning of the study was 494 ± 9.3 kg and was 496 ± 13 kg for the collared cows. The average BW of all of the herd’s cows at the end of the study was 547 ± 12 kg, and 546 ± 20 kg for the collared cows. Therefore, BW gain along the study was 53 and 50 kg, respectively. For the cows that were in the herd throughout the entire study, BW at the start of the study was 494 kg and at the end of it, 549 kg, i.e., a BW gain of 55 kg. Thus, we concluded that collared cows’ BW and BW gain represent the BW and BW gain of all cows in the study herd. It could also be concluded that the increase in cow BW throughout the study was not the result of cows’ replacement in the herd. The greatest BW change in the herd between two consecutive measurements was a decrease of 72 kg between 5 December 2017 and 19 February 2018, 14.6% of the average BW of the herd.
The greatest ADG (g/day) between two consecutive BW measurements ranged from +805 between 30 October 2017 and 5 December 2017 (autumn to winter) to −952 between 5 December 2017 and 19 February 2018 (winter). The causes of these large BW and ADG changes are discussed in
Section 3.9. “Validation of cows’ EB Estimation by the HMS”.
The BCS of the cows and its daily changes (
Figure 3) varied significantly between the measurements, affected by the seasons and the reproductive condition of the cows. The average BCS of the cows at the beginning of the study was 3.16 ± 0.030, and 2.77 ± 0.024 at the end of the study. Cows that were in the herd throughout the entire study had a BCS of 2.93 ± 0.24 at the beginning and 2.58 ± 0.21 at the end. For the collared’ cows, the BCS at the beginning of the study was 3.18 ± 0.04 and at the end, 2.77 ± 0.04. Therefore, we can conclude that the BCS of collared’ cows at the start and end of the study represented the BCS of all cows used in the study.
Cows’ Average BW, MEI and DMI
Study years 2 to 5, from 20 May 2017 to 25 May 2021 (4-consecutive-year study) represent full representative years from weaning to weaning periods, including the full yearly periods of feed supplementation (
Table S2). The average BW of the cows during this period was 503 kg. The study data can be used to predict or compare cows’ DMI and MEI in other trials based on metabolic BW correction.
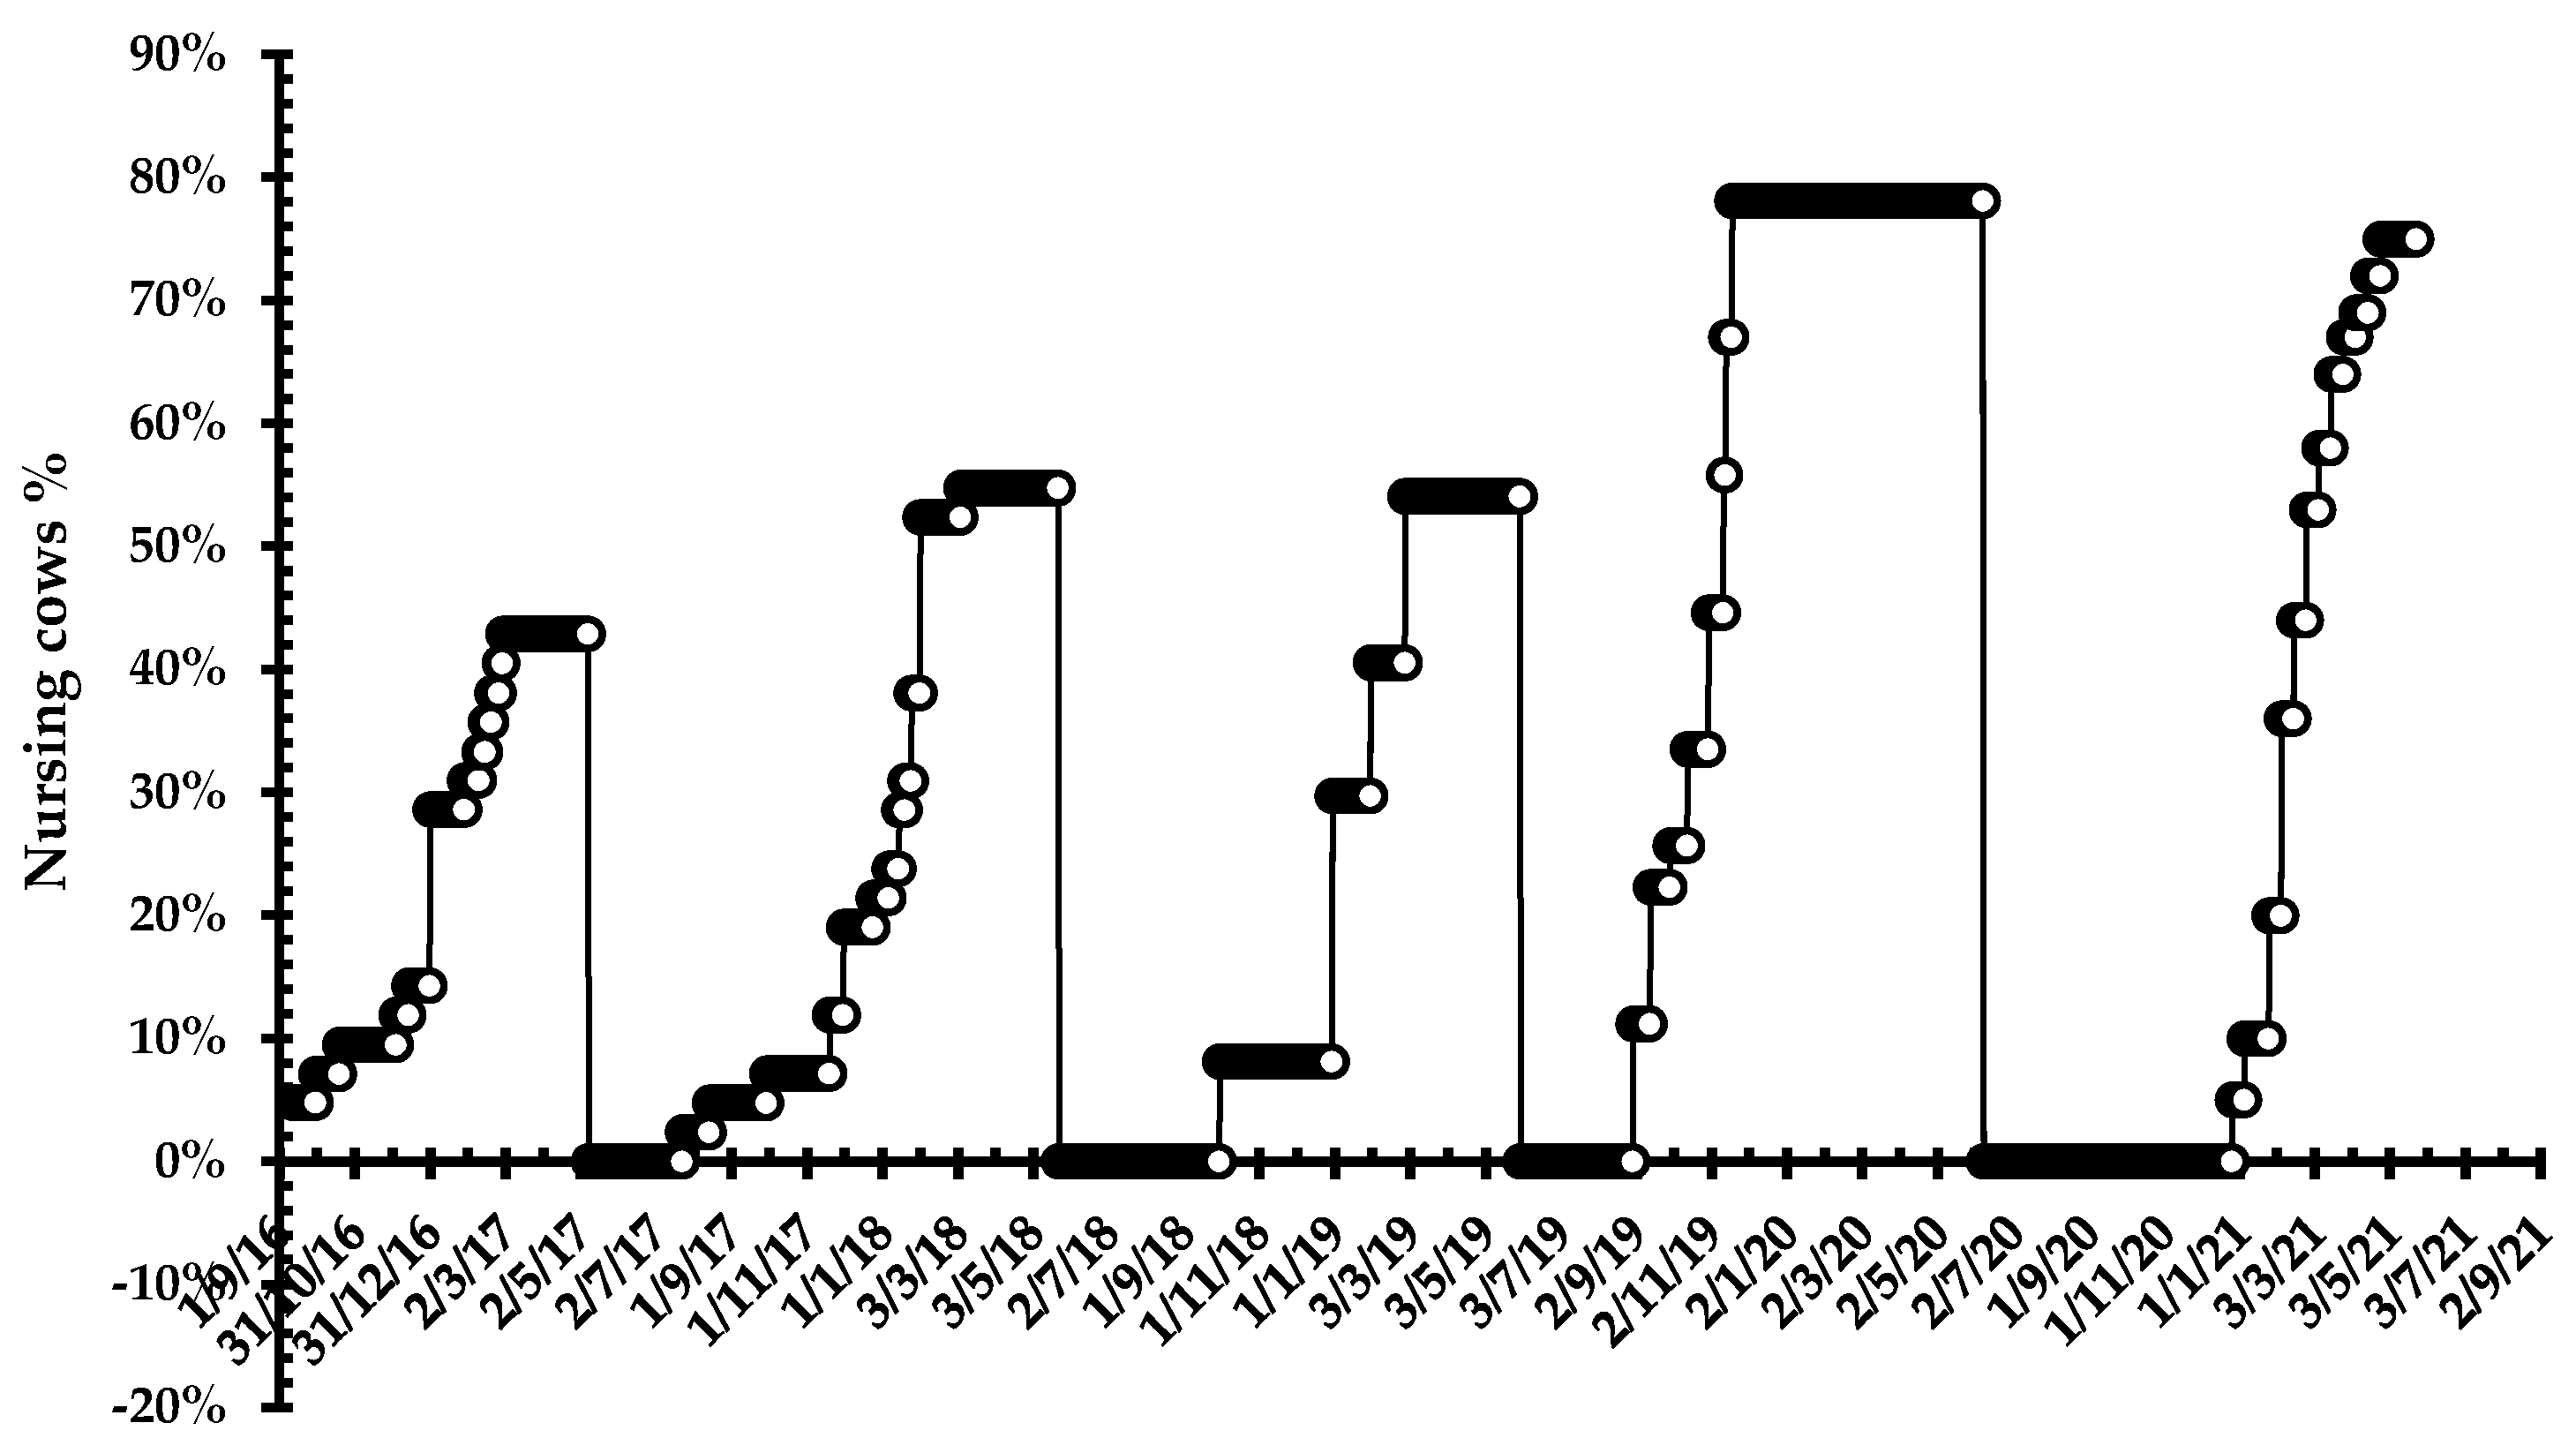
3.5. The Effect of Changing Herd Management on the Number of Nursing Cows in the Herd
The calving distribution and percentage of nursing cows until weaning for the cows with collars are presented in
Figure 4. A detailed description and calculation of the reproductive performance for each year are presented in the chapter dealing with reproductive performance (
Section 3.11).
In the first year of the study, although all of the cows were pregnant at the beginning of the study, the percentage of nursing cows on weaning was 43%. Due to the shortage in biomass at the beginning of the calving season, the herd was moved to a large neighboring plot. The HMS output messages identified, in real time, many morbidity events that were likely due to the sharp change of herd location at this combination of season and reproductive state. Herd problems were not properly treated by the farmer (the breeders’ confidence in the system’s warnings seemed to have been low at the start of the experiment). As a result, in that year, the percentage of nursing cows and weaning rate were low. From the real-time documentation of the events, we concluded that moving the cows to a new area in the critical season of the onset of calving significantly stressed the cows, which caused a marked reduction in cows’ nursing rate. Without real-time event detection by the HMS system, it would not have been possible to understand the reasons for the low nursing rate in the study herd in that year. In light of these conclusions, we agreed with the herd owners to change the study herd interface and not to move herds from plot to plot at the onset of the calving season.
Studying the use of the HMS and trusting its information led to a significant improvement in the herd interface, which increased the percentage of nursing cows in the herd (
Figure 4). These nursing percentages were calculated for the herd unit of 40 cows. The reproductive performance details are presented in
Section 3.12).
3.6. Cows’ Behavior, EB Components, Forage Biomass, Feed Supplements, Effects of Season and Rain
Figure 5,
Figure 6 and
Figure 7 present the effects of the complex of yearly weather: rain and ambient temperature, on cows’ activities, forage quality, and EB components, and on the grazing-land direct measured biomass and as it was estimated (forage availability) from the cows’ behavior (the GBD).
Daily grazing increased after the rain began to fall (
Figure 5), triggering the germination of high-quality green pasture. The daily duration of grazing is lower in the summer when forage quality is lower (
Figure 7), but it followed an increasing trend at the mid to end of the summer and autumn as well (
Figure 5). During this period (mid to end of summer to autumn), when the biomass decreased and the cows needed a longer time to gather the forage, because the sward height of the forage and/or its density (g DM/cm
3) was low and consequently, the bit size (g DM/bite) was lower as well. Under these conditions, rumen digesta mean retention time probably did not limit the DMI. The shortage of pasture biomass was clearly expressed by the increasing trend of GBD in the summer and autumn and by the steep increase in GBD at the beginning of the rainy season when the cows grazed on high-quality green pasture with low biomass (low forage availability). When the biomass amount increased, and at the same time, the forage plants matured (i.e., contained lower ME), the GBD and daily grazing duration also decreased.
When the GBD increased to above 40 in summer 2018 and autumn 2020 and we gave supplemented roughage feed of WH, it immediately returned the GBD to a lower level (
Figure 5). Since the GBD index was measured for the cows that grazed on the entire grazing plot, we suggest that it better represents the plot biomass availability than forage biomass samples.
The daily grazing duration, GBD values and their rate of change (daily increase and decrease), when cows grazed on dry forage (from the end of spring to autumn), were significantly lower compared to the changes when cows ate high-quality green pasture with significantly lower biomass.
3.7. Cows’ EB Variables and Calculated Energy Cost of Activities
The EB variables and energy cost of the cows’ walking and grazing activities calculated from the cows’ behavior during the study periods are presented in
Figure 6. The presented MEI, HP and RE are corrected by the GBD when it was above 30 s. The MEI and HP values were high in winter and spring and lower in summer and autumn. These energy values were also affected by the date and the amount of rain (
Figure 5,
Table S1 Supplemental file). Respectively, the RE, which is the energy of milk + REBW
HMS, was high in winter and spring and reached negative values in some of the summer and autumn seasons. In the summer of 2019, following a long period with high rainfall, the duration of RE with negative value was short. It probably only reflected the short stress of weaning of calves from cows. The energy cost of the cows’ activities (grazing and walking,
Figure 6 was calculated from the collar measurements of the cows’ grazing and walking activity and the cost values of the activities according to Brosh et al. [
9]. The costs also included the cost of horizontal movement, which in Brosh et al. [
9], was found to be stable in relation to activities (relatively stable movement speed in grazing and walking).
The HMS software, the MEI, HP and RE show interaction dependencies as presented by Brosh et al. [
6]. However, the activity cost is dependent on daily activity levels. Similar to Brosh et al. [
9], in the present study, the average cost of walking and grazing activities together was small, 6.4%, and 7.7%, respectively, for the MEI and HP. However, the ratios relative to the study for average RE, the above activities’ costs, were 37.9%.
This is an important issue in light of the results in Brosh et al. [
9]; it seems that the negative effect of the activity cost of food collection on the energy economy of the grazing cows (RE decrease) is much more important than as evaluated by Brosh et al. [
9], mainly in light of walking distance from the grazing locations to the water trough and to the supplemented feed trough, when forage biomass is low. When this distance is long, it will significantly decrease cows’ RE (RE = (MEI − HP − activity cost)).
3.8. Forage ME Quality and DMI
The EB variables (
Figure 6) are the core of the HMS output information. However, because in the past, these values were not available to the farmer, they are not traditionally used for grazing-land and herd management. The HMS outputs of consumed forage quality (ME), DMI, and biomass (forage availability) represented by the GBD (
Figure 7) are much more familiar to the farmer for herd management.
Direct measured forage quality fluctuates with the seasons (
Table S2 Supplemental file). It is high in winter (after the first rains) and low in the dry summer and autumn. The quality of the cow’s diet, estimated by the HMS, was calculated daily and represents the selected consumed forage and its positive interaction with the PL supplement [
19]. Consequently, it presented the cow’s diet at a greater resolution and accuracy than the direct forage sample analyses, but the trends of ME changes were the same (
Figure 7 compared to
Table S2 Supplemental file).
To compare the grazed forage samples and cow diet estimation (ME, MJ/kg DM), we compared the average of minimum forage quality (dry forage in the summer and autumn) over 5 years and the average of maximum forage quality (winter lush green) over 5 years from the samples to those from the HMS estimations averaged over 5 years (one sample per year in each season). The minimum values of forage quality analyzed from forage samples taken when the cows were grazing on dry forage were 5.44 ± 0.45 (MJ/kg DM), significantly lower (
p < 0.05) than the HMS value of 6.88 ± 0.12 (MJ/kg DM). In the winter, the forage quality analyzed from the forage cutting samples and by the HMS were 11.48 ± 0.43 and 10.68 ± 0.36 (MJ/kg DM), respectively, which was not significantly different. In the dry season, the cows received PL (mostly ad libitum) with significant nitrogen content; therefore, it is clear why the HMS ME estimation was significantly greater when cows grazed on dry low-quality forage. The HMS-estimated dietary ME when cows consumed dry forage + PL was similar to that measured in vivo when cows were fed wheat straw and PL under confined conditions [
19].
Forage ME Quality and DMI—The Rain Effect
According to the daily grazing time, it is clear that several days after the rain started, the cows increased their daily grazing time on the high-quality, low biomass forage (
Figure 5 and
Figure 7), as expressed by the high GBD. According to the HMS, high-quality forage with low biomass (high GBD) significantly decreased the DMI (
Figure 7), and consequently, the MEI and RE (
Figure 6).
3.9. Validation of Cows’ EB Estimation by the HMS Compared to Its Estimation by Daily BCS Change and to Directly Measured ADG
At the beginning of the rainy season when the cows grazed on high-quality forage with low biomass, this high-quality forage is digested rapidly (digesta mean retention time is short). The low forage biomass coordinates with the shortening of digesta mean retention time to decreases in cows’ gut fill and consequently decreasing of cows’ BW (
Figure 8).
These data significantly highlight the sensitivity to forage conditions of using data of cows’ live weight changes along the year to estimate cows’ energy balance, beyond the limitations of the effect of pregnancy and calving, and consequently reaching wrong conclusions.
As explained (see
Section 2.8.2), the periods when the cows are close to weaning (early pregnancy) at the beginning of the summer is the appropriate time to compare between the energy balance estimated by the HMS to its calculation, that based on BCS, changes on directly measured ADG (
Table 1).
The average period length over the five periods (before weaning) was long, 108 ± 21 days, and well represent a significant grazing period. The five-year period’s paired
t test comparisons and its Pearson correlation between ADG were calculated by: the HMS, by using the daily BCS changes, and by the direct ADG measurement of study cows (
Table 1): HMS to BCS
t = 0.233,
p = NS,
rp = 0.991,
p < 0.001; HMS to direct ADG collared cows
t = 0.410,
p = NS,
rp = 0.067,
p = NS; HMS to direct ADG all study cows
t = 0.009,
p = NS,
rp = 0272,
p = NS; direct ADG of collared cows to all study cows
t = −1.548,
p = NS,
rp = 0.973,
p < 0.001. Thus, we can conclude that the HMS estimation of the cow’s energy balance presented by the body RE convert to cow’s ADG is well validated by comparing it to its calculation according to BCS changes, and not rejected when compared to ADG that was calculated according to the direct measurements of the cows BW. In addition, we can conclude that the direct measured ADG of the collared cows well presents the ADG of the entire study herd.
3.10. Using the Collars and the HMS Data to Optimize Grazing-Land Stocking Rate
3.10.1. Feed Supplement Consumption throughout the Study
The cows’ yearly average EB variables were considered without the data from the first year, because that year did not cover a full year of the reproductive cycle, including breeding period and conception testing. Therefore, we used data of PL consumption measured for 4 consecutive years (20 May 2017 to 25 May 2021, 4.016 years), which were coordinated with the period of feed supplement provision and weaning dates. However, herd events occurring in the first year were summarized and affected herd management in the following years.
Dates and amounts (kg DM/year) of PL consumption were mainly affected by the yearly rain intensity, date of the first rainfall, and date of late rains that affected forage quality and availability from spring until summer. The cows stopped eating PL when the newly germinating green forage became available.
When the cows consumed dry withered forage of relatively low quality and low protein content (
Table S2 Supplemental file), PL supplementation provided the nitrogen essential for the cow gut microorganisms, significantly increasing the cows’ EB variables. According to Brosh [
20], on a DM basis, the cow preferred a level of about 30% PL in its diet. According to the HMS algorithm, a GBD greater than 30 s indicated that a shortage of forage availability was beginning to increase the cow’s daily grazing time. In the present study, based on the cows’ DMI according to HMS estimations, including the GBD effects, we can conclude that cows’ PL consumption as percentage of total DMI is consistent with Brosh’s [
20] conclusions, i.e., when the GBD indicated that forage availability was not limiting the cows’ forage intake, dietary PL consumption was about 30% of the total DMI (
Table 2).
In the first year of the study, the PL consumption measurement covered 58 days of autumn before the winter rains started. During that period (27 September to 24 November 2016), the dry forage biomass was at its yearly minimum values (
Table 2). The average GBD in that period was 41 ± 0.5 s (28 s at the beginning and 50 s at the end of the period), i.e., forage availability decreased dramatically throughout the period. The daily grazing time was 12% longer compared to the other 4 years. This biomass shortage in the first year of the study increased the dietary PL intake significantly, reaching 61.5% of the total DMI.
As the rainfall amounts in years 2016–2017 and 2017–2018 were low compared to years 2018–2019 and 2019–2020, the yearly days of PL intake in the summer and autumn of 2017 and 2018 were 1.48 times greater than for years 2019 and 2020, and the respective yearly PL consumption (kg DM/cow per year) was 1.86 times greater.
The daily intake (kg DM/day) of PL was similar in years 2, 4, and 5 (
Table 2), averaging 31.6% of the entire daily intake. This is close to what was found in Brosh [
20] to be the preferred proportion of PL in the diet of beef cows. Therefore, it can be concluded that in years 2, 4, and 5, forage availability did not limit forage consumption by the cows. However in autumn 2018 (year 3), during the PL supplementation period, the GBD average was 37 s which, according to the HMS, showed that forage availability was beginning to affect grazing intake. This biomass shortage was partly compensated for by greater PL consumption. Thus, during this period, the daily proportion of PL to DMI was 47.8%, which is relatively high (
Table 2), and close to the upper value of dietary PL measured by Brosh [
20], a reasonable value that did not cause any nutritional problems for the cows [
20].
During autumn 2018, the direct biomass measurements (
Figure 5) showed significantly low biomass. In addition, the biomass of forage in the farm herds was too low, and the farmers began giving them WH as a supplement on 3 July 2018. The average GBD of the cows from 26 June to 2 July 2018 was 17 s, and daily grazing time was 8.3 h. Based on this information, we decided to delay the provision of this expensive roughage supplement to the herd. From 27 August to 1 September 2018, the average GBS was 36 s and the daily grazing time was 8.0 h. Based on this GBD value, we initiated the WH supplement on 3 September 2018 (
Table S2), and the GBD and daily grazing time started to decrease (
Figure 5). The WH was not given ad libitum. According to the daily consumption of WH (
Table 2) and the WH cost in Israel (USD 260/ton), the delay of 2 months for initiation of WH supplementation saved the farmer USD 65 per cow in 2018.
3.10.2. MEI and DMI of Grazed Forage and Supplements, Average Yearly Calculation
An annual average summary of all energy components consumed in the pasture and from the supplements is presented in
Table 3. From these data, we calculated the carrying capacity, i.e., the potential cow-stocking rate, of the grazing area. In
Table 3, cows’ food sources and EB components are presented in rows 1–7. Row 1 presents the EB components of the total food eaten (pasture and supplements) determined by the HMS algorithm. Rows 2 and 3 present the direct measurements of the supplements. Row 4 presents the net grazed forage, as the total feed consumption calculated by the HMS (row 1) minus the directly measured consumption of the supplements (rows 2 and 3). Row 5 presents the grazed forage consumption calculated by the HMS (annual average) for periods in which the cows were outside of the experimental plot and only grazed. Row 6 presents the EB variable calculations that represent the grazing duration of the cows in the study plot. The period length (days), MEI, and DMI were calculated as data of row 4 minus row 5. Row 7 presents the calculation of the relative contribution (%) of the pasture eaten in the study plot (row 6) relative to the total grazing consumption (row 4).
Yearly Average Maintenance Requirement as a Proportion of MEI—An Index for the Interaction of Herd Energy Needs and Grazing-Land Potential for Forage Energy (ME) Production
Average yearly MEI for the 4 years of the study was 27,072 MJ/cow per year (
Table 3, row 1), with an average BW of 503 kg (
Table 3). When it was calculated as daily average MEI of the study cows, it was 698 kJ kg BW
−0.75 day
−1. According to Brosh et al. [
6], grazing cows’ net energy for maintenance (NEm), i.e., when MEI = HP (zero RE), is 523 kJ kgBW
−0.75 day
−1. The grazing cows’ NEm-to-MEI ratio well represents the energy status of the cows in their grazing land. As the ratio increases, the cows have less energy for their needs (maintenance and production). In the present study, the ratio was 523/698 = 75%. Using the above ratio output of the used system based on continuous daily monitoring of cows’ activities can greatly help characterize and adjust the cow herd to the grazing-land potential.
Carrying Capacity of the Grazing Land and Recommendation for Optimal Stocking Rate
The recommended stocking rate for the study’s grazing-land habitat was 2.0 ha/cow. In actuality, we used 1.95 ha/cow = 77.86 ha/40 cows. As the HMS estimates all EB variables, we could calculate the yearly average grazed MEI and DMI contribution of the study plot to the entire yearly consumption. For the 4-year study average (years 2 to 5), grazing on the study plot contributed 68.6% of the yearly grazed MEI and 66.2% of the yearly grazed DMI (
Table 3, row 7). The rest of the grazed MEI and DMI was consumed on other plots. Consequently, the actual yearly grazing land used by the cows on the basis of MEI was 1.95 ha/0.686 = 2.84 ha/cow, and with respect to the DMI, it was 1.95 ha/0.662 = 2.95 ha/cow, which is 42% greater grazing land than recommended on the MEI basis, and 48% greater than that recommended on the DMI basis. These calculations are compatible for cows with BW of 503 kg and an average total yearly MEI of 27,071 MJ and DMI of 3375 kg (
Table 3, row 1), with 737 kg DM/year supplemented feed, which is 21.8% of the cows’ total yearly DMI consumption. When the supplemented feed was 629 kg DM/year, 85% of it was with PL, and at 108 kg DM/year, 15% of it was with WH.
3.11. Herd Event Identification—Health, Heat Load, and Reproduction
Examples of cows’ behavior when they express health, heat-load and reproductive events are presented in
Figure 9.
Figure 9a presents an example of an individual health event and the repeated HMS alerts (alerts 1 to 5, see details in the figure legend).
Figure 9b presents a herd reaction to vaccination against Foot and Mouth Disease.
Figure 9c presents cows’ grazing activity under extreme heat stress.
Figure 9d presents three consecutive heat-detection (estrus) events.
The HMS algorithm for estrus identification (heat detection) was validated by direct observation (including artificial insemination and validation of 280 calving days after insemination), using 11 Estrotect color sticker on the tail base. During the tests, we validated estrus detection by using Estrotect that paints the base of the tail on five of the cows (using the Estrotect sticker) and in two inseminated cows according to calving date. During the main study in Karei Deshe, we did not have conditions for direct watching estrus behavior and accurate calving date. Consequently, the HMS reproduction event identification was not used for managing the herd.
We identified 11 cases of cow calving according to their locations, which deviated from the herd location. The first calving alert was a daily decrease in grazing. In addition, most of the daily locations were close to each other and at a greater distance from the herd location. However, these behaviors have not yet been included in the HMS algorithm.
3.12. Herd Reproductive Performance: Effect of the Collars and HMS Information
The main economic test of cow-calf operation beef herds is reproductive performance. An intermediate measure is the pregnancy test and the final test of herd economic performance is the weaning percentage. All the cows that were selected for the study (September 2016) were pregnant. The pregnancy rate of the study herd (yearly five years average of 40 cows), that was managed by the HMS, along the other 4 years period, 2017–2018, 2018–2019, 2019–2020, and 2020–2021, were 86%, 72%, 81%, and 81% respectively, an average of 79.8 ± 3.4. The pregnancy rate of the farm herd (details on the
supplemental file) was not tested in years 2019–2020 and 2020–2021. In years 2017–2018, 2018–2019, the farm herd pregnancy rate was 63% and 50% respectively (an average of 57%). which is 22% lower than that of the study herd at those two years. The weaning rate of the study herd at years 2017, 2018, 2019, 2020, and 2021 was 43%, 55%, 54%, 78%, and 75% respectively, an average of 61.0% ± 7.51%, a significantly increases of weaning rate along the 5 years of the study (
rp = 0.92,
p < 0.01). The weaning rate of the farm herd (yearly average of 614 cows, the study HMS managed herd not included) at those 5 years were 44%, 36%, 32%, 46%, and 46% respectively (
rp = 0.302, NS) an average of 41.0 ± 3.23%, a direct difference of 20.0% ± 6.6% for the 5 years study. For the fully tested 4-year study, the weaning years from 2018 to 2021 showed that the weaning rate of the study herd was 25.5% ± 3.52% greater than that of the farm herd.


