Article

Development Changes in the Physicochemical Composition and Mineral Profile of Red-Fleshed Dragon Fruit Grown under Semi-Arid Conditions

1
ICAR—Central Arid Zone Research Institute, Jodhpur 342003, India
2
Department of Agricultural Sciences, University of Naples Federico II, 80055 Portici, Italy
3
Department of Agricultural, Food and Forest Sciences, University of Palermo, 90128 Palermo, Italy
*
Authors to whom correspondence should be addressed.
Submission received: 29 December 2021 / Revised: 25 January 2022 / Accepted: 27 January 2022 / Published: 31 January 2022

Abstract

:
Red-fleshed dragon fruit offers an array of bioactive compounds. Its cultivation is gaining momentum in India, including in arid and semi-arid conditions. Among various factors, the fruit developmental stages and climatic conditions of locations greatly influence the biosynthesis and actual contents of different bioactive compounds and mineral contents of the fruit. The changes in physical attributes, and bioactive and mineral content in red-fleshed dragon fruit grown in semi-arid conditions in India were assessed and quantified at six developmental stages. Significant changes occurred in the physical attributes of the fruit and the bioactive compounds and mineral content during the fruit maturation stages of the red-fleshed dragon fruit. The fruit physical characteristics, such as fruit size, fruit and pulp weight gain, peel thickness, and fruit firmness, along with eating quality parameters, such as soluble solids, sugars, acidity and soluble proteins, were observed at optimum at 35 days after anthesis (DAA). The decrease in total phenolics (29.96%), total flavonoids (41.06%), and vitamin C (75.3%) occurred throughout the fruit development stages, whereas the content of betalains, which was detected initially at 25 DAA, increased (48.6%) with the progression of the fruit development stages. However, the antioxidant capacity and free radical scavenging activity demonstrated variable trends throughout the fruit maturation period. There was an increasing trend in all the minerals up to 35 days, followed by a slight decrease, except for phosphorus content, which increased until the last stage of evaluation. The colour characteristics, in conjunction with the bioactive and antioxidant potential determined in the present study, suggest that red-fleshed dragon fruit can be harvested at 35 DAA for long-distance transportation, and from 35 to 40 DAA for local marketing.

1. Introduction

Consumer awareness about the health benefits of fruit offers great thrust for their regular consumption as part of a balanced diet [1,2]. Worldwide, the demand of nutrient-dense fruit has increased immensely in the recent past, not only for enhancing nutritional status, but also for their benefits to immune and metabolic health [3,4]. Dragon fruit (Hylocereus spp.), popularly known as Pitaya, is a climbing cactus that belongs to Cactaceae family. Among its different species, Hylocereus polyrhizus (red dragon fruit or red pitaya) is highly nutritious, as it provides an array of bioactive components, including a wide range of antioxidants, phytonutrients, minerals, and enzymes [5]. Once planted, the crop runs for about 20 years, fruit-harvesting starts from the second year onward, and yield stability is attained in 3 to 5 years. Dragon fruit is native to the tropical areas of South Mexico and Central America [6], but now it is being successfully cultivated in more than 20 tropical and subtropical countries due to its high economic return, easy adaptation to different growing conditions, exotic appearance, unique taste, and promising nutritional properties [7].
Dragon fruit cultivation is now gaining momentum in India as well, as the Government of India, through various schemes, is giving greater impetus to push for its commercial cultivation in the climatically suitable regions of south, west and northeastern India, including the arid and semi-arid regions. Its fruit is consumed fresh or used for jams, beverages, and wine [8]. Several studies suggest that red-fleshed dragon fruit contains numerous health-promoting phytochemicals (i.e., carotenoids, flavonoids, polyphenols, and vitamin C), which are known to play important roles that signify strong antioxidant potential in the fruit [9,10]. The red pulp color is mainly because of the presence of betanin pigments, which are rich sources of antioxidants with radical scavenging ability [11,12,13]. Because of its strong antioxidant activity and rich source of minerals and vitamins, it helps prevent several health ailments, such as diabetes, cancer, respiratory, cardiovascular, gastrointestinal, and urinary diseases [14]. As a non-climacteric fruit, it is harvested at proper physiological maturity [5]. On the other hand, its fruit is perishable and has a short shelf-life (10–12 days); the post-harvest quality and nutrients may change and/or deteriorate rapidly [15]. Among several factors, climatic condition and fruit developmental stages influence biosynthesis and the actual contents of different bioactive compounds and minerals [16,17]. A recent study, conducted in Brazil by Zitha et al. [5], reported that the contents of anthocyanins, betacyanin, and betaxanthin, as well as the total phenolic compounds, increased with the advancement of the fruit development, but on the other hand, the content of total ascorbic acid decreased throughout the fruit development stages. A similar study of another group in the isoclimatic conditions of Brazil reported significant physico-chemical changes, such as an increase in total soluble solids, juice pH and acidity, as well as a decrease in fruit firmness and skin thickness, with an optimum level between 34 and 36 days after anthesis (DAA) [18]. While under the distinct climatic conditions of Selangor, Malaysia, a tremendous peel and pulp colour change occurred between 25 and 30 DAA, and these changes coincided with the increase of total betacyanin and protein contents [19]. Dragon fruit is a relatively new introduction to Indian arid and semi-arid climatic conditions, and the regional climate differs greatly from those in previously studied areas. Fruit growth and development occur during July-September and coincide with relatively higher temperatures, ranging from mean minimum of 30 °C to mean maximum of 40 °C with about 10 °C diurnal temperature variation. It is stated that spatial and different agro-climatic conditions have considerable effects on changes in phytochemical characteristics of dragon fruit during different stages of its growth and developemnt.
Considering the fact that a different growing environment may influence the product development and its quality differently by affecting the stimulation of the biosynthesis of secondary metabolites and health promoting phytochemicals [20], insightful knowledge about the changes in physical and nutritional compounds during the fruit development period of red-fleshed dragon fruit in arid and semi-arid condition is of paramount importance for harvesting at the proper stage for harnessing the maximum content of specific compounds and functional properties of dragon fruit in these regions. The present study aims to generate information on changes in physical and bioactive compounds and mineral nutrient compositions during the fruit growth and development stages of red-fleshed dragon fruit grown in arid and semi-arid Indian conditions.

2. Materials and Methods

2.1. Experimental Site and Fruit Material

The experiment was conducted at an adopted farmer’s field (25°20′34″ N, 73°21′26″ E; 292 m of altitude) in the Pali District of Rajasthan, India during the fruiting season of 2020–21. The climate of the site is semi-arid and subtropical with average annual rainfall of 600 mm, whereas the annual temperature typically varies from 6.5 °C to 46 °C, and rarely goes below 5 °C or above 48 °C. Three-year-old red-fleshed dragon fruits, planted on a single-pole system (four plants per pole) at 12′ × 8′ spacing, were undertaken as an experimental field study. A cement concrete pole (6′ height, 5″ thick) with a cement concrete ring (2′ dia, 2.5″ thick) with four holes fixed on top of the pole, was used as the training system to support four dragon fruit plants. Flowering started at an age of 18 months after planting, and they bore flowers and fruits continuously for 4–5 months in 4–6 cycles in the same season. Water was supplied through drip system in the ring method, with four drips (4 lph) per pole and operated by a 3HP solar-pumping system. Nutrients were mainly supplied only through organic sources, and there was farm yard manure (FYM), goat manure, vermicompost and poultry manure for each pillar (4 plants) in four split doses: 10 kg FYM during July, 2 kg vermicompost before flowering, 2.5 kg goat manure and 2.5 kg poultry manure at the fruit set and finally, 5 kg FYM and 2 kg poultry manure two months after fruit harvest. A total of 20 pillars with four plants per pillars were randomly selected and around 80 fully opened flowers in single day were marked in the middle part of the plants. The fruit samples from marked flowers were harvested at six developmental stages at five day intervals: 20, 25, 30, 35, 40 and 45 days after anthesis (DAA). Fruits were harvested in the morning and immediately brought to the Horticulture Laboratory, ICAR-CAZRI, Jodhpur. After washing with tap water, fruit samples were sanitised with sodium hypochlorite 200 mg L−1 for 15 min and dried in room conditions. Physical parameters were recorded on the same day, and then fruit pulp was separated by hand peeling. Fruit pulp was immediately frozen in liquid nitrogen then stored at −80 °C for further phytochemical and mineral analysis.

2.2. Treatments and Experimental Design

The treatments were comprised of fruits collected at six developmental stages at five days intervals: 20, 25, 30, 35, 40 and 45 days after anthesis (DAA) from 20 randomly selected pillars in a completely randomised design with three replications. A few vines from all sides of the plant were selected and then flowers were tagged with numbered metallic labels on the day of anthesis. The fruits initially set were marked in each vine. The first sample of the fruit was collected at 20 days after anthesis (DAA) and thereafter, samples were collected at a five day interval until 45 DAA.

2.3. Measurement of Fruit Morphometric Quality

Fruit size was recorded using a digital vernier calliper, while the fruit weight, pulp weight and peel weight were recorded using a top pan digital balance. The thickness of the peel was recorded at three locations of a single fruit (on the top, mid, and bottom) using the digital vernier calliper and the average of these was taken for further statistical analysis.

2.3.1. Fruit Firmness and Dry Matter Content

Fruit firmness was determined by a digital fruit hardness tester (FR-5120, Lutron Electronic Enterprise Co., Ltd., Taipei, Taiwan). The fruits were punctured at two places opposite to each other on a radial axis with a tip of 6 mm, while pulp firmness was measured with a tip of 8 mm at three points, i.e., the centre and periphery of the pulp, and the pressure required was expressed in kg cm−2. The edible portion of dragon fruit at each stage of growth weighed together and then oven-dried at 65 °C, until a constant weight was achieved. Dry matter content was calculated as a percentage of fresh weight (% FW).

2.3.2. Fruit and Pulp Colour Characteristics

The colour of the fruit and pulp during the different stages of fruit growth as well as the post-harvest storage period at room conditions was measured using a colorimeter (Model: WR-18, Make: FRU China) at the top, middle and bottom portion of the fruit and the average colour was presented as per CIE L*a*b* colour space model. The colour intensity, chroma (C), was further computed as C = ( a * 2 + b * 2 ) .

2.4. Determination of Total Soluble Solids, Acidity and Vitamin C

Dragon fruit juice was collected from the pulp and the total soluble solids (TSS) was measured by a digital hand-held refractometer (Model: Brix 54, Bellingham and Stanley, Tunbridge Wells, UK), which was calibrated using distilled water; the Brix value was noted in percentage at room temperature. The acidity of the fruit pulp was determined following the titration method using phenolphthalein as an indicator and acidity was expressed in percentage, as suggested by Ranganna [21]. The content of ascorbic acid was determined by titrimetric method using 2,6-di-chlorophenol indophenol dye (DCPIP) [21]. A sample of 10 g was blended with 4% (w/v) oxalic acid, made up to 100 mL, and filtered and centrifuged at 10,600× g for ten minutes. An aliquat (5 mL) was titrated against standard dye solution (2,6-DCPIP) to a pink endpoint. The procedure was repeated with a blank solution omitting the sample. The ascorbic acid content was calculated using the following formula and expressed as mg 100 g−1 of fresh fruit:
Ascorbic   acid   ( mg   100   g 1   FW ) =   Titre   value   ×   Dye   factor   ×   Volume   make   up   × 100 Aliquot   ×   wt .   of   sample

2.5. Determination of Bioactive Compounds and Radical Scavenging Activity

Freshly harvested red-fleshed dragon fruits (approx. 500 g) were cut into pieces to separate the pulp. The pulp from each sample was pooled and mixed in a blender to obtain paste for further analysis.

2.5.1. Protein Estimation

The total soluble protein in the pulp was determined by Bradford’s method [22]. A total of 1 g of the fruit sample was mixed with 10 mL phosphate buffer (pH 7.4) with a pestle and mortar. The mixture was centrifuged at 10,000 rpm for 10 min to obtain the protein extract. BSA (bovine serum albumin) standards of different known concentrations were prepared. Samples were prepared for protein analysis by adding 500 μL protein extract to the mix of 500 μL double distilled water and 2 mL of Bradford’s reagent. One blank was also prepared by adding 1 mL double distilled water to the 2 mL of Bradford’s reagent. These were incubated at room temperature for 10 min. Absorbance was taken at 595 nm wavelength.

2.5.2. Total Soluble Sugars Estimation

The content of total soluble sugars was estimated by following the anthrone method [23]. Briefly, 1 g of fruit sample was boiled in 5 mL 2.5 N HCl for 3 h, cooled to room temperature and then neutralised with solid sodium carbonate until the effervescence ceased. The final volume was made up to 20 mL and 0.5 mL aliquot was taken in the test tube for analysis. Distilled water was added in the test tubes to make up the volume to 1 mL, and 4 mL anthrone reagent was added. The intensity of the colour formed after adding the anthrone reagent was read at 620 nm and the concentration of total soluble sugars was computed using the standard curve of glucose.

2.5.3. Estimation of Betalains

The content of betalains in the fruit samples was estimated by measuring the absorbance of the aqueous extract [3]. A total of 1 g of the fruit sample was dissolved in 10 mL distilled water and then centrifuged. The supernatant obtained was diluted appropriately and absorbance was measured at 538 nm using a spectrophotometer. The total betalain content was computed as follows:
Total   betalain   content   ( mg   betacyanin   eq .   100   g 1   FW ) =   A   ×   MW   ×   V   ×   DF   × 1000 E   ×   L   × W   ×   100
where A = absorbance at 538 nm, MW = molecular weight of betacyanin (535), V = vol. of extract (10 mL), DF = dilution factor, E = molar extinction coefficient of betacyanin (6000), L = path length (1 cm), and W = wt. of sample (g).

2.5.4. Estimation of Total Phenol

The content of total phenol in fruit samples was determined by the Folin–Ciocalteu (FC) assay [24]. A total of 1 g of the fruit sample was extracted with 10 mL of 80% ethanol in pestle mortar, followed by centrifugation. The supernatant was separated and evaporated under a vacuum. The dried samples were dissolved in 5 mL of distilled water. A 500 μL aliquot was used and the intensity of the colour obtained with Folin–Ciocalteu’s phenol reagent was measured at 650 nm. Total phenol was expressed as mg catechol per 100 g of fruit sample.

2.5.5. Estimation of Total Flavonoids

Fruit sample (1 g) was homogenised in 10 mL of 80% methanol. A total of 500 μL of aliquot was used for estimation by adding 100 µL of aluminium chloride (10%), 1.5 mL of 95% ethanol, 100 uL of potassium acetate (1 M), and 2.5 mL of distilled water. The samples were incubated for 30 min at room temperature, and absorbance was read at 500 nm. The content of the total flavonoid was expressed as mg quercetin per 100 g of sample.

2.5.6. Total Antioxidant Capacity (FRAP)

The FRAP (ferric reducing antioxidant power assay) procedure was followed for the total antioxidant activity assay of dragon fruit samples, as described by Benzie and Strain [25]. Briefly, 1 g of the fruit sample was extracted with 10 mL of 80% ethanol by centrifugation at 10,000 rpm for 10 min. FRAP reagent was prepared by mixing acetate buffer (300 mM, pH 3.6), TPTZ (10 mM), and FeCl3 (20 mM) in 10:1:1 proportion. A 100 µL aliquot of the sample was reacted with the FRAP reagent (3 mL) and incubated at 37 °C for 30 min. The absorbance was read at 595 nm. The values were expressed as the concentration of antioxidants having a ferric-reducing ability equivalent (FRE) to that of 1 mmol L−1 FeSO4.

2.5.7. DPPH Radical Scavenging Activity

The free radical scavenging activity of the samples was determined by the DPPH (1,1-diphenyl-2-picrylhydrazyl) assay [26]. A total of 1 g of the fruit sample was extracted with 10 mL of ethanol (80%) and centrifuged at 10,000 rpm for 10 min. The supernatant was removed and appropriately diluted for the DPPH analysis. A 2 mL of aliquot was mixed with 2 mL of DPPH solution (0.1 mM in methanol). The sample was kept in the dark for 30 min and absorbance was read at 517 nm.

2.6. Mineral Analysis

The dragon fruit samples were oven dried at 65 °C until the constant weight was obtained. Dried fruit samples were then grounded in a Willy Mill. A diacid (HNO + HClO in 9:4 ratio) mixture was used and analysed for phosphorus by the vanadomolybdo-phosphoric acid yellow colour method [27]. Potassium content was determined by flame photometry, as described by Chapman and Pratt [28], whereas calcium and magnesium were determined using versene titration [29]. The concentration of micronutrients, namely zinc and iron, in diacid-digested samples was determined by the atomic absorption apectrophotometer (GBC 932 AA).

2.7. Statistical Analysis

The experiment was carried out in a randomised block design considering the days after anthesis (DAA) as the treatment, keeping three replications in each treatment. The physical and chemical characteristics of the fruits were compared through an analysis of variance (ANOVA), and polynomial regression analyses to determine the effect of the days after anthesis (p < 0.05).

3. Results

3.1. Morphometric Fruit Quality Attributes

The fruit growth (longitudinal and transverse diameter) of dragon fruit increased significantly over the period, from a minimum of 185.4 g at 20 days and to a maximum of 428.0 g at 45 days after anthesis (Table 1). The pattern of the fruit growth confirms a single sigmoid growth, as the initial growth rate was much faster and slower towards maturity. The weight of the dragon fruit increased with fruit development from 20 to 45 days after anthesis (DAA). It is apparent from data contained in Table 1 that the fruit gained mass rapidly until 35 DAA, and thereafter the gains were nominal and nonsignificant. Similar to the fruit weight, the pulp weight also increased significantly during the development period, with a gain of 63.6 g to 298.3 g during the evaluation period. However, the gain was at the maximum between a 25 to 35 day period. There was meagre difference between both fruit and pulp weight during 40 and 45 DAA. Contrary to pulp content, a corresponding decreasing trend was noted for peel content and peel thickness during fruit development. As fruit development progresses towards maturity, the thickness of the peel decreases, which exhibited a similar decreasing trend in peel content until 45 DAA. Fruit and pulp firmness have important parameters with respect to product palatability and acceptability. Softness of fruit and pulp, along with peel thickness, affect the eating quality and shelf life after harvest. Unlike pulp firmness, the fruit firmness increased during the initial stage of development up to 25 DAA and thereafter decreased consistently. It was noted that at 40 days of evaluation both fruit and pulp firmness dropped considerably and the fruit became much softer at 45 days.

3.2. Fruit and Pulp Colour Characteristics

Assessment of pulp colour parameters clearly illustrated that pigmentation started at 25 DAA, which showed an increasing trend up to the end of evaluation (Table 2). Interestingly, during the ripening process, as pulp colour became pigmented, the L* values were decreased, while the a* values were increased. As the value a* refers to the green and red colours, the higher the a* values, the redder the fruit. The maximum a* values were recorded at the end of evaluation, but the highest relative change was noticed from 35 to 40 DAA, and during this period L* was lowest; the L* value reflects the clarity. Thus, the decrease in the L* value together with the increase in a* value reflects the loss of the fruit whiteness and progression of redness of the fruit pulp. The fruit pulp almost attained the reddish colour from 35 days after anthesis with a* value of 34.0, though it increased further to 58.97 at the end of the evaluation. Colour intensity, i.e., the chroma value, also followed same trend (Table 2).
Fruit skin colour is the principal attraction for the local and export market. The results of this study revealed that the value L* in fruit skin demonstrated a slight rise until the third stage of evaluation and, afterwards, demonstrated a fall up to 45 days (Table 2), whereas the pigmentation in fruit skin began at 30 days and reached its maximum at 40 days and then declined slightly. Considering coordinate a*, it is inferred that, until 25 days, the fruits were almost green, whereas the colour transition from green to red was observed at 30 days (a* 8.34); however, predominantly red skin occurred at 40 DAA (a* 41.0).

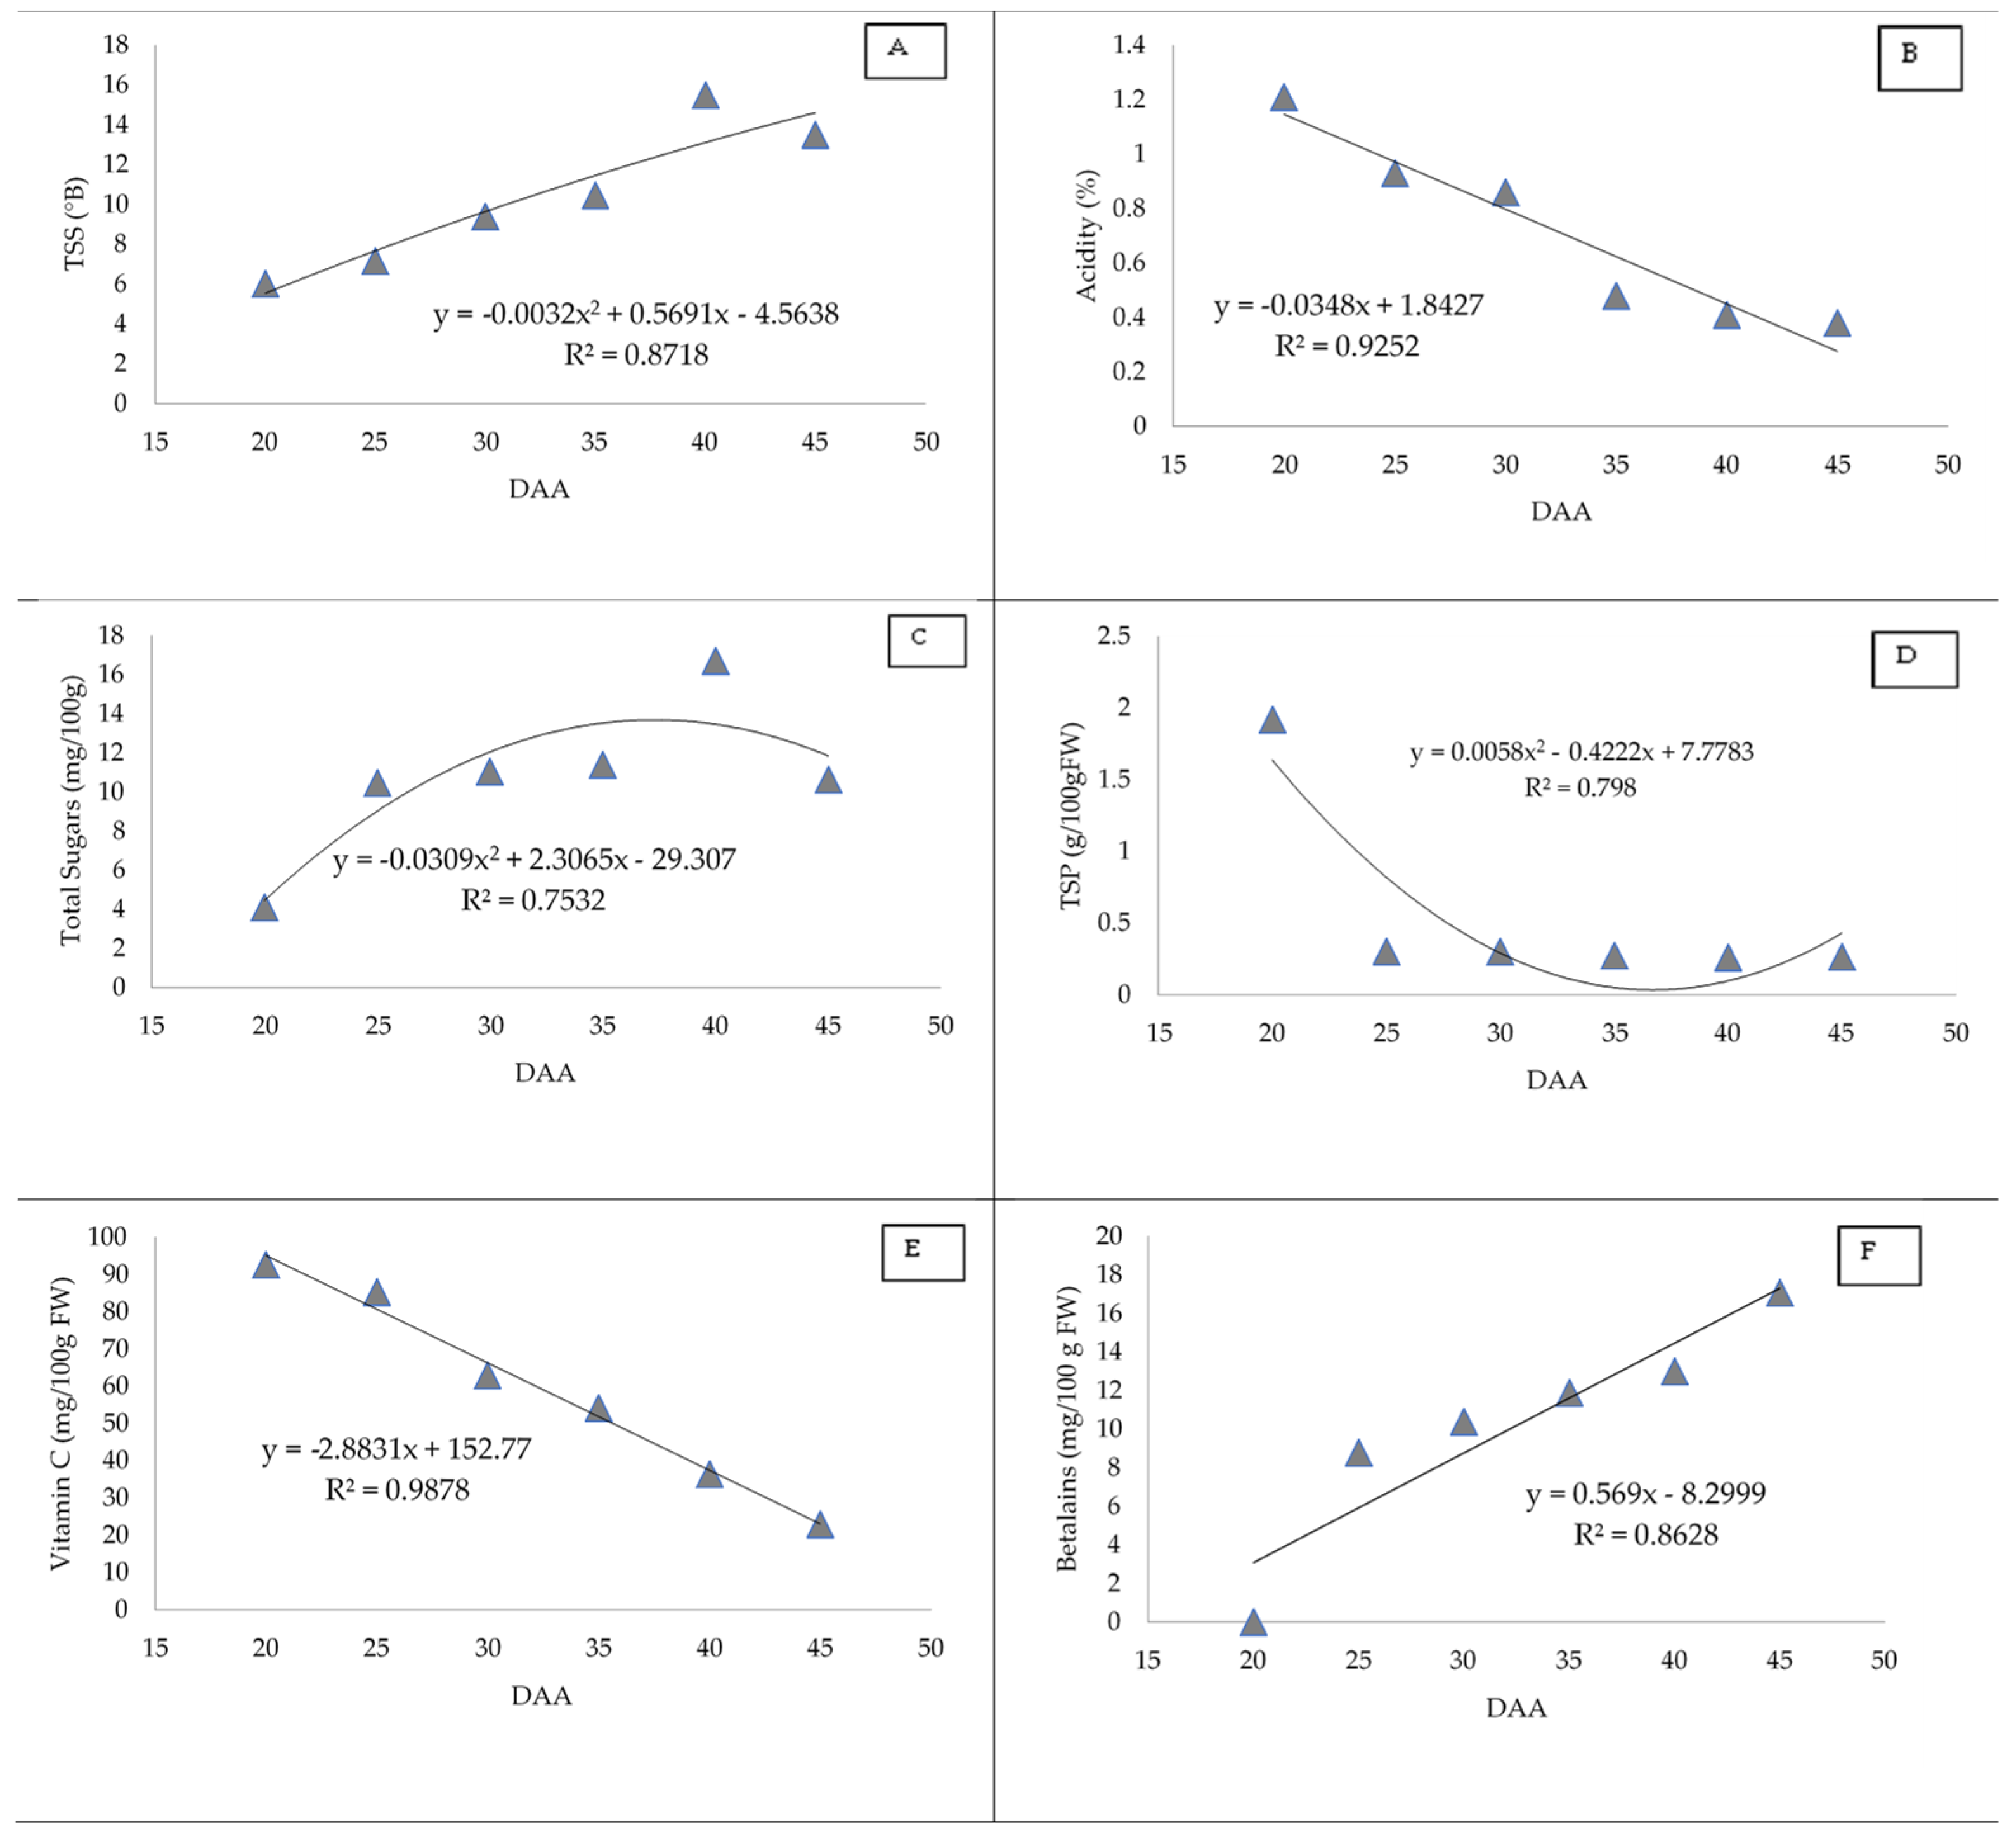
3.3. Bioactive Compounds and Radical Scavenging Activity

Figure 1A illustrates that total soluble solids (°Brix) of fruit pulp increased steadily with the progression of maturity (until 40 DAA), whereas it decreased towards the end of evaluation (45 DAA). Ascending and adequate TSS of the fruit pulp was obtained at 35 DAA, which reached to its highest level at 40 DAA. The fruit demonstrated a continuous and progressive decrease in acidity during the fruit developmental period. It dropped from 1.21% at the initial day of evaluation to 0.38% at final day of evaluation. In general, dragon fruit contained lesser amounts of total sugar content than other commonly consumed fruit. The total sugars in dragon fruit increased continuously from 4.10 (at 20 DAA) to 16.73 mg 100 g−1 (at 40 DAA) and then demonstrated a decreasing trend towards the end of maturity. As shown in Figure 1C, the content of total sugar in the early period of fruit development (20 DAA) was negligible, while from 30 to 40 DAA, the content of total sugar increased rapidly and reached to its highest level (16.73 mg 100 g−1) at 40 DAA, and afterwards it started decreasing (10.64 mg 100 g−1 at 45 DAA), while the total soluble protein in red-fleshed dragon fruit was estimated to be at the maximum at the initial stage (20 DAA) of evaluation and then dropped abruptly. During subsequent developmental stages, the protein content did not follow any distinct trend. It fluctuated during the subsequent fruit development stages and ranged from 0.261 at 40 DAA to 1.92 g 100 g−1 FW at 20 DAA.
The vitamin C content in pulp varied from 92.73 to 22.9 mg 100 g−1 FW during 20 to 45 DAA, which followed a decreasing trend—a linear pattern across the fruit developmental stages. However, the rate of decrease was relatively slow until 35 DAA but it decreased significantly afterwards with minimum content (22.9 mg 100 g−1 FW) at 45 DAA.
It is quite evident from Figure 1F that betalains significantly increased (p < 0.05) across all the fruit development stages. At the initial stage of fruit development (20 DAA, at the green stage), the content of betalains was not detected and it started increasing significantly once pulp colour turning red; this demonstrated that betalains are associated with red colouration. The contents of betalains increased linearly from 8.78 (at 25 DAA) to 17.08 mg 100 g−1 FW (at 45 DAA).
The total phenols were also influenced significantly by developmental stages (Figure 1G) and ranged from 72.69 (at 40 DAA) to a 114.8 mg catechin equivalent 100 g−1 FW (at 20 DAA). It was interesting to note that the total phenol content was highest at the initial stage of fruit development with a decreasing trend until 40 DAA, followed by a slight upsurge at the end of evaluation (45 DAA). Similarly to total phenols, total flavonoids were also recorded at the maximum at the initial stage of fruit development (20 DAA) followed by a significant drop at 25 DAA with a slight fluctuation up to 40 DAA. At the end of the evaluation, a decrease in the content of the total flavonoid was at the maximum compared to previous stages.
An array of compounds presents the dragon fruit with antioxidant potential and the nature of each compound signifies its potential, thus the total antioxidant capacity measured by the FRAP method demonstrated variable trends during dragon fruit maturation. It is quite evident from Figure 1I that the total antioxidant capacity in the red-fleshed dragon fruit varied considerably with regard to the fruit developmental stages. It ranged from 673.0 (at 45 DAA) to 887.91 FRE 100 g−1 (at 35 DAA). It was noted that the total antioxidant capacity increases and reached the maximum at 35 DAA, followed by a slight decrease during the later stages of fruit development. Similarly, there was a rapid rise in free radical scavenging activity from 20 DAA to 25 DAA and then stabilising to 35 DAA, followed by sudden drop during the subsequent fruit developmental stages. Moreover, DPPH radical scavenging activity ranged from 30.73% (at 20 DAA) to 74.32% (at 35 DAA).

3.4. Macro- and Micro-Mineral Content

Data contained in Table 3 demonstrated that dry matter content of red-flesh dragon fruit pulp increased up to 35 DAA, and thereafter it started decreasing to 45 DAA of the evaluation. However, the increase was insignificant between 25 DAA to 35 DAA, but was estimated at its highest at 35 DAA. Mineral constituents in the red-fleshed dragon fruits (100 g edible part, DW basis), at different developmental stages are given in Table 3. The content of various minerals studied were influenced significantly by the developmental stages of the dragon fruit. Irrespective of fruit developmental stages, the macro-mineral content in fruit was in the order of potassium > magnesium > calcium > phosphorus. Similarly, among the micro-minerals, the iron content was higher than zinc. Moreover, the phosphorus content ranged from 0.114% (at 35 DAA) to 0.129% (at 45 DAA); there was rise from 20 DAA to 25 DAA, followed by a decrease up to 40 DAA, and a new increase at 45 DAA. Whereas, potassium content increased up to 35 DAA with a maximum value (0.814%) and thereafter decreased gradually. Calcium content ranged from 0.128% (at 20 DAA) to 0.148% (at 35 DAA). Calcium content also followed an increasing trend up to 35 DAA and thereafter had an insignificant decrease in subsequent fruit developmental stages. The magnesium content in dragon fruit pulp increased with fruit development process from 20 to 45 DAA, and ranged from 0.148% (at 20 DAA) to 0.172% (at 45 DAA). Both iron and zinc increased up to 35 DAA, followed by slight decrease in subsequent developmental stages, but the decrease was insignificant. Iron content ranged from 49.55 mg 100 g−1 (at 20 DAA) to 64.85 mg 100 g−1 (at 35 DAA), whereas the zinc content ranged from 11.4 mg 100 g−1 (at 20 DAA) to 15.7 mg 100 g−1 (at 30 DAA).

4. Discussion

Owing to the nutrient richness and presence of a wide range of bioactive compounds, dragon fruit is regarded as a health protective fruit [3]. It also contains various vitamins, minerals and dietary fibre in significant amounts [14,30]. Reports suggest that the consumption of dragon fruit as a part of the regular diet could help in providing several health-promoting biological activities, which may prevent chronic diseases [5,18,31]. However, these biochemical and mineral constituents may vary considerably during different stages of fruit growth and development. In addition, environmental conditions at the micro level may also influence the content of these compounds. The present investigation was carried out for the comprehensive understanding of phytochemicals, macro- and micro-mineral content, and antioxidant activities during different developmental stages of fruit growth in an Indian semi-arid climate, and the results obtained are discussed here in detail.
The present findings on trends of fruit size is corroborated with those by Jamaludin et al. [32] and Magalhaes et al. [18], who also reported an increasing trend in fruit size up to 35 days with a slight decline during the latter stages of fruit development. The result of the present study on fruit and pulp weight gain is in agreement with the fact that fruit weight increases mainly during the fruit growth stage, until it reaches physiological maturity [32]. Faster rates of increase in size and weight during the initial fruit developmental stages were likely resulted by the rapid cell differentiation/enlargement, initially followed by their slow rate [33]. Chitarra and Chittarra [34] stated that the gain in fruit weight is mainly due to the development and maturation, such as the accumulation of water content, sugars and other solutes, and maturation at a specific stage of development. The loss in mass gain indicates the beginning of a degradation process, such as senescence, with a loss in quality, water loss, dehydration, and drying of bract or scale [35,36]. The results of the present study on fruit size, weight, and pulp content are consistent with the previous study on dragon fruit [18,32]. As fruit development progresses towards maturity, the thickness of the peel decreased significantly; this resulted substantially on the peel content, as the values of both decreased drastically to nearly 50% of their initial value at the end of the evaluation. Peel content and peel thickness play important roles in post-harvest quality and shelf life, as they protect mainly against water loss and biological damages. The results of the present study are in agreement to the previous studies on dragon fruit [35]. Initially, fruit firmness increased up to 25 DAA and thereafter decreased consistently, while pulp firmness decreased from the initial stage of fruit development to 45 DAA. Firmness is an important fruit quality characteristic. The reduction in flesh firmness is associated with the cell wall degradation caused by the action of hydrolytic enzymes [37]. Furthermore, the degradation of cell wall components, mainly cellulose and hemicellulose, and the decomposition of pectin components are major factors responsible for the softening of fruit skin and pulp [38].
As shown in Table 2, it is clearly noted that colour changes of both peel and pulp were not synchronised; the change in red colour of the pulp appeared earlier than the peel, as also reported by Phebe et al. [18] and Malhghgde et al. [18]. Value a* represents redness inferring that until 25 DAA, the fruit skin was predominantly green and the colour transition from green to red was observed at 30 DAA; whereas, the red pigmentation in pulp started during this period with the highest perceptible change at 30 DAA. During this period, L* was lower in pulp. The numerous seeds embedded in the pulp may partially contribute to appearing a darker colour (lower L*) of pulp [39]. There was a clear decrease in b* values with fruit development, which is in agreement with previous studies [40,41] that concluded that this decrease is related to the degradation of peel pigments, such as chlorophyll and carotenoids, throughout maturation.
Total soluble solids were a main eating quality of fruits ascending and adequately obtained at 35 DAA with slight decline at 45 DAA in the present study. The increase in the content of soluble solids is a good indicator of maturation and taste of fruits [36]. The increase in TSS content at proper maturation is possibly due to starch degradation and quick metabolic transformation in soluble compounds, mainly sugars [33]. The fruit demonstrated continuous and progressive decrease in acidity from 1.21% at 20 DAA to 0.38% at 45 DAA. Arevalo-Galaraza and Ortiz Hernandez [42] proposed that the higher content of acidity in initial stages demonstrates the beginning of maturation, whereas Chitarra and Chitarra [34] reported that during the maturation process organic acids become decreased because of their utilisation as a substrate during respiration or their conversion into sugars. Similar findings are reported by Magalhaes et al. [18] and Ivan et al. [35] in dragon fruit, Deka et al. [43] in khasi mandarin, and Kishore et al. [44] and Patel et al. [33] in passion fruit. The content of total sugar in the early period of fruit development (20 DAA) was negligible, while from 30 to 40 DAA, the content of total sugar increased rapidly and reached its highest level (16.73 mg 100 g−1) at 40 DAA, then it started decreasing and reached to 10.64 mg 100 g−1 at 45 DAA of evaluation. This rapid increase in sugar content during later fruit developmental stages is believed to occur due to hydrolysis of starch into simple sugars and also the conversion of acids into sugar [45]. The increase in total sugar content during fruit maturity is also depending on sucrose accumulation [46]. The increased TSS might have also caused an increase of total sugar. The ratio of acidity and sugars are the main attributes responsible for fruit taste, representing the balance between a sweet and sour taste [33].
Vitamin C is another crucial component of the nutritional quality assessment of fruits [47]. In present study, the vitamin C content followed a decreasing trend in a linear pattern across the fruit developmental stages. However, the rate of decrease was relatively slow until 35 DAA. An adequate supply of hexose sugars in photosynthetic activity might explain the higher availability of ascorbic acid during the initial fruit growth stage, while enzymatic oxidation of the L-ascorbic acid to dehydro-ascorbic acid during the metabolic process explains the reduction in ascorbic acid content at later stages [48]. Moreover, growing conditions, agro-climatic conditions, orchard management, maturation stage, and post-harvest handling may also strongly influence vitamin C content in fruits [49]. Reduction in vitamin C content at a later stage of fruit development in other fruits were also reported by various workers in peach [50], banana, mango, papaya [51], khasi mandarin [43], passionfruit [33,44], and strawberry [52].
Currently, red-fleshed dragon fruit are in high demand because of the health benefits of betalain, a plant-derived natural pigment [53,54]. This can be extracted and stabilised easily for use as a natural food colorant [55]. Result demonstrated that betalians was not detected at initial stage of development (20 DAA) but started increasing significantly once the pulp colour turned red at 25 DAA and then increased linearly up to 45 DAA. The pattern of betalain content demonstrated that it is associated with red pigmentation in dragon fruit. Chemically betacyanin and betaxanthins constitute betalains, in which betacyanin is responsible for red-violet colour and betaxanthins for yellow colour [55,56]. The red-purple colour of dragon fruit flesh is mainly due to the presence of betacyanins, which have a higher antioxidant activity than betaxanthins [11,56,57,58]. The results of the present study of the increasing trends of betalains throughout the development period, except the green pulp stage, was also reported in a previous study by various workers [5,35,58,59]. As shown in Figure 1G, the total phenol content was highest at the initial stage of fruit development with a decreasing trend to 40 DAA, followed by slight upsurge at the end of evaluation 45 DAA. A rapid increase in phenol content during the green stage was probably due initially to the increase of its biosynthesis but the decrease in the later stage was due to the increase in the activity of polyphenol oxidase [60] vis-à-vis a conversion of soluble phenolics into insoluble phenolics [61]. Variable results on total phenolics during fruit maturation in dragon fruit and other fruits were reported in previous studies. These variations might have occurred due to various factors, such as cultivars, maturation stage, soil and climatic conditions, management practices, and extraction conditions [16,17,62].
Antioxidants measured by the FRAP method in the present study demonstrated increasing trends during fruit growth and development and reached their maximum at 35 DAA, thereafter decreasing slightly during the later stages of fruit development. Similarly, there was a rapid rise in free radical scavenging activity from 20 DAA to 25 DAA, which stabilised to 35 DAA and was followed by a sudden drop during subsequent fruit developmental stages. The trend was in line with the pattern noted for total phenolic content, total flavonoides content, vitamin C, and betalains, signifying a positive role in the total antioxidant capacity. The surge in antioxidant capacity during the intense colour development stage might be attributed to an increase concentration of betalains, as well as a reasonable quantity of vitamin C [63] and other phytochemicals, especially phenolic compounds [57,63]. This might be the reason that different stages of fruit development did not show any definite pattern on the total antioxidant activity.
The mineral content in red-fleshed dragon fruit pulp during fruit developmental periods was scarcely studied. In this study, we report an increasing trend in all the studied minerals for 35 days followed by slight decrease, except phosphorus content, which increased until the last stage of the evaluation. These results demonstrate that red-fleshed dragon fruit has significant levels of important minerals for the human diet. Besides, macro- and micro-minerals play important roles in the development of fruit properties, such as colour characteristics, aroma, shape, size, appearance, resistance to biotic and abiotic incidence, physiological disorders, biochemical characteristics, and post-harvest life [35].

5. Conclusions

Physicochemical characteristics, such as fruit size, fruit and pulp weight gain, peel thickness, fruit firmness, TSS, sugars, acidity, and soluble proteins, recorded their optimum level at 35 DAA. The colour changes of both peel and pulp were not synchronised, and the change in red colour in pulp appeared earlier than the peel. As maturity stages progressed from 25 to 35 DAA, the peel colour of dragon fruit turned from green to red (L* 51.5; a* 20.23), while pulp colour changed from creamy white to red (L* 29.4; a* 34.0). The main eating quality characteristics, such as the total soluble solids (15.5 °Brix) and total sugars (16.73%) of the fruit, obtained the highest level at 40 DAA. The results of the present study demonstrate that red-fleshed dragon fruit has significant levels of betalains (13.01 mg 100 g−1 FW), vitamin C (54.2 mg 100 g−1 FW), total phenolic content (82.11 mg catechin equivalent 100 g−1), total flavonoids (85.57 mg quercetin equivalent 100 g−1), and total antioxidant capacity (887.91 FRE 100 g−1) with free radical scavenging (70.11%) between 35 and 40 DAA. Similarly, important mineral content also followed an increasing trend for 35 days, followed by a slight decrease, except the phosphorus content, which increased until the last stage of the evaluation. It is concluded that for maximum food value and improved post-harvest handling, the fruit of the red-fleshed dragon fruit may be harvested between 35 and 40 days after anthesis.

Author Contributions

Conceptualisation, A.S. and A.K.S.; methodology, A.S., S.S., M.K., N.R.P. and P.K.; software, A.S. and S.S.; validation, A.S., A.K.S., S.S., M.K., N.R.P. and P.K.; formal analysis, A.S. and S.S.; investigation, A.S., A.K.S., S.S., M.K., N.R.P. and P.K.; data curation, A.S., S.S. and N.R.P.; visualisation, A.S., S.S., A.K.S. and P.K.; writing—original draft preparation, A.S., S.S. and P.K.; writing—review and editing, P.K., A.K.S., Y.R. and L.S.; draft–finalisation, A.S., P.K., Y.R. and L.S.; project administration, A.S. All authors have read and agreed to the published version of the manuscript.

Funding

There was no external funding involved in the study.

Institutional Review Board Statement

Not applicable.

Data Availability Statement

Not applicable.

Acknowledgments

Authors thankfully acknowledge the ICAR-Central Arid Zone Research Institute, Jodh-pur for extending logistic supports for conducting the study.

Conflicts of Interest

The authors declare no conflict of interest.

References

  1. F.A.O. Fruit and Vegetables—Your Dietary Essentials; The International Year of Fruits and Vegetables, 2021, Background Paper; FAO: Rome, Italy, 2020. [Google Scholar] [CrossRef]
  2. Taylor, C.W.; Bailey, R.L.; Blumberg, J.B.; Freeman, B.B.; Oliver Chen, C.Y.; Crowe-White, K.M.; Drewnowski, A.; Hooshmand, S.; Johnson, E.; Lewis, R.; et al. Fruits, vegetables, and health: A comprehensive narrative, umbrella review of the science and recommendations for enhanced public policy to improve intake. Crit. Rev. Food Sci. Nutr. 2020, 60, 2174–2211. [Google Scholar]
  3. Arivalagan, M.; Karunakaran, G.; Roy, T.K.; Dinsha, M.; Sindhu, B.C.; Shilpashree, V.M.; Satisha, G.C.; Shivashankara, K.S. Biochemical and nutritional characterization of dragon fruit (Hylocereus species). Food Chem. 2021, 353, 129426. [Google Scholar] [CrossRef] [PubMed]
  4. Molla, M.M.; Kamal, M.M.; Sabuz, A.A.; Chowdhury, M.G.F.; Khan, M.H.H.; Khatun, A.; Miaruddin, M.; Zashimuddin, M.; Islam, M.M. Chemical composition, bioactive compounds, antioxidants potential and mycotoxin of minor exotic Archidendron pauciflorum fruit with the focus to Bangladesh. Biocatal. Agric. Biotechnol. 2021, 34, 102039. [Google Scholar] [CrossRef]
  5. Zitha, E.Z.M.; Magalhaes, D.S.; Lago, R.C.; Carvalho, E.E.N.; Pasqual, M.; Eduardo Val’ erio de Barros Vilas Boas. Changes in the bioactive compounds and antioxidant activity in red-fleshed dragon fruit during its development. Sci. Hortic. 2022, 291, 110611. [Google Scholar] [CrossRef]
  6. Mercado-Silva, E.M. Pitaya—Hylocereus Undatus (Haw); Rodrigues, S., de Oliveira Silva, E., de Brito, E.S., Fruits, E., Eds.; Academic Press: Cambridge, MA, USA, 2018; pp. 339–349. [Google Scholar] [CrossRef]
  7. Thaiudom, S.; Oonsivilai, R.; Thaiwong, N. Production of colorant powder from dragon fruit (Hylocerecus polyrhizus) peel: Bioactivity, heavy metal contamination, antimutagenicity, and antioxidation aspects. J. Food Process. Preserv. 2021, 45, 15044. [Google Scholar] [CrossRef]
  8. Shetty, A.A.; Rana, M.K.; Preetham, S.P. Cactus: A medicinal food. J. Food Sci. Technol. 2012, 49, 530–536. [Google Scholar] [CrossRef] [Green Version]
  9. Fathordoobady, F.; Mirhosseini, H.; Selamat, J.; Manap, M.Y.A. Effect of solvent type and ratio on betacyanins and antioxidant activity of extracts from Hylocereus polyrhizus flesh and peel by supercritical fluid extraction and solvent extraction. Food Chem. 2016, 202, 70–80. [Google Scholar] [CrossRef]
  10. Leong, H.Y.; Show, P.L.; Lim, M.H.; Ooi, C.W.; Ling, T.C. Natural red pigments from plants and their health benefits: A review. Food Rev. Int. 2018, 34, 463–482. [Google Scholar] [CrossRef]
  11. Garcia-Cruza, L.; Duenas, M.; Santos-Buelgas, C.; Valle-Guadarrama, S.; Salinas-Moreno, Y. Betalains and phenolic compounds profiling and antioxidant capacity of pitaya (Stenocereus spp.) fruit from two species (S. pruinosus and S. stellatus). Food Chem. 2017, 234, 111–118. [Google Scholar] [CrossRef]
  12. Tanaka, Y.; Sasaki, N.; Ohmiya, A. Biosynthesis of plant pigments: Anthocyanins, betalains and carotenoids. Plant J. 2008, 54, 733–749. [Google Scholar] [CrossRef]
  13. Stintzing, F.C.; Schieber, A.; Carle, R. Evaluation of colour properties and chemical quality parameters of cactus juice. Eur. Food Res. Technol. 2003, 216, 303–311. [Google Scholar] [CrossRef]
  14. Joshi, M.; Prabhakar, B. Phytoconstituents and pharmaco-therapeutic benefits of pitaya: A wonder fruit. J. Food Biochem. 2020, 44, 13260. [Google Scholar] [CrossRef] [PubMed]
  15. Kishore, K. Phenological growth stages of dragon fruit (Hylocereus undatus) according to the extended BBCH-scale. Sci. Hortic. 2016, 213, 294–302. [Google Scholar] [CrossRef]
  16. Alanon, M.E.; Pimentel-Moral, S.; Arraez-Roman, D.; Segura-Carretero, A. HPLCDAD-Q ToF-MS profiling of phenolic compounds from mango (Mangifera indica L.) seed kernel of different cultivars and maturation stages as a preliminary approach to determine functional and nutraceutical value. Food Chem. 2021, 337, 127764. [Google Scholar] [CrossRef]
  17. Xu, M.; Shen, C.; Zheng, H.; Xu, Y.; Xue, C.; Zhu, B.; Hu, J. Metabolomic analysis of acerola cherry (Malpighia emarginata) fruit during ripening development via UPLC-Q-TOF and contribution to the antioxidant activity. Food Res. Int. 2020, 130, 108915. [Google Scholar] [CrossRef] [PubMed]
  18. Magalhaes, D.S.; Da Silva, D.M.; Ramos, J.D.; Salles Pio, L.A.; Pasqual, M.; Vilas Boas, E.V.B.; Galvao, E.C.; de Melo, E.T. Changes in the physical and physicochemical characteristics of red-pulp dragon fruit during its development. Sci. Hortic. 2019, 253, 180–186. [Google Scholar] [CrossRef]
  19. Phebe, D.; Chew, M.K.; Suraini, A.A.; Lai, O.M.; Janna, O.A. Red-fleshed pitaya (Hylocereus polyrhizus) fruit colour and betacyanin content depend on maturity. Int. Food Res. J. 2009, 16, 233–242. [Google Scholar]
  20. Gonzalez-Chavira, M.M.; Herrera-Hernandez, M.G.; Guzman-Maldonado, H.; Pons-Hernandez, J.L. Controlled water deficit as abiotic stress factor for enhancing the phytochemical content and adding-value of crops. Sci. Hortic. 2018, 234, 354–360. [Google Scholar] [CrossRef]
  21. Ranganna, S. Handbook of Analysis and Quality Control for Fruit and Vegetable Products; Tata McGraw-Hill Education Publication: New Delhi, India, 2001; pp. 594–625. [Google Scholar]
  22. Bradford, M.M. A rapid and sensitive for the quantitation of microgram quantitites of protein utilizing the principle of protein-dye binding. Anal. Biochem. 1976, 72, 248–254. [Google Scholar] [CrossRef]
  23. Asare, I.K.; Okyere, A.A.; Duah-Bissiw, D.; Ofosu, D.O.; Darfour, B. Nutritional and phytochemical constituents of the african star apple (Chrysophyllum albidum g. don). Ann. Food Sci. Technol. 2015, 16, 138–146. [Google Scholar]
  24. Singleton, V.L.; Orthofer, R.; Lamuela-Raventos, R.M. Analysis of total phenols and other oxidation substrates and antioxidants by means of Folin-Ciocalteu reagent. Meth. Enzymol. 1999, 299, 265–275. [Google Scholar]
  25. Benzie, I.E.F.; Strain, J.J. The ferric reducing ability of plasma (FRAP) as a measure of ‘antioxidant power’: The FRAP assay. Anal. Biochem. 1996, 239, 70–76. [Google Scholar] [CrossRef] [PubMed] [Green Version]
  26. Kaur, C.; Kapoor, H.C. Anti-oxidant activity and total phenolic content of some Asian vegetables. Int. J. Food Sci. Technol. 2002, 37, 153–161. [Google Scholar] [CrossRef]
  27. Jackson, M.L. Soil Chemical Analysis; Printice-Hall of India Pvt. Ltd.: New Delhi, India, 1973; p. 498. [Google Scholar]
  28. Chapman, D.H.; Pratt, P.F. Methods of Analysis for Soils, Plants and Water; University of California: Berkeley, CA, USA, 1961. [Google Scholar]
  29. Derderian, M.D. Determination of Calcium and Magnesium in Plant Material with EDTA. Anal. Chem. 1961, 33, 1796–1798. [Google Scholar] [CrossRef]
  30. Karunakaran, G.; Arivalagan, M. Dragon Fruit—A new introduction crop with promising market. Indian Hortic. 2019, 63, 8–11. [Google Scholar]
  31. Kaur, G.; Thawkar, B.; Dubey, S.; Jadhav, P. Pharmacological potentials of betalains. J. Complement. Integr. Med. 2018, 15, 1–9. [Google Scholar] [CrossRef]
  32. Jamaludin, N.A.; Dinga, A.P.; Hamidb, A.A. Physico-chemical and structural changes of red-fleshed dragon fruit (Hylocereus polyrhizus) during fruit development. J. Sci. Food Agric. 2011, 91, 278–285. [Google Scholar] [CrossRef] [Green Version]
  33. Patel, R.K.; Singh, A.; Prakash, J.; Amit, N.; Deka, B.C. Physico-biochemical changes during fruit growth, development and maturity in passion fruit genotypes. Indian J. Hortic. 2014, 71, 486–493. [Google Scholar]
  34. Chitarra, M.I.F.; Chitarra, A.B. Post-Harvesting of Fruits and Vegetables: Physiology and Handling, 2nd ed.; FAEPE: Lavras, Brazil, 2005; p. 785. [Google Scholar]
  35. Ivan, M.R.J.; Magalhaes, D.S.; Rodrigues, F.A.; Pasqual, M.; Pio, L.A.S. Growth and maturation of white-fleshed dragon fruit. Res. Soc. Dev. 2021, 10, 16822. [Google Scholar]
  36. Lima, C.A.; Faleiro, F.G.; Junqueira, N.T.V.; Bellon, G. Evaluation of physicochemical characteristics of fruits of two pitaya species. Ceres Mag. 2014, 61, 377–383. [Google Scholar] [CrossRef] [Green Version]
  37. Shattir, A.A.E.T.; Abu-Goukh, A.B.A. Physico-chemical changes during growth and development of papaya fruits, I: Physical changes. Agric. Biol. J. N. Am. 2010, 1, 866–870. [Google Scholar] [CrossRef]
  38. Paliyath, G.; Murr, D.P. Biochemistry of fruits. In Postharvest Biology and Technology of Fruits, Vegetables and Flowers; Gopinadhan, P., Murr, D.P., Handa, A.K., Lurie, S., Eds.; Wiley-Bleckwell Publishing: Ames, IA, USA, 2008; pp. 19–50. [Google Scholar]
  39. Weiss, J.; Nerd, A.; Mizrahi, Y. Flowering behaviour and pollination requirements in climbing cacti with fruit crop potential. HortScience 1994, 29, 1487–1492. [Google Scholar] [CrossRef] [Green Version]
  40. Ortiz, T.A.; Takahashi, L.S.A. Physical and chemical characteristics of pitaya fruits at physiological maturity. Genet. Mol. Res. 2015, 14, 14422–14439. [Google Scholar] [CrossRef] [PubMed]
  41. Nerd, A.; Gutman, F.; Mizrahi, Y. Ripening and Postharvest behaviour of fruits of two Hylocereus species (Cactaceae). Postharvest Biol. Technol. 1999, 17, 39–45. [Google Scholar] [CrossRef]
  42. Arevalo-Galarza, M.L.; Ortiz-Hernández, Y.D. Postcosecha behavior of the pitahaya fruit (Hylocereus undatus). Mex. Cactaceae Succul. 2004, 49, 85–90. [Google Scholar]
  43. Deka, B.C.; Sharma, S.; Borah, S.C. Post harvest management practices of mandarin. Indian J. Hortic. 2006, 63, 251–255. [Google Scholar]
  44. Kishore, K.; Bharali, R.; Pathak, K.A.; Yadav, D.S. Studies on ripening changes in purple passion fruit (Passiflora edulis Sims). J. Food Sci. Technol. Mysore 2006, 43, 599–602. [Google Scholar]
  45. Chandra, R. Biochemical changes during maturity and storage in guava fruits. Indian J. Hill Fmg. 1990, 8, 16–21. [Google Scholar]
  46. Burger, Y.; Schaffer, A.A. The contribution of sucrose metabolism enzymes to sucrose accumulation in Cucumis melo. J. Am. Soc. Hortic. Sci. 2007, 132, 704–712. [Google Scholar] [CrossRef] [Green Version]
  47. Fenech, M.; Amaya, I.; Valpuesta, V.; Botella, M.A. Vitamin C Content in Fruits: Biosynthesis and Regulation. Front. Plant Sci. 2019, 9, 2006–2027. [Google Scholar] [CrossRef] [Green Version]
  48. Neeraj, M.S.; Bhatia, S.K. Effect of plastic packaging on biochemical parameters of fruits during storage—A review. Haryana J. Hortic. Sci. 2002, 31, 1–7. [Google Scholar]
  49. Lee, S.K.; Kader, A.A. Preharvest and postharvest factors influencing vitamin C content of horticultural crops. Postharvest Biol. Technol. 2000, 20, 207–220. [Google Scholar] [CrossRef] [Green Version]
  50. Guizani, M.; Maatallah, S.; Dabbou, S.; Serrano, M.; Hajlaoui, H.; Helal, A.N.; Kilani-Jaziri, S. Physiological behaviors and fruit quality changes in five peach cultivars during three ripening stages in a semi-arid climate. Acta Physiol. Plant. 2019, 41, 2950–2956. [Google Scholar] [CrossRef]
  51. Siriamornpun, S.; Kaewseejan, N. Quality, bioactive compounds and antioxidant capacity of selected climacteric fruits with relation to their maturity. Sci. Hortic. 2017, 221, 33–42. [Google Scholar] [CrossRef]
  52. Singh, A.; Singh, B.K.; Deka, B.C.; Sanwal, S.K.; Patel, R.K.; Verma, M.R. The genetic variability, inheritance and inter-relationship of ascorbic acid, β-carotene, phenol and anthocyanin content in strawberry. Sci. Hortic. 2011, 129, 86–90. [Google Scholar] [CrossRef]
  53. Luu, T.; Le, T.; Huynh, N.; Quintela-Alonso, P. Dragon fruit: A review of health benefits and nutrients and its sustainable development under climate changes in Vietnam. Czech J. Food Sci. 2021, 39, 71–94. [Google Scholar] [CrossRef]
  54. Bartosz, S.; Bartosz, G. Biological properties and applications of betalains. Molecules 2021, 26, 2520. [Google Scholar] [CrossRef] [PubMed]
  55. Gengatharan, A.; Dykes, G.A.; Choo, W.S. Betalains: Natural plant pigments with potential application in functional foods. LWT Food Sci. Technol. 2015, 64, 645–649. [Google Scholar] [CrossRef]
  56. Azeredo, H.M.C. Betalains: Properties, sources, applications, and stability—A review. Int. J. Food Sci. Technol. 2009, 44, 2365–2376. [Google Scholar] [CrossRef] [Green Version]
  57. Paśko, P.; Galanty, A.; Zagrodzki, P.; Ku, Y.G.; Luksirikul, P.; Weisz, M.; Gorinstein, S. Bioactivity and cytotoxicity of different species of pitaya fruits—A comparative study with advanced chemometric analysis. Food Biosci. 2021, 40, 100888. [Google Scholar] [CrossRef]
  58. Hua, Q.; Chen, C.; Tel, N.; Wang, H.; Wu, J.; Chen, J.; Zhang, Z.; Zhao, J.; Hu, G.; Qin, Y. Metabolomic characterization of pitaya fruit from three red-skinned cultivars with different pulp colors. Plant Physiol. Biochem. 2018, 126, 117–125. [Google Scholar] [CrossRef] [PubMed]
  59. Wu, Y.; Xu, J.; He, Y.; Shi, M.; Han, X.; Li, W.; Zhang, X.; Wen, X. Metabolic profiling of pitaya (Hylocereus polyrhizus) during fruit development and maturation. Molecules 2019, 24, 1114. [Google Scholar] [CrossRef] [Green Version]
  60. Nie, X.R.; Li, H.Y.; Wei, S.Y.; Han, Q.H.; Zhao, L.; Zhang, Q.; Li, S.Q.; Qin, W.; Wu, D.T. Changes of phenolic compounds, antioxidant capacities, and inhibitory effects on digestive enzymes of kiwifruits (Actinidia chinensis) during maturation. J. Food Meas. Charact. 2020, 14, 1765–1774. [Google Scholar] [CrossRef]
  61. Benchikh, Y.; Louaileche, H.; George, B.; Merlin, A. Changes in bioactive phytochemical content and in vitro antioxidant activity of carob (Ceratonia siliqua L.) as influenced by fruit ripening. Ind. Crop. Prod. 2014, 60, 298–303. [Google Scholar] [CrossRef]
  62. Vongsak, B.; Sithisarn, P.; Mangmool, S.; Thongpraditchote, S.; Wongkrajang, Y.; Gritsanapan, W. Maximizing total phenolics, total flavonoids contents and antioxidant activity of Moringa oleifera leaf extract by the appropriate extraction method. Ind. Crops Prod. 2013, 44, 566–571. [Google Scholar] [CrossRef]
  63. Esquivel, P.; Stintzing, F.C.; Carle, R. Phenolic compound profiles and their corresponding antioxidant capacity of purple pitaya (Hylocereus sp.) genotypes. Z. Naturforsch. Sect. C J. Biosci. 2007, 62, 636–644. [Google Scholar] [CrossRef]
Figure 1. Changes in TSS (A), acidity (B), total sugars (C), total soluble protein (D), vitamin C (E), betalains (F), total phenolic content (G), total flavonoides (H), total antioxidant capacity (I), and free radical scavenging (J) in the red-fleshed dragon fruit during different fruit developmental stages.
Agronomy 12 00355 g001aAgronomy 12 00355 g001b
Table 1. Changes in morphometric fruit quality attributes of red-fleshed dragon fruit during different fruit developmental stages.
DAALongitudinal Diameter (mm)Transverse Fruit Diameter (mm)Fruit Weight (g)Pulp Weight (g)Peel Content (%)Peel Thickness (mm)Fruit Firmness (kg cm−2)Pulp Firmness
(kg cm−2)
2082.7 c62.7 c185.4 c63.6 de62.6 a7.83 a3.42 b2.47 a
2587.6 c75.0 b219.6 c103.7 d52.7 b7.40 a3.87 a1.38 b
3090.5 bc77.4 b300.7 b164.5 c45.6 b6.57 b3.51 ab1.25 b
3598.2 ab78.1 b372.6 b225.1 b39.8 bc5.02 c2.90 c0.61 c
40106.3 a80.1 ab410.5 a282.0 a32.4 c3.81 d2.25 d0.46 d
45107.7 a82.3 a428.0 a298.3 a30.7 c3.03 d1.59 e0.40 c
Different letters within the column for each parameter indicate significant differences among days after anthesis (DAA) at p < 0.05, as per the LSD test.
Table 2. Changes in peel- and flesh-colour in red-fleshed dragon fruit during fruit developmental stages.
DAAFruit ColourPulp Colour
L*a*b*C ValueL*a*b*C Value
2051.63 a−9.53 d28.16 a26.5 b37.93 a4.47 d24.45 a24.8 c
2551.16 a−5.02 d24.13 a23.6 b37.2 a7.23 d10.67 b12.9 d
3053.06 a8.34 c14.5 b16.7 c27.34 b25.34 c−5.36 c24.7 c
3551.53 a20.23 b8.07 c21.7 b29.4 b34.0 b−6.73 c33.3 b
4045.03 b41.0 a2.23 d41.0 a28.0 b57.87 a−5.23 c57.8 a
4538.23 c37.54 a2.04 d37.6 a25.52 b58.97 a−2.56 d58.9 a
Different letters within the column for each parameter indicate significant differences among days after anthesis (DAA) at p < 0.05, as per the LSD test.
Table 3. Changes in mineral content in red-fleshed dragon fruits during different fruit developmental stages.
DAADry Matter ContentPKCaMgFeZn
g 100 g−1 DWmg 100 g−1 DW
2017.83 c0.124 a0.681 c0.128 b0.148 b49.55 b11.4 b
2518.29 b0.127 a0.714 c0.132 b0.154 b60.90 a14.6 a
3018.90 b0.116 b0.760 b0.143 a0.159 b62.15 a15.7 a
3519.24 a0.114 b0.814 a0.148 a0.167 a64.85 a15.1 a
4018.87 b0.118 b0.803 a0.145 a0.164 a60.30 a14.9 a
4518.67 b0.129 a0.797 a0.143 a0.172 a59.60 a14.7 a
Different letters within the column for each parameter indicate significant differences among DAA at p < 0.05, as per the LSD test.
Publisher’s Note: MDPI stays neutral with regard to jurisdictional claims in published maps and institutional affiliations.

