Article

The Individual and Combined Effect of Nanoparticles and Biofertilizers on Growth, Yield, and Biochemical Attributes of Peanuts (Arachis hypogea L.)

by
Ahmed M. Abdelghany
1,
Aly A. A. El-Banna
2,
Ehab A. A. Salama
3,
Muhammad Moaaz Ali
4,
Asma A. Al-Huqail
5,
Hayssam M. Ali
5,
Lidia Sas Paszt
6,
Gawhara A. El-Sorady
2 and
Sobhi F. Lamlom
2,*
1
Crop Science Department, Faculty of Agriculture, Damanhour University, Damanhour 22516, Egypt
2
Plant Production Department, Faculty of Agriculture Saba Basha, Alexandria University, Alexandria 21531, Egypt
3
Agricultural Botany Department, Faculty of Agriculture Saba Basha, Alexandria University, Alexandria 21531, Egypt
4
College of Horticulture, Fujian Agriculture and Forestry University, Fuzhou 350002, China
5
Botany and Microbiology Department, College of Science, King Saud University, P.O. Box. 2455, Riyadh 11451, Saudi Arabia
6
The National Institute of Horticultural Research, Konstytucji 3 Maja 1/3, 96-100 Skierniewice, Poland
*
Author to whom correspondence should be addressed.
Submission received: 27 December 2021 / Revised: 1 February 2022 / Accepted: 1 February 2022 / Published: 5 February 2022

Abstract

:
A two-year (2020–2021) field experiment was conducted to investigate the impact of particular nanoparticles and biofertilizers on the growth, yield, and biochemical attributes of peanuts (Cv. Giza 6). Before planting, the seeds were inoculated with two biofertilizers, mycorrhiza and phosphorine, and were considered the main plot. The subplot contained foliar sprays of nanoparticles, i.e., 200 ppm boron (B), 200 ppm calcium (Ca), their combination (Ca+B), and the control (no spray). The results revealed that mycorrhiza significantly increased 100-seed weight (70.45 g), seed yield (1.9 ton/ha), biological yield (7.5 ton/ha), crop growth rate (CGR) (2.9 g day−1 m−2), branching number (12.5), and protein content (22.96) compared with the control or phosphorine. Among the nanoparticles, Ca+B maximally improved plant height, CGR, 100-seed weight, shelling percentage, seed yield, oil content, and seed protein, while plants treated with B exhibited maximum seed nitrogen, pods per plant, and biological yield compared to other treatments. Overall, plants treated with Ca and B nanoparticles and mycorrhiza exhibited remarkable improvement in their growth, yield, and biochemical attributes, suggesting that nanotechnology and biofertilization are steps toward environmentally friendly, progressive farming. This study laid the basis for further elucidation of the molecular mechanism of plants in response to these nanoparticles and biofertilizers.

1. Introduction

The peanut (Arachis hypogea L.) is one of the most essential and economical oleaginous crops grown in tropical and subtropical regions of the world, mainly because of its oil, protein, and carbohydrates [1]. Peanut seeds contain oil (45%), protein (26–28%), carbohydrates (20%), and fiber content (5%) [2], indicating their high nutritional value for both humans and animals. Peanuts have recently gained significant attention in Egypt, as they are able to grow under newly reclaimed sandy soil conditions [3]. The area under peanut cultivation in Egypt during 2019 was approximately 66,000 ha, with a total production of 231,223 tons [4].
A vast amount of chemical nutrients, approximately 50% of N and 90% of P, escape into the atmosphere or drainage sources, causing greenhouse gas production, eutrophication in aquatic environments, and soil salinization [5,6]. The use of biofertilizers has become a positive alternative to chemical fertilizers, especially nitrogenous and phosphorus fertilizers [7], due to eliminating elevated levels of pollutants in our environment [8,9] and improving soil productivity and plant growth by enhancing the biological activity of the targeted microorganisms in the rhizosphere [8,10]. Due to limitations in phosphorous resources and the high cost of phosphorous production, mechanisms of plant adaptation such as bacteria (Bacillus megaterium) and fungi (Arbuscular mycorrhizae) may be promising methods for implementing natural and attainable management practices in agriculture [11]. Mycorrhiza is one of the most efficient biofertilizers in terms of microbial symbioses to improve the growth and yield of most plant species [12,13]. It has a prominent role in improving plant physiology and regulating the supply of different nutrients and their translocation [14,15]. Furthermore, mycorrhiza can, especially in the case of deficit phosphorus, affect the growth of the plant population, nutrient intake, water relations, and above-ground mass production [8].
Nanoparticles (NPs) have emerged as promising alternative smart fertilizers to ensure high crop production and soil restoration [16,17]. Relative to conventional micronutrients, NPs are increasingly being evaluated as fertilizers for quantitative and qualitative crop improvement [18]. NPs are more reactive than their conventional counterparts, with potential for both beneficial and inhibitory outcomes for plants. The heightened reactivity associated with nano-scale materials is due to their greater surface area than bulk materials [19]. One of the essential characteristics of NPs is their capacity to penetrate plants whether used as a foliar spray or soil additives [20].
Peanut plants require calcium (Ca) from the time pegs develop, through fruit formation, until the maturity of the pods [21]. Ca deficiency produces a high percentage of aborted seeds (empty pods) and inadequately filled pods, resulting in a massive decrease in shelling percentages and yields [22,23]. Peanuts reproduce via geocarpy [24]. However, the Ca2+ nutrition of peanuts is complicated by the geocarpic nature of the plant and the immobility of Ca2+ in the phloem, which restricts the redistribution of Ca2+ from older to younger tissues within the plant via the phloem [25,26]. In light of this problem related to conventional Ca2+ application, the nano-sized Ca particles could be more effective in providing Ca nutrition to peanuts. Similarly, boron (B) plays an important role in the physiological process of plants, such as cell elongation, cell maturation, meristematic tissue development, and protein synthesis [27]. The requirement for B application in peanut cultivation is, therefore, to promote crop growth and development while also increasing crop output. The administration of B also enhances peanuts’ N absorption and increases plant height, dry weight, and the total number of pods [28]. B deficiency is a common nutritional issue in agriculture, resulting in yield reductions and poor crop quality [29]. Thus, the optimal fertilizer combination is the primary concern for maximum peanut output.
As a result, to produce a long-term yield, the availability of mineral nutrients is critical for improving oilseed crop output and quality [30,31]. Considering the importance of biofertilizers and NPs, this research was conducted to investigate the individual and combined effects of seed inoculation with biofertilizers (mycorrhizae and phosphorine) and the exogenous application of nanoparticles (B and Ca) on the growth metrics, seed production, yield components, and quality of peanuts grown in the sandy soil.

2. Materials and Methods

A two-year field experiment was conducted at a farm in Hosh Isa district, El-Beheira Governorate, Egypt (27°12′16.7″ N 31°09′36.9″ E). Peanut seeds (Cv. Giza 6) were planted on 28 and 20 May in 2020 and 2021, respectively. The initial physicochemical properties of the soil were determined during both seasons [32] (Table S1). Soil samples were collected from each plot at two depths (i.e., 0–25 cm and 25–40 cm) using a 2.5 cm diameter spiral auger. Three sub-samples from each plot were taken to make a composite sample per plot. The samples were transported to the laboratory, oven-dried at 40 °C, and crushed to pass through a 2 mm sieve, and then ground to <60 µm to determine the soil organic carbon content (%), N, P-available (mg·kg−1), and K-exchangeable (cmol kg−1) [33]. Furthermore, E.C. (dS m−1) and soil pH were estimated through standard procedures [32].

2.1. Experimental Design

This experiment was laid out under a split-plot design using a randomized complete block design with three replications. Biofertilizer treatments were assigned to the main plots, whereas the nanoparticle applications were assigned to the subplots. Each subplot in the experiment was 3.5 m long and 3 m wide (10.5 m2, i.e., 1/400 Feddan), and the subplots were separated by a distance of 1 m (buffering zone). The peanut seeds were planted at a spacing of (30 × 50) cm (68 plants in each plot) under a drip irrigation system.

2.2. Biofertilizer Treatments

The biofertilizer treatments consisted of three regimes, i.e., untreated seeds (control), phosphorine, and mycorrhiza. The mycorrhiza, arbuscular mycorrhizal fungi, were prepared as a mycorrhizal spores suspension by mixing each of Glomus mosseae, Glomus fusciulatum, and Glomus clarum and were multiplied in pot cultures with onion and maize grown for 4 months in 1:1:1 (v:v:v) vermiculite: perlite: peat according to Badr El-Din et al. [34]. Mycorrhizal inoculums consisted of coarsely chopped root fragments, spores, hyphae, and growth media. Mycorrhiza was obtained from the Plant Pathology Research Institute, Agricultural Research Center, Ministry of Agriculture and Land Reclamation.
For phosphate dissolving bacteria (PDB), Bacillus megatherium var. phosphaticum, commercially named phosphorine, was used. A five-day-old culture of Bacillus on nutrient broth medium containing 108 cell ml−1 was used for seed inoculation. Phosphorine is commercially produced by the General Organization for Agricultural Equalization fund (GOAFE), Ministry of Agriculture, Giza, Egypt. The inoculation with both mycorrhiza and phosphorine was performed by coating peanut seeds with each product individually using a sticking substance (5% Arabic gum) just before sowing.

2.3. Nanoparticle Treatments

The nanoparticles used in this study included three regimes, i.e., 200 ppm nano-Ca, 200 ppm nano-B, and their combination (Ca+B). Each of the three nanoparticle treatments was applied as two foliar sprays at the vegetative stage (30 and 60 days after sowing). Nano-B and nano-Ca were obtained from NanoFab Technology, Giza, Egypt. According to the manufacturer, the following methodology was followed to prepare these NPs.
For nano-B, boric acid was chemically reduced in one step to boron in the presence of ammonia in a basic medium (>7 pH) under vigorous stirring. The as-formed gel/precipitate was dried at 100 °C for 30 min, annealed at 550 °C for 2 h, and stored under room conditions. The TEM images (Figure S1) were obtained using high-resolution transmission electron microscopy (HR-TEM, JEOL 2011, Akishima, Japan) at an accelerating voltage of 200 kV. The average size of the nano-B was 60 nm.
For nano-Ca, the heterogeneous phase precipitation of Ca(OH)2 occurred following hydration of CaO (quicklime), a process known as “lime slaking”. The addition of a stoichiometric amount of water resulted in the formation of a dry powder made up of Ca(OH)2 crystals. Next, CaO NPs were obtained upon the calcination of as-prepared Ca(OH)2 under ambient conditions of 650 °C for 3 h [35]. The average size of the nano-Ca was 45 nm (Figure S2). The other physical properties of nano-B and nano-Ca are shown in Tables S2 and S3, respectively.

2.4. Data Recorded

2.4.1. Seed N, P, K, Oil, and Protein Contents

At harvest, leaf samples were taken from each treatment, and the N, P, and K percentages were determined in the dry leaves; drying was performed in a drying chamber at 75 °C for 72 h. Then, the dried leave samples were milled and stored for further analysis. A weight of 0.5 g of the seed powder was wet-digested with an H2SO4–H2O2 mixture [36]. Total nitrogen was determined in digested plant material calorimetrically by Nessler‘s method [37]. The reading was recorded at a wavelength of 420 nm, and N was determined using Equation (1) as follows:
%   N   =   NH 4   %   ×   0.78
Seed phosphorus was determined using JENWAY 6305 UV/Visible Spectrophotometer at 643 nm (OD643) by the colorimeter method (ammonium molybdate) [38]. Potassium contents in seeds were determined using a flame photometer (BWB Model BWB-XP, 5 Channel) as described by Motsara and Roy [38].
The protein content in the peanut seeds was calculated using Equation (2) [39] as follows:
Total   protein   =   N   content   % × 6.25
The seed oil content was determined using the Soxhlet method [40].

2.4.2. Growth Attributes

Five plants were randomly taken from each plot to determine the following measures: branching number (BN), plant height (PH), dry weight (DW), crop growth rate (CGR), and chlorophyll content (Ch). Plant height (cm) was measured from ground level to the tip of the last fully opened leaf at harvest.
Crop growth rate (CGR) (g day−1 m−2) was calculated according to the formula suggested by Brown [41], which is shown in Equation (3) as follows:
CGR   = W 2 W 1 / SA   T 2 T 1
where W1 and W2 are plant dry weights at a time on T1 and at time T2 during corresponding days; SA = the soil area occupied by the plant at each sampling.
The branching number was obtained by counting the number of primary branches.
Chlorophyll contents from fully developed leaves were determined using a mobile chlorophyll meter (SPAD-502-m Konica Minolta, Inc., Tokyo, Japan). The performance of the chlorophyll meter was calibrated according to the manufacturer’s instructions before taking the readings.

2.4.3. Yield and Its Components

At maturity, the yield was recorded, which included the shelling percentage (%), number of pods/plant (NPP), 100-seed weight (HSW, g), biological yield (BY, ton/ha), and seed yield (SY, ton/ha). All the yield component observations were taken by mean values of five randomly selected plants during harvesting (except seed and biological yields).
The shelling percentage was determined as the total weight of groundnut seed (Ws) divided by the total weight of pods (Wp) [42] (Equation (4)):
Shelling   percentage   % =   Ws / Wp   × 100
where Ws = weight of groundnut seed, and Wp = weight of groundnut pods.
The number of pods/plants was obtained by counting the number of pods at harvest. The weight of 100-seeds (HSW, g) was obtained by the average weight of 100 seeds. The plots were harvested entirely by hand to determine the total above-ground biological yield. For the same harvested plots, pods were separated and then air-dried to calculate their seed yield/plot, which was then converted to hectares.

2.5. Data Analysis

The analysis of variance (ANOVA) for all studied traits was performed using the general linear model (GLM) procedure of the SAS 9.2 software for Windows [43]. Data were statistically analyzed using Fisher’s least significant difference (LSD) test at a 5% level of significance. Boxplots were drawn to show the variation in the application of foliar spraying and biofertilizer. Pearson correlation coefficients were used to access the associations among growth, yield, and seed biochemical composition parameters. Hierarchical clustering analysis was conducted to reveal the interrelationship of the studied traits with fertilization treatments. In R project (version 3.4.5), the ggplot2 package was used to draw the boxplots.

3. Results

3.1. Response of Peanuts to Individual Applications of Fertilization

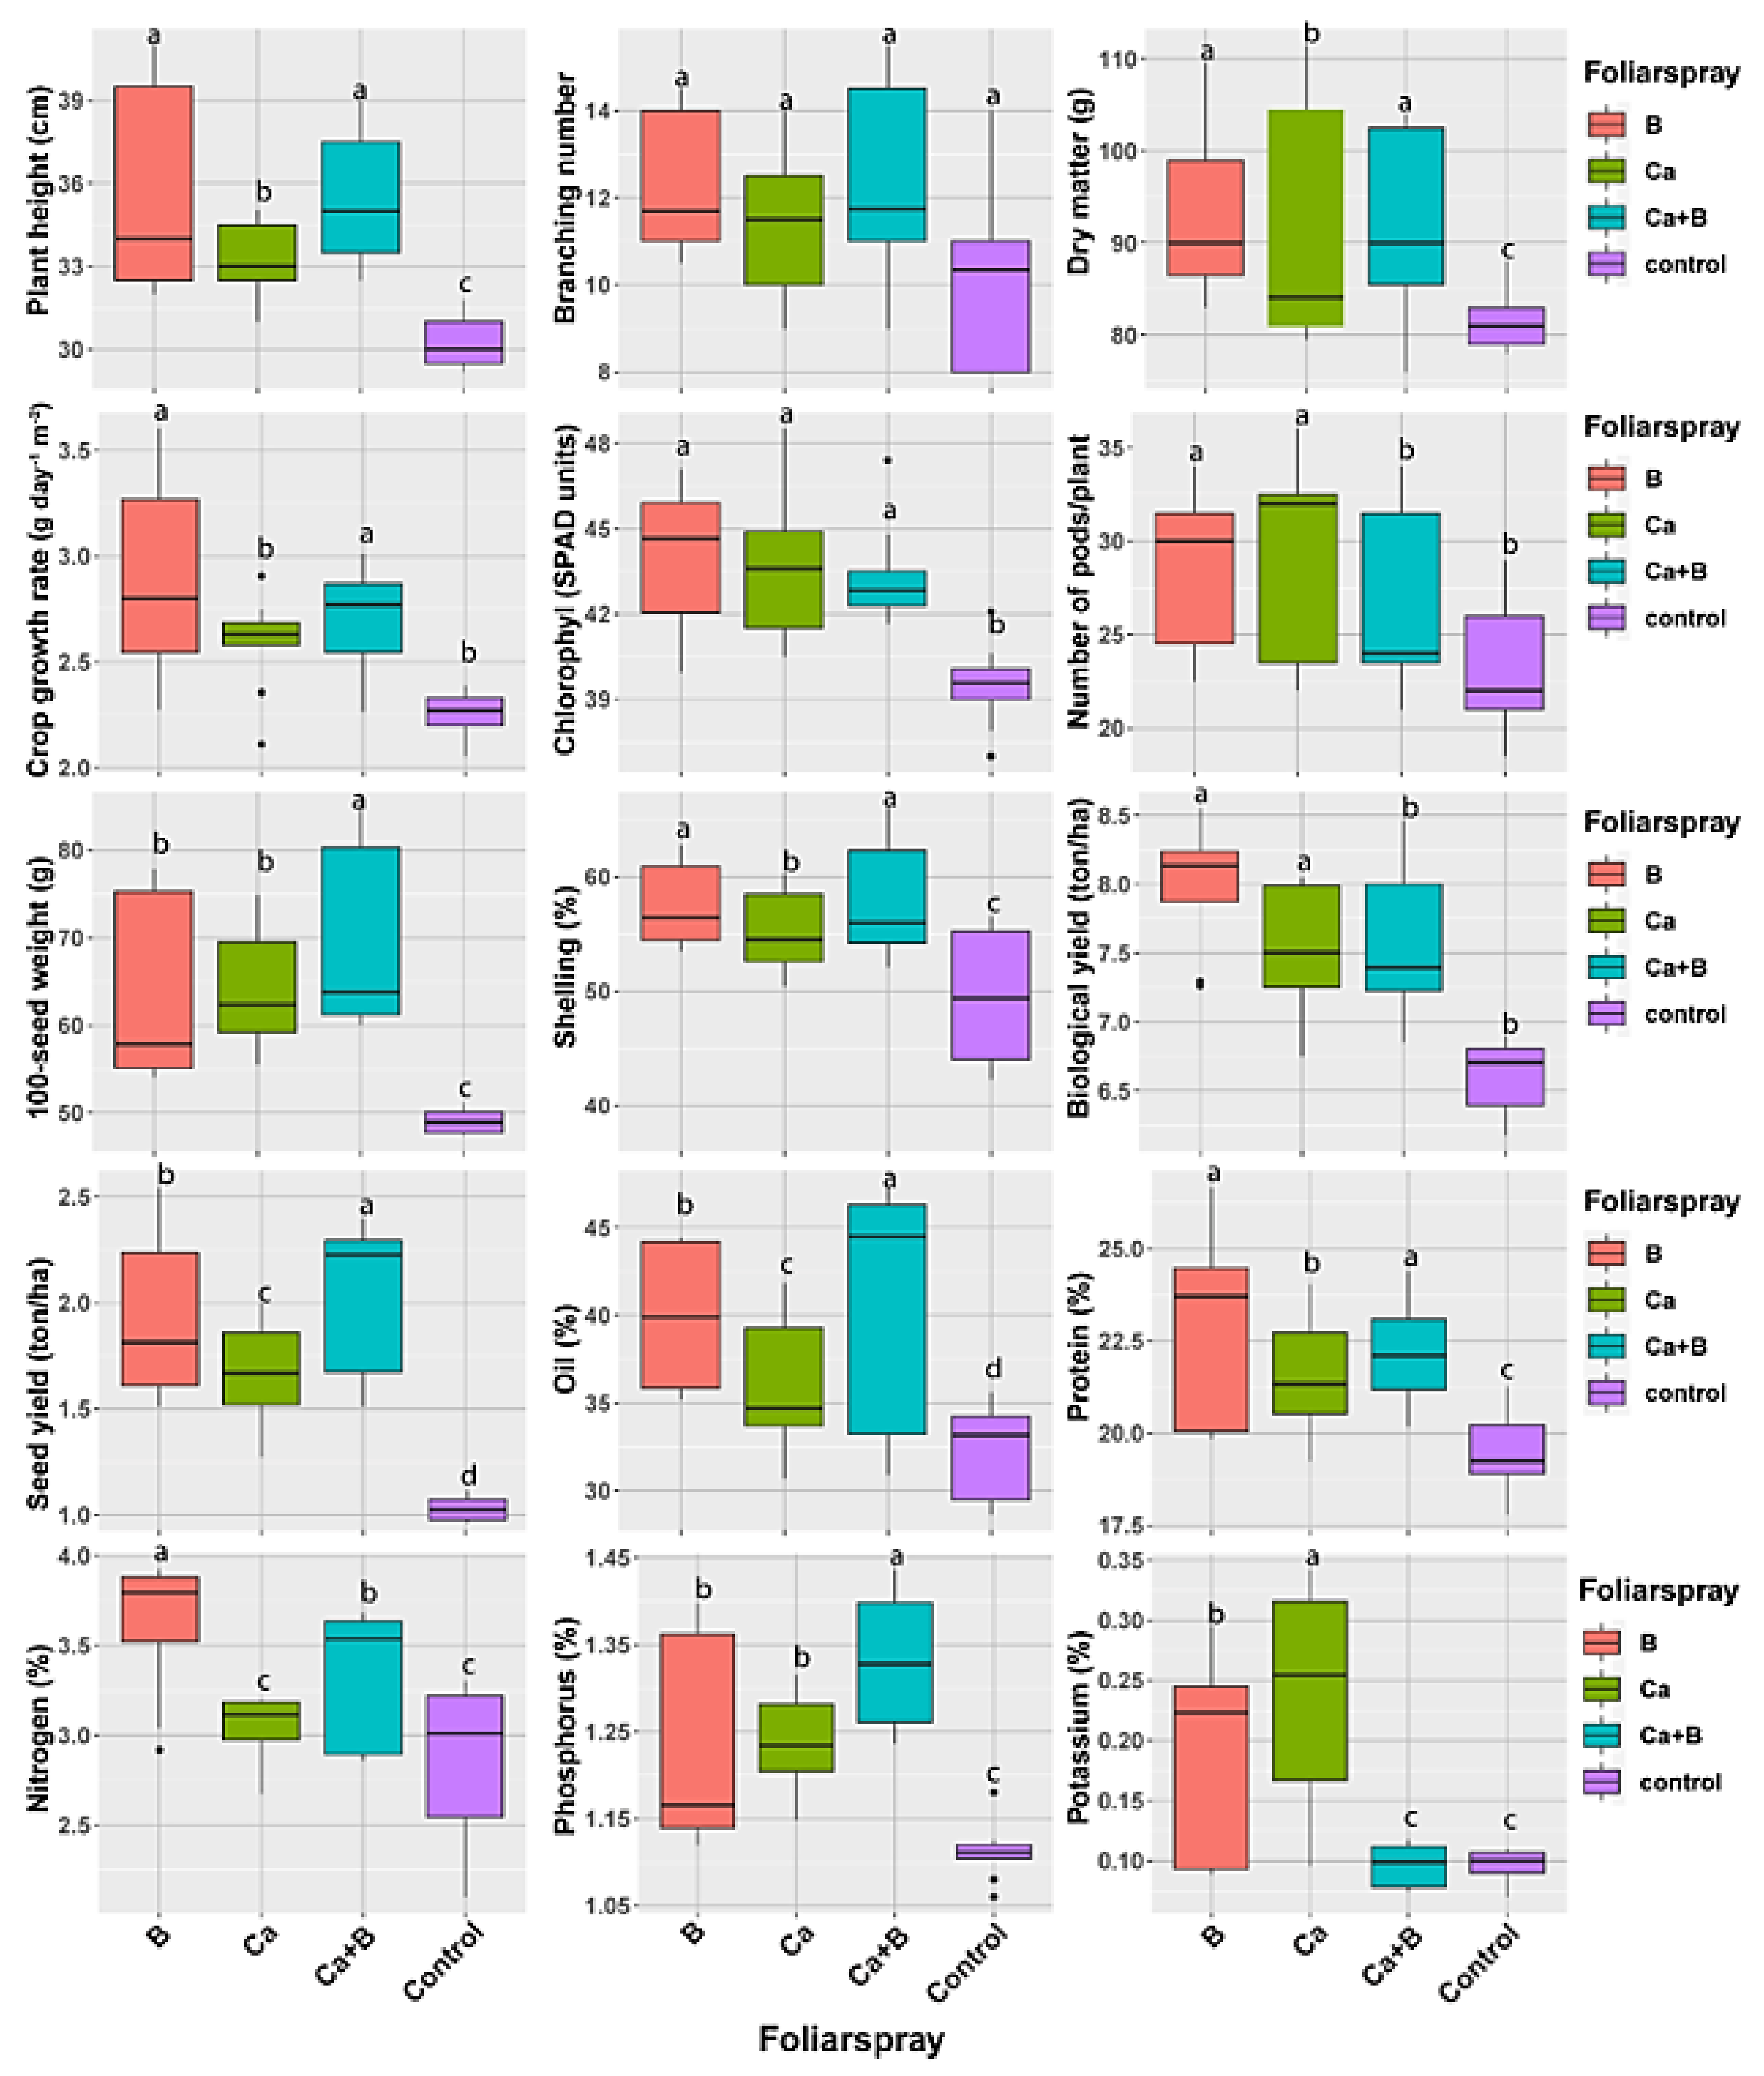
3.1.1. Effect of Biofertilizers on Different Studied Traits

Analysis of variance (ANOVA) for the effect of biofertilizer was shown in Table 1. The results showed that the application of biofertilizer significantly affected (p ≤ 0.001) 100-seed weight (HSW), biological yield (BY), and seed yield (SY), branching number (BN), dry weight (DW), plant height (PH), crop growth rate (CGR), phosphorous, potassium, protein content, and oil content in the two seasons of the study. The application of biofertilizer showed a highly significant effect (p ≤ 0.01) on the nitrogen content in the first season only, while NPP was significantly affected (p ≤ 0.01) by biofertilizers only in the first season.
The performance of biofertilizers on yield, growth, and seed biochemical traits is presented in Figure 1. The application of mycorrhiza recorded the highest value of 100-seed weight (70.5 g), biological yield (7.9 ton/ha), seed yield (1.9 ton/ha), shelling (60.2%), number of pod/plant (30 pods), dry weight (100.2 g), crop growth rate (2.81 g day−1 m−2), oil content (41.5%), protein content (23%), and phosphorus (1.3%). The results also showed that a non-significant difference was observed between mycorrhiza and phosphorine on branching number, plant height, chlorophyll, and nitrogen content, whereas there was no significant difference in potassium content revealed between the control and mycorrhiza treatments.

3.1.2. Effect of Nanoparticles on Different Studied Traits

ANOVA for the effect of nanoparticles was shown in Table 1. The results indicated that the application of nanoparticles significantly affected (p ≤ 0.001) HSW, BY, and SY, BN, DW, PH, CGR, phosphorous, potassium, protein content, and oil content in the two seasons of the study. The application of nanoparticles also had a highly significant effect (p ≤ 0.01) on nitrogen content in the first season only, while chlorophyll was significantly affected (p ≤ 0.01) in the second season only. The low (p 0.05) or high (p ≤ 0.001) significant variations of number of pods, biological yield, and nitrogen between seasons (2020 and 2021) were probably correlated with the climate particularities of each season. The performance of nanoparticles on yield, growth, and seed biochemical traits is presented in Figure 2. These results indicated that the application of nano-B followed by nano-Ca+B exhibited the highest significant values of PH (35.4 and 35.3 cm, respectively), DW (92.9 and 91.6 g, respectively), CGR (2.9 and 2.1 g day−1 m−2, respectively), Sh (57 and 57.6%, respectively), SY (1.9 and 2.1 ton/ha, respectively), and protein content (23.1 and 22.2%, respectively), compared to individual applications of nano-Ca and the control. The application of nano-Ca+B recorded the highest HSW (68.7 g), oil content (41.3%), phosphorus (1.3%), and protein content (24.59%), while application of nano-Ca indicated the lowest value of PH (31.9%) and nitrogen (3.18%). Moreover, the highest and most significant levels of BY (8.2 and 7.6 ton/ha) were obtained by the application of nano-B and nano-Ca, whereas the highest nitrogen content was recorded by the application of nano-B.

3.2. Response of Peanuts to Interaction between Nanoparticle and Biofertilizer Treatments

3.2.1. Yield and Yield Component Traits

ANOVA for the effect of the interaction between biofertilizer and nanoparticle treatments was shown in Table 1. The results of ANOVA showed that the interaction between biofertilizer and nanoparticle treatments had a highly significant effect (p ≤ 0.01) on all yields and yield component traits in both seasons of the study.
The response of yields and yield component traits to the interaction between biofertilizers and nanoparticles is shown in Table 2. The application of mycorrhiza with nano-B recorded the highest NPP (38.7) in the first season, while in the second season, phosphorine with nano-Ca indicated the highest NPP (34). The lowest NPP (22.3) was obtained from the control treatment in the 2020 season, while the application of phosphorine without applying any nanoparticles indicated the lowest NPP (19) in the 2021 season. The application of mycorrhiza and the nano-Ca+B combination resulted in the highest value of both Sh percentage (63.4 and 64.4%) and HSW (82.2 and 83.5 g) in the two seasons of the study, respectively. In contrast, the lowest values of Sh (46.3 and 44.7%) were recorded by the application of only the individual phosphorine treatment in the first season and the individual mycorrhiza treatment in the second season, whereas the lowest levels of HSW (36.7 and 39.8 g) were obtained from the control treatment in both seasons. For SY, the highest value (2.4 ton/ha) was obtained in both seasons when the mycorrhiza inoculation along with each nano-B and a combination of nano-Ca+B were applied. Moreover, peanut plants inoculated with phosphorine with the nano-Ca+B combination recorded the highest value of SY in the second season. For BY, the highest value (8.9 ton/ha) was recorded by the application of mycorrhiza with a combination of nano-Ca+B in the first season, while mycorrhiza and nano-B exhibited the highest BY (8.1 ton/ha) in the second season. The lowest BY (6.3 and 6.4 ton/ha) in both seasons was obtained by the application of phosphorine without nanoparticle treatment (control).

3.2.2. Growth Parameters

The findings showed that the interaction between biofertilizer and nanoparticle treatments had a highly significant effect (p ≤ 0.01) on all growth parameters in both seasons of the study, except for chlorophyll, which exhibited non-significant differences in both seasons of the study (Table 1). The performance of growth parameters under different treatments was presented in Table 3. The highest value of BN (13) was recorded by the application of mycorrhiza with nano-B in the first season, while in the second season, mycorrhiza with a combination of nano-Ca+B exhibited the highest BN value of 17.3. The highest PH values (40.3 and 40 cm) were observed under mycorrhiza inoculation with nano-B in the two seasons, respectively. The inoculation of peanut seeds with mycorrhiza and foliar spraying with nano-Ca resulted in the highest plant DW of 124 g in the first season, while the highest DW (99.7 g) in the second season was recorded by the application of mycorrhiza and nano-B. For CGR, the application of mycorrhiza combined with nano-B resulted in the highest growth rate of 3.4 day−1 m−2 in the two seasons of the study. Chlorophyll content showed its highest values (46.8 and 50.4) by inoculating peanut seeds with mycorrhiza and foliar spraying with nano-B in the first and second seasons, respectively.

3.2.3. Biochemical Composition (NPK, Protein, and Oil)

The findings showed that the interaction between biofertilizer and nanoparticle treatments had a highly significant effect (p ≤ 0.01) on all seed biochemical traits in both seasons of the study, except for nitrogen content, which exhibited significant difference (p ≤ 0.05) in the first season and a non-significant difference in the second season (Table 1).
The difference in the performance of peanut seed biochemical composition under various regimes of biofertilizers combined with different nanoparticles is shown in Table 4. The combination of nano-B and mycorrhiza resulted in the highest nitrogen content (3.9%) and phosphorus content (1.4%) in both seasons of the study. Regarding potassium content, the highest values were recorded by the application of two combinations exhibiting the highest level of K (0.3%) in the first season, including mycorrhiza with nano-Ca and phosphorine with nano-Ca, while the highest K content (0.4%) in the second season was obtained by the application of mycorrhiza with nano-B. Seed inoculation with phosphorine combined with foliar spraying of nano-Ca+B recorded the highest oil content (45.6%) in the first season, while treating plants with mycorrhiza and foliar spraying with nano-B recorded the highest oil content (48.9%) in the second season. In the case of protein content, the highest levels (25.1 and 25.2%) were obtained by treating plants with mycorrhiza with nano-B in the first and second seasons, respectively.

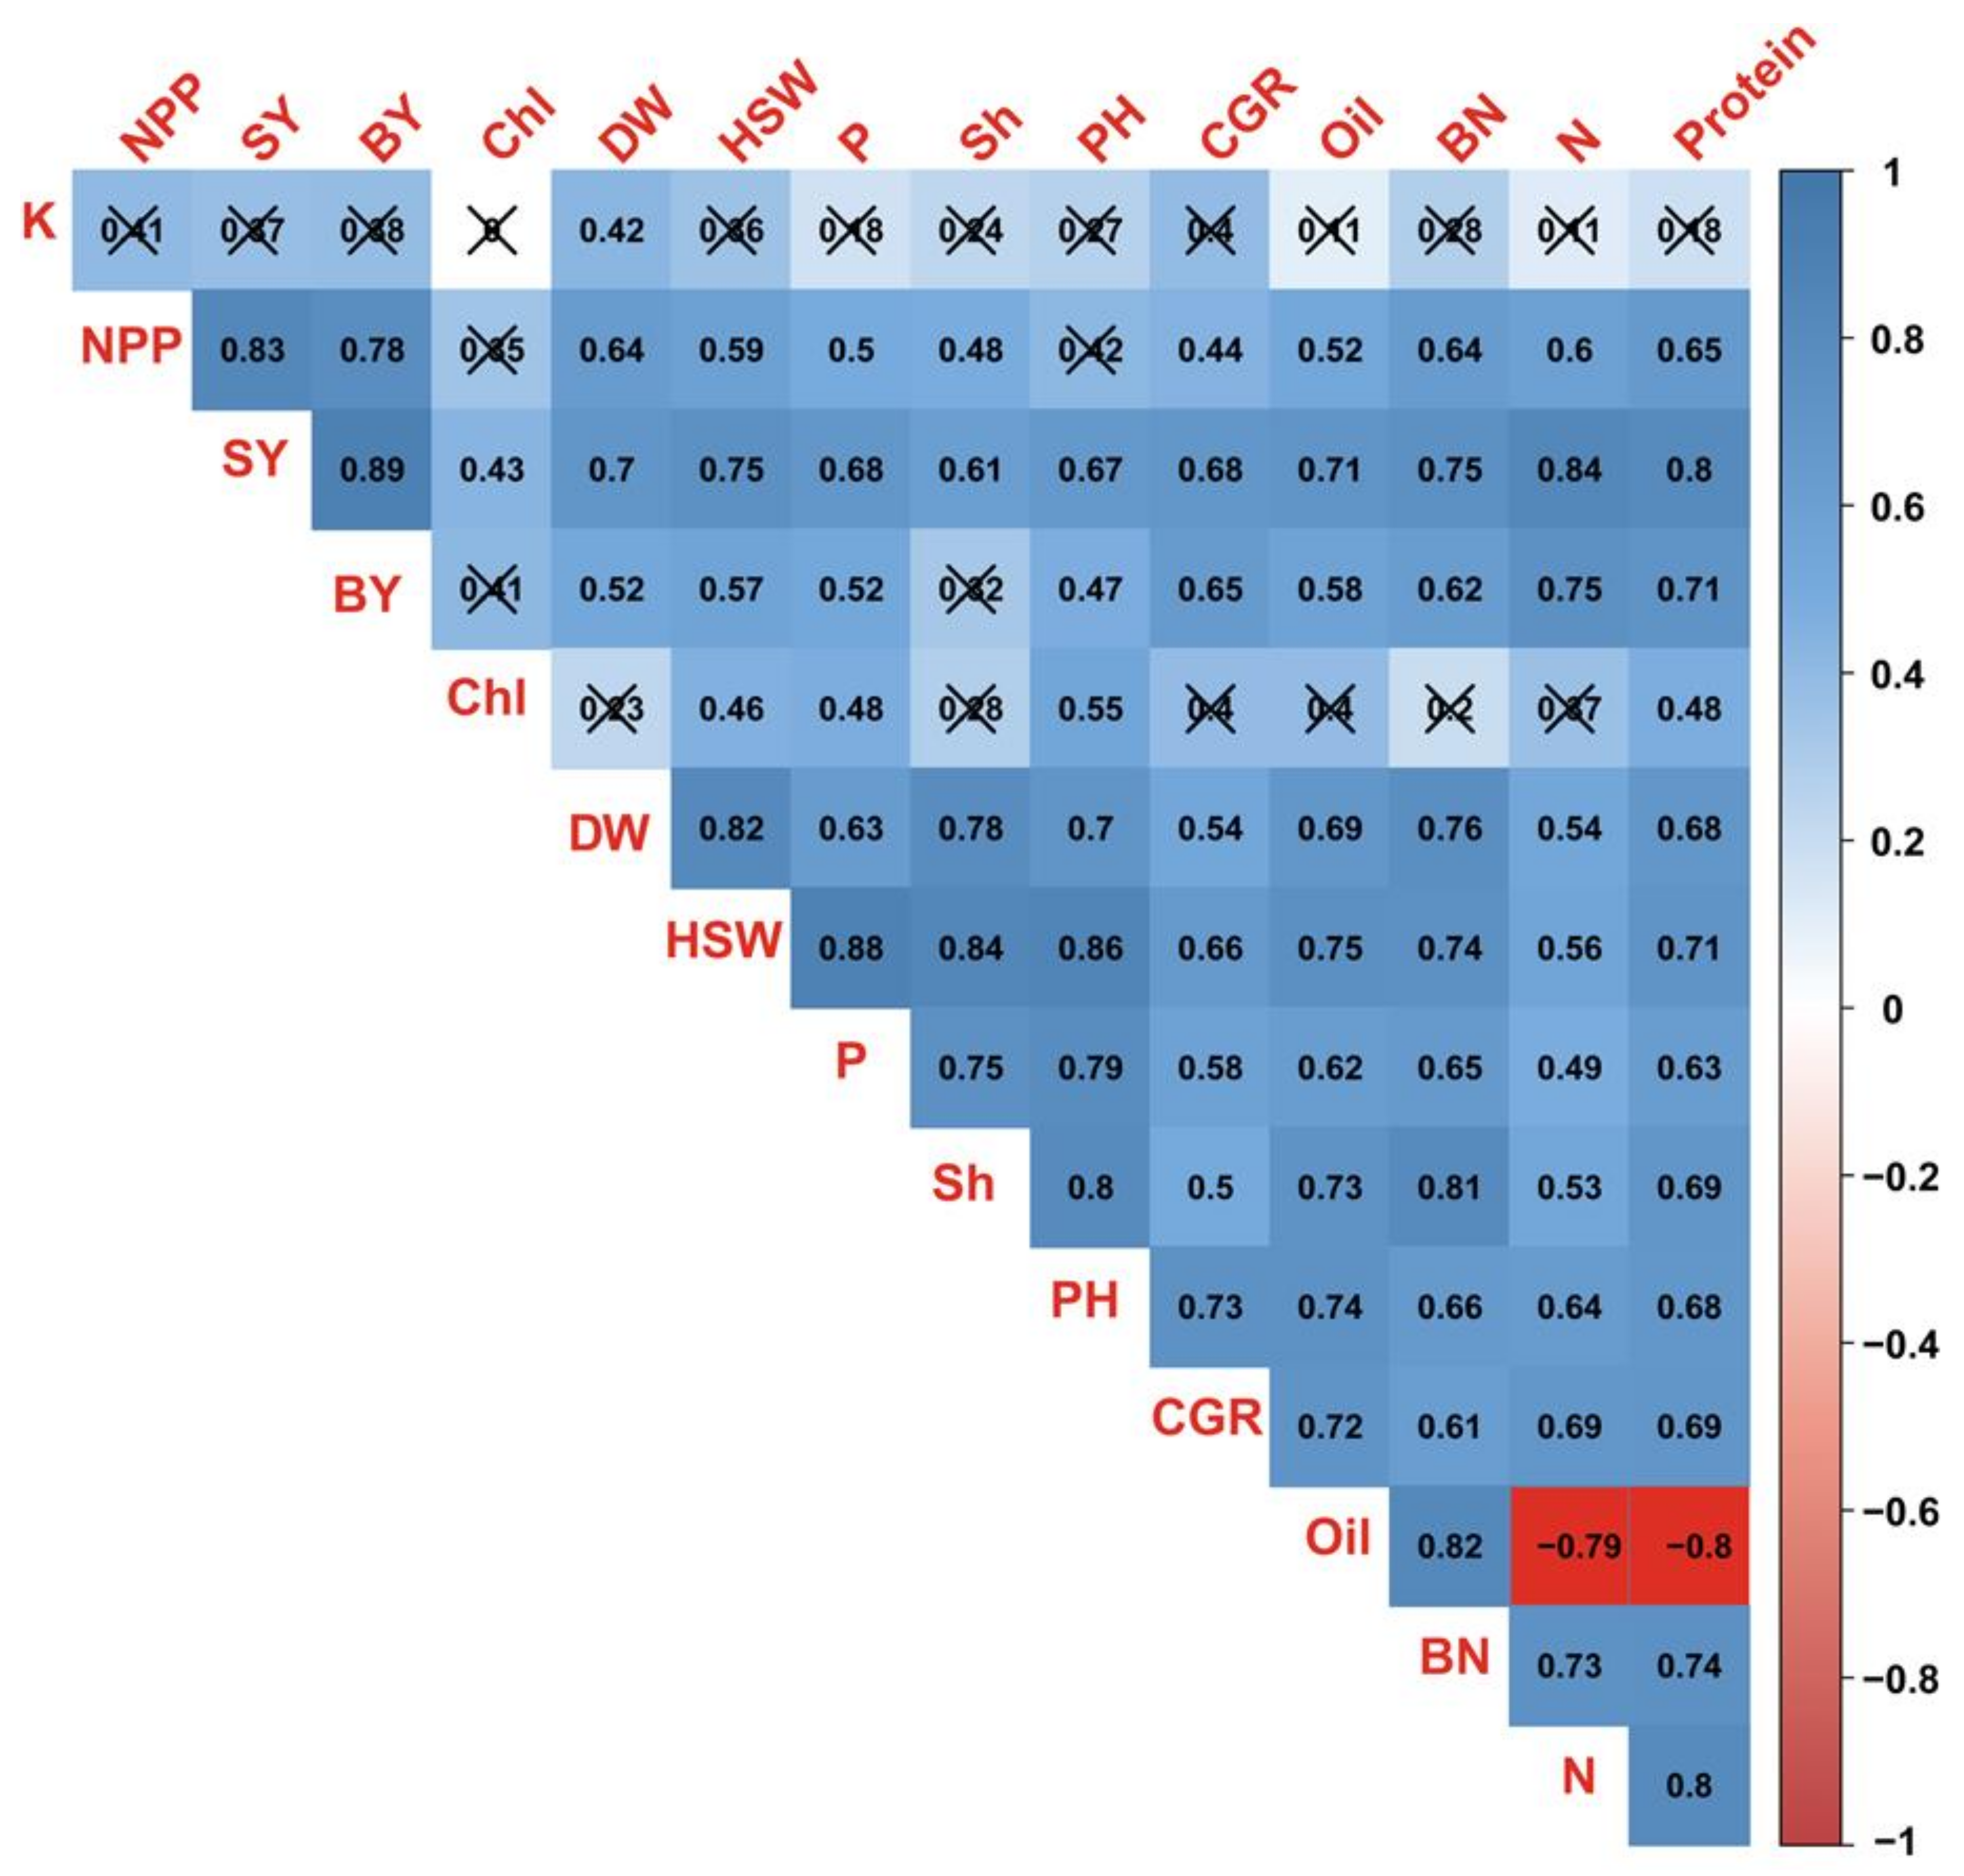
3.3. Correlation between Studied Traits

Correlation analysis among all 15 studied traits showed that significant positive correlations were exhibited (Figure 3). Amongst the yield trait pairs, the correlations between SY and BY (0.89), HSW and Sh (0.84), SY and NPP (0.83), and BY and NPP (0.78) were the highest, while the lowest correlation was observed between BY and Sh (0.32). Also, correlations among the seed biochemical traits were significantly positive, except for the correlation of protein content with oil content (−0.81) and nitrogen (−0.79), whereas other pairs of traits showed non-significant correlations, including K with protein, oil, nitrogen, and phosphorus (Figure 3). Among the growth traits, the correlation between DW and BN (0.76), followed by CGR and PH (0.73), and DW and PH (0.70) showed the highest significant positive coefficients, while other trait pairs showed non-significant correlation coefficients, including Ch with BN and Ch with CGR (Figure 3).
Regarding the correlation among different types of traits, including yield, growth, and seed biochemical parameters, highly significant positive correlations were exhibited between P and HSW (0.89), PH and HSW (0.86), N and SW (0.84), DW and HSW (0.82), and BN and oil (0.82) (Figure 3). Negative correlations were detected between protein and oil contents (−0.8) and N and oil contents (−0.79) (Figure 3).

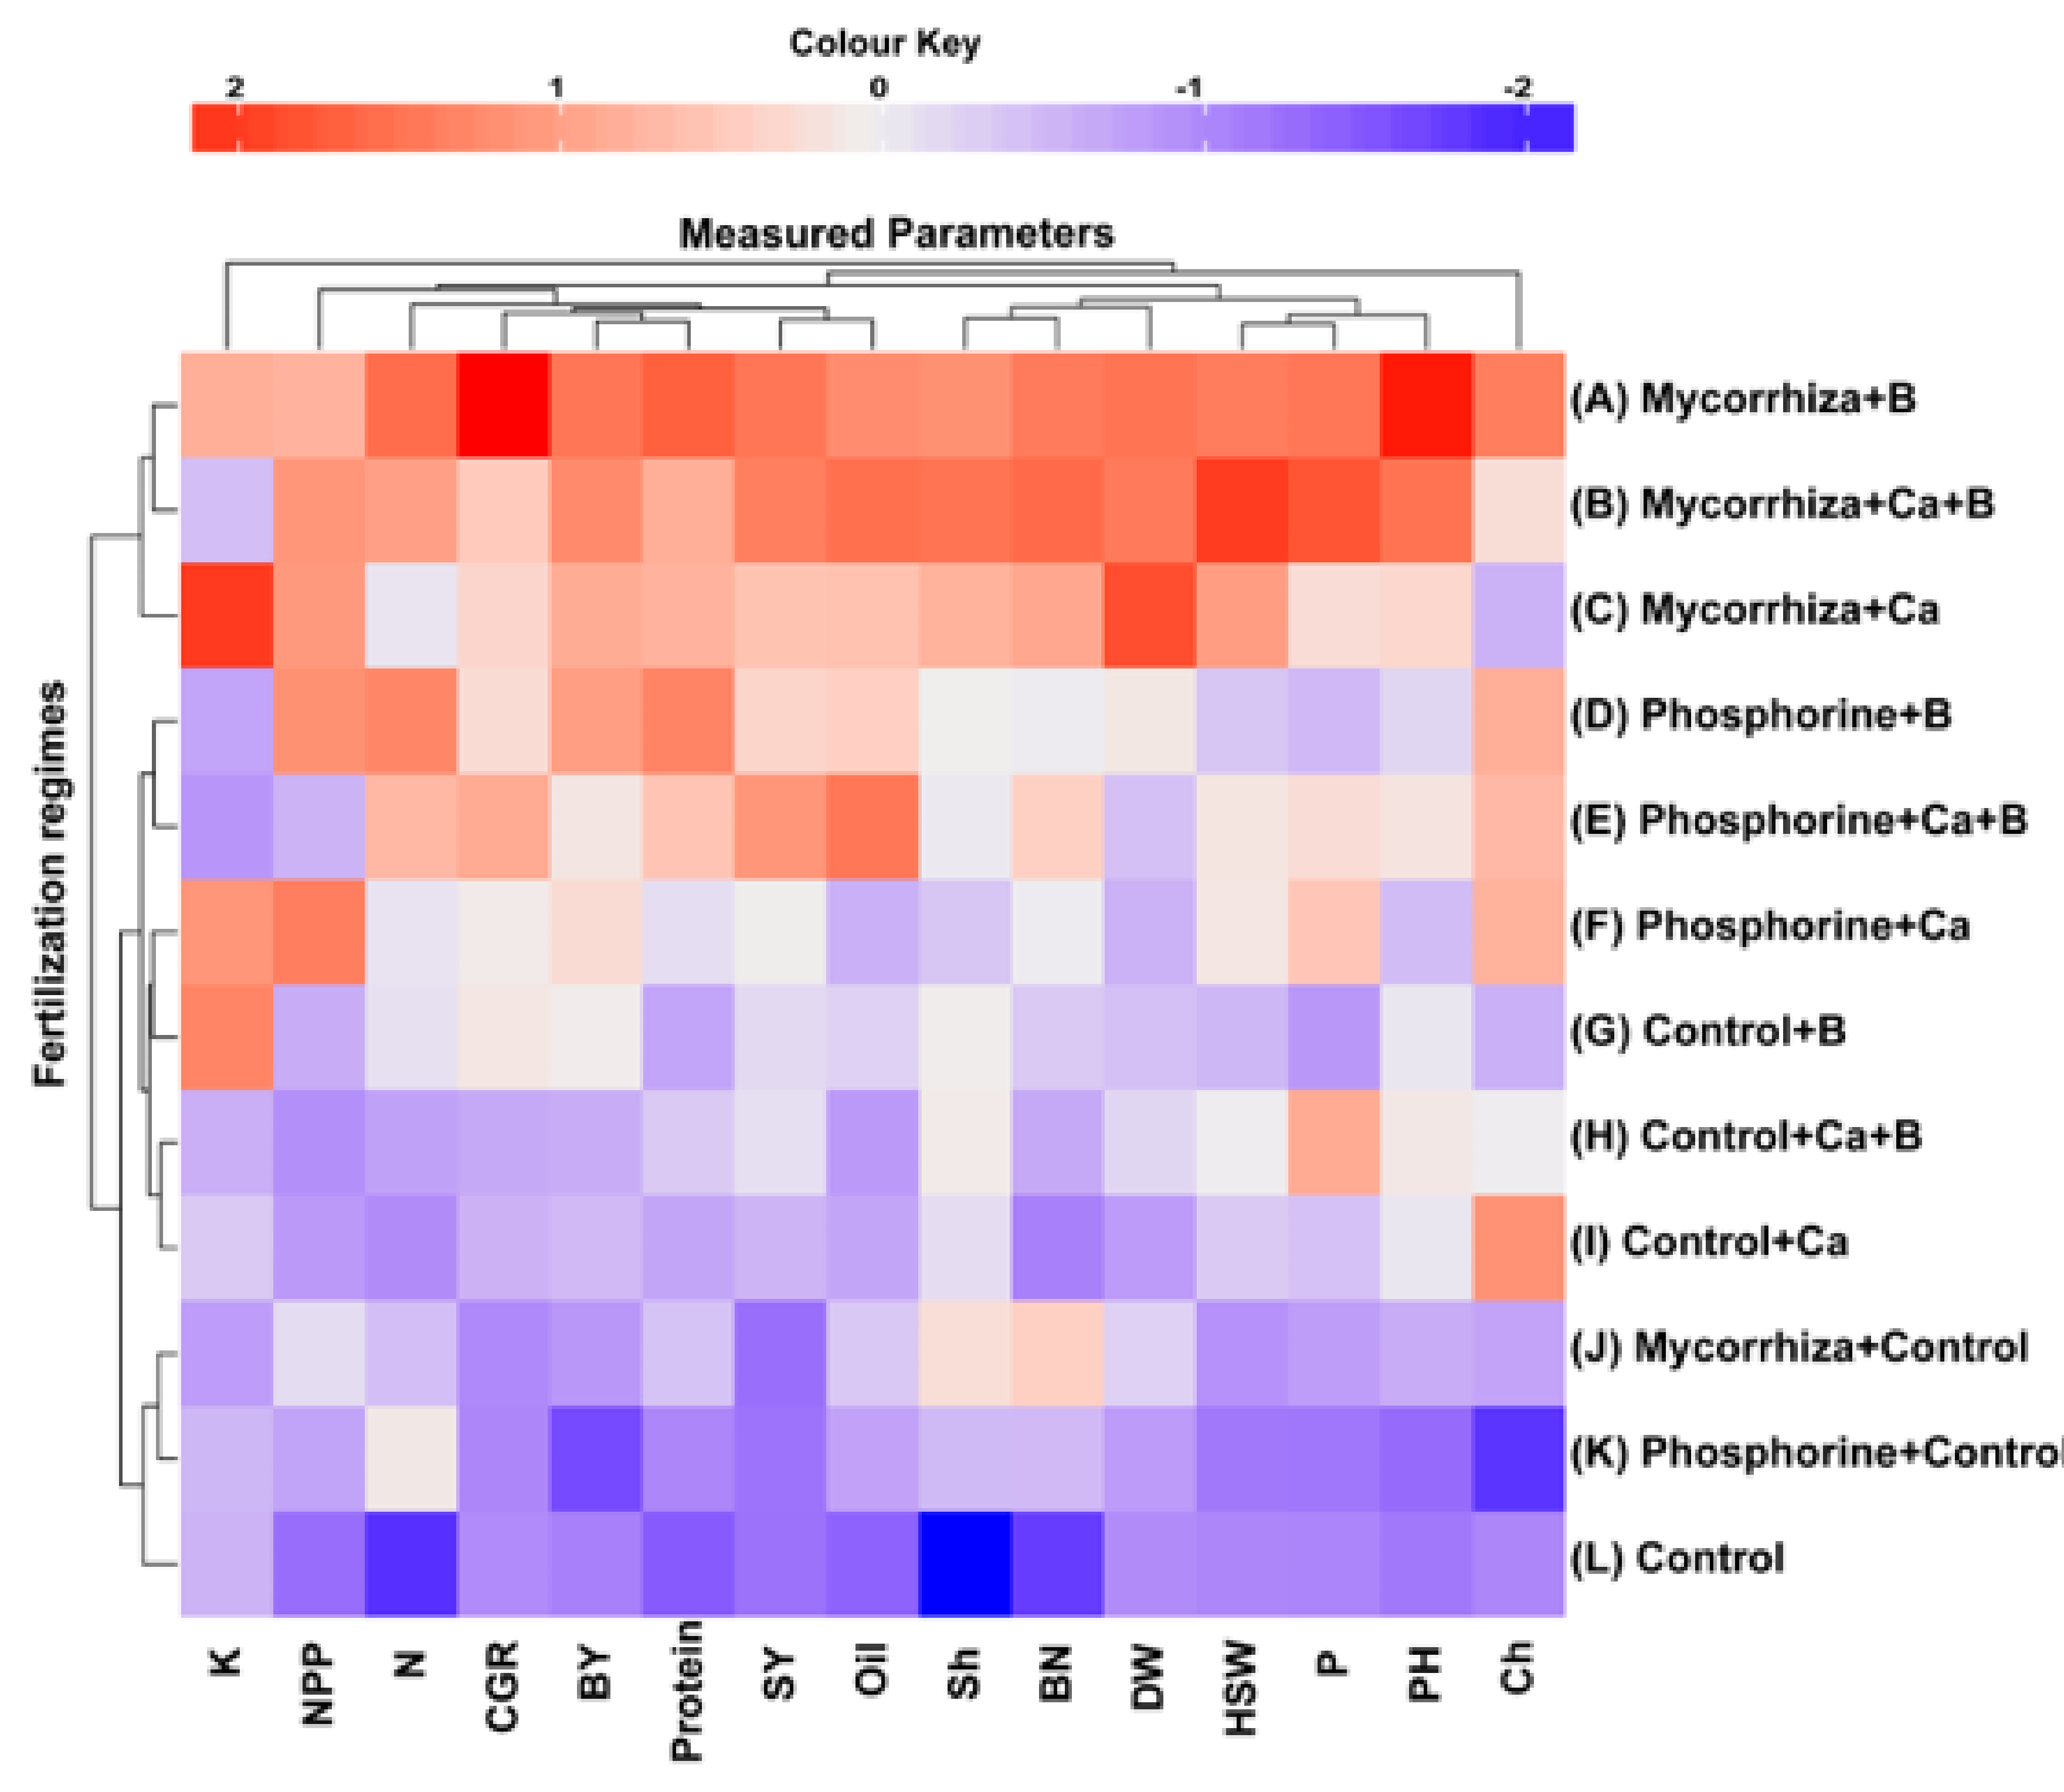
3.4. Interrelationship between Combinations of Foliar Spraying Treatments and Biofertilizers

The hierarchical clustering clearly distinguished the interrelationship between combinations of foliar spraying treatments and biofertilizers (12 combinations) according to their performance of yield, growth, and biochemical parameters (Figure 4). Regarding the relationship between both fertilization treatments, three main clusters were characterized. The first cluster was formed by the combination treatments of A (michorriza+B), B (michorriza+Ca+B), and C (michorriza+Ca), whereas treatments A and B were the closest sub-clusters. Within this group, fertilization treatment A gave the highest values for all measured parameters, especially plant height and crop growth rate. For treatment B, the majority of traits, except for potassium content, expressed high performance, especially 100-seed weight, which showed the highest positive response, indicating the best parameters under such fertilization application. In contrast, fertilization treatment C showed the highest positive effects on potassium content followed by dry weight, while chlorophyll content was negatively affected by this treatment. The second cluster included treatment J (michorriza+control), K (phosphorine+control), and L (control), whereas treatments J and K were the closest sub-clusters. Overall, the combinations of fertilization treatments in the second cluster (including L, K, and L sub-clusters) showed an opposite pattern to the treatment combinations of the first cluster, as all studied traits were negatively affected, showing lower overall performance, especially for the control treatment, which indicated the lowest value for all measured parameters.
In respect to the third cluster, six treatment combinations were clustered together and were further separated into three sub-clusters: the first sub-cluster included treatments D (phosphorine+B) and E (phosphorine+Ca+B), the second sub-clustered included F (phosphorine+Ca) and G (control+B), whereas the third sub-cluster grouped the treatments H (control+Ca+B) and I (control+Ca). The overall performance of the third cluster showed a discrepant effect on all measured traits, as a majority of the traits were positively affected by treatments D and E (first sub-cluster), while treatments F, G, H, and I negatively affected a majority of the studied traits except for potassium content in treatment F and G, a number of pods/plant in treatment G, chlorophyll content in treatment H, and phosphorous content in treatment I. Collectively, the application of treatment G resulted in the highest chlorophyll content, whereas treating peanuts with treatments H and I resulted in a higher response of potassium and the number of pods/plant, respectively.

4. Discussion

Groundnut productivity depends on the proper selection of variety and fertilizer management. Biofertilizers may play an essential role in enhancing crop productivity and maintaining soil fertility in the long term while reducing the environmental burden associated with fertilizer production and nutrients leaching into groundwater deposits [44]. In addition, the microorganisms usually included in the biofertilizers might interact with the plants and boost their immunity, growth, and development, which consequently increase crop production [45,46,47]. The inoculation of peanut plants with mycorrhiza in the current study significantly enhanced the total chlorophyll, dry weight, and crop growth rate of groundnut plants (Figure 1). Our obtained results confirm the findings of Torelli et al. [48], who reported the increase in the shoot and root dry weight of groundnut plants when they were inoculated with mycorrhiza. Furthermore, there was a relatively significant increase in the branching number and plant height in the tested plants. A similar type of study was conducted by Copetta et al. [49], who showed increased overall morphological parameters in soybean plants due to inoculation with mycorrhiza fungi. Moreover, there was a significant increase in pod number, 100-seed weight, biological yield, and seed yield of groundnut plants compared to the non-mycorrhizal control plants. Moreover, high peanut yield in plants treated with mycorrhiza fungi may be due to higher moisture content, which contributes to increased nutrient supply to plants and, thus, increases the overall yield [50].The above-mentioned findings for mycorrhiza and nanoparticle application showed that the greatest value for N, P, and K in peanut seeds was achieved with the application of mycorrhiza and a combination of Ca and B [51].
Using nanotechnology in plant fertilization has recently created novel agrochemicals for increasing agricultural productivity [52,53,54]. Nanofertilizers are a novel type of synthetic fertilizers that contain readily available nutrients on a nano-scale [55]. Such nanoparticles help plants utilize nutrients, which improve pigmentation, photosynthetic rate, dry matter accumulation, and overall plant development. Additionally, nanoparticles considerably improve seed germination and overall plant development [56,57]. According to previous studies mentioned in the literature above, using NPs in plant nutrition in the form of nanofertilizers has been reported to precisely regulate nutrient delivery, attaining sustainable and ecologically sound agriculture.
Consistent with the findings of the current study, the collaborative effects of nano-Ca and nano-B are recognized as key elements in promoting the growth, yield, and quality of groundnuts [50]. The need for applying treatment B to groundnuts is to increase their growth and development, while simultaneously increasing the yield of crops, promoting the absorption of N, and increasing the plant height, plant dry weight, and total number of pods [27]. Additionally, boron has an essential role in plant growth as it is involved in various metabolic functions such as the formation of flowers and seed production [58], cell wall formation [59], cell division and elongation [60,61], membrane stability, carbohydrate metabolism and transport uptake of Ca2+, hormone activation, root development, and water translocation [62,63]. In the current study, the combined application of calcium and boron (Figure 2) improved plant height, branching number, crop growth rate, dry weight, shelling percentage, 100-seed weight, seed yield, oil, and seed protein and the phosphorus content of peanuts. Furthermore, increased vegetative parameters in the recent study might be due to the effective role of boron in promoting the absorption of nitrogen in the soil, which assisted improved growth [64]. Moreover, boron’s application promoted the absorption of N by the groundnuts and, thus, helped increase plant growth and development [27]. It is noteworthy that boron plays an important role in retaining flowering and fruit set in pulses [65]. An increase in yield could be a result of pod yield and fill caused by the application of boron fertilizer compared with the pod yield and number of unfilled pods when boron fertilizer was not applied. In the case of seed quality, Chitdeshwari and Poongothai [66] illustrated the positive role of boron in improving peanut quality through its involvement in the synthesis of protein and amino acids.
On the other hand, plants require calcium to grow and develop normally [67]. Calcium has been demonstrated to generally improve pod development [68] through increasing the number of peanuts and kernels (as well as their fullness), resulting in an increase in the weight of the pods and kernels [67]. Before or during the seeding of peanut plants, calcium is frequently applied as a base fertilizer [69]. Our data showed that calcium significantly increased the branching number, pods per plant, and biological yield under sandy soil conditions (Figure 2). Similarly, Xiumei et al. [52] revealed that the application of nano calcium in combination with humic acid and organic manures dramatically enhanced peanut growth and development. The appropriate rate of Ca was found to be critical to get the optimum pod yield for the peanuts [70]. Moreover, Kamara [71] and Gashti et al. [72] found calcium had a positive effect on the pod, seed, and biological yield of peanuts. Rahman [71] reported that Ca significantly affected all yield components by increasing the level of Ca from 0–100 kg ha−1. A recent study by Zharare et al. [72] indicated that the pod-zone Ca availability significantly affected peanut growth. In contrast to the findings of the current study, Hamza et al. [25] found that the traditional gypsum plus Ca(NO3)2 treatment produced the highest peanut seed yield, oil, and protein contents compared to the nano-Ca form. They also concluded that peanuts might benefit more from Ca2+ if gypsum is applied to the soil and calcium nitrate is applied to the leaves to prevent Ca2+ deficient illnesses.
In this study, it was found that the combination of mycorrhiza with nano-B or nano-Ca+B resulted in a significant increase in branching number, dry weight, plant height, crop growth rate, 100-seed weight, seed NPK content, oil, and protein (Table 2, Table 3 and Table 4). Thus, this finding could be attributed to the fact that under adverse conditions, mycorrhiza promotes plant development and the absorption of several essential nutrients, such as nitrogen and phosphorus [73]. This promotion of growth is linked to the mycorrhiza spread throughout the coating system [58]. The areas of depletion of rhizosphere nutrients allow a higher volume of soil. Furthermore, fungal hyphae penetrate small holes and consume more nutrients than the root [58]. Consequently, mycorrhiza provides sensible nutrition to growing plants, improving growth aspects and biomass production. Mycorrhiza application increased photosynthesis efficiency to reward biomass production by increasing chlorophyll content [13].

5. Conclusions

The results of the present study showed that the yield, growth, and seed biochemical composition of groundnut plants were significantly affected by different foliar nanoparticles and effective microorganisms. Plant height, branching number, crop growth rate, yield, and biochemical composition content were highest under the influence of the combined application of nano calcium + boron and effective microorganisms. Moreover, the application of nano boron resulted in the maximum seed nitrogen content, number of pods per plant, and biological yield compared to all other treatments. Such supplementation with biofertilizers is greatly beneficial due to their effectiveness in enhancing the growth, yield, and biochemical parameters of crops. This can be explained by the increased nutrient efficiency and plant nutrition due to the application of nanofertilizers and their synergic effect with biofertilizers. Considering all the parameters and treatments studied, it can be concluded that the application of nano-B or nano-Ca+B along with mycorrhiza is a promising approach to produce higher yields and improve the quality of peanuts.

Supplementary Materials

The following supporting information can be downloaded at https://0-www-mdpi-com.brum.beds.ac.uk/article/10.3390/agronomy12020398/s1. Figure S1: TEM images of nano-B at different magnification power of 2000× (a) and 12,000× (b). Figure S2: TEM images of nano-CaO at different magnification power of 12,000× (a) and 25,000× (b). Table S1: The initial physiochemical properties of the experimental soil. Table S2: Physical properties of nano-B. Table S3: Physical properties of nano-CaO.

Author Contributions

Conceptualization, A.M.A. and S.F.L.; data curation, E.A.A.S.; formal analysis, A.M.A.; funding acquisition, A.A.A.-H., H.M.A., A.A.A.E.-B. and S.F.L.; investigation, G.A.E.-S.; methodology, A.M.A., A.A.A.E.-B., E.A.A.S., M.M.A. and G.A.E.-S.; project administration, A.A.A.-H., A.A.A.E.-B., H.M.A., L.S.P. and S.F.L.; resources, A.A.A.-H., E.A.A.S., M.M.A. and L.S.P.; supervision, S.F.L.; visualization, A.M.A.; writing—original draft, A.M.A.; writing—review & editing, A.A.A.-H., M.M.A., H.M.A. and S.F.L. All authors have read and agreed to the published version of the manuscript.

Funding

This research was funded by the Researchers Supporting Project number (RSP-2021/186), King Saud University, Riyadh, Saudi Arabia.

Institutional Review Board Statement

Not applicable.

Informed Consent Statement

Not applicable.

Acknowledgments

Authors would like to extend their sincere appreciation to the Researchers Supporting Project number (RSP-2021/186), King Saud University, Riyadh, Saudi Arabia.

Conflicts of Interest

The authors declare no conflict of interest.

References

  1. Panhwar, F. Oilseed Crops Future in Sindh Pakistan; Digit Solutions GmbH: Löhne, Germany, 2005; Volume 38, p. 64. [Google Scholar]
  2. Fageria, N.K.; Baligar, V.C.; Jones, C.A. Growth and Mineral Nutrition of Field Crops; CRC Press: Boca Raton, FL, USA, 2010; ISBN 1439816964. [Google Scholar]
  3. Rifaat, M.G.M.; El-Basioni, S.M.; Hassan, H.M. Zinc and boron for groundnut production grown on sandy soil. Zagazig J. Agric. Res. 2004, 31, 139–164. [Google Scholar]
  4. FAOSTAT, Food and Agriculture Organization of the United Nations Statistics Division. FAOSTAT—FAO’s Corporate Statistical Database; Economic and Social Development Department, FAO: Rome, Italy, 2019; Available online: http://faostat3.fao.org/home/E (accessed on 15 February 2021).
  5. da Costa, P.B.; Beneduzi, A.; de Souza, R.; Schoenfeld, R.; Vargas, L.K.; Passaglia, L.M.P. The effects of different fertilization conditions on bacterial plant growth promoting traits: Guidelines for directed bacterial prospection and testing. Plant Soil 2013, 368, 267–280. [Google Scholar] [CrossRef]
  6. Simpson, R.J.; Oberson, A.; Culvenor, R.A.; Ryan, M.H.; Veneklaas, E.J.; Lambers, H.; Lynch, J.P.; Ryan, P.R.; Delhaize, E.; Smith, F.A. Strategies and agronomic interventions to improve the phosphorus-use efficiency of farming systems. Plant Soil 2011, 349, 89–120. [Google Scholar] [CrossRef]
  7. Youssef, M.A.; Yousef, A.F.; Ali, M.M.; Ahmed, A.I.; Lamlom, S.F.; Strobel, W.R.; Kalaji, H.M. Exogenously applied nitrogenous fertilizers and effective microorganisms improve plant growth of stevia (Stevia rebaudiana Bertoni) and soil fertility. AMB Express 2021, 11, 133. [Google Scholar] [CrossRef]
  8. Jeffries, P.; Gianinazzi, S.; Perotto, S.; Turnau, K.; Barea, J.-M. The contribution of arbuscular mycorrhizal fungi in sustainable maintenance of plant health and soil fertility. Biol. Fertil. Soils 2003, 37, 1–16. [Google Scholar] [CrossRef]
  9. Gao, C.; El-Sawah, A.M.; Ali, D.F.I.; Hamoud, Y.A.; Shaghaleh, H.; Sheteiwy, M.S. The integration of bio and organic fertilizers improve plant growth, grain yield, quality and metabolism of hybrid maize (Zea mays L.). Agronomy 2020, 10, 319. [Google Scholar] [CrossRef] [Green Version]
  10. Wu, S.C.; Cao, Z.H.; Li, Z.G.; Cheung, K.C.; Wong, M.H. Effects of biofertilizer containing N-fixer, P and K solubilizers and AM fungi on maize growth: A greenhouse trial. Geoderma 2005, 125, 155–166. [Google Scholar] [CrossRef]
  11. Azcón-Aguilar, C.; Barea, J.M. Nutrient cycling in the mycorrhizosphere. J. Soil Sci. Plant Nutr. 2015, 15, 372–396. [Google Scholar] [CrossRef] [Green Version]
  12. Zhu, X.-C.; Song, F.-B.; Xu, H.-W. Arbuscular mycorrhizae improves low temperature stress in maize via alterations in host water status and photosynthesis. Plant Soil 2010, 331, 129–137. [Google Scholar] [CrossRef]
  13. Tarnabi, Z.M.; Iranbakhsh, A.; Mehregan, I.; Ahmadvand, R. Impact of arbuscular mycorrhizal fungi (AMF) on gene expression of some cell wall and membrane elements of wheat (Triticum aestivum L.) under water deficit using transcriptome analysis. Physiol. Mol. Biol. Plants 2020, 26, 143–162. [Google Scholar] [CrossRef]
  14. Birhane, E.; Sterck, F.J.; Fetene, M.; Bongers, F.; Kuyper, T.W. Arbuscular mycorrhizal fungi enhance photosynthesis, water use efficiency, and growth of frankincense seedlings under pulsed water availability conditions. Oecologia 2012, 169, 895–904. [Google Scholar] [CrossRef] [PubMed] [Green Version]
  15. Rouphael, Y.; Franken, P.; Schneider, C.; Schwarz, D.; Giovannetti, M.; Agnolucci, M.; De Pascale, S.; Bonini, P.; Colla, G. Arbuscular mycorrhizal fungi act as biostimulants in horticultural crops. Sci. Hortic. 2015, 196, 91–108. [Google Scholar] [CrossRef]
  16. Zulfiqar, F.; Navarro, M.; Ashraf, M.; Akram, N.A.; Munné-Bosch, S. Nanofertilizer use for sustainable agriculture: Advantages and limitations. Plant Sci. 2019, 289, 110270. [Google Scholar] [CrossRef]
  17. Achari, G.A.; Kowshik, M. Recent developments on nanotechnology in agriculture: Plant mineral nutrition, health, and interactions with soil microflora. J. Agric. Food Chem. 2018, 66, 8647–8661. [Google Scholar] [CrossRef] [PubMed]
  18. Dimkpa, C.; Bindraban, P.; McLean, J.E.; Gatere, L.; Singh, U.; Hellums, D. Methods for Rapid Testing of Plant and Soil Nutrients. In Sustainable Agriculture Reviews; Springer: Berlin/Heidelberg, Germany, 2017; pp. 1–43. [Google Scholar]
  19. Dimkpa, C.O.; Singh, U.; Bindraban, P.S.; Adisa, I.O.; Elmer, W.H.; Gardea-Torresdey, J.L.; White, J.C. Addition-omission of zinc, copper, and boron nano and bulk oxide particles demonstrate element and size-specific response of soybean to micronutrients exposure. Sci. Total Environ. 2019, 665, 606–616. [Google Scholar] [CrossRef] [PubMed]
  20. Pollard, M.; Beisson, F.; Li, Y.; Ohlrogge, J.B. Building lipid barriers: Biosynthesis of cutin and suberin. Trends Plant Sci. 2008, 13, 236–246. [Google Scholar] [CrossRef] [PubMed]
  21. Walker, M.E. Calcium requirements for peanuts. Commun. Soil Sci. Plant Anal. 1975, 6, 299–313. [Google Scholar] [CrossRef]
  22. Yang, S.; Wang, J.; Tang, Z.; Guo, F.; Zhang, Y.; Zhang, J.; Meng, J.; Zheng, L.; Wan, S.; Li, X. Transcriptome of peanut kernel and shell reveals the mechanism of calcium on peanut pod development. Sci. Rep. 2020, 10, 15723. [Google Scholar] [CrossRef]
  23. Ntare, B.R.; Diallo, A.T.; Ndjeunga, J.; Waliyar, F. Groundnut Seed Production Manual; International Crops Research Institute for the Semi-Arid Tropic: Hyderabad, India, 2008. [Google Scholar]
  24. Pattee, H.E.; Stalker, H.T. Advances in Peanut Science; American Peanut Research and Education Society: Stillwater, OK, USA, 1995. [Google Scholar]
  25. Hamza, M.; Abbas, M.; Abd Elrahman, A.; Helal, M.; Shahba, M. Conventional versus Nano Calcium Forms on Peanut Production under Sandy Soil Conditions. Agriculture 2021, 11, 767. [Google Scholar] [CrossRef]
  26. Marschner, H. Marschner’s Mineral Nutrition of Higher Plants; Academic Press: Cambridge, MA, USA, 2011; ISBN 0123849063. [Google Scholar]
  27. Mengel, K.; Kirkby, E.A. Principles of Plant Nutrition, 3rd ed.; International Potash Institute: Bern, Switzerland, 1982. [Google Scholar]
  28. Jing, R.F.; Zhang, Q.G.; Han, L.F.; Zhang, F.S.; Wei, X.Q. Effect of boric fertilizer on peanut absorption of boron and nitrogen. Soils 1994, 26, 83–86. [Google Scholar]
  29. Barker, A.V.; Pilbeam, D.J. Handbook of Plant Nutrition; CRC Press: Boca Raton, FL, USA, 2007. [Google Scholar]
  30. Guru, T.; Veronica, N.; Thatikunta, R.; Reddy, S.N. Crop nutrition management with nano fertilizers. Int. J. Environ. Sci. Technol. 2015, 1, 4–6. [Google Scholar]
  31. El-Saadony, M.T.; Almoshadak, A.S.; Shafi, M.E.; Albaqami, N.M.; Saad, A.M.; El-Tahan, A.M.; Desoky, E.-S.M.; Elnahal, A.S.M.; Almakas, A.; Abd El-Mageed, T.A. Vital roles of sustainable nano-fertilizers in improving plant quality and quantity-an updated review. Saudi J. Biol. Sci. 2021, 28, 7349–7359. [Google Scholar] [CrossRef] [PubMed]
  32. Carter, M.R.; Gregorich, E.G. Soil Sampling and Methods of Analysis; CRC Press: Boca Raton, FL, USA, 2007; ISBN 0429126220. [Google Scholar]
  33. Madejón, E.; de Mora, A.P.; Felipe, E.; Burgos, P.; Cabrera, F. Soil amendments reduce trace element solubility in a contaminated soil and allow regrowth of natural vegetation. Environ. Pollut. 2006, 139, 40–52. [Google Scholar] [CrossRef] [PubMed]
  34. Bader El Din, S.M.S.; Attia, M.; Abo Sedera, S.A. Evaluation of several substrates for mass multiplication of Arbuscular mycorrhizal [AM] fungi grown on onion. Egypt. J. Microbiol. 1999, 34, 57–65. [Google Scholar]
  35. Nanni, A.; Dei, L. Ca(OH)2 nanoparticles from W/O microemulsions. Langmuir 2003, 19, 933–938. [Google Scholar] [CrossRef]
  36. Lowther, J.R. Use of a single sulphuric acid-hydrogen peroxide digest for the analysis of Pinus radiata needles. Commun. Soil Sci. Plant Anal. 1980, 11, 175–188. [Google Scholar] [CrossRef]
  37. Chapman, H.D.; Pratt, P.F. Methods of Analysis for Soils, Plant and Water; 50, 309; Department of Agricultural Sciences, University of California: Berkeley, CA, USA, 1978; Volume 4034. [Google Scholar]
  38. Motsara, M.R. Guide to Laboratory Establishment for Plant Nutrient Analysis; Scientific Publishers: Jodhpur, India, 2015; ISBN 9388148339. [Google Scholar]
  39. Mariotti, F.; Tomé, D.; Mirand, P.P. Converting nitrogen into protein—Beyond 6.25 and Jones’ factors. Crit. Rev. Food Sci. Nutr. 2008, 48, 177–184. [Google Scholar] [CrossRef]
  40. Heldrich, K. Official Methods of Analysis of the Association of Official Analytical Chemists; Association of Official Analytical Chemists Inc.: Arlington, VA, USA, 1990. [Google Scholar]
  41. Brown, R.H. Growth of the Green Plant. In Physiological Basis of Crop Growth and Development; Wiley: Hoboken, NJ, USA, 1984; pp. 153–174. [Google Scholar]
  42. Konlan, S.; Sarkodie-Addo, J.; Kombiok, M.J.; Asare, E.; Bawah, I. Yield response of three groundnut (Arachis hypogaea L.) varieties intercropped with maize (Zea mays) in the guinea savanna zone of Ghana. J. Cereal. Oilseeds 2013, 4, 76–84. [Google Scholar]
  43. SAS Institute. The SAS System for Windows, Version 9.2; SAS Institute Inc.: Cary, NC, USA, 2009.
  44. Sarker, A.; Talukder, N.M.; Islam, M.T. Phosphate solubilizing bacteria promote growth and enhance nutrient uptake by wheat. Plant Sci. Today 2014, 1, 86–93. [Google Scholar] [CrossRef]
  45. Reddy, G.C.; Goyal, R.K.; Puranik, S.; Waghmar, V.; Vikram, K.V.; Sruthy, K.S. Biofertilizers toward Sustainable Agricultural Development. In Plant Microbe Symbiosis; Springer: Cham, Switzerland, 2020; pp. 115–128. [Google Scholar]
  46. Nosheen, S.; Ajmal, I.; Song, Y. Microbes as biofertilizers, a potential approach for sustainable crop production. Sustainability 2021, 13, 1868. [Google Scholar] [CrossRef]
  47. Petrovic, B.; Sękara, A.; Pokluda, R. Biofertilizers Enhance Quality of Onion. Agronomy 2020, 10, 1937. [Google Scholar] [CrossRef]
  48. Torelli, A.; Trotta, A.; Acerbi, L.; Arcidiacono, G.; Berta, G.; Branca, C. IAA and ZR Content in Leek (Allium porrum L.), as Influenced by P Nutrition and Arbuscular Mycorrhizae, in Relation to Plant Development. In Recent Advances of Plant Root Structure and Function; Springer: Berlin/Heidelberg, Germany, 2001; pp. 55–61. [Google Scholar]
  49. Copetta, A.; Lingua, G.; Berta, G. Effects of three AM fungi on growth, distribution of glandular hairs, and essential oil production in Ocimum basilicum L. var. Genovese. Mycorrhiza 2006, 16, 485–494. [Google Scholar] [CrossRef] [PubMed]
  50. Singh, A.L. Mineral nutrition of groundnut. Adv. Plant Physiol. 1999, 2, 161–200. [Google Scholar]
  51. Lourduraj, A.C. Nutrient management in groundnut (Arachis hypogaea L.) cultivation. Agric. Rev. Res. Commun. Cent. India 1999, 20, 14–20. [Google Scholar]
  52. Xiumei, L.; Fudao, Z.; Shuqing, Z.; Xusheng, H.; Rufang, W.; Zhaobin, F.; Yujun, W. Responses of peanut to nano-calcium carbonate. Plant Nutr. Fertil. Sci. 2005, 11, 385–389. [Google Scholar]
  53. Liu, R.; Lal, R. Potentials of engineered nanoparticles as fertilizers for increasing agronomic productions. Sci. Total Environ. 2015, 514, 131–139. [Google Scholar] [CrossRef]
  54. Khan, M.R.; Rizvi, T.F. Application of Nanofertilizer and Nanopesticides for Improvements in Crop Production and Protection. In Nanoscience and Plant–Soil Systems; Springer: Berlin/Heidelberg, Germany, 2017; pp. 405–427. [Google Scholar]
  55. Janmohammadi, M.; Amanzadeh, T.; Sabaghnia, N.; Dashti, S. Impact of foliar application of nano micronutrient fertilizers and titanium dioxide nanoparticles on the growth and yield components of barley under supplemental irrigation. Acta Agric. Slov. 2016, 107, 265–276. [Google Scholar] [CrossRef] [Green Version]
  56. Salama, H.M.H. Effects of silver nanoparticles in some crop plants, common bean (Phaseolus vulgaris L.) and corn (Zea mays L.). Int. Res. J. Biotechnol. 2012, 3, 190–197. [Google Scholar]
  57. Zheng, L.; Hong, F.; Lu, S.; Liu, C. Effect of nano-TiO2 on strength of naturally aged seeds and growth of spinach. Biol. Trace Elem. Res. 2005, 104, 83–91. [Google Scholar] [CrossRef]
  58. Diagne, N.; Ngom, M.; Djighaly, P.I.; Fall, D.; Hocher, V.; Svistoonoff, S. Roles of arbuscular mycorrhizal fungi on plant growth and performance: Importance in biotic and abiotic stressed regulation. Diversity 2020, 12, 370. [Google Scholar] [CrossRef]
  59. Brown, P.H.; Bellaloui, N.; Wimmer, M.A.; Bassil, E.S.; Ruiz, J.; Hu, H.; Pfeffer, H.; Dannel, F.; Römheld, V. Boron in plant biology. Plant Biol. 2002, 4, 205–223. [Google Scholar] [CrossRef]
  60. de Oliveira, R.H.; Dias Milanez, C.R.; Moraes-Dallaqua, M.A.; Rosolem, C.A. Boron deficiency inhibits petiole and peduncle cell development and reduces growth of cotton. J. Plant Nutr. 2006, 29, 2035–2048. [Google Scholar] [CrossRef]
  61. Goldbach, H.E.; Yu, Q.; Wingender, R.; Schulz, M.; Wimmer, M.; Findeklee, P.; Baluška, F. Rapid response reactions of roots to boron deprivation. J. Plant Nutr. Soil Sci. 2001, 164, 173–181. [Google Scholar] [CrossRef]
  62. Sheng, O.; Song, S.W.; Chen, Y.J.; Peng, S.A.; Deng, X.X. Effects of exogenous B supply on growth, B accumulation and distribution of two navel orange cultivars. Trees 2009, 23, 59. [Google Scholar] [CrossRef]
  63. Zhao, D.; Oosterhuis, D.M. Cotton carbon exchange, nonstructural carbohydrates, and boron distribution in tissues during development of boron deficiency. Field Crop. Res. 2002, 78, 75–87. [Google Scholar] [CrossRef]
  64. Zhang, L. Effects of Foliar Application of Boron and Dimilin on Soybean Yield; Mississippi Agricultural & Forestry Experiment Station: Starkville, MS, USA, 2001. [Google Scholar]
  65. Chitdeshwari, T.; Poongothai, S. Yield of groundnut and its nutrient uptake as influenced by Zinc, Boron and Sulphur. Agric. Sci. Dig. 2003, 23, 263–266. [Google Scholar]
  66. Zhou, L.-Y.; Li, X.-D.; Wang, L.-L.; Tang, X.; Lin, Y.-J. Effects of different Ca applications on physiological characteristics, yield and quality in peanut. Acta Agron. Sin. 2008, 34, 879–885. [Google Scholar] [CrossRef]
  67. Chirwa, M.; Mrema, J.P.; Mtakwa, P.W.; Kaaya, A.; Lungu, O.I. Yield response of groundnut (Arachis hypogaea L.) to boron, calcium, nitrogen, phosphorus and potassium fertilizer application. Int. J. Soil Sci. 2017, 12, 18–24. [Google Scholar] [CrossRef] [Green Version]
  68. Li, Y.; Meng, J.; Yang, S.; Guo, F.; Zhang, J.; Geng, Y.; Cui, L.; Wan, S.; Li, X. Transcriptome analysis of calcium-and hormone-related gene expressions during different stages of peanut pod development. Front. Plant Sci. 2017, 8, 1241. [Google Scholar] [CrossRef] [Green Version]
  69. Kamara, E.G. Effect of Calcium and Phosphorus Fertilization on the Growth, Yield and Seed Quality of Two Groundnut (Arachis hypogaea, L.) Varieties. Ph.D. Thesis, Kwame Nkrumah University of Science and Technology, Kumasi, Ghana, 2010. [Google Scholar]
  70. Gashti, A.H.; Vishekaei, M.N.S.; Hosseinzadeh, M.H. Effect of potassium and calcium application on yield, yield components and qualitative characteristics of peanut (Arachis hypogaea L.) in Guilan Province, Iran. World Appl. Sci. J. 2012, 16, 540–546. [Google Scholar]
  71. Rahman, M.A. Effect of Calcium and Bradyrhizobium inoculation of the Growth, Yield and quality of groundnut (A. hypogaea L.). Bangladesh J. Sci. Ind. Res. 2006, 41, 181–188. [Google Scholar] [CrossRef]
  72. Zharare, G.E.; Blamey, F.C.; Asher, C.J. Effects of pod-zone calcium supply on dry matter distribution at maturity in two groundnut cultivars grown in solution culture. J. Plant Nutr. 2012, 35, 1542–1556. [Google Scholar] [CrossRef]
  73. Sampathkumar, G.; Ganeshkumar, A. Effect of AM fungi and Rhizobium on growth and nutrition of Vigna mungo L. and Vingna unguiculata. Mycorrhiza News 2003, 14, 15–18. [Google Scholar]
Figure 1. Effects of different biofertilization treatments (control, mycorrhiza, and phosphorine) on 15 studied traits for peanuts determined from the field experiments’ combined data from the 2020 and 2021 seasons. Different lowercase letters on error bars indicate statistically significant differences between treatments (p ≤ 0.05), as performed by the least significant difference (Fisher’s LSD) test.
Agronomy 12 00398 g001
Figure 2. Effects of different fertilization regimes (B, Ca, and Ca+B nanoparticles) on growth, yield, and biochemical traits of peanuts during two growing seasons (2020 and 2021). Different lowercase letters on error bars indicate statistically significant differences between treatments (p ≤ 0.05), as performed by the least significant difference (Fisher’s LSD) test.
Agronomy 12 00398 g002
Figure 3. Pearson’s correlation coefficients among 15 studied traits under different fertilizer combinations (combined analysis of two successive seasons, 2020 and 2021). NPP, number of pods/plant; Sh, shelling; HSW, 100-seed weight; BY, biological yield; SY, seed yield; N, nitrogen; P, phosphorous; K, potassium; BN, branching number; PH, plant height; DW, dry weight; CGR, crop growth rate. Blue indicates positive correlation, while red indicates negative correlation. Crossed cells with (X) symbol indicate statistically non-significant correlations (p ≥ 0.05).
Agronomy 12 00398 g003
Figure 4. Clustering analysis presented the relationships between fertilization treatment and studied traits. In the ballots, the hierarchical clustering analysis with the Euclidean distance using the principal component scores and Ward’s technique as the process of linkage was used. NPP, number of pods/plants; Sh, shelling; HSW, 100-seed weight; BY, biological yield; SY, seed yield; N, nitrogen; P, phosphorous; K, potassium; CGR, crop growth rate; BN, branching number; PH, plant height; DW, dry weight; Ch, chlorophyll.
Agronomy 12 00398 g004
Table 1. ANOVA of the effects of biofertilizers, nanoparticles applications, and their interaction on growth, physiological, yield, and biochemical parameters of peanut plants.
Yield Components
Source of VarianceNumber of Pods/Plant100-Seed WeightShellingBiological YieldSeed Yield
2020202120202021202020212020202120202021
Biofertilizer (BF)***ns************************
Nanoparticles (NPs)******************************
BF × NPs**************************
CV3.714.692.624.284.615.423.714.696.187.06
R20.970.830.990.980.940.910.970.830.990.96
RMSE1.412.062.662.551.6619.911.412.061.991.22
Growth Attributes
Source of VarianceBranching NumberChlorophyllDry WeightPlant HeightCrop Growth Rate
2020202120202021202020212021202120212021
Biofertilizer (BF)******************************
Nanoparticles (NPs)******ns*********************
BF × NPs******nsns******************
CV3.543.9411.48.250.754.303.713.943.943.71
R20.940.960.800.920.940.920.970.960.960.97
RMSE1.181.441.251.000.020.921.411.441.441.41
Biochemical Parameters
Source of VarianceNitrogenPhosphorousPotassiumProtein ContentOil Content
2020202120202021202020212021202120212021
Biofertilizer (BF)***ns************************
Nanoparticles (NPs)***ns************************
BF × NPs*ns************************
CV6.235.593.202.943.272.63.754.303.943.71
R20.950.880.940.940.990.900.940.920.960.97
RMSE0.190.180.030.030.000.040.020.921.441.41
ns, *, *** indicate not significant, significant at 5% (p ≤ 0.05), and significant at 0.1% (p ≤ 0.001) probability level, respectively. CV, coefficient of variation (%). RMSE, root mean square error.
Table 2. Effects of interaction between biofertilizer and nanoparticle treatments on peanut yield and yield component traits across two successive seasons (2020 and 2021).
Bio-FertilizersNano-
Particles
NPPShHSWSYBY
2020202120202021202020212020202120202021
ControlControl22.3d20.7f55.0f43.6d36.7e39.8e1.0e1.0d6.5f6.9bc
Ca24.0cd21.7ef57.4ef56.6bc50.9d55.6bc1.1de1.6c6.6ef7.6ab
B23.6cd24.0cdef54.4f55.2bc56.2bcd52.9cd1.2dce1.9b7.7cd7.2abc
Ca+B22.7d22.0def65.8cd55.9bc54.5cd54.9bc1.3bce1.9b7.3de6.8bc
MycorrhizaControl29.0abcd23.3cdef56.1f44.7d56.7bcd54.8bcd1.0e1.0d6.8fe6.9bc
Ca36.3ab28.0bc67.3c77.3a59.1abc59.5ab1.9b2.0a8.6ab7.5ab
B38.7a22.7def76.1b76.9a62.0ab61.7a2.4a2.4a8.8ab8.1a
Ca+B37.7a27.0cd82.2a83.5a63.4a64.4a2.4a2.3a8.9a7.7ab
PhosphorineControl27.7bcd19.0f46.3g48.9cd52.9cd49.1d1.0e1.0c6.3f6.4c
Ca33.3abc34.0a62.2de62.2b51.2d52.2cd1.5c1.9b7.8cd7.5ab
B32.7abc32.7ab56.3f56.6bc55.0cd54.0bcd1.4e2.3a8.1bc8a
Ca+B22.3d26.0cd62.4cde62.4b53.6cd54.6bcd2.0b2.4a8.46.7bc
Different lowercase letters on error bars indicate statistically significant differences between treatments (p ≤ 0.05), as performed by the least significant difference (Fisher’s LSD) test. NPP, no. pods/plant; Sh, shelling; HSW, 100-seed weight; SY, Seed yield; BY, Biological yield.
Table 3. Effects of interaction between biofertilizer and nanoparticle treatments on peanut growth parameters across two successive seasons (2020 and 2021).
Bio-FertilizersNano-
Particles
BNPHDWCGRCh
2020202120202021202020212020202120202021
ControlControl8.0bc8.0f28.3e31.3cd82.7cd76.0cd2.3c2.3bc38.2cd41.8bcde
Ca7.7c11.0def31.3bcd35.3abc72.3d89.3abcd2.4c2.4bc40.5bcd45.2abcd
B10.3abc11.3cde34.7b32.0cd82.0cd87.3abcd2.9abc2.4bc35.9d46.3abc
Ca+B9.3abc11.0def34.7b33.0bcd88.7c85.0abcd2.3c2.5bc37.7cd47.5ab
MycorrhizaControl12.7a12.0cde30.3de32.6bcd84.3cd88.3abcd2.4c2.1c41.6abc39.9de
Ca12.3a14.3abc34.7b34.3bc124.0ab90.7abc2.7abc2.8abc41.1bcd41.1cde
B13.0a15.7ab40.3a40.0a108.0b99.7a3.4a3.4a46.8a50.4a
Ca+B12.0a17.3a38.7a37.7ab118.7ab87.7abcd3.2ab2.3bc43.7ab42.7bcde
PhosphorineControl11.3abc9.7ef30.7bcde28.1d86.3cd75.3d2.2c2.4bc38.0cd38.0e
Ca11.3abc11.7cde32.0bcd32.0cd82.7cd83.7bcd2.4c2.9ab44.5ab44.5abcd
B11.3abc11.7cde32.0bcd33.7bc85.0cd95.3ab2.5bc2.9abc44.4ab44.8abcd
Ca+B11.7ab13.0bcd34.0bc34.0bc85.3c84.0bcd2.9abc3.0ab44.3ab44.3abcd
Different lowercase letters on error bars indicate statistically significant differences between treatments (p ≤ 0.05), as performed by the least significant difference (Fisher’s LSD) test. BN, branching number; PH, plant height; DW, dry weight; CGR, crop growth rate; Ch, chlorophyll.
Table 4. Effects of interaction between biofertilizer and nanoparticle treatments on peanut seed biochemical traits across two successive seasons (2020 and 2021).
BiofertilizersNano-
Particles
NitrogenPhosphorusPotassiumOilProtein
2020202120202021202020212020202120202021
ControlControl2.2e2.6d1.1d1.1f0.1cde0.1c29.1d29.1f18.3f18.3f
Ca2.2e3.4abc1.2bcd1.2def0.1cde0.1bc33.6c32.6ef20.6def19.4ef
B2.6de3.7ab1.1d1.1ef0.3a0.2ccd38.6cd19.3ef20.5cdef
Ca+B2.3e3.5abc1.3ab1.3abc0.1cde0.1c32.4cd32.4ef21.6cde19.9def
MycorrhizaControl3.0cd3.0cd1.1cd1.1f0.1fg0.1c35.1c35.1de20.9de20.3cdef
Ca3.2bcd3.2bc1.3ab1.2def0.3a0.3a39.8b41.5bc22.2bcd24.1ab
B3.9a3.9a1.4a1.4ab0.1def0.4a39.2b48.9a25.1a25.1a
Ca+B3.7ab3.6abc1.4a1.4a0.1c0.1c44.9a47.2a23.6abc23.0abc
PhosphorineControl3.5abc3.0cd1.1d1.1f0.1cd0.1c32.9cd32.9ef19.3ef19.3ef
Ca3.2bcd3.2bcd1.3ab1.3bcd0.3b0.3ab33.9c33.6e21.0de21.4de
B3.8a3.8a1.1d1.2def0.1efg0.1c39.6b39.6c24.3ab24.3ab
Ca+B3.5abc3.5abc1.3bc1.2cde0.1g0.1c45.6a45.6ab22.7bcd22.7abcd
Different lowercase letters on error bars indicate statistically significant differences between treatments (p ≤ 0.05), as performed by the least significant difference (Fisher’s LSD) test.
Publisher’s Note: MDPI stays neutral with regard to jurisdictional claims in published maps and institutional affiliations.

