Article

Metabolomic Response to Drought Stress in Belosynapsis ciliata (Blume) ‘Qiuhong’

1
Key Laboratory of Tropical & Subtropical Flowers and Landscape Plants of Guangdong Higher Education Institutions, College of Horticulture and Landscape Architecture, ZhongKai University of Agriculture and Engineering, Guangzhou 510225, China
2
Shenzhen Landscape Co., Ltd., Shenzhen 518021, China
*
Author to whom correspondence should be addressed.
These authors contributed equally to this work.
Submission received: 7 January 2022 / Revised: 4 February 2022 / Accepted: 11 February 2022 / Published: 13 February 2022

Abstract

:
The drought stress responses of plants are complex regulatory mechanisms that include various physiological responses reflected by the global metabolic status. Metabolomics is an effective, analytical, and instrumental technique for informatics/statistics for the acquisition of comprehensive information on metabolites. We investigate the effect of drought stress on a Belosynapsis ciliata cultivar, ‘Qiuhong’ (a drought-tolerant cultivar), using liquid chromatography-mass spectrometry based on a widely targeted metabolomic approach. ‘Qiuhong’ leaves are subjected to 15- and 30-day drought treatments and are then compared to a control group without drought stress and a rehydration group. In total, 290 differentially accumulated metabolites were detected between drought and normal conditions through multivariate statistical analyses, of which 65 metabolites (36 upregulated and 29 downregulated) were highlighted for their significant contribution to drought tolerance, including an anthocyanin (peonidin 3-O-galactoside) that caused the purple-red hue in leaves under drought stress. In addition, we found that two significantly altered pathways (citrate cycle and purine metabolism) were related to enhanced drought tolerance in plants. Notably, the synthesis of three compounds (p-coumaroyl putrescine, apigenin 6-C-glucoside, and β-nicotinamide mononucleotide) was specifically induced in the drought-treated ‘Qiuhong’, indicating their critical roles in drought resistance. Our results provide a foundation for further research on drought-resistant mechanisms in B. ciliata.

Graphical Abstract

1. Introduction

Drought is usually known as one of the most harmful abiotic stressors, to the great detriment of plants at the morphological, physiological, and biochemical levels. This is owed to the induction of reactive oxygen species (ROS), which results in decreased photosynthesis [1], impaired cell elongation and division [2], and loss of cell turgor [3], and leads to a 50–70% decline in crop productivity globally [4].
Correspondingly, many plants have developed several defense mechanisms, including morphological, physiological, biochemical, and phenological processes, to withstand drought stresses. Among these, the modifications of the transcriptome, proteome, and metabolome that regulate cellular biosynthesis and degradation activities are thought to be of predominance [2,5]. Plants recruit different strategies, such as enhanced production of secondary metabolites (SMs), phytohormones, ROS signalling, plant hydraulic status, and osmotic adjustment, to maintain growth and development under drought stress conditions, rendering them drought-tolerant/resistant [6,7,8,9].
Belosynapsis ciliata (Blume) is a perennial creeping herb with a purple or pink-purple capitulum in the family Commelinaceae. It is native to southeast Asia, the Indian subcontinent, Papuasia, and southern China [10,11]. B. ciliata is extraordinarily drought and heat tolerant and, in recent years, has received increased horticultural attention as suitable groundcover or rooftop greenery in tropical or subtropical areas [12]. However, limited research has characterised the physiochemical responses of B. ciliata to drought tolerance, much less investigated the underlying mechanisms of this process.
In current plant studies, metabolomics is a widespread and significant analytical instrumental technique and informatics/statistics used in a variety of molecular biology studies in order to elucidate critical SMs [13,14]. Recently, liquid chromatography coupled with ESI-triple quadrupole-linear ion trap mass spectrometry (LC-ESI-MS/MS)-based widely targeting metabolome analysis has been developed to be a rapid and reliable approach for the precise detection of a wide range of plant metabolites [15]. Hence, we used LC-ESI-MS/MS to describe the metabolomic variation of leaves from a drought-treated B. ciliata cultivar ‘Qiuhong’, focusing on drought-responsive and pigment-coupled metabolites that render leaves a purple-red hue. Based on the results, different metabolite profiles that induce drought tolerance effects are proposed. Our results also provide a foundation of new evidence for further studies on the molecular mechanisms of drought resistance and leaf colouration in B. ciliata.

2. Materials and Methods

2.1. Plant Materials

B. ciliata ‘Qiuhong’ was bred by propagating bud mutation cuttings from a single plant of the wild species Purple Millennium. In the summer and autumn seasons in south China, the ‘Qiuhong’ leaves on rock surfaces will change from green to purple-red, which provides a stronger resistance to adversity. Cuttings were made in the experimental greenhouse of Zhongkai University of Agriculture and Engineering and had a stem segment 10–15 cm long and contained two or more stem nodes. The cuttings (18 per basin) were then planted in 60 × 30 × 15 cm rectangular planting basins containing a mixed matrix of peat soil and perlite (3:1) filled to approximately 1/2 of the planting basin height. Then, the basins were placed in an incubator with temperatures of 30 °C/28 °C (light 12 h/dark 12 h), 35% humidity, and light of 40%, and watered once every 3 days with 1.5 L of water. After 15 days of normal maintenance, the physiological and metabolic treatment groups were subjected to drought stress, whereas the control group conditions did not change. Leaf samples were collected at the following three time points: after 15 days of drought (DA), after 30 days of drought (DB), and 7 days after rewatering of the DB group (RH) as samples fully recovered from drought could represent those in a ‘control’ condition; in parallel with these treatments, ‘fresh’ plants which had not undergone any treatments were also used as an authentic control group (CK). For each treatment per biological replicate, the 3rd and 4th fresh leaves from 45 plants were analysed together (n = 3).

2.2. Estimation of Physiological Traits

In terms of pigments, the chlorophyll and carotenoid contents of the leaves were determined with the method of Li et al. [16]. Determination of anthocyanin content was performed following the method described by Hashimoto et al. [17]. In terms of enzyme activities, SOD activity was determined with the NBT photoreduction method of Beauchamp and Fridovich [18], POD activity was determined using the guaiacol colorimetric method of Alici and Arabaci [19], CAT activity was determined by the UV absorption method of Aebi [20], and the content of malondialdehyde (MDA) was determined using the thiobarbituric acid method. The soluble sugar content, which is related to the tissue structure, inheritance, energy, and the soluble protein content, which concerns the metabolism, senescence, and osmosis of plants, are significant physiological and biochemical indexes. In this term, the methods from Wang et al. [21] and Chen et al. [15] have been referenced for the determination of soluble sugar content and soluble protein content, respectively. Simultaneously, relative conductivity was measured according to the method of Zhang and Kirkham [22], which could reflect the situation of the plants membrane system. The experimental procedures were slightly modified from the reference studies. In total, 3 g leaves were used in each biological replicate and 1 g leaves were used in each technical replicate (n = 3). All statistical analyses were conducted with Tukey’s test using SPSS software version 23.

2.3. Sample Preparation and Metabolite Extraction

All samples were frozen in liquid nitrogen immediately and kept at −80 °C until processing. A portion of the samples was used for metabolite extraction. According to the standard procedures as described by Chen et al. [19], the sample preparation, extraction analysis, metabolite identification, and quantification were sequentially processed at Wuhan MetWare Biotechnology Co., Ltd. (www.metware.cn, 1 February 2021). The Analyst 1.6.1 software (AB SCIEX, ON, Canada) was used to conduct metabolite data analysis. To maximise the metabolome differences between the pairs of samples, partial least squares-discriminant analysis (PLS-DA) was used in the subsequent statistical analysis. The variable importance in projection (VIP) parameter was used to check the relative importance of each metabolite to the PLS-DA model. With the setting of VIP > 1 and fold change > 2 or <0.5, the metabolites conformed to were considered as differential metabolites for group discrimination [23].

2.4. ESI-Q TRAP-MS/MS Analysis

B. ciliata ‘Qiuhong’ leaf extracts were analysed using an LC-ESI-MS/MS system (HPLC, Shim-pack UFLC SHIMADZU CBM30A system, www.shimadzu.com.cn 1 February 2021; MS, Applied Biosystems 4500 QTRAP, www.appliedbiosystems.com.cn 1 February 2021, Boston, MA, USA) at Wuhan MetWare Biotechnology Co., Ltd. (Wuhan, China) following their standard procedures as fully described before [19]. A local database was generated by a proper combination of authentic standards and manual identification that was applied as one of the references. The analytical conditions were as follows: aliquots (5 μL) were injected into a Waters ACQUITY UPLC HSS T3 C18 column (1.8 µm, 2.1 × 100 mm, Shanghai, China). The HPLC mobile phase was solvent B, 0.04% acetic acid in acetonitrile, versus solvent A, 0.04% acetic acid in Milli-Q (Millipore) water; and column temperature at 40 °C, the gradient was 0 min, 95:5 (V(A):V(B)); 11 min, 5:95; 12 min, 5:95; 12.1 min, 95:5; 15 min, 95:5 with the flow rate of 0.40 mL/min. Linear ion trap (LIT) and triple quadrupole (QQQ) scans were acquired on a triple quadrupole-linear ion trap mass spectrometer (QTRAP, Boston, USA), API 4500 QTRAP LC/MS/MS system, equipped with an ESI and turbo ion-spray interface, operating in both positive and negative ion modes and controlled by Analyst 1.6 software (AB SCIEX, Singapore). The ESI source operation parameters were as follows: ion source (turbo spray); source temperature (550 °C); ion spray voltage (5500 V); ion source gas I, gas II, curtain gas (379, 414, and 172 kPa, respectively); collision activated dissociation, (high). The polypropylene glycol solutions of 10 and 100 μmol/L were used to perform the instrument’s tuning and mass calibration in QQQ and LIT modes, respectively. Metabolite quantification was performed using a multiple reaction monitoring method (MRM). Data were processed using Analyst 1.6.3 software.

2.5. Metabolite Identification and Quantification

Metabolite identification was based on the primary and secondary spectral data annotated against public databases, namely, MassBank (European MassBank, NORMAN MassBank. http://www.massbank.jp/ 5 May 2021), KEGG database (the Kyoto Encyclopedia of Genes and Genomes http://www.kegg.jp/ 20 May 2021), KNApSAcK (A Comprehensive Species-Metabolite Relationship Database. http://kanaya. Naist.jp/KNApSAcK/ 20 May 2021), HMDB (HMDB Version 4.0. http://www.hmdb.ca/ 20 May 2021), MoToDB (Moto V 1.0. http://www.ab.wur.nl/moto/ 10 Jun 2021), and METLIN (Metabolite Link. http://metlin.scripps.edu/ 10 Jun 2021), and a self-compiled database named MWDB (MetWare Biological Science and Technology Co., Ltd., Wuhan, China), following the standard metabolic operating procedures [15].

3. Results

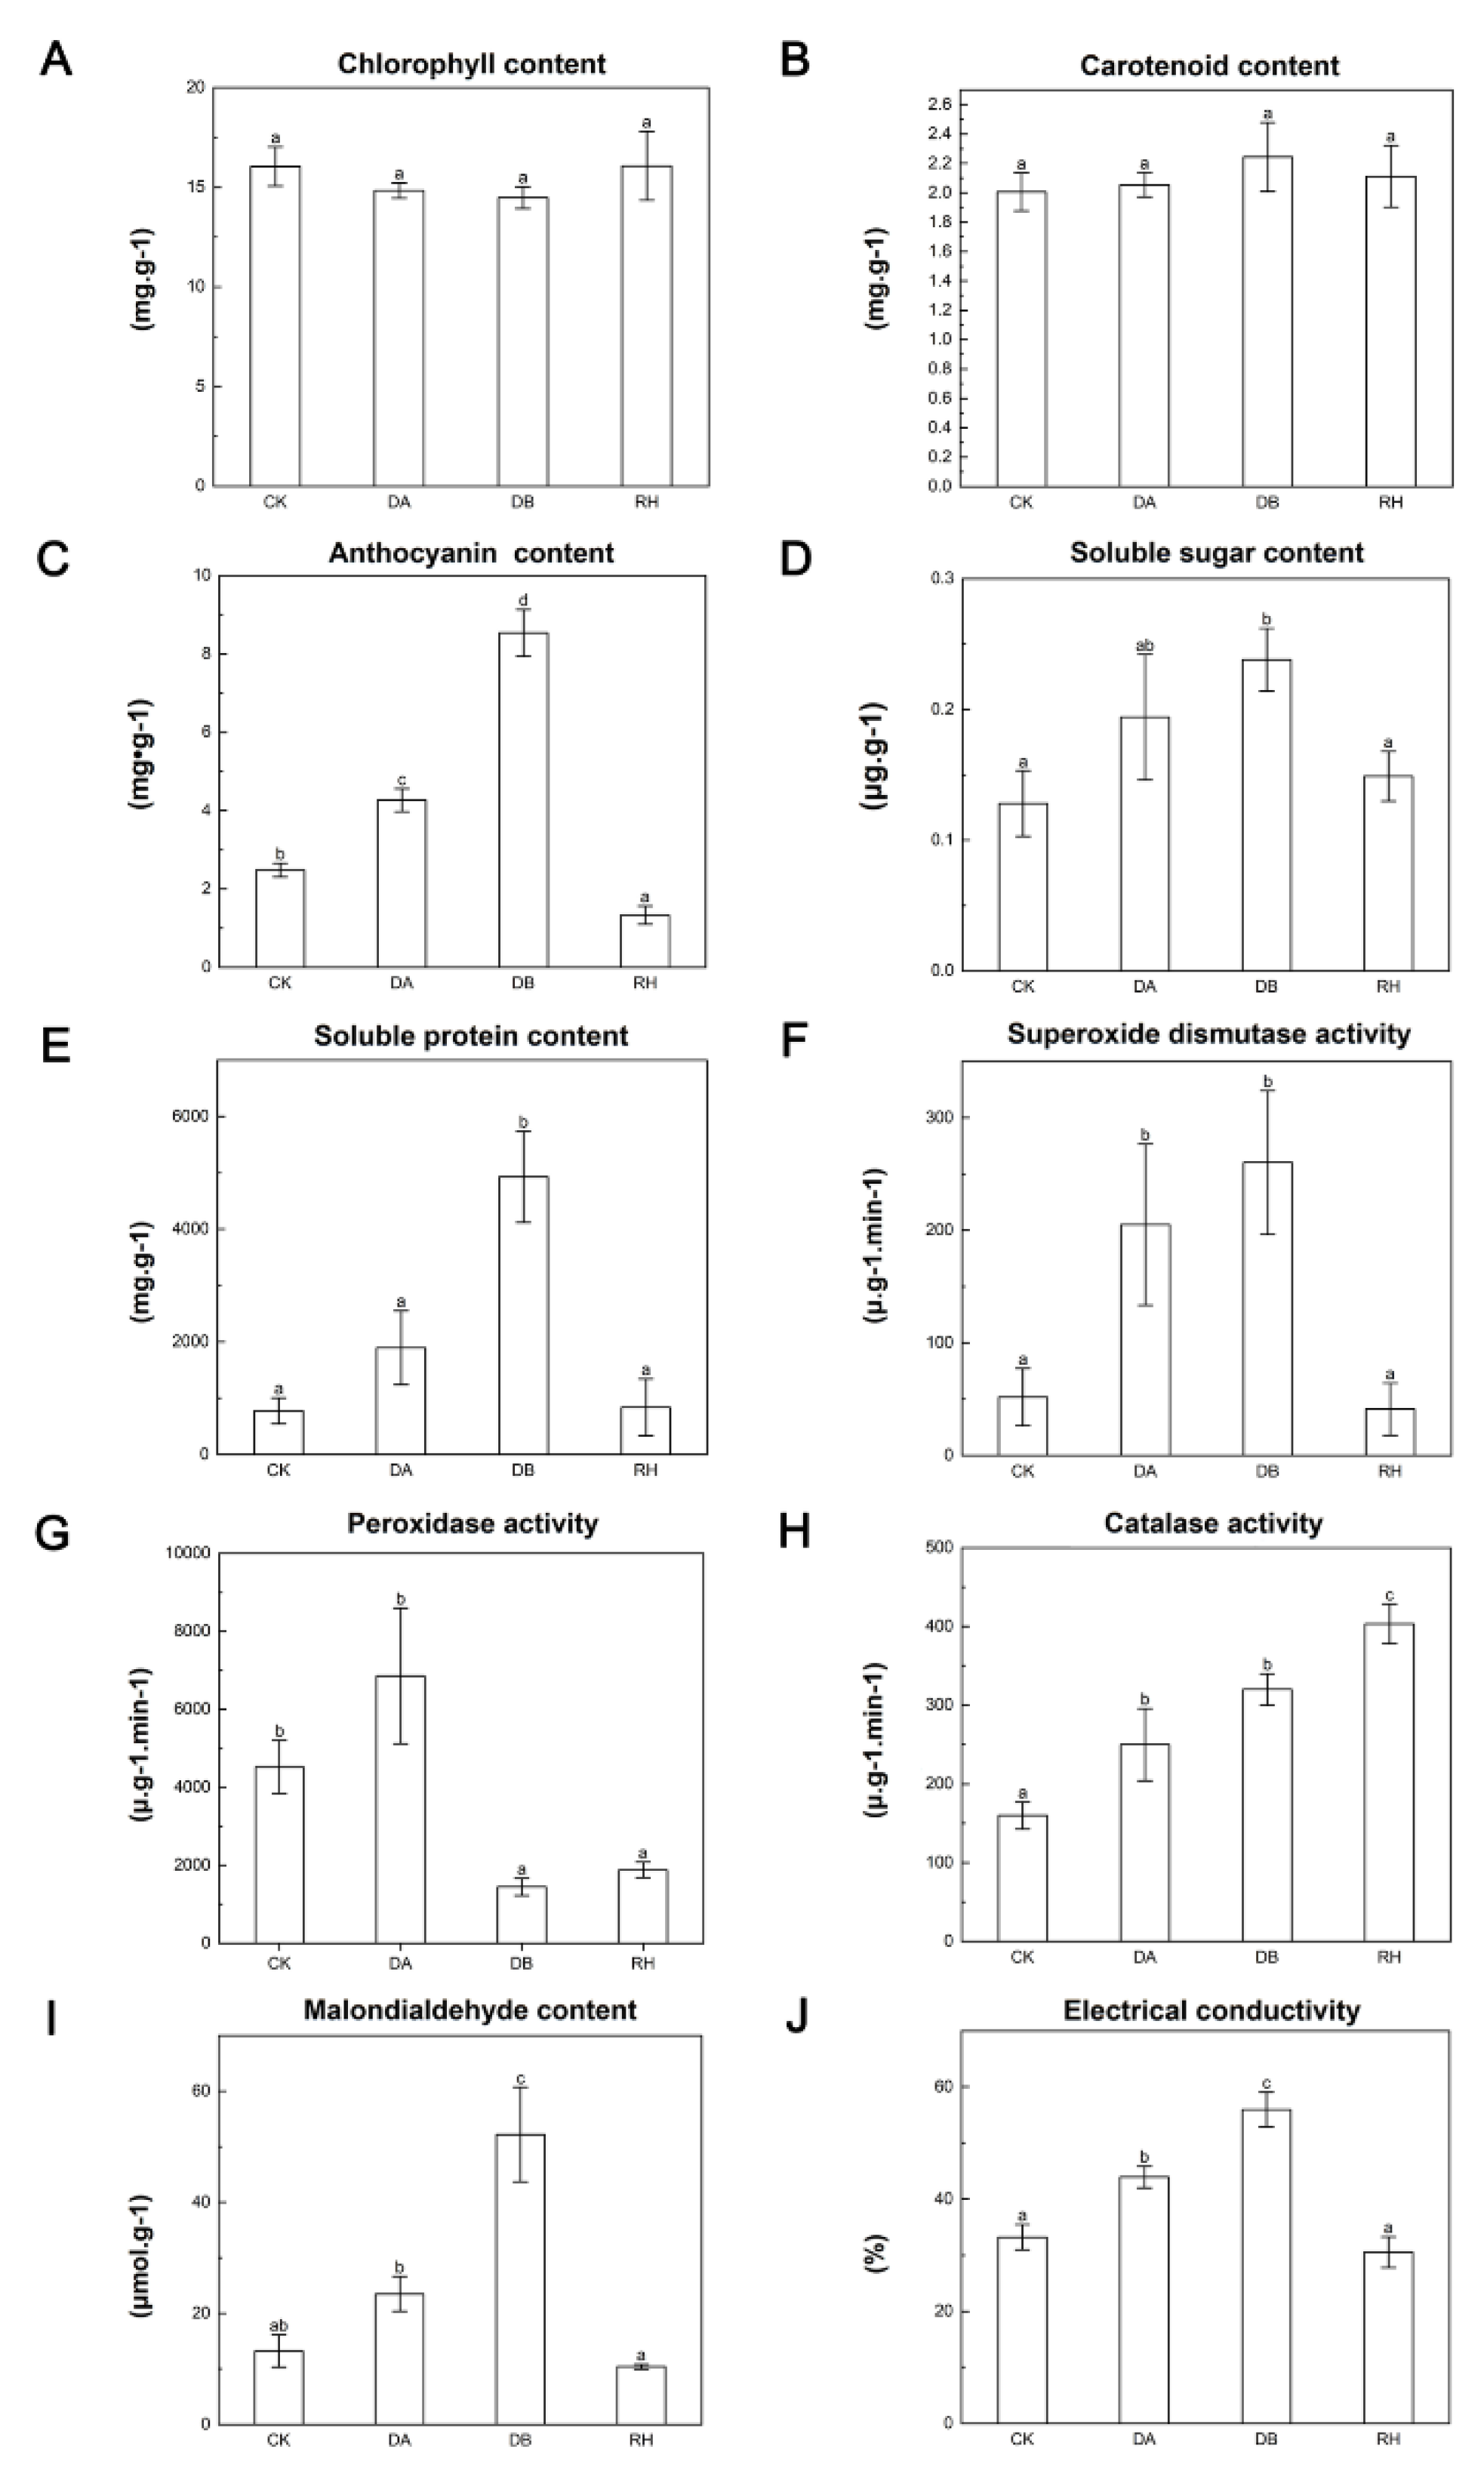
3.1. Physiochemical Changes in B. ciliata under Drought Treatment

In order to determine the effect of drought stresses on B. ciliata at the physiochemical level, a drought-tolerant cultivar ‘Qiuhong’ was selected to implement drought treatment. In the first step, the degree of drought stress was evaluated in the soil of 60 plants subjected to drought treatments, individually. Our results showed that at 15 and 30 days under drought-stress conditions, soil moisture content (MC) exhibited a turning point in the degree of drought stress. According to the data on the soil MC at 15 and 30 days, the plants were in a state of moderate (25–30% MC) and severe drought (0–5% MC), respectively (Supplementary Figure S1). Therefore, we selected ‘Qiuhong’ leaves from the control (CK) and drought-treated groups at 15 days (DA), 30 days (DB), and with rehydration after DB (RH) for further physiochemical and metabolomic analysis (see materials and methods).
A significant colouration change occurred in both adaxial and abaxial leaves under DA and DB treatments, which was not observed in the CK or RH groups (Figure 1). For the variation analysis, we measured several physiochemical parameters of the leaves. As shown in Figure 2A, a significant induction of total anthocyanin both in DA and DB contributed to the purple-red hue in leaves, and the higher accumulation of total anthocyanin in the DB group was in concert with the larger coloration area in the DB group. Whereas the other two pigments (chlorophyll and carotenoid) remained unchanged under drought treatments, suggesting that anthocyanin plays a vital role in drought resistance (Figure 2B,C). Both soluble sugar and protein content significantly increased in the DB group but not in the DA group to regulate cell osmotic pressure under drought conditions (Figure 2D,E). Notably, peroxidase (POD) activity, malondialdehyde (MDA), and electrical conductivity reflecting oxidative damage were significantly triggered by drought. Moreover, strikingly increased levels of superoxide dismutase (SOD) and catalase (CAT) in both the DA and DB groups protected the cells from damage.

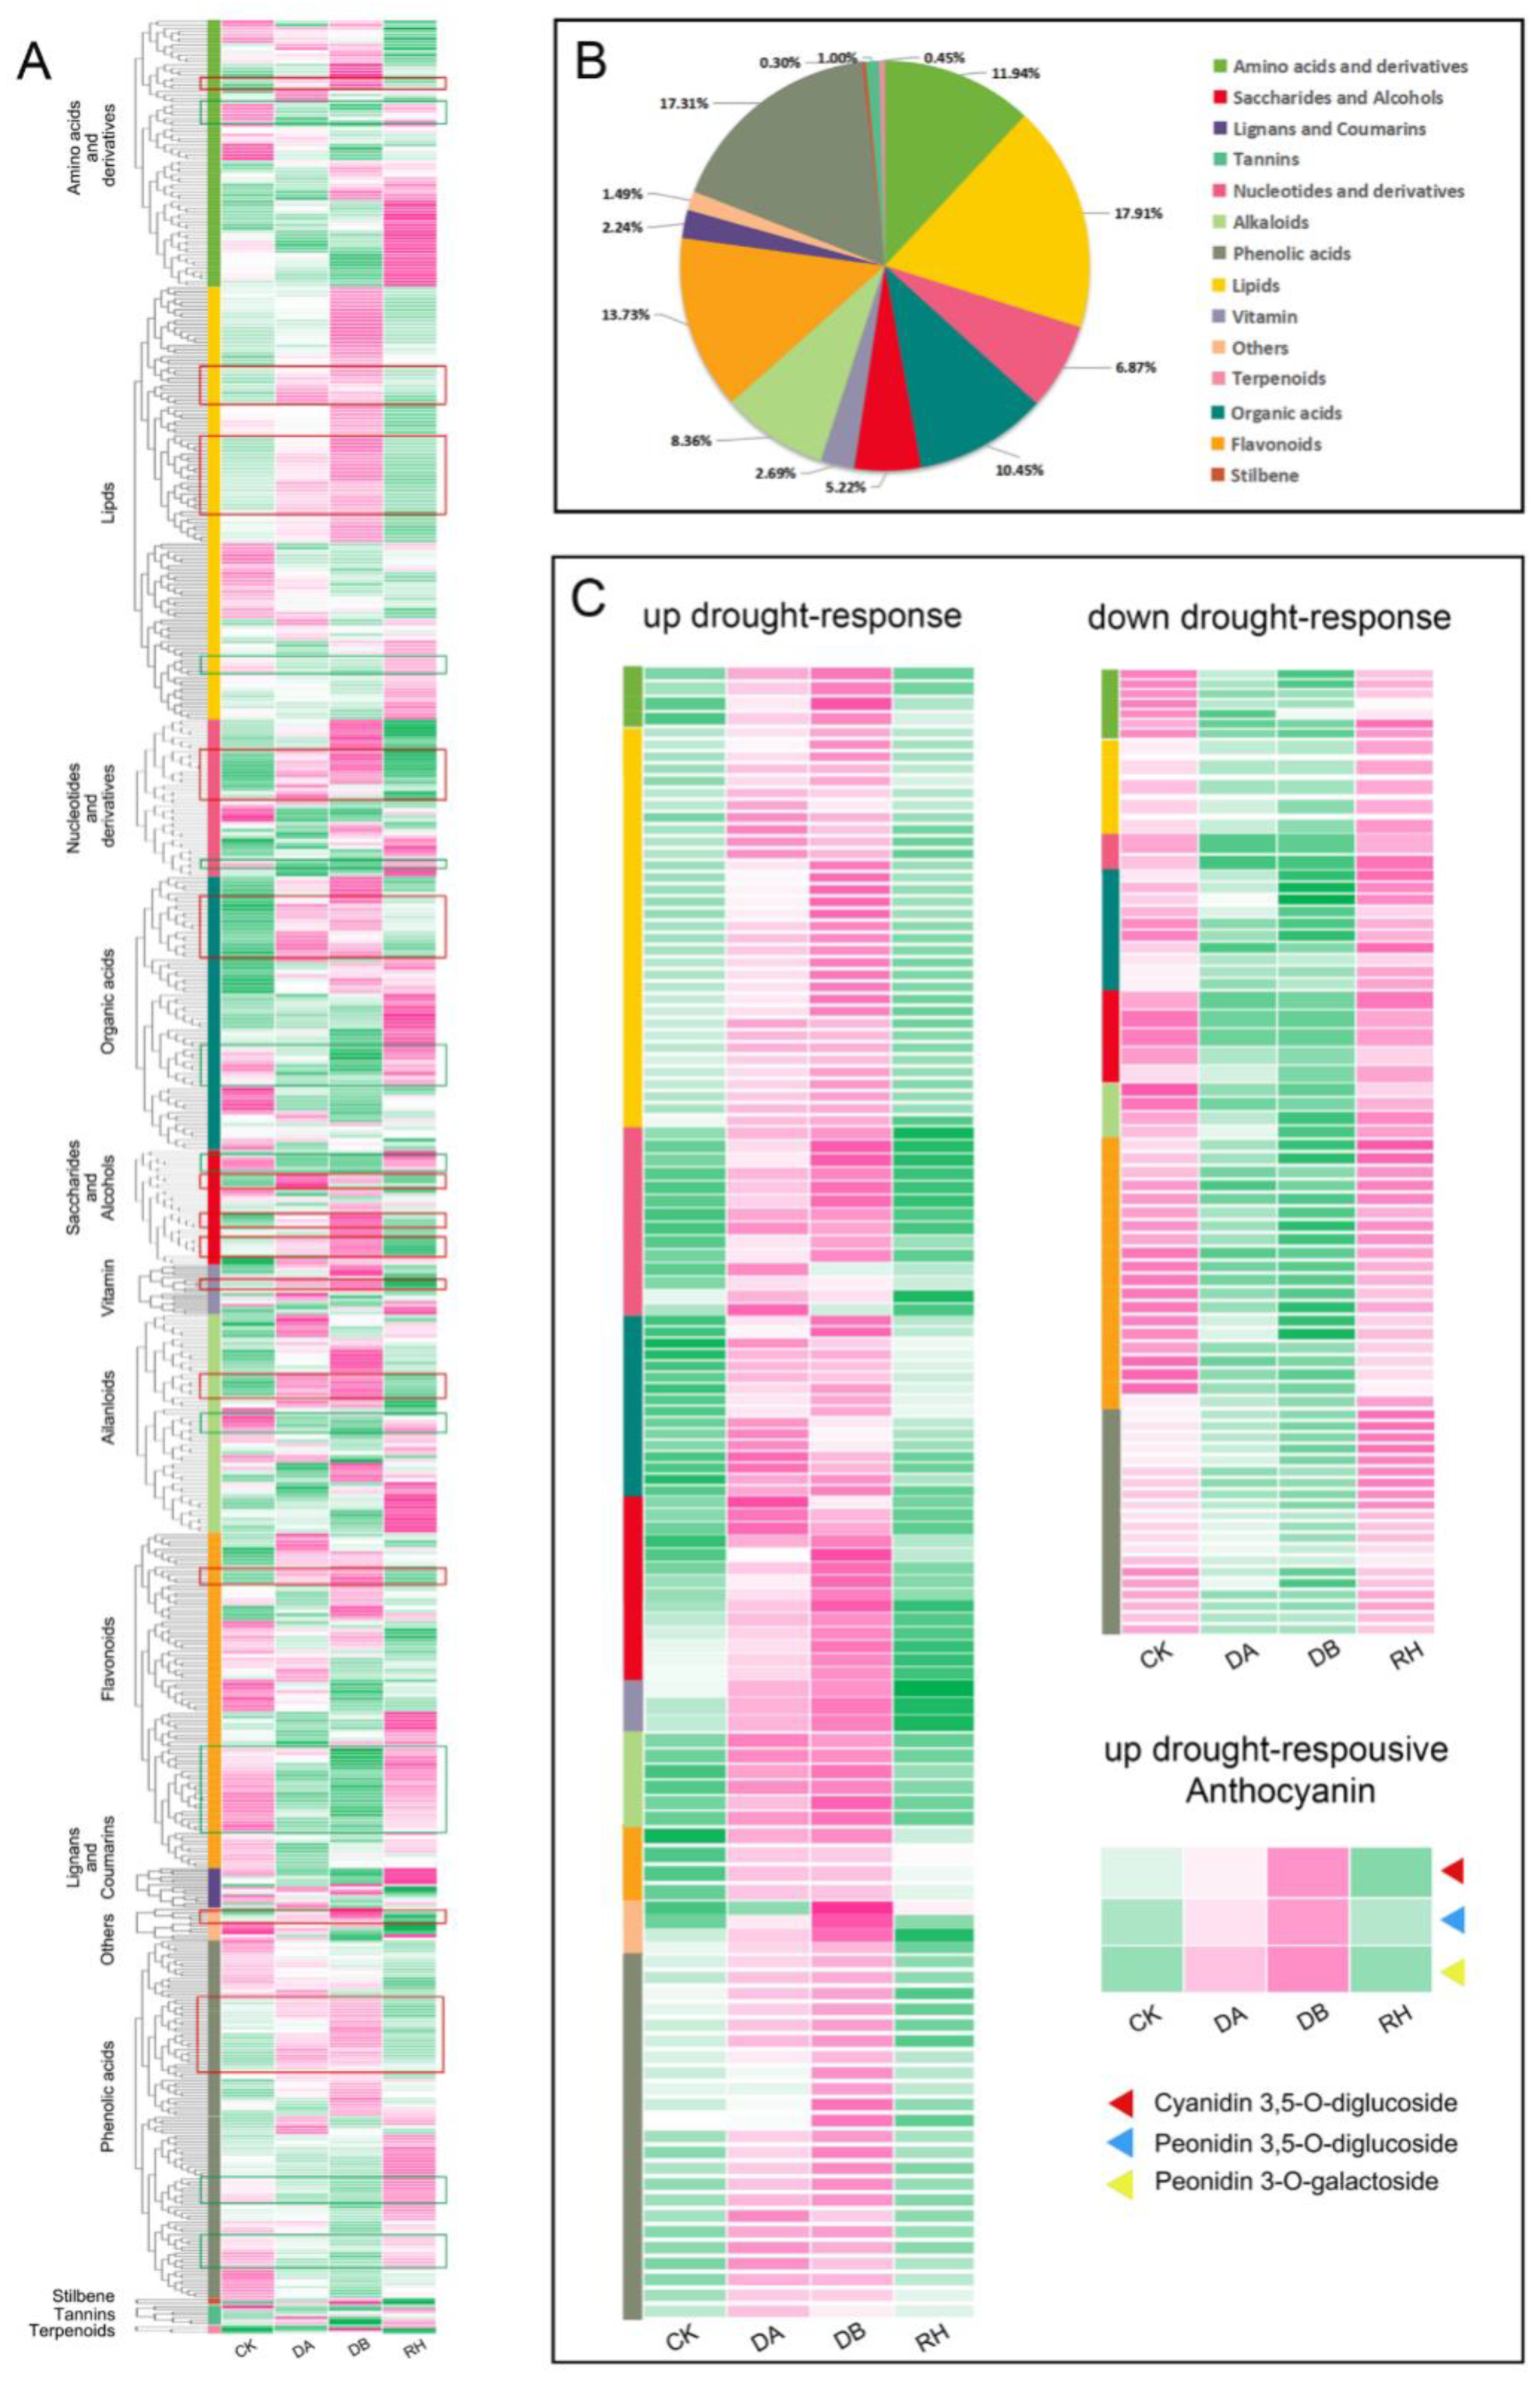
3.2. Characterisation of Drought-Responsive Metabolites in B. ciliata

The conspicuous physiochemical changes in ‘Qiuhong’ under different drought conditions prompted us to further investigate the correlation between their phenotype and metabolic profile. We used widely targeted LC-ESI-MS/MS-based metabolite profiling of ‘Qiuhong’ to explore possible correlations. In total, 684 metabolites were identified, classified into 11 groups, and included 14 anthocyanins mainly related to leaf hue (three cyanidins, three peonidins, three petunidins, two delphinidins, two malvidins, and one pelargonidin) (Figure 3A,B; Supplementary Table S1).
The differential accumulation of metabolites in ‘Qiuhong’ responding to drought treatment was visualised using heat maps. Our results showed that lipids, sugars, nucleotides, and vitamins dominated the upregulated metabolites during drought treatments. Conversely, the majority of downregulated metabolites were flavonoids, except for three anthocyanins (one cyanidin and two peonidins), which were upregulated, indicating that the accumulation of these anthocyanins was closely correlated with co-regulated metabolites, such as lipids and sugars (Figure 3C).
Additionally, the principal component analysis (PCA) of the metabolite data (the normalised responses were used, accounting for 52.99% of the variation with a significance level of 0.01) well separated 12 samples according to metabolite composition and content under drought treatments (DA and DB) or normal conditions (CK and RH) (Figure 4A).
To further identify which metabolites were the most important ones to the plant under drought conditions, we utilised radar comparative analysis between drought treatments and normal conditions based on the variable importance in projection (VIP) score. This showed that six compounds (p-coumaroyl putrescine, apigenin 6-C-glucoside, choline alfoscerate, abscisic acid, 3,6-di-O-caffeoyl glucose, and feruloylsinapoyltartaric acid) were the main contributing metabolites in both the DA and DB groups, implying their functional relevance to the drought responses of ‘Qiuhong’ (Figure 4B).

3.3. Multivariate Analysis of Metabolites Related to Drought Tolerance in ‘Qiuhong’

To further understand the metabolic changes in ‘Qiuhong’ during drought treatments, we divided all annotated metabolites into seven clusters based on their accumulation patterns using the k-means clustering algorithm. In these seven clusters, we identified metabolites that were enriched by drought treatments (clusters 2 and 7) and those whose contents decreased during this period (clusters 1 and 6). In addition, some compounds were specifically enriched in the CK (cluster 5) or RH (clusters 3 and 4) groups. Remarkably, predominately up-responsive metabolites were perfectly reflected by those in cluster 7 (Figure 5; Supplemental Table S2).
We then extended our multivariate analysis by performing a zoom-in comparison to identify potential key components contributing to drought tolerance in ‘Qiuhong’. In total, 290 differentially accumulated metabolites (DAMs) between drought treatments (DA and DB) and normal conditions (CK and RH) were screened out with previous criteria, of which 36 metabolites were consistently upregulated under the drought treatments, including one anthocyanin (peonidin 3-O-galactoside). Three compounds [p-coumaroyl putrescine (CoP), apigenin 6-C-glucoside (A6G), and β-nicotinamide mononucleotide (β-NMN)] were specifically upregulated in drought-treated ‘Qiuhong’, suggesting their critical function in the drought-response of ‘Qiuhong’. In contrast, two xanthines (a purine nucleotide) out of 29 metabolites were consistently downregulated under the drought treatments (Figure 6A,B; Supplemental Table S3). The functions of DAMs were further annotated using the KEGG compound database to determine the metabolic pathways that were most highly correlated with the resistance of ‘Qiuhong’ against drought treatments. It showed that the DAMs were mainly enriched in the following four pathways: lysine biosynthesis, starch and sucrose metabolism, pyruvate metabolism, and 2-oxocarboxylic acid metabolism (Figure 6B; Supplemental Table S4).

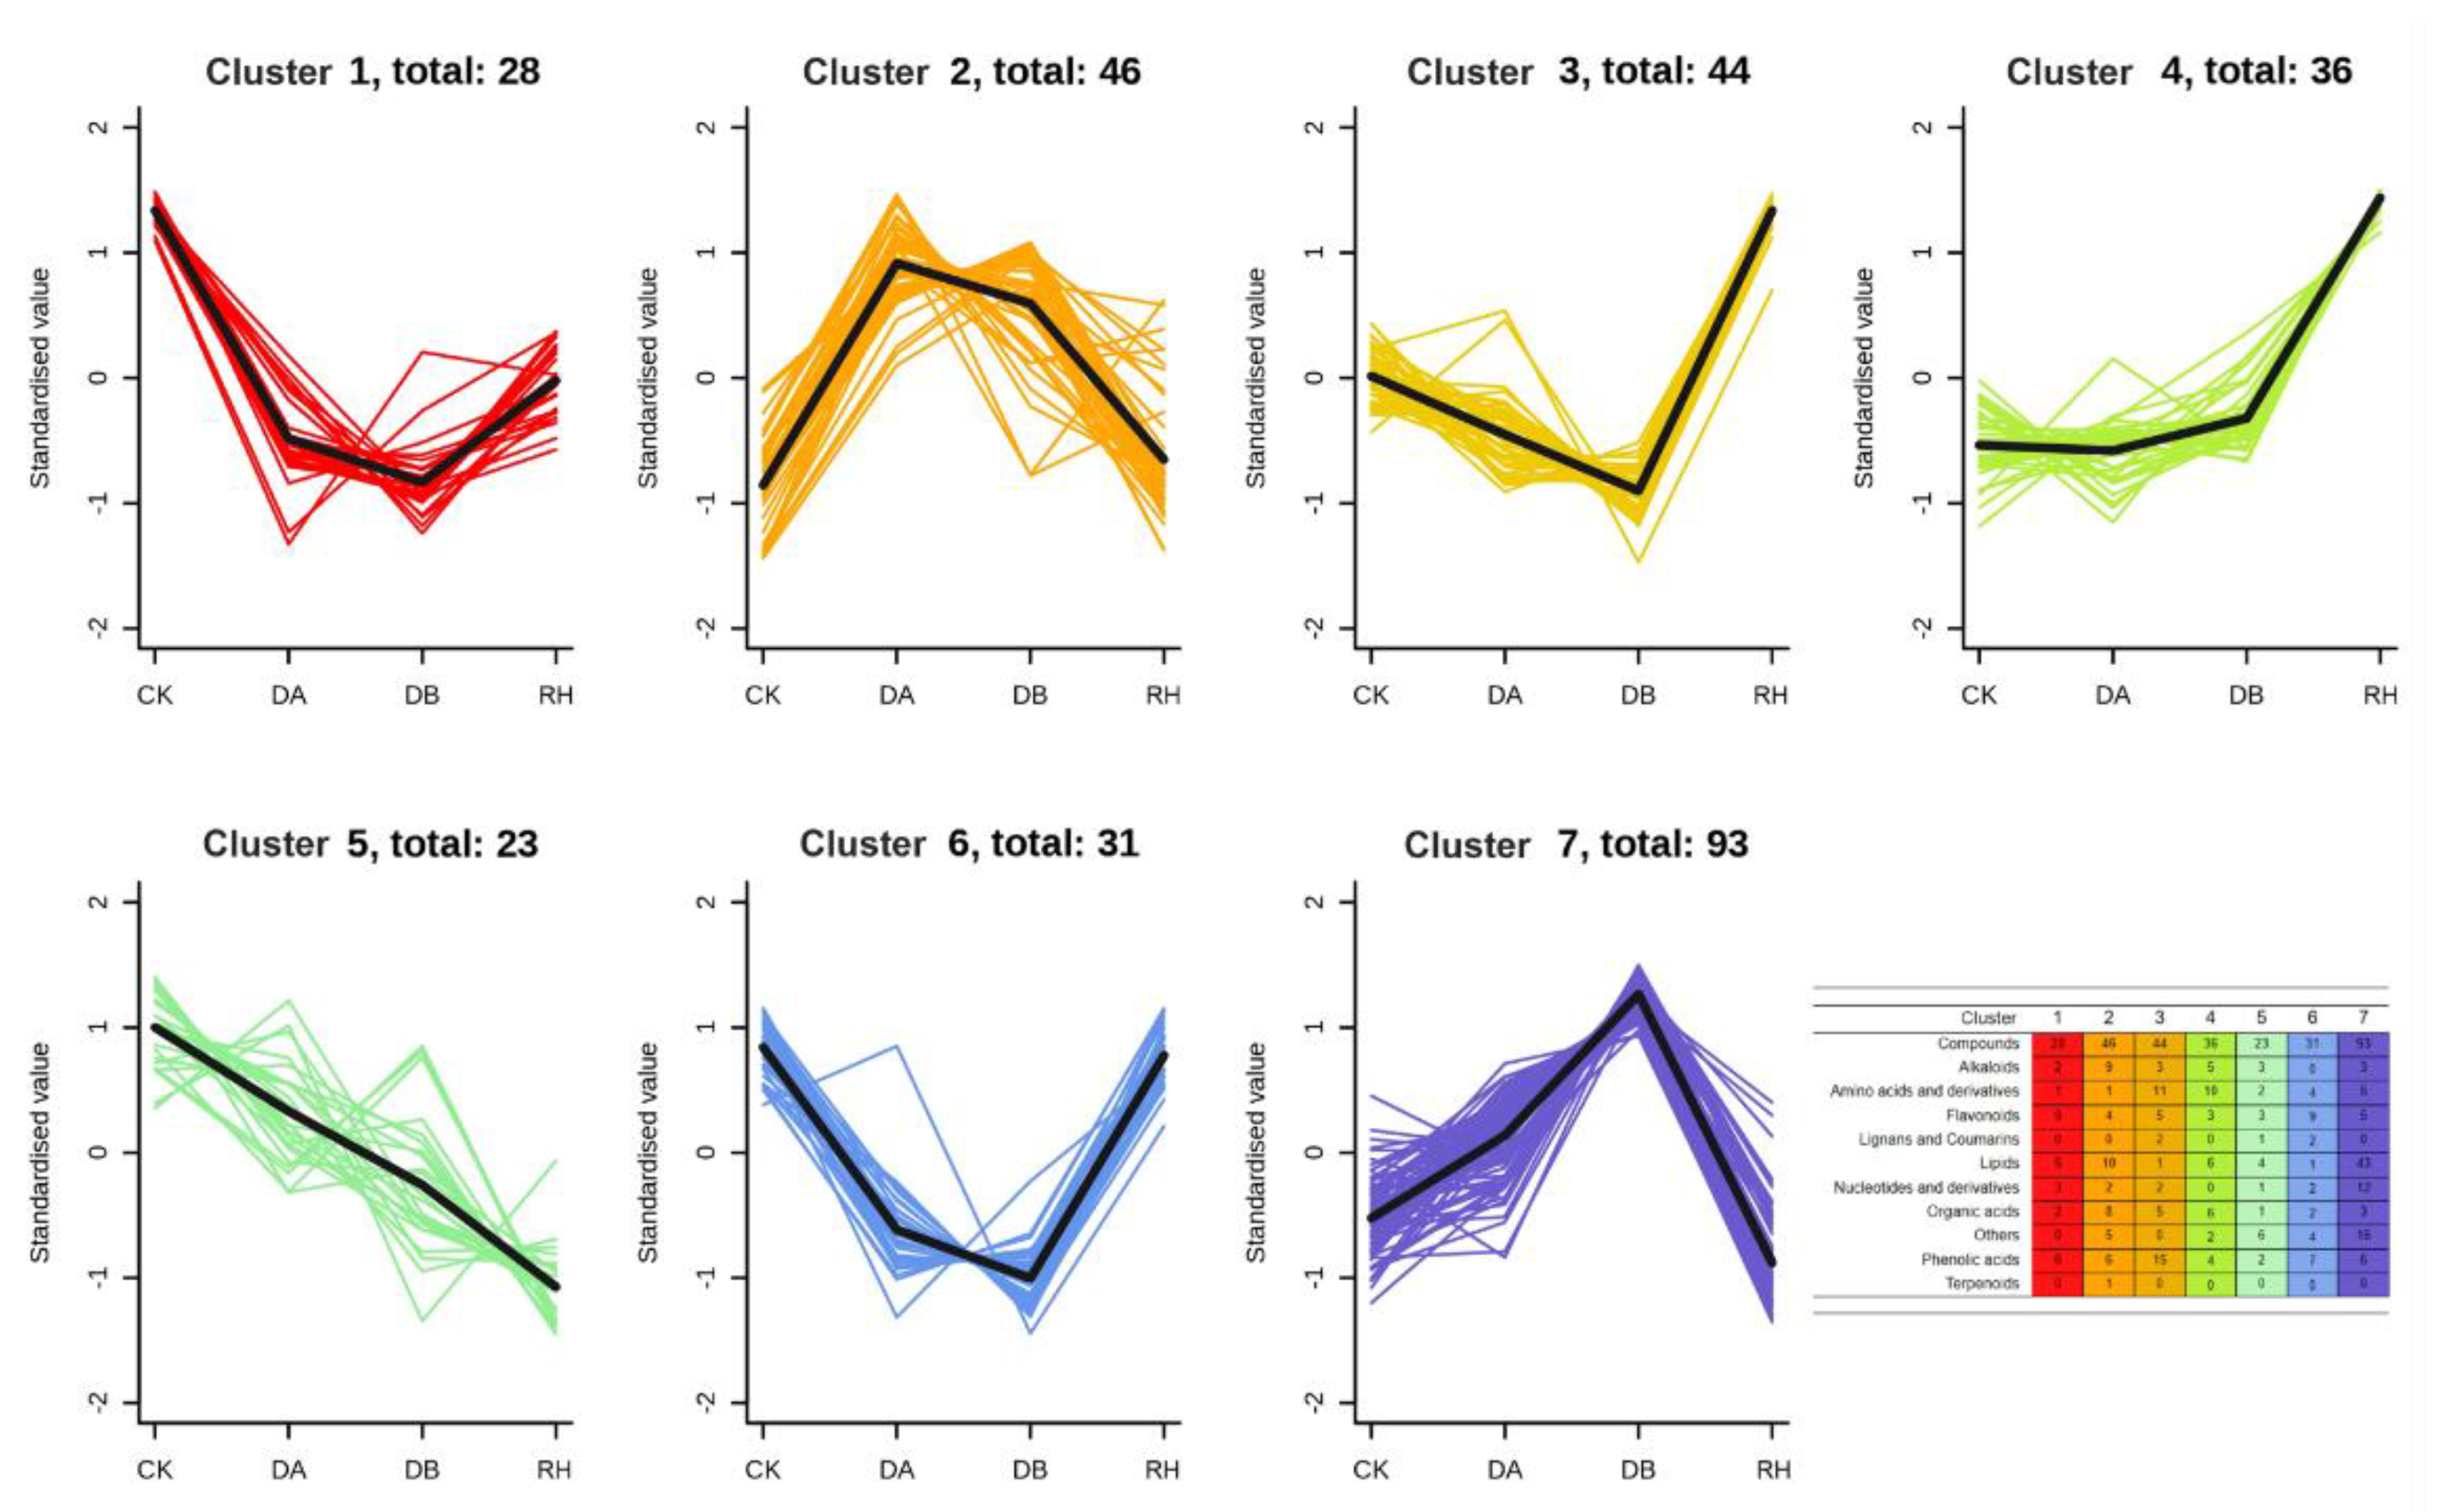
3.4. Global Metabolic Reprogramming Induced by Drought Treatments in ‘Qiuhong’

Global metabolic rewiring was also observed in ‘Qiuhong’ under drought conditions. Drought-induced alterations in the levels of phenolics, lipids, amino acids, sugars, and organic acids were interpreted in a global ‘metabolome view’. The metabolic dataset was assessed in a point-by-point manner using the KEGG database. The tentatively identified compounds were assigned to common metabolic pathways. It was revealed that the most significantly altered pathways in response to drought stress conditions included the citrate cycle (TCA) and purine metabolism, amongst others (Figure 7 and Figure 8). These results suggest that these altered pathways function to enhance drought tolerance. As shown in Figure 7, metabolites involved in TCA were dramatically activated in both DA and DB groups, containing citric acid, isocitric acid, ketoglutaric acid, succinic acid, and malic acid, which were proposed to provide accelerated energy to anti-drought stresses. Moreover, consistently induced two putrescine end-products might function in the process of drought response in ‘Qiuhong’. In the purine metabolism, two end-products (guanosine and xanthine) were strikingly reduced under drought stresses in spite of high accumulated intermediate adenosines, implying extra degradation of guanosine and xanthine could be a drought-defensing strategy of plants (Figure 8).

4. Discussion

Drought tolerance is undoubtedly one of the most widely studied characteristics of plants since drought stress severely restricts plant growth [25]. In addition, it was proved by whether a plant responds properly to drought stresses or not. Plants achieve homeostasis in detrimental growing conditions by undergoing a well-regulated response to drought signals at a very molecular level, including DNA, RNA, proteins, and metabolites, among which metabolites play a vital role in this process as they are directly involved in plant issue structure and metabolism, determining the final phenotype [26,27]. Therefore, understanding the drought stress adaption at the physiochemistry level requires a detailed investigation of the metabolome in drought-tolerant plant cultivars. In our previous study, we found that B. ciliata exhibits extraordinary drought tolerance, making it well-suited as groundcover or rooftop greenery [10,11]. Based on this, we selected the Belosynapsis cultivar ‘Qiuhong’ for metabolic analysis.
Drought stress-induced alteration occurs in several essential physiochemical processes reflected by various parameters, which was confirmed in this study. As expected, ROS scavengers, such as SOD, CAT, and MDA, were triggered in drought-treated plants, and their activity was positively correlated with periods of drought treatment. Moreover, osmolytes were activated to maintain water potential and turgor pressure (Figure 2) [7,28]. After visual observation and colourimetric characterisation, our results showed that anthocyanin caused a change in colour from green to purple-red leaves under drought treatments, which was consistent with previous studies on other plants, such as Arabidopsis, rice, cotton, wheat, and so on, as flavonoids are common and adaptable natural compounds that allow plants to scavenge ROS (Figure 1 and Figure 2) [7,28].
Under normal conditions, during the daytime, photosynthesis provides the plant with the majority of its energy, and at night, certain metabolites, primarily sugars and amino acids, drive the plant’s energy generation processes via glycolysis, the TCA cycle, and amino acid metabolism [29,30]. A reduced photosynthesis rate occurs once plants are subjected to drought stress, accompanied by convergent signal transduction associated with energy production that regulates the response of the plant metabolome to various stressors [31]. Similarly, we also confirmed a decline in several amino acids and sugars in drought-treated ‘Qiuhong’, of which phenylalanine and lysine, the main precursors of the shikimate pathway, were consistently downregulated (Figure 5 and Table S2). Nevertheless, the TCA cycle was activated, rather than depressed, by drought treatment (Figure 7). Similarly, the flavonoid biosynthesis pathway (via the shikimate pathway) was not mitigated either. Instead, several end-products in this pathway were adequately induced by drought (Supplementary Figure S2). Apart from purple-red hue renderers, highly accumulated cyanidins might act as powerful antioxidants along with other polyphenols to protect the plant from drought stress-induced oxidative damage [32,33,34].
The present study also revealed that a significantly high amount of xanthine and guanosine (two purine nucleotides) were degraded in the drought-treated leaves, along with amino acids and sugars, and their content levels decreased over the treatment period (Figure 5 and Figure 8 and Table S2). As shown in previous studies, the promotion of nucleotide biosynthesis provides ATP energy through drought stress [35,36]. Furthermore, purine degradation contributes to protective responses, such as synergistic activation of abscisic acid (ABA) metabolism and an accumulation of the cellular protectant proline for drought stress [37,38]. Moreover, previous studies have also shown that drought stress induces an increase in purine and pyrimidine degradation via the transcriptome or metabolome [39,40]. Thus, the current study indicated that the degradation of xanthine and guanosine contributes to the drought tolerance of ‘Qiuhong’ by producing energy and enhancing protective responses.
As a key phytohormone, ABA is able to mediate the drought stress response and resistance by regulating stomatal closure and drought-responsive gene expression [41,42]. In drought conditions, enhanced ABA is mainly accumulated in the vasculature of the plant leaves [43]. In this study, we also verified a significantly elevated level of ABA in drought-treated ‘Qiuhong’, implying that ABA-dependent regulatory systems are supposed to be recruited by ‘Qiuhong’ for drought responses. Of note, the production of three compounds [p-coumaroyl putrescine (CoP; m/z 235.14), apigenin 6-C-glucoside (A6G; m/z 431.10), and β-nicotinamide mononucleotide (β-NMN; m/z 335.06) was specifically induced in drought-treated ‘Qiuhong’ at a substantial level.
CoP is a phenolamide (PA) that has been proposed to protect plants from various harsh conditions, including drought stresses [44,45,46,47,48]. A6G, one of the end-products in flavone/flavonol biosynthetic pathways, is one of the co-pigments with anthocyanidins for colour stabilisation [49], and we proposed that A6G plays a role in stabilising purple-red coloration in ‘Qiuhong’. NMN, a bioactive nucleotide, is one of the intermediates in NAD+ biosynthesis pathways, and β-NMN is the active anomeric form of NMN [50]. β-NMN has been shown to be effective in high-fat, diet-induced type II diabetes therapy in animals [51] through reversing the mitochondrial dysfunction parallel with ageing [52] and the effect of age-associated declines in neural stem cells [53]. However, the role of NMN in plants remains largely unknown, despite a recent study that observed an enhanced resistance to the Fusarium head blight fungus in NMN-treated Arabidopsis and barley [54]. The unique, drought-induced NMN in ‘Qiuhong’ detected in this study suggests it also plays a role in the drought resistance of plants.

5. Conclusions

Understanding the changing metabolite compositions, such as those that benefit the quality of plant defences to environmental (in drought stress conditions) cues, includes understanding the activity of major regulators of drought resistance. Metabolomic analyses in this study provide information about the critical DAMs and global metabolic reprogramming induced by drought stress in ‘Qiuhong’. The integration of relevant DAMs (e.g., ABA, CoP, A6G, and β-NMN) involved in metabolic pathways during stress responses could underlie the drought-resistant mechanisms of ‘Qiuhong’ at a metabolic level. The reason plants accumulate specific compounds is still not fully understood, and the function of individual and combined substances could be a central question driving future research at a genetic level.

Supplementary Materials

The following supporting information can be downloaded at: https://0-www-mdpi-com.brum.beds.ac.uk/article/10.3390/agronomy12020466/s1, Figure S1: The moisture content of soil (MC) of ‘Qiuhong’ plants exposed to different periods of drought treatments. Different lower letters indicate significant differences at the p < 0.05 level according to Tukey’s test. Figure S2: Flavonoid biosynthesis pathways in ‘Qiuhong’ leaves. Table S1: Statistics of all detected and annotated metabolites in ‘Qiuhong’. Table S2: Seven k-means cluster according to their expression pattern under the different treatments. Table S3: Comparison of upregulated and downregulated metabolites between normal conditions (CK and RH) and drought treatments (DA and DB).

Author Contributions

Conceptualization, Y.L.; formal analysis, R.H., M.W., L.H., Y.S. (Yiting Su) and N.W.; investigation, B.Z., R.H. and M.W.; data curation, R.H. and M.W.; writing—original draft preparation, B.Z. and Y.L.; writing—review and editing, B.Z., R.H., M.W., W.G. and Y.L.; visualization, B.Z.; supervision, Y.L.; project administration, W.G.; funding acquisition, Y.S. (Yanjun Sun) and W.G. All authors have read and agreed to the published version of the manuscript.

Funding

This research was funded by the Shenzhen Municipal Science and Technology Project, grant number JSGG20191129141403814, and the Guangzhou Municipal Science and Technology Project, grant number 201803020013.

Acknowledgments

We would like to thank Wuhan MetWare Biotechnology for assistance with the metabolic data analysis.

Conflicts of Interest

The authors declare no conflict of interest. The funders had no role in the design of the study; in the collection, analyses, or interpretation of data; in the writing of the manuscript, or in the decision to publish the results.

Abbreviations

ABA:Abscisic Acid
ATP:Adenosine Triphosphate
CAD:Collision Activated Dissociation
CAT:Catalase Activity
CE:Collision Energy
CoP:p-Coumaroyl Putrescine
CUR:Curtain Gas
DAMs:Differentially Accumulated Metabolites
DP:Declustering Potential
ESI:Electrospray Ionization
GS I:Gas I
GS II:Gas II
HPLC:High-Performance Liquid Chromatography
IS:Ion Spray Voltage
KEGG:Kyoto Encyclopedia of Genes and Genomes
LC-ESI-MS/MS:Liquid Chromatography Coupled with ESI-Triple Quadrupole-Linear Ion Trap Mass Spectrometry
LIT:Linear Ion Trap
MC:Moisture Content
MDA:Malondialdehyde
MRM:Multiple Reaction Monitoring
MS:Mass Spectrometry
NAD+:Nicotinamide Adenine Dinucleotide
NBT:Nitroblue Tetrazolium
PA:Phenolamide
PCA:Principal Component Analysis
PLS-DA:Partial Least Squares-Discriminant Analysis
POD:Peroxidase Activity
QQQ:Triple Quadrupole
RH:Rehydration
ROS:Reactive Oxygen Species
SMs:Secondary Metabolites
SOD:Superoxide Dismutase
SPSS:Statistical Product and Service Solutions
TCA:Citrate Cycle
UV:Ultraviolet
VIP:Variable Importance in Projection

References

  1. McKay, J.K.; Richards, J.H.; Mitchell-Olds, T. Genetics of drought adaptation in Arabidopsis thaliana: I. Pleiotropy contributes to genetic correlations among ecological traits. Mol. Ecol. 2003, 12, 1137–1151. [Google Scholar] [CrossRef] [Green Version]
  2. Hussain, M.; Malik, M.A.; Farooq, M.; Ashraf, M.Y.; Cheema, M.A. Improving drought tolerance by exogenous application of glycinebetaine and salicylic acid in sunflower. J. Agron. Crop Sci. 2008, 194, 193–199. [Google Scholar] [CrossRef]
  3. Taiz, L.Z.E. Plant Physiology; Sinauer Associates: Sunderland, MA, USA, 2006. [Google Scholar]
  4. Verma, A.; Deepti, S. Abiotic stress and crop improvement: Current scenario. Adv. Plants Agric. Res. 2016, 4, 00149. [Google Scholar] [CrossRef] [Green Version]
  5. Ullah, A.; Manghwar, H.; Shaban, M.; Khan, A.H.; Akbar, A.; Ali, U.; Ali, E.; Fahad, S. Phytohormones enhanced drought tolerance in plants: A coping strategy. Environ. Sci. Pollut. Res. Int. 2018, 25, 33103–33118. [Google Scholar] [CrossRef]
  6. Yadav, B.; Jogawat, A.; Gnanasekaran, P.; Kumari, P.; Lakra, N.; Lal, S.K.; Pawar, J.; Narayan, O.P. An overview of recent advancement in phytohormones-mediated stress management and drought tolerance in crop plants. Plant Gene 2021, 25, 100264. [Google Scholar] [CrossRef]
  7. Jogawat, A.; Yadav, B.; Chhaya; Lakra, N.; Singh, A.K.; Narayan, O.P. Crosstalk between phytohormones and secondary metabolites in the drought stress tolerance of crop plants: A review. Physiol. Plant. 2021, 172, 1106–1132. [Google Scholar] [CrossRef] [PubMed]
  8. Khan, M.I.R.; Asgher, M.; Fatma, M.; Per, T.S.; Khan, N.A. Drought stress vis a vis plant functions in the era of climate change. Clim. Change Environ. Sustain. 2015, 3, 13–25. [Google Scholar] [CrossRef]
  9. Tardieu, F.; Parent, B.; Caldeira, C.F.; Welcker, C. Genetic and physiological controls of growth under water deficit. Plant Physiol. 2014, 164, 1628–1635. [Google Scholar] [CrossRef] [PubMed] [Green Version]
  10. Guo, W.; Xu, Y.; Wu, W.; Ye, Y.; Chen, P. The complete chloroplast genome sequence of Belosynapsis ciliata (Blume) R. S. Rao (Commelinaceae). Mitochondrial DNA Part B Resour. 2019, 4, 2373–2374. [Google Scholar] [CrossRef] [PubMed] [Green Version]
  11. Hong, D.; DeFilipps, R.A. Commelinaceae. In Flora of China; Wu, Z., Raven, P.H., Hong, D., Eds.; Science Press, Beijing and Missouri Botanical Garden Press: St. Louis, MO, USA, 2000; Volume 24, pp. 19–39. [Google Scholar]
  12. Xu, Y.; Yu, J.; Deng, L.; Guo, W.; Liu, P.; Ping, C.; Hong, L.; Hu, Z. Heat resistance research by Logisitic equation on four species of roof greening in Commelinaceae (In Chinese). J. Zhongkai Univ. Agric. Eng. 2018, 31, 52–55. [Google Scholar] [CrossRef]
  13. Yang, F.; Yang, T.; Liu, K.; Yang, Q.; Wan, Y.; Wang, R.; Li, G. Analysis of metabolite accumulation related to pod color variation of Caragana intermedia. Molecules 2019, 24, 717. [Google Scholar] [CrossRef] [Green Version]
  14. Zou, S.; Wu, J.; Shahid, M.Q.; He, Y.; Lin, S.; Liu, Z.; Yang, X. Identification of key taste components in loquat using widely targeted metabolomics. Food Chem. 2020, 323, 126822. [Google Scholar] [CrossRef] [PubMed]
  15. Chen, W.; Gong, L.; Guo, Z.; Wang, W.; Zhang, H.; Liu, X.; Yu, S.; Xiong, L.; Luo, J. A novel integrated method for large-scale detection, identification, and quantification of widely targeted metabolites: Application in the study of rice metabolomics. Mol. Plant 2013, 6, 1769–1780. [Google Scholar] [CrossRef] [Green Version]
  16. Li, X.; Zhou, R.; Xu, K.; Xu, J.; Jin, J.; Fang, H.; He, Y. Rapid determination of chlorophyll and pheophytin in green tea using fourier transform infrared spectroscopy. Molecules 2018, 23, 1010. [Google Scholar] [CrossRef] [Green Version]
  17. Hashimoto, F.; Tanaka, M.; Maeda, H.; Shimizu, K.; Sakata, Y. Characterization of cyanic flower color of delphinium cultivars. J. Jpn. Soc. Hortic. Sci. 2000, 69, 428–434. [Google Scholar] [CrossRef]
  18. Beauchamp, C.; Fridovich, I. Superoxide dismutase: Improved assays and an assay applicable to acrylamide gels. Anal. Biochem. 1971, 44, 276–287. [Google Scholar] [CrossRef]
  19. Alici, E.H.; Arabaci, G. Determination of SOD, POD, PPO and CAT enzyme activities in Rumex obtusifolius L. Annu. Res. Rev. Biol. 2016, 11, 1–7. [Google Scholar] [CrossRef]
  20. Aebi, H. Catalase in vitro. Methods Enzymol. 1984, 105, 121–126. [Google Scholar] [CrossRef]
  21. Wang, Q.; Su, Z.; Zhang, S.; Li, Y. Soluble sugar content of clonal plant Neosinocalamus affinis at module and ramet levels. J. Appl. Ecol. 2004, 15, 1994–1998. [Google Scholar] [CrossRef]
  22. Zhang, J.; Kirkham, M.B. Drought-stress-induced changes in activities of superoxide dismutase, catalase, and peroxidase in wheat species. Plant Cell Physiol. 1994, 35, 785–791. [Google Scholar] [CrossRef]
  23. Yuan, H.; Zeng, X.; Shi, J.; Xu, Q.; Wang, Y.; Jabu, D.; Sang, Z.; Nyima, T. Time-course comparative metabolite profiling under osmotic stress in tolerant and sensitive Tibetan hulless barley. Biomed. Res. Int. 2018, 2018, 9415409. [Google Scholar] [CrossRef] [PubMed] [Green Version]
  24. Howe, E.; Holton, K.; Nair, S.; Schlauch, D.; Sinha, R.; Quackenbush, J. MeV: MultiExperiment Viewer. In Biomedical Informatics for Cancer Research; Ochs, M.F., Casagrande, J.T., Davuluri, R.V., Eds.; Springer US: Boston, MA, USA, 2010; pp. 267–277. [Google Scholar]
  25. Chaves, M.M.; Flexas, J.; Pinheiro, C. Photosynthesis under drought and salt stress: Regulation mechanisms from whole plant to cell. Ann. Bot. 2009, 103, 551–560. [Google Scholar] [CrossRef] [PubMed] [Green Version]
  26. Kosová, K.; Vítámvás, P.; Urban, M.O.; Klíma, M.; Roy, A.; Prášil, I.T. Biological networks underlying abiotic stress tolerance in temperate crops—A proteomic perspective. Int. J. Mol. Sci. 2015, 16, 20913–20942. [Google Scholar] [CrossRef] [PubMed] [Green Version]
  27. Wang, X.; Cai, X.; Xu, C.; Wang, Q.; Dai, S. Drought-responsive mechanisms in plant leaves revealed by proteomics. Int. J. Mol. Sci. 2016, 17, 1706. [Google Scholar] [CrossRef] [Green Version]
  28. Yadav, B.; Jogawat, A.; Rahman, M.S.; Narayan, O.P. Secondary metabolites in the drought stress tolerance of crop plants: A review. Gene Rep. 2021, 23, 101040. [Google Scholar] [CrossRef]
  29. Galili, G. The aspartate-family pathway of plants: Linking production of essential amino acids with energy and stress regulation. Plant Signal. Behav. 2011, 6, 192–195. [Google Scholar] [CrossRef] [Green Version]
  30. Zhang, J.; Yang, D.; Li, M.; Shi, L. Metabolic profiles reveal changes in wild and cultivated soybean seedling leaves under salt stress. PLoS ONE 2016, 11, e0159622. [Google Scholar] [CrossRef] [PubMed] [Green Version]
  31. Baena-González, E.; Sheen, J. Convergent energy and stress signaling. Trends Plant Sci. 2008, 13, 474–482. [Google Scholar] [CrossRef] [Green Version]
  32. Quan, N.T.; Anh, L.H.; Khang, D.T.; Tuyen, P.T.; Toan, N.P.; Minh, T.N.; Minh, L.T.; Bach, D.T.; Ha, P.T.T.; Elzaawely, A.A. Involvement of secondary metabolites in response to drought stress of rice (Oryza sativa L.). Agriculture 2016, 6, 23. [Google Scholar] [CrossRef] [Green Version]
  33. Rice-Evans, C.; Miller, N.; Paganga, G. Antioxidant properties of phenolic compounds. Trends Plant Sci. 1997, 2, 152–159. [Google Scholar] [CrossRef]
  34. Sarker, U.; Oba, S. Drought stress enhances nutritional and bioactive compounds, phenolic acids and antioxidant capacity of Amaranthus leafy vegetable. BMC Plant Biol. 2018, 18, 258. [Google Scholar] [CrossRef] [Green Version]
  35. Gong, P.; Zhang, J.; Li, H.; Yang, C.; Zhang, C.; Zhang, X.; Khurram, Z.; Zhang, Y.; Wang, T.; Fei, Z.; et al. Transcriptional profiles of drought-responsive genes in modulating transcription signal transduction, and biochemical pathways in tomato. J. Exp. Bot. 2010, 61, 3563–3575. [Google Scholar] [CrossRef] [PubMed]
  36. Stasolla, C.; Katahira, R.; Thorpe, T.A.; Ashihara, H. Purine and pyrimidine nucleotide metabolism in higher plants. J. Plant Physiol. 2003, 160, 1271–1295. [Google Scholar] [CrossRef]
  37. Watanabe, S.; Kounosu, Y.; Shimada, H.; Sakamoto, A. Arabidopsis xanthine dehydrogenase mutants defective in purine degradation show a compromised protective response to drought and oxidative stress. Plant Biotechnol. 2014, 31, 173–178. [Google Scholar] [CrossRef] [Green Version]
  38. Watanabe, S.; Matsumoto, M.; Hakomori, Y.; Takagi, H.; Shimada, H.; Sakamoto, A. The purine metabolite allantoin enhances abiotic stress tolerance through synergistic activation of abscisic acid metabolism. Plant Cell Environ. 2014, 37, 1022–1036. [Google Scholar] [CrossRef] [Green Version]
  39. Das, A.; Rushton, P.J.; Rohila, J.S. Metabolomic profiling of soybeans (Glycine max L.) reveals the importance of sugar and nitrogen metabolism under drought and heat stress. Plants 2017, 6, 21. [Google Scholar] [CrossRef] [PubMed] [Green Version]
  40. Liu, S.C.; Jin, J.Q.; Ma, J.Q.; Yao, M.Z.; Ma, C.L.; Li, C.F.; Ding, Z.T.; Chen, L. Transcriptomic analysis of tea plant responding to drought stress and recovery. PLoS ONE 2016, 11, e0147306. [Google Scholar] [CrossRef] [PubMed]
  41. Takahashi, F.; Kuromori, T.; Urano, K.; Yamaguchi-Shinozaki, K.; Shinozaki, K. Drought stress responses and resistance in plants: From cellular responses to long-distance intercellular communication. Front. Plant. Sci. 2020, 11. [Google Scholar] [CrossRef]
  42. You, J.; Zhang, Y.; Liu, A.; Li, D.; Wang, X.; Dossa, K.; Zhou, R.; Yu, J.; Zhang, Y.; Wang, L.; et al. Transcriptomic and metabolomic profiling of drought-tolerant and susceptible sesame genotypes in response to drought stress. BMC Plant Biol. 2019, 19, 267. [Google Scholar] [CrossRef] [Green Version]
  43. Kuromori, T.; Seo, M.; Shinozaki, K. ABA transport and plant water stress responses. Trends Plant Sci. 2018, 23, 513–522. [Google Scholar] [CrossRef]
  44. Back, K.; Jang, S.M.; Lee, B.C.; Schmidt, A.; Strack, D.; Kim, K.M. Cloning and characterization of a hydroxycinnamoyl-CoA:tyramine N-(hydroxycinnamoyl)transferase induced in response to UV-C and wounding from Capsicum annuum. Plant Cell Physiol. 2001, 42, 475–481. [Google Scholar] [CrossRef] [PubMed] [Green Version]
  45. Izaguirre, M.M.; Mazza, C.A.; Svatos, A.; Baldwin, I.T.; Ballaré, C.L. Solar ultraviolet-B radiation and insect herbivory trigger partially overlapping phenolic responses in Nicotiana attenuata and Nicotiana longiflora. Ann. Bot. 2007, 99, 103–109. [Google Scholar] [CrossRef] [PubMed] [Green Version]
  46. Kaur, H.; Heinzel, N.; Schöttner, M.; Baldwin, I.T.; Gális, I. R2R3-NaMYB8 regulates the accumulation of phenylpropanoid-polyamine conjugates, which are essential for local and systemic defense against insect herbivores in Nicotiana attenuata. Plant Physiol. 2010, 152, 1731–1747. [Google Scholar] [CrossRef] [PubMed] [Green Version]
  47. Martin-Tanguy, J. The occurrence and possible function of hydroxycinnamoyl acid amides in plants. Plant Growth Regul. 1985, 3, 381–399. [Google Scholar] [CrossRef]
  48. Stoessl, A.; Unwin, C.H. The antifungal factors in barley. V. antifungal activity of the hordatines. Can. J. Bot. 1970, 48, 465–470. [Google Scholar] [CrossRef]
  49. Zhang, Y.; Butelli, E.; Martin, C. Engineering anthocyanin biosynthesis in plants. Curr. Opin. Plant Biol. 2014, 19, 81–90. [Google Scholar] [CrossRef]
  50. Poddar, S.K.; Sifat, A.E.; Haque, S.; Nahid, N.A.; Chowdhury, S.; Mehedi, I. Nicotinamide mononucleotide: Exploration of diverse therapeutic applications of a potential molecule. Biomolecules 2019, 9, 34. [Google Scholar] [CrossRef] [Green Version]
  51. Yoshino, J.; Mills, K.F.; Yoon, M.J.; Imai, S.I. Nicotinamide mononucleotide, a key NAD+ intermediate, treats the pathophysiology of diet- and age-induced diabetes in mice. Cell Metab. 2011, 14, 528–536. [Google Scholar] [CrossRef] [Green Version]
  52. Gomes, A.P.; Price, N.L.; Ling, A.J.; Moslehi, J.J.; Montgomery, M.K.; Rajman, L.; White, J.P.; Teodoro, J.S.; Wrann, C.D.; Hubbard, B.P.; et al. Declining NAD(+) induces a pseudohypoxic state disrupting nuclear-mitochondrial communication during aging. Cell 2013, 155, 1624–1638. [Google Scholar] [CrossRef] [Green Version]
  53. Stein, L.R.; Imai, S. Specific ablation of Nampt in adult neural stem cells recapitulates their functional defects during aging. EMBO J. 2014, 33, 1321–1340. [Google Scholar] [CrossRef] [Green Version]
  54. Ueda, K.; Nakajima, Y.; Inoue, H.; Kobayashi, K.; Nishiuchi, T.; Kimura, M.; Yaeno, T. Nicotinamide mononucleotide potentiates resistance to biotrophic invasion of fungal pathogens in barley. Int. J. Mol. Sci. 2021, 22, 2696. [Google Scholar] [CrossRef] [PubMed]
Figure 1. Phenotypic comparison of B. ciliata ‘Qiuhong’ leaves with or without drought treatments. (A) Adaxial blade leaves under the different treatments (Control, CK; 15-day drought treatment, DA; 30-day drought treatment, DB; rehydration after DB, RH). (B) Abaxial blade leaves under the different treatments of CK, DA, DB, and RH. Scale bars = 1 cm.
Agronomy 12 00466 g001
Figure 2. Changes in the physiological traits of B. ciliata ‘Qiuhong’ leaves under different drought treatments. (A) Content of chlorophyll; (B) Content of carotenoid; (C) Content of anthocyanin; (D) Content of soluble sugar; (E) Content of soluble protein; (F) Superoxide dismutase (SOD) activity; (G) Peroxidase (POD) activity; (H) Catalase (CAT) activity; (I) Content of malondialdehyde (MDA); (J) Electrical conductivity. The x-axis corresponds to the control (CK), 15-day drought treatment (DA), 30-day drought treatment (DB), and rehydration (RH) groups. Data represent the mean ± SD (n = 3). Different lower letters indicate significant differences at the p < 0.05 level according to Tukey’s test.
Agronomy 12 00466 g002
Figure 3. Analysis of metabolite profiles of ‘Qiuhong’ leaves under four different treatments. (A) Heat map visualisation of 14 categories of metabolites. The content of each metabolite was normalised by Z-transformation. (B) Pie graph representing the percentage composition of the 14 metabolite categories. (C) Drought responsive metabolites; the drought-induced anthocyanins are highlighted at the bottom right. The metabolites in red and green rectangles in (A) correspond to up- and downregulated drought-responsive metabolites in (C), respectively. Data were plotted by TBtools (Toolbox for biologists) V0.67.
Agronomy 12 00466 g003
Figure 4. Multivariate statistical analyses of the differences in metabolites in ‘Qiuhong’ leaves among the control (CK), 15-day drought treatment (DA), 30-day drought treatment (DB), and rehydrated (RH) groups. The metabolite analysis in ‘Qiuhong’ under different treatments. (A) Principal component analysis (PCA) of metabolic profiles. (B) Radar charts showing the top 20 metabolites that contribute to separate samples between normal conditions (CK and RH) and drought treatments (DA and DB). The compounds surrounded by rectangles indicate the compounds that were common to all four charts. Data were plotted by Origin 2021.
Agronomy 12 00466 g004
Figure 5. K-means cluster analysis of the metabolites that were grouped into seven clusters according to their expression pattern under the different treatments. The x-axis corresponds to the control (CK), 15-day drought treatment (DA), 30-day drought treatment (DB), and rehydration (RH) groups. The y-axis corresponds to the standardised value. Data were plotted using the prcomp function in R software with default settings [24]. The amount in each category of compounds among seven clusters was indicated in the lower right pane.
Agronomy 12 00466 g005
Figure 6. Comparison of upregulated and downregulated metabolites between normal conditions (CK and RH) and drought treatments (DA and DB). (A) Venn diagrams of significantly upregulated (red bars) and significantly downregulated (green bars) metabolites in ‘Qiuhong’ plants exposed to different periods of drought treatments. (B) Upper profiles are bubble plots of the KEGG enrichment pathways of DAMs between normal conditions and drought treatments. Lower profiles are the top 10 up- and downregulated DAMs. Red bars indicate upregulated DAMs. Green bars indicate downregulated DAMs. Data were plotted using TBtools (Toolbox for biologists) V0.67.
Agronomy 12 00466 g006
Figure 7. Comparative analysis of metabolites involved in amino acid pathways and the tricarboxylic acid cycle (TCA) among the control (CK), 15-day drought treatment (DA), 30-day drought treatment (DB), and rehydration (RH) groups. The contents of compounds in CK, DA, DB, and RH detected by GC-MS analysis are represented in the heatmaps, whereas those shown as circles were undetectable. The regular triangles in red and inverted triangles in green above the heatmaps indicate the metabolites that were upregulated and downregulated, respectively, in DA and DB. The different coloured arrows between metabolites represent the different pathways, to which the metabolites belonged.
Agronomy 12 00466 g007
Figure 8. Comparison of metabolites involved in purine metabolism among the control (CK), 15-day drought treatment (DA), 30-day drought treatment (DB), and rehydration (RH) groups.
Agronomy 12 00466 g008
Publisher’s Note: MDPI stays neutral with regard to jurisdictional claims in published maps and institutional affiliations.

