Article

Characterization of Flowering Time in Genebank Accessions of Grain Amaranths and Their Wild Relatives Reveals Signatures of Domestication and Local Adaptation

Institute of Plant Breeding, Seed Science and Population Genetics, University of Hohenheim, 70599 Stuttgart, Germany
*
Author to whom correspondence should be addressed.
Submission received: 28 January 2022 / Revised: 14 February 2022 / Accepted: 16 February 2022 / Published: 17 February 2022

Abstract

:
Grain amaranths (Amaranthus spp.) are ancient crops from the Americas that are consumed as pseudo-cereals and vegetables. Two grain amaranths, A. cruentus and A. hypochondriacus, originated in Central America, and A. caudatus in South America. Flowering time variation plays a central role in their uses as seed, vegetable and biomass crops. We characterized phenotypic variation for plant height, flowering time and seed setting among 253 genebank accessions including three grain and two wild ancestor species (A. hybridus and A. quitensis) in the temperate climatic and long-day conditions of Germany. Among grain amaranths, A. cruentus flowered early and 88% of the accessions set seed. A. hypochondriacus accessions were mildly or highly photoperiod-sensitive with a lower proportion of seed setting (31%). A. caudatus accessions were mildly photoperiod-sensitive and failed seed production. Photoperiod-insensitive accessions set seed regardless of their origin, and mildly photoperiod-sensitive accessions set seed if they originated from regions with higher temperatures. Overall, Central American accessions of both wild and domesticated amaranths showed large variation in flowering time and photoperiod sensitivity, whereas variation among South American wild and domesticated amaranths was limited to mild photoperiod sensitivity. This observation is consistent with a model of independent domestication in Central and South America, and suggests a potential Central American origin of A. hybridus followed by migration to and selection against high photoperiod sensitivity in South America. Our results provide useful information for the design of breeding programs for different uses, and provide insights into grain amaranth domestication by considering flowering time as an adaptive trait.

1. Introduction

Flowering time plays a central role in the environmental adaptation and agricultural productivity of crops. Two main factors that determine flowering timing are photoperiod and temperature [1]. Photoperiod is a more useful indicator of crop season compared to temperature because it is more stable across years [2], whereas temperature controls the rate of development [3] and is more variable across years. For short-day crops such as maize and soybean, early-flowering varieties with little or no photoperiod sensitivity are grown for grain production at high latitudes, such as in northern Europe and North America, because of the short duration of favorable temperatures [4,5]. Insensitivity to photoperiod ensures uniform phenological development across a range of different growing environments [6], while short-day cultivars with high photoperiod sensitivity delay flowering under long photoperiods, resulting in prolonged vegetative growth and higher biomass accumulation. This trait is exploited in the breeding and cultivation of bioenergy crops such as maize and sorghum to achieve high dry matter yield for improved methane yield for heat and power generation in biogas plants [7]. Overall, there is a close relationship between flowering time and the different uses of a crop, such as grain or biomass yield, especially for annual field crops. The genus Amaranthus harbors more than 60 species, of which the majority are wild species and are well known as weeds in crop production areas. In addition, there is a small number of cultivated amaranth species for grain and vegetable use [8,9,10,11]. In the recent past, interest in amaranths has been growing because of their high nutritional qualities, their capability of growing under dry and marginal areas, and their potential as silage and bioenergy crops. The three species of domesticated grain amaranths are ancient crops in South (A. caudatus L.) and Central America (A. cruentus L., and A. hypochondriacus L.). Their grains are characterized by high protein and lysine contents, and they are of interest as an alternative diet for patients with celiac disease because they are gluten-free [12,13]. Other amaranth species such as A. tricolor and A. dubius are commonly used as a vegetable in tropical regions of the Americas, Africa, and Asia [9,14]. The grain amaranth species use the C4 photosynthetic pathway, and their economical water use provides an advantage in coping with drought stress [15,16]. A comparison of maize and amaranth for biogas production in the temperate Central European climate showed that amaranth exhibited a higher drought tolerance, even though maize was superior in biogas yield components [16]. The grain amaranths are mainly self-fertilizing plants with a rate of out-crossing between 3 to 32% [17,18].
Grain amaranths are predominately short-day crops because of their provenance in the tropics. However, a large photoperiodic variation was reported in parallel with their large distribution area [19]. Under the long-day conditions of temperate Central Europe, photoperiod-sensitive amaranth genotypes delay flowering and display elongated vegetative growth. This observation prompted the evaluation of the biomass potential of amaranth in the context of biogas production, which revealed a promising performance and a potential for future improvement [16,20,21,22,23,24,25]. In addition, amaranth can be used as a silage crop in both tropical and temperate regions, for which a high biomass is advantageous [14]. Recently, we reported two contrasting growth patterns in amaranth under long-day conditions; a grain-type amaranth cultivar showed early flowering and short plant height, suggesting photoperiod insensitivity, while biomass-type amaranths showed delayed or no flowering and reached a tall plant height, suggesting the effect of short-day genes [26]. Kulakow and Jain [27] postulated that flowering time in amaranth is controlled by three major genes, with a single gene controlling reduced vegetative growth and two genes controlling photoperiodic response in multiple backcross-derived populations between A. cruentus and the wild relative A. retroflexus. Wu et al. [19] tested 229 accessions of 20 amaranth species at two contrasting sites in China, and Andini et al. [28] tested 69 accessions of nine amaranth species at a single site in Japan under four different growing seasons with different photoperiods. Both studies found substantial photoperiodic variation in their diversity panels, each representing a large number of countries of origin and including the three grain amaranths as well as the wild putative ancestor species A. hybridus. A few studies examined the agricultural production and adaptive potential of amaranth for these different uses, such as seed and biomass production, under a variety of contrasting environments in Europe, ranging from the Mediterranean to temperate climates, but often using a very limited number of genotypes [29,30]. In a study looking at the dual-use of amaranth as seed and vegetable, all of seven tested cultivars of the three major grain species set seed in field experiments that were conducted in different environments with very distant latitudes, such as Denmark (55° N) and Mexico (17° N) [30]. Overall, these studies showed that amaranth has potential for both seed and biomass production in high-contrast environments in Europe.
The Amaranthus subgenus of Amaranthus genus includes the hybridus complex, which consists of the three grain-type amaranths (A. caudatus L., A. cruentus L., and A. hypochondriacus L.) and their two putative wild ancestor species (A. hybridus L. and A. quitensis Kunth) [31,32,33]. Of the species within the hybridus complex, A. cruentus and A. hypochondriacus originate from Central America, the former being considered the most photoperiod-insensitive grain amaranth species [14]. A. caudatus is a short-day species native to the high altitudes of the Andean highlands in South America. It has become adapted to lower temperatures and tends to mature late in temperate zones [8,9,14,34]. Among the wild ancestor species, A. hybridus shows a very wide distribution across North, Central, and South America, while A. quitensis is restricted to South America and might have been involved in the domestication of A. caudatus [8].
The availability of an A. hypochondriacus reference genome [35], and subsequent population genetic analyses, provided new evidence on the evolutionary history and domestication of grain amaranths. A first model with support from genetic polymorphism data postulated that A. hybridus is the most diverse wild ancestor and at least two grain amaranth species evolved from this wild ancestor [33]. Kietlinksi et al. [33] studied genetic diversity of the hybridus complex using 11 microsatellite markers and suggested that all three grain amaranth species have evolved from A. hybridus based on its pattern and levels of nucleotide diversity. In addition, they postulated two scenarios in which (i) A. hybridus was domesticated once in Mesoamerica or in the Andes and a subsequent geographic expansion and separation of that domesticate led to the origins of A. caudatus and A. hypochondriacus, or (ii) a single A. hybridus lineage ranging from Mesoamerica to the Andes was domesticated twice, leading to the independent origins of A. caudatus and A. hypochondriacus. Stetter and Schmid [32] and Stetter et al. [31] also reported a high nucleotide diversity in A. hybridus. Population structure inference of the hybridus complex using genotyping-by-sequencing and whole-genome sequencing, respectively, supported the hypothesis that the three grain amaranth species independently domesticated from different subpopulations of A. hybridus [31,32]. The population structure of both the wild ancestor and the domesticates is more strongly determined by geographic than taxonomic separation because each of the three grain species clustered with the wild ancestors from the same geographical region based on SNP markers in principal component analysis [31,32].
Although previous studies have demonstrated flowering time variations among species of the hybridus complex, the extent and distribution according to taxonomic or geographical aspects is unknown. Potential sources of useful genetic variation, such as specific latitudinal regions or species within the hybridus complex, are undetermined, which may be useful for an enhanced local adaptation and further crop improvement. Amaranth can be adapted to a wide range of environmental conditions in temperate climates, but how the multiple environmental factors at the center of origin shape adaptive variation and influence the plant adaptation in temperate climates has not yet been studied. In addition, the evolutionary processes associated with variability in photoperiodic responses during flowering time adaptation have not been characterized in amaranth, which may provide information on the domestication history of grain amaranths. In this study, we conducted a field trial in Central Europe with a large panel of genetically diverse genebank accessions of grain amaranths and their wild relatives. Our objectives were to: (i) identify genebank accessions suitable for grain or biomass breeding programs; (ii) characterize the phenotypic traits and environmental variables in terms of categorically determined latitudinal groups and species; (iii) study the relationships between phenotypic traits and the environmental variables to understand how the environmental variables affect phenotypic variation; and (iv) address how these findings contribute to an understanding of the domestication history of grain amaranths and the design of amaranth breeding programs for temperate climates.

2. Materials and Methods
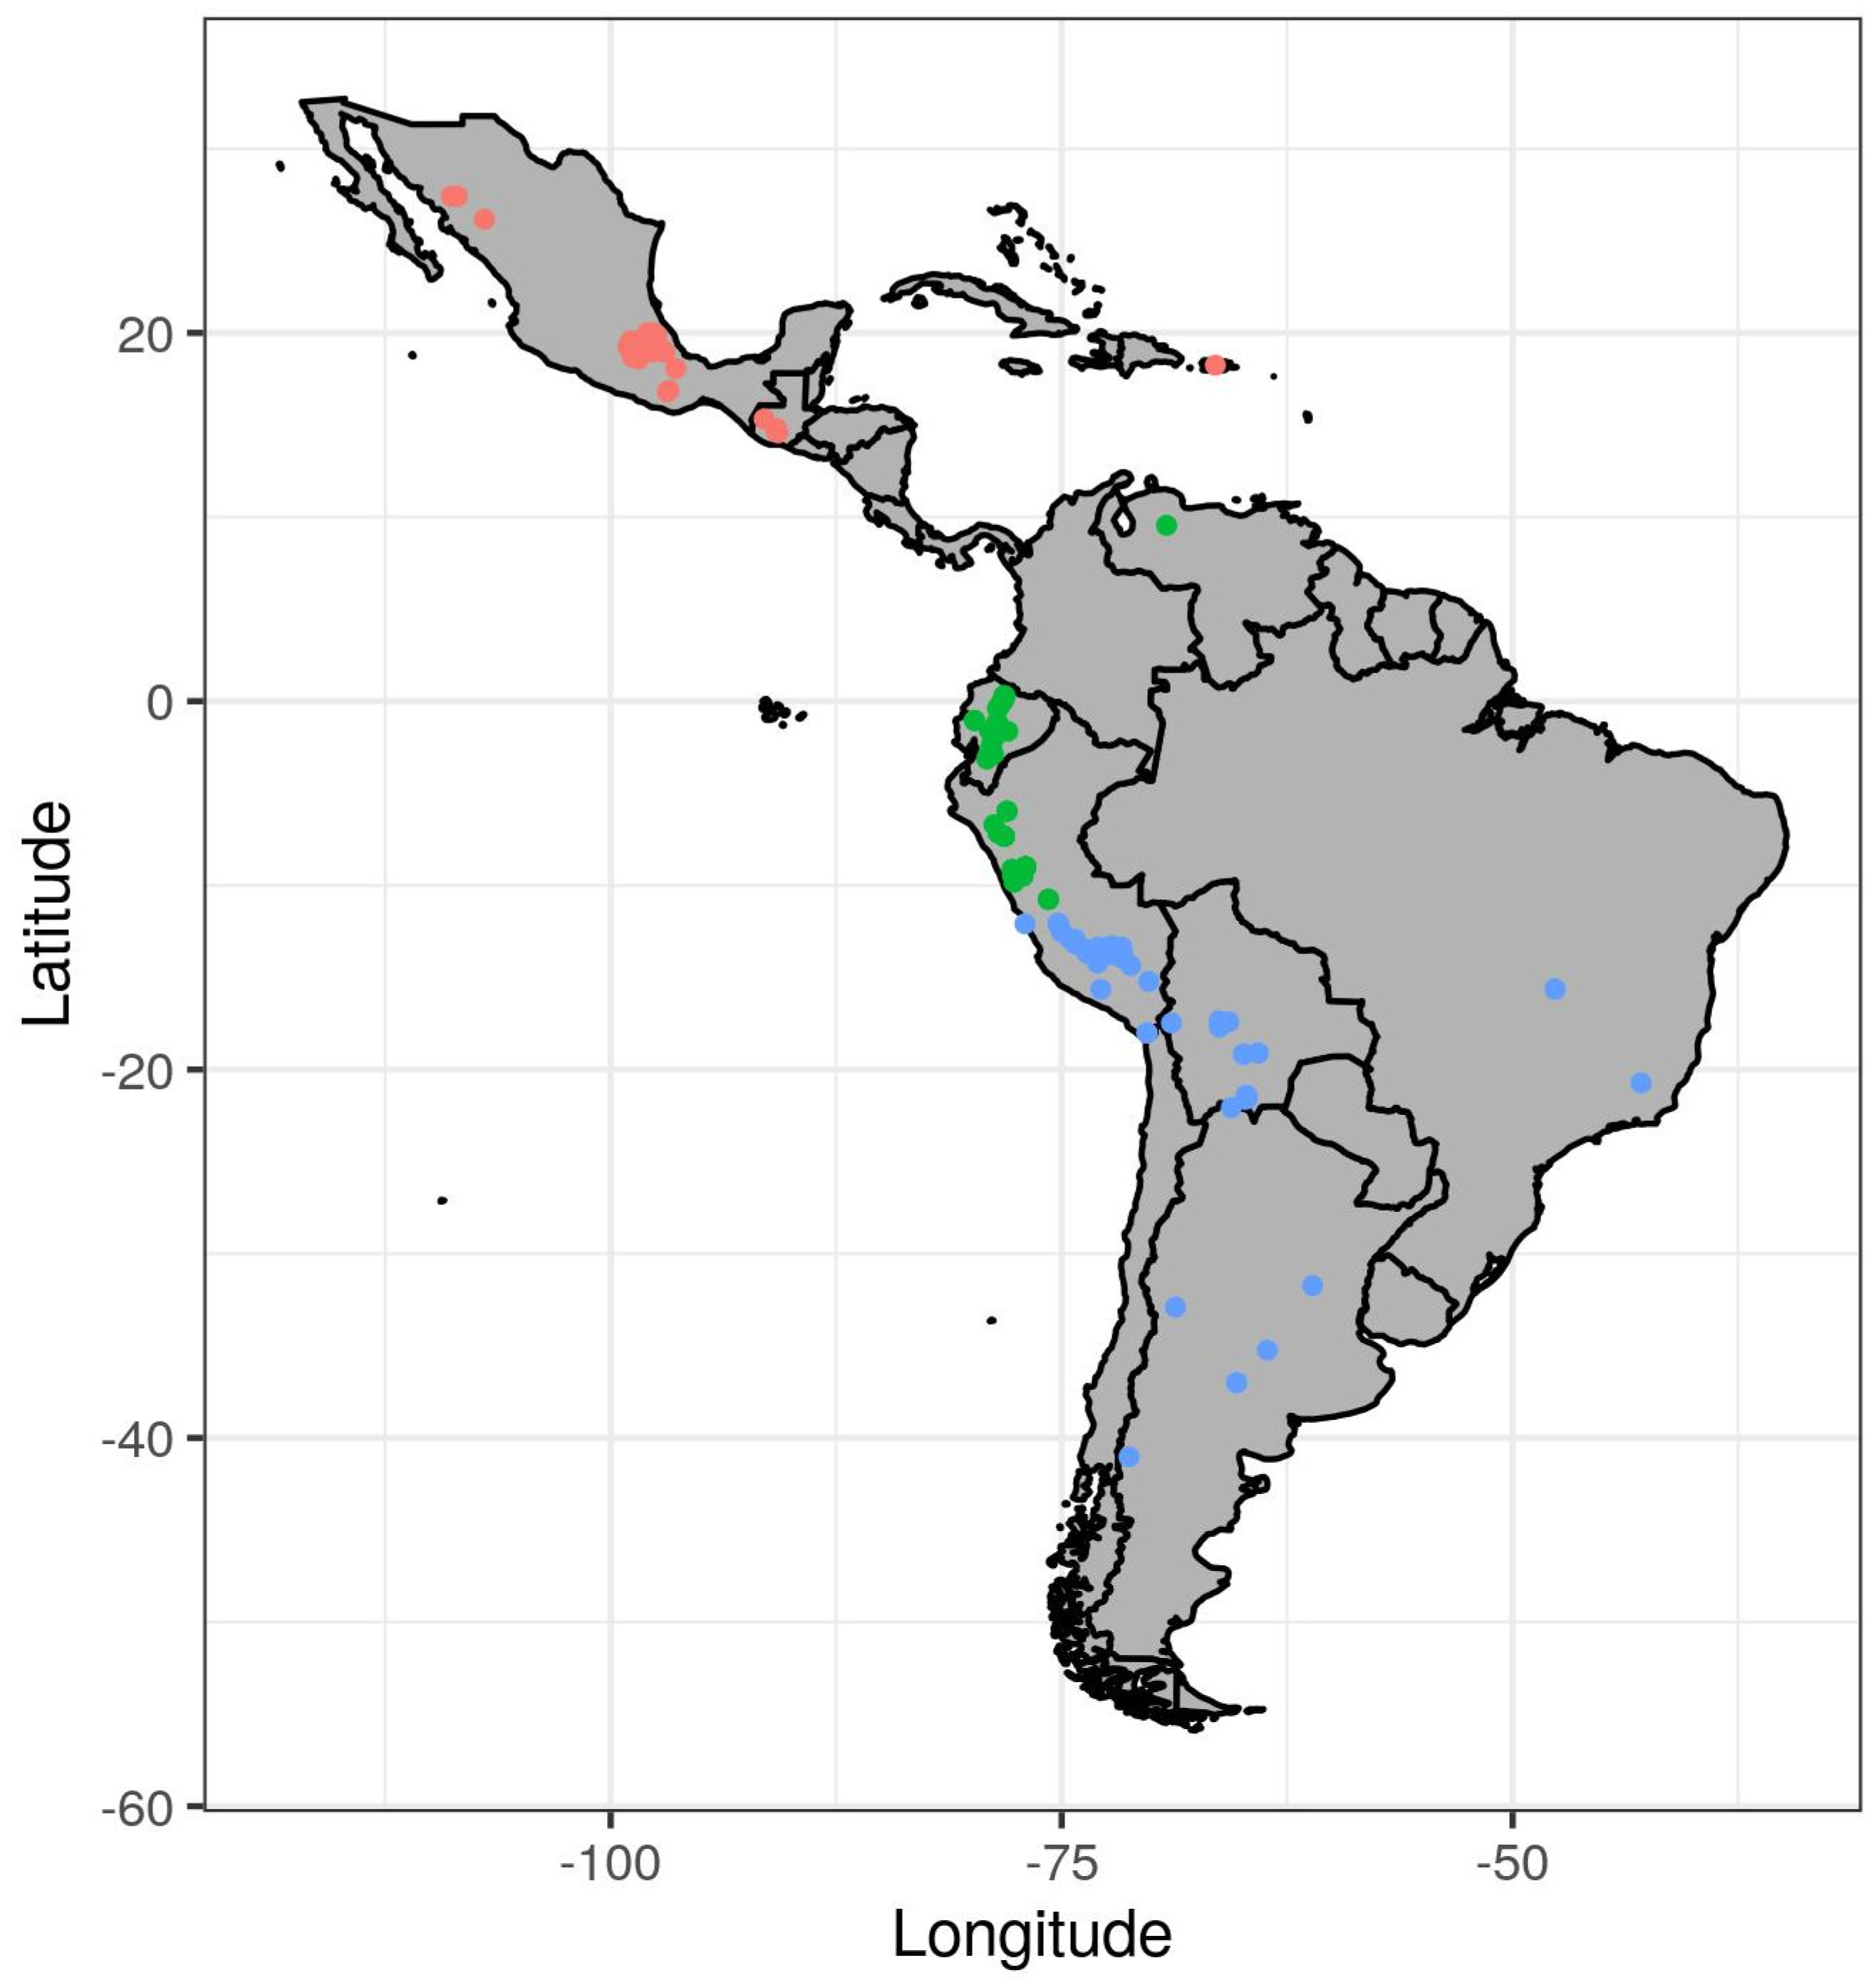
2.1. Plant Material

We tested 253 genebank accessions obtained from USDA-ARS genebank in a field trial, including three major grain species (A. caudatus L., A. cruentus L., and A. hypochondriacus L.), their putative wild ancestors (A. hybridus L. and A. quitensis Kunth) and accessions that were ‘hybrids’ in the passport data (Supplementary Materials Table S1). Furthermore, we included the grain-type variety Bärnkrafft (A. cruentus), which has been developed for cultivation in Central Europe.

2.2. Field Experiment

In 2019, we performed a field trial in a single location, the Heidfeldhof experimental station (48°42′ N, 9°11′ E, 395 m a.s.l.) of Hohenheim University, Germany (Supplementary Materials Figure S1). The experiment was conducted with an augmented design of 280 plots distributed into 10 blocks, and Bärnkrafft was included as check variety in each block to be used in the correction of unreplicated entries. We used an augmented design since we had a large number of accessions with a limited amount of seeds to test, which is common in the early stages of breeding programs [36]. Plot length was 2 m, the distance between the adjacent plots was 75 cm, and the distance between blocks was 1 m. Each plot consisted of a single row. Seeds were sown manually on 17 May 2019 and the experiment was finished on 23 October 2019. Weeds were manually and mechanically removed when needed. Thinning was manually performed by leaving 10 cm between the plants and no fertilization or irrigation was applied.
During the period of the field trial, we retrieved the monthly mean temperate and precipitation data from http://wetter-bw.de (accessed on 20 March 2021) for the Heidfeldhof agricultural field station at which the trial was performed (Supplementary Materials Figure S1). In the estimation of photoperiod during the vegetation period, we retrieved the day length data for each day from the sunrise and sunset calculator at http://www.timeanddate.com (accessed on 20 March 2021) in the format of hour–minute–second (hms) for the Stuttgart region. Using the lubridate R package [37], we first converted the hms format into seconds using the period_to_seconds function and then converted the respective seconds to hours by dividing them by 3600. Finally, we estimated the mean photoperiod values for each month.

2.3. Phenotypic Traits

We phenotyped each plot for plant height, flowering time, and seed setting. Plant height was recorded at harvest time as distance (cm) between the soil level and the top of the inflorescence. Flowering time was recorded as number of days from sowing until pollen shedding, and seed setting was recorded as binary trait at harvest time. Plant height and seed setting were recorded based on three randomly selected plants, whereas flowering time was recorded plot-wise when 50% of the plants were in a plot flowered. Growing degree days indicate the heat accumulation from sowing until flowering and is formulated as:
( T max + T min ) 2 T base
where Tmax and Tmin are the maximum and minimum temperatures of a day, respectively, and Tbase is the base temperature we used for amaranth. If Tbase is larger than Tmin, Tmin is replaced by Tbase in the formula. The formula was applied for each day and the cumulative sum of each day’s estimated values from sowing until flowering gives the total heat accumulation of that particular flowering date. We took the Tbase value as 10 °C [38] and estimated growing degree days using the pollen R package [39].

2.4. Environmental Variables

Coordinates of geographic origin of accessions were retrieved from their passport data (USDA ARS). For the majority of accessions, coordinates were missing in the passport data and were retrieved with Google Maps using the location name. We obtained the climatic data from the WorldClim database version 2.1 with the resolution of 30 s (~1 km2) using the collection coordinates of the accessions [40]. We extracted and processed the data using the raster R package [41]. The variables we used were monthly average temperature (°C), precipitation (mm), solar radiation (kJ m−2 day−1), and elevation (m). As the tested accessions mainly originated from Central and South America and the sowing dates and the vegetation periods of amaranth varied largely across this geographic range [42], we used the annual means of these climatic variables in our analyses.

2.5. Statistical Analyses

We grouped accessions according to their latitudinal distribution and species and characterized them by comparing these group means in phenotypic traits and the environmental variables at the geographic origin of accessions. We separated 226 accessions with complete coordinates into three latitudinal groups based on their latitude of origin (Figure 1). First, we assigned all accessions from Central America into a single group (n = 60). Second, we estimated the median latitude of South American accessions (−10.76°) and accordingly divided the South American accessions into South America-I (n = 84) and South America-II (n = 82) groups. Of the 280 plots in the field trial, 10 plots were planted with accessions from a different biomass breeding population to fill empty plots, but these genotypes were not included in the statistical analysis because they did not belong to any latitudinal group and did not have species information. In addition, we discarded seven accessions with insufficient field emergence from further analysis. Hence, the comparison of species and latitudinal groups were performed with 254 and 226 accessions, respectively. We compared groups using a generalized linear model due to the heterogeneity of variance among the compared groups (Supplementary Materials File S1). We used a binomial distribution with a logit link function in seed setting and normal distribution in the other traits and variables. We performed a likelihood ratio test by comparing our model with the default null model—assuming a constant mean across all groups – using a chi-square test, since a generalized linear model does not produce a p-value. In the case of significant differences between comparisons, we compared the groups using a Fisher’s least significant difference (LSD) test (alpha = 0.05). Analyses with generalized linear models were performed using the stats package, the likelihood ratio test was carried out with the lmtest package [43], the LSD test with the agricolae package [44], correlation analyses with the Hmisc package [45], and plotting of the correlations with the corrplot package [46] within the R environment [47].

3. Results

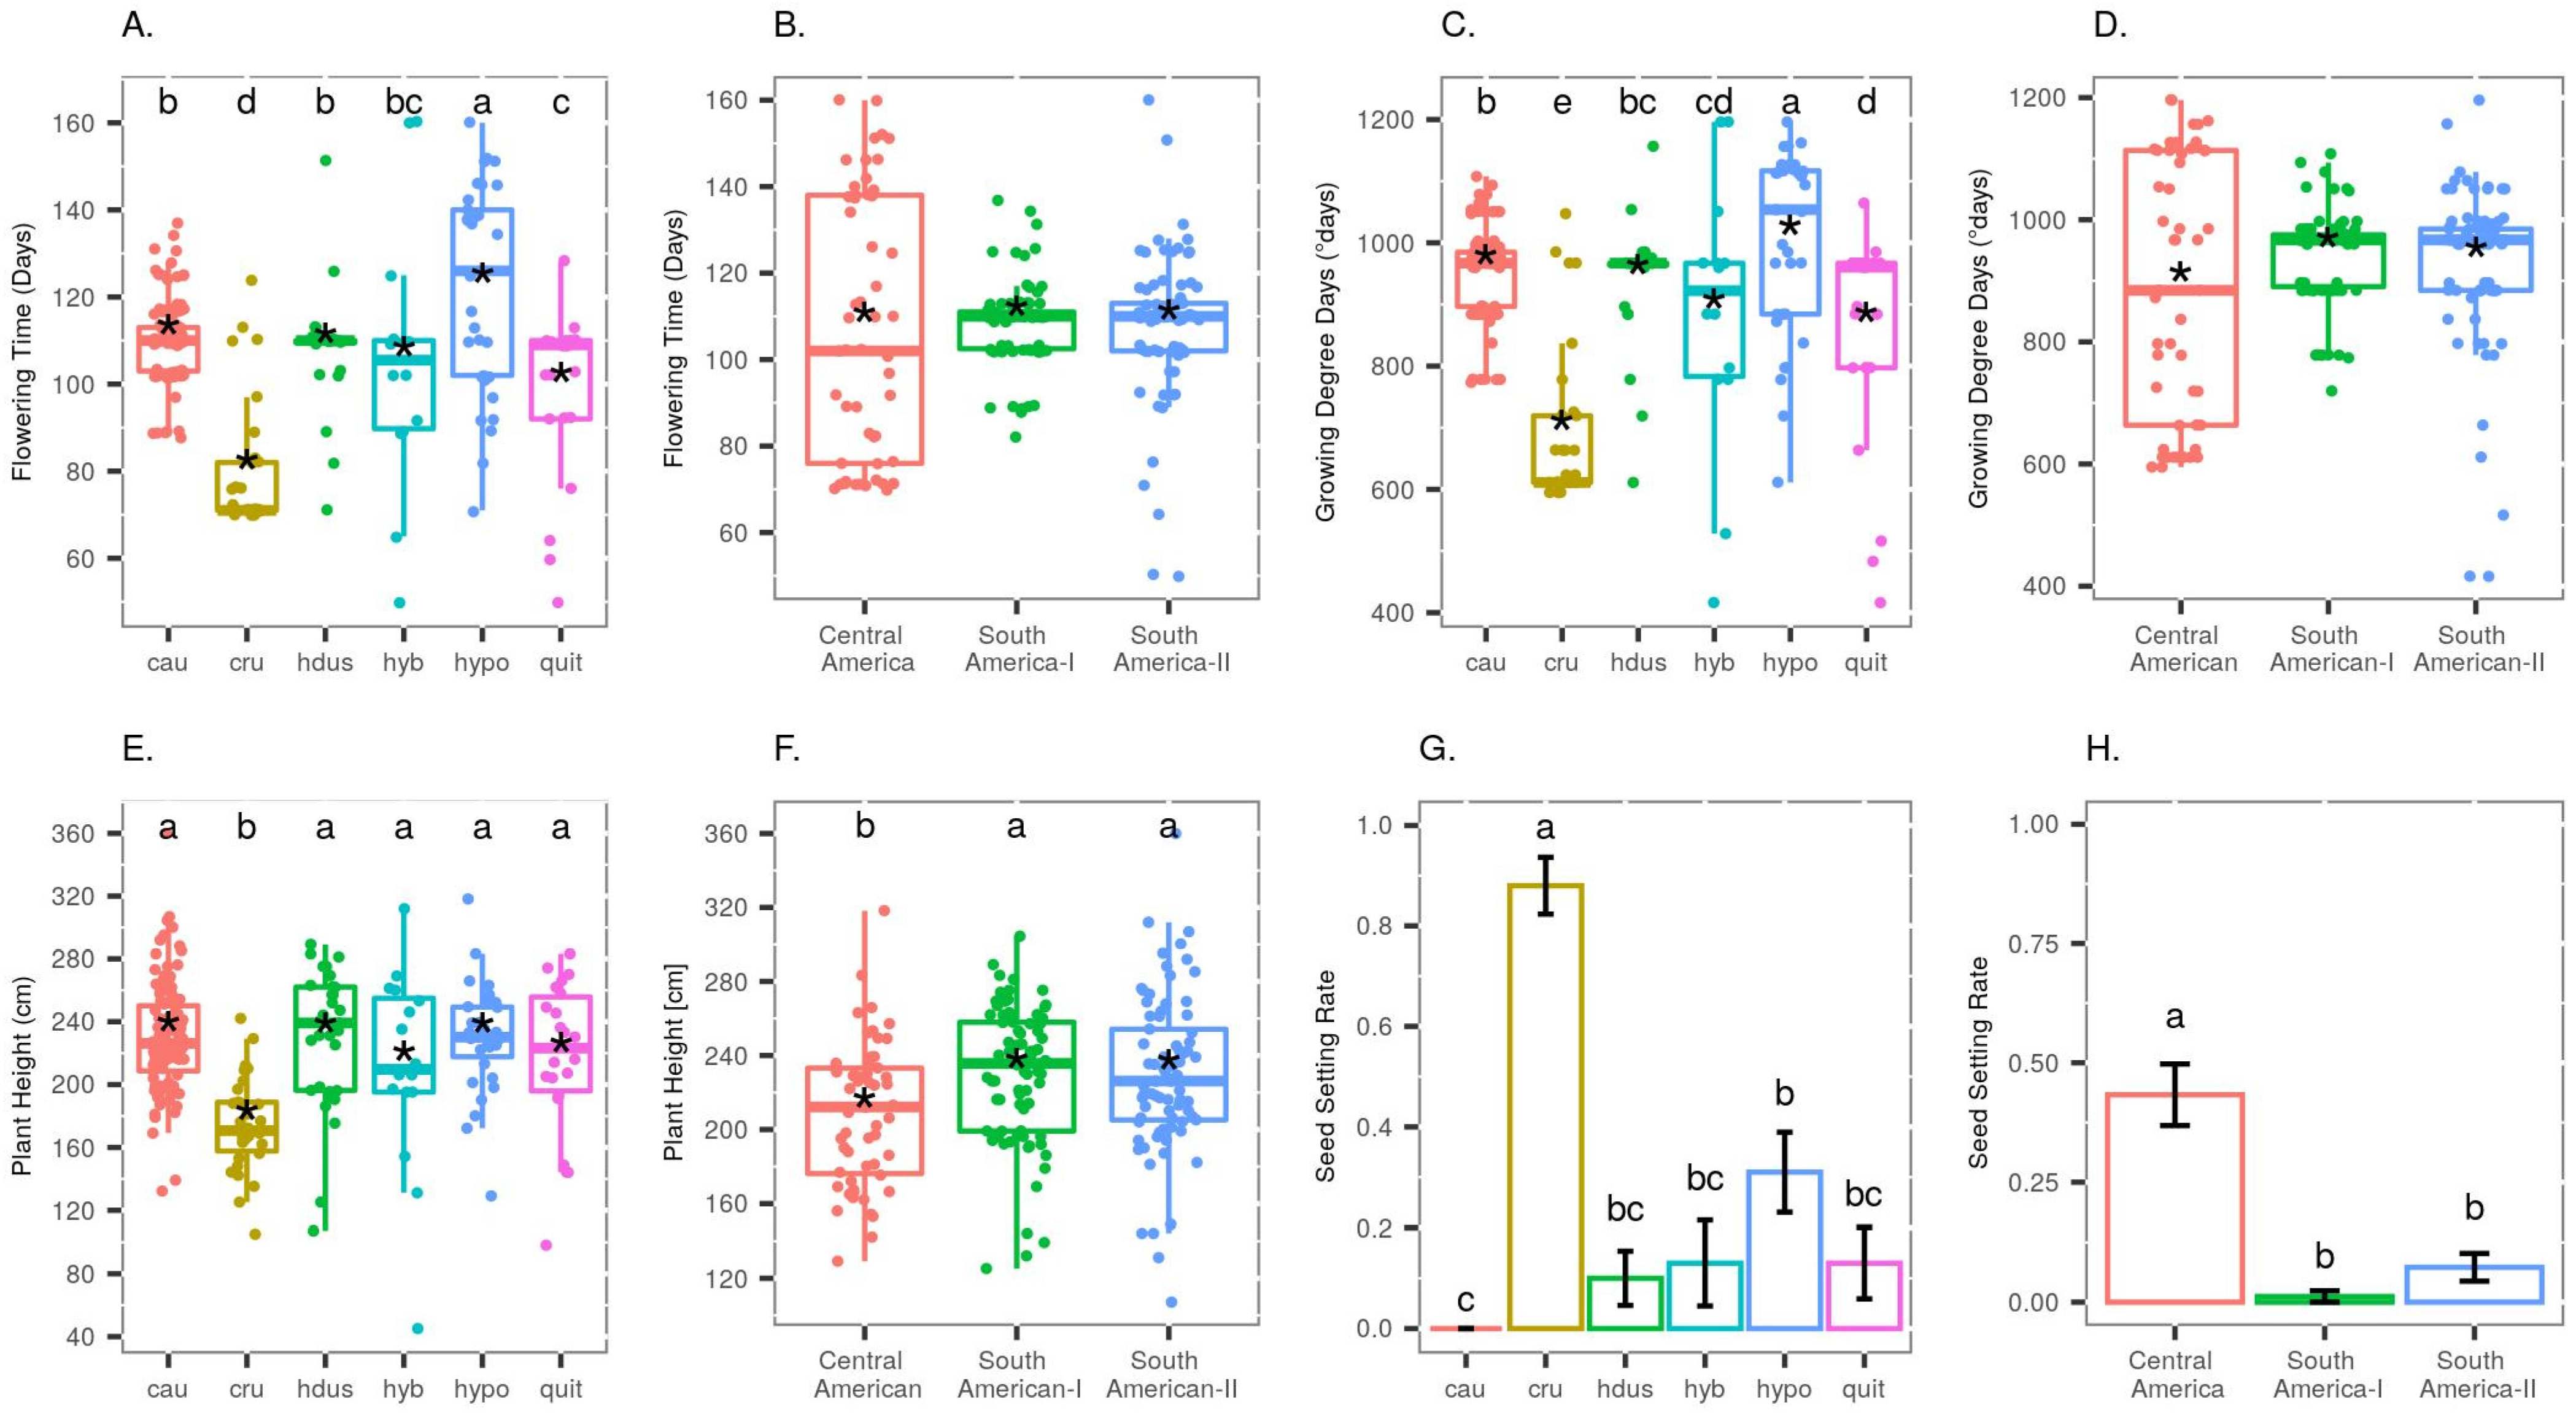
3.1. Variation in Phenotypic Traits and Environmental Variables

We observed a very large variation in flowering time among accessions. The number of days to flowering ranged between 50 and 160 days with a mean of 106.3 days. Six accessions from Central America did not reach the flowering stage at all (Supplementary Materials Table S2). All grain species (A. caudatus, A. cruentus, and A. hypochondriacus) and wild species (A. hybridus and A. quitensis) differed from each other in mean flowering time (Figure 2A). A. cruentus flowered the earliest with a mean of 79.44 days, while A. caudatus flowered later, with a mean of 110.28 days. A. hypochondriacus accessions flowered the latest with a mean of 122.33 days and showed a large range of 89 days (71–160 days). The ‘hybrid’-labeled accessions showed the widest range in flowering time with 110 days (50–160 days). Three strong outlier observations of this group, consisting of one accession flowering after 50 days and two accessions flowered after 160 days, strongly affected this estimate (Figure 2A). Removal of these three outliers reduced the flowering time range to 60 days (65–125 days).
In contrast to the grouping by species, the mean flowering time of the three latitudinal groups was 107.95 days, and the three groups did not differ from each other (Figure 2B). The Central America group, including the earliest flowering species A. cruentus and the latest flowering species A. hypochondriacus, showed a wide range in flowering time (70–160 days). Among the three latitudinal groups, South America-II showed the widest range with 110 days (50–160 days) similar to the ‘hybrid’-labeled accessions in the species-based comparisons. However, this range estimate was also biased by several strong outliers (Figure 2B). Therefore, we report the interquartile ranges of these three groups, as this statistic is less prone to outliers. The interquartile ranges of the Central America, South America-I and South America-II groups were 62, 8.5 and 11 days, respectively, which indicates that Central American accessions have a much larger flowering time variation than the South American accessions.
Growing degree days was determined by flowering time and daily temperature, and we observed very similar results between this trait and flowering time in the species-based comparisons (Figure 2C,D). A. cruentus and A. hypochondriacus reached the lowest and the highest growing degree days means, respectively, but ‘hybrid’-labeled accessions showed the largest range (416–1196° days; Figure 2C), although the three latitudinal groups did not differ from each other (Figure 2D). Similar to flowering time, the Central America group showed the largest interquartile range (450° days) among the three latitudinal groups. For the trait plant height, accessions ranged between 45.2 and 359.9 cm with a mean of 220.3 cm, when all accessions were considered. At the species level, only A. cruentus was shorter than all other accessions with a mean height of 170.7 cm (Figure 2E). Among latitudinal groups, the Central American group had a mean plant height of 208.73 cm, which was shorter than the South American groups (Figure 2F).
We recorded seed setting as a binary trait, where ‘0’ represents no seed setting and ‘1’ represents seed setting. Considering all accessions, the mean proportion of seed setting was only 19% (n = 49). Species and latitudinal groups showed distinct patterns for this trait (Figure 2G,H). Among species, proportion of seed setting was highest in A. cruentus with a mean of 88% (n = 30), followed by A. hypochondriacus with 31% (n = 11), whereas no A. caudatus accession managed to set seed. The wild amaranth species were not different from each other, and their proportion of seed setting was approximately 12% (n = 2, n = 3 and n = 3 for the ‘hybrid’ group, A. hybridus, and A. quitensis, respectively). Among latitudinal groups, 43.3% (n = 26) of Central American accessions showed seed setting. Most South American accessions failed to produce seeds with a proportion of 1% (n = 1) accessions with seeds in the South America-I group and 7.3% (n = 6) in South America-II group.
To put environmental variation into context with phenotypic variation, we characterized variation in six environmental variables that represented the collection sites of the genebank accessions (Supplementary Materials Figure S2). We detected differences in the distribution of all environmental variables in the comparison of species and latitudinal groups, except for the variable precipitation among species. The two Central American species A. cruentus and A. hypochondriacus were more similar to each other with respect to environmental parameters than the other species. In contrast, the three latitudinal groups were different from each other in all environmental variables including precipitation. The Central American group received a higher amount of precipitation compared to the two South American groups, which did not differ from each other.

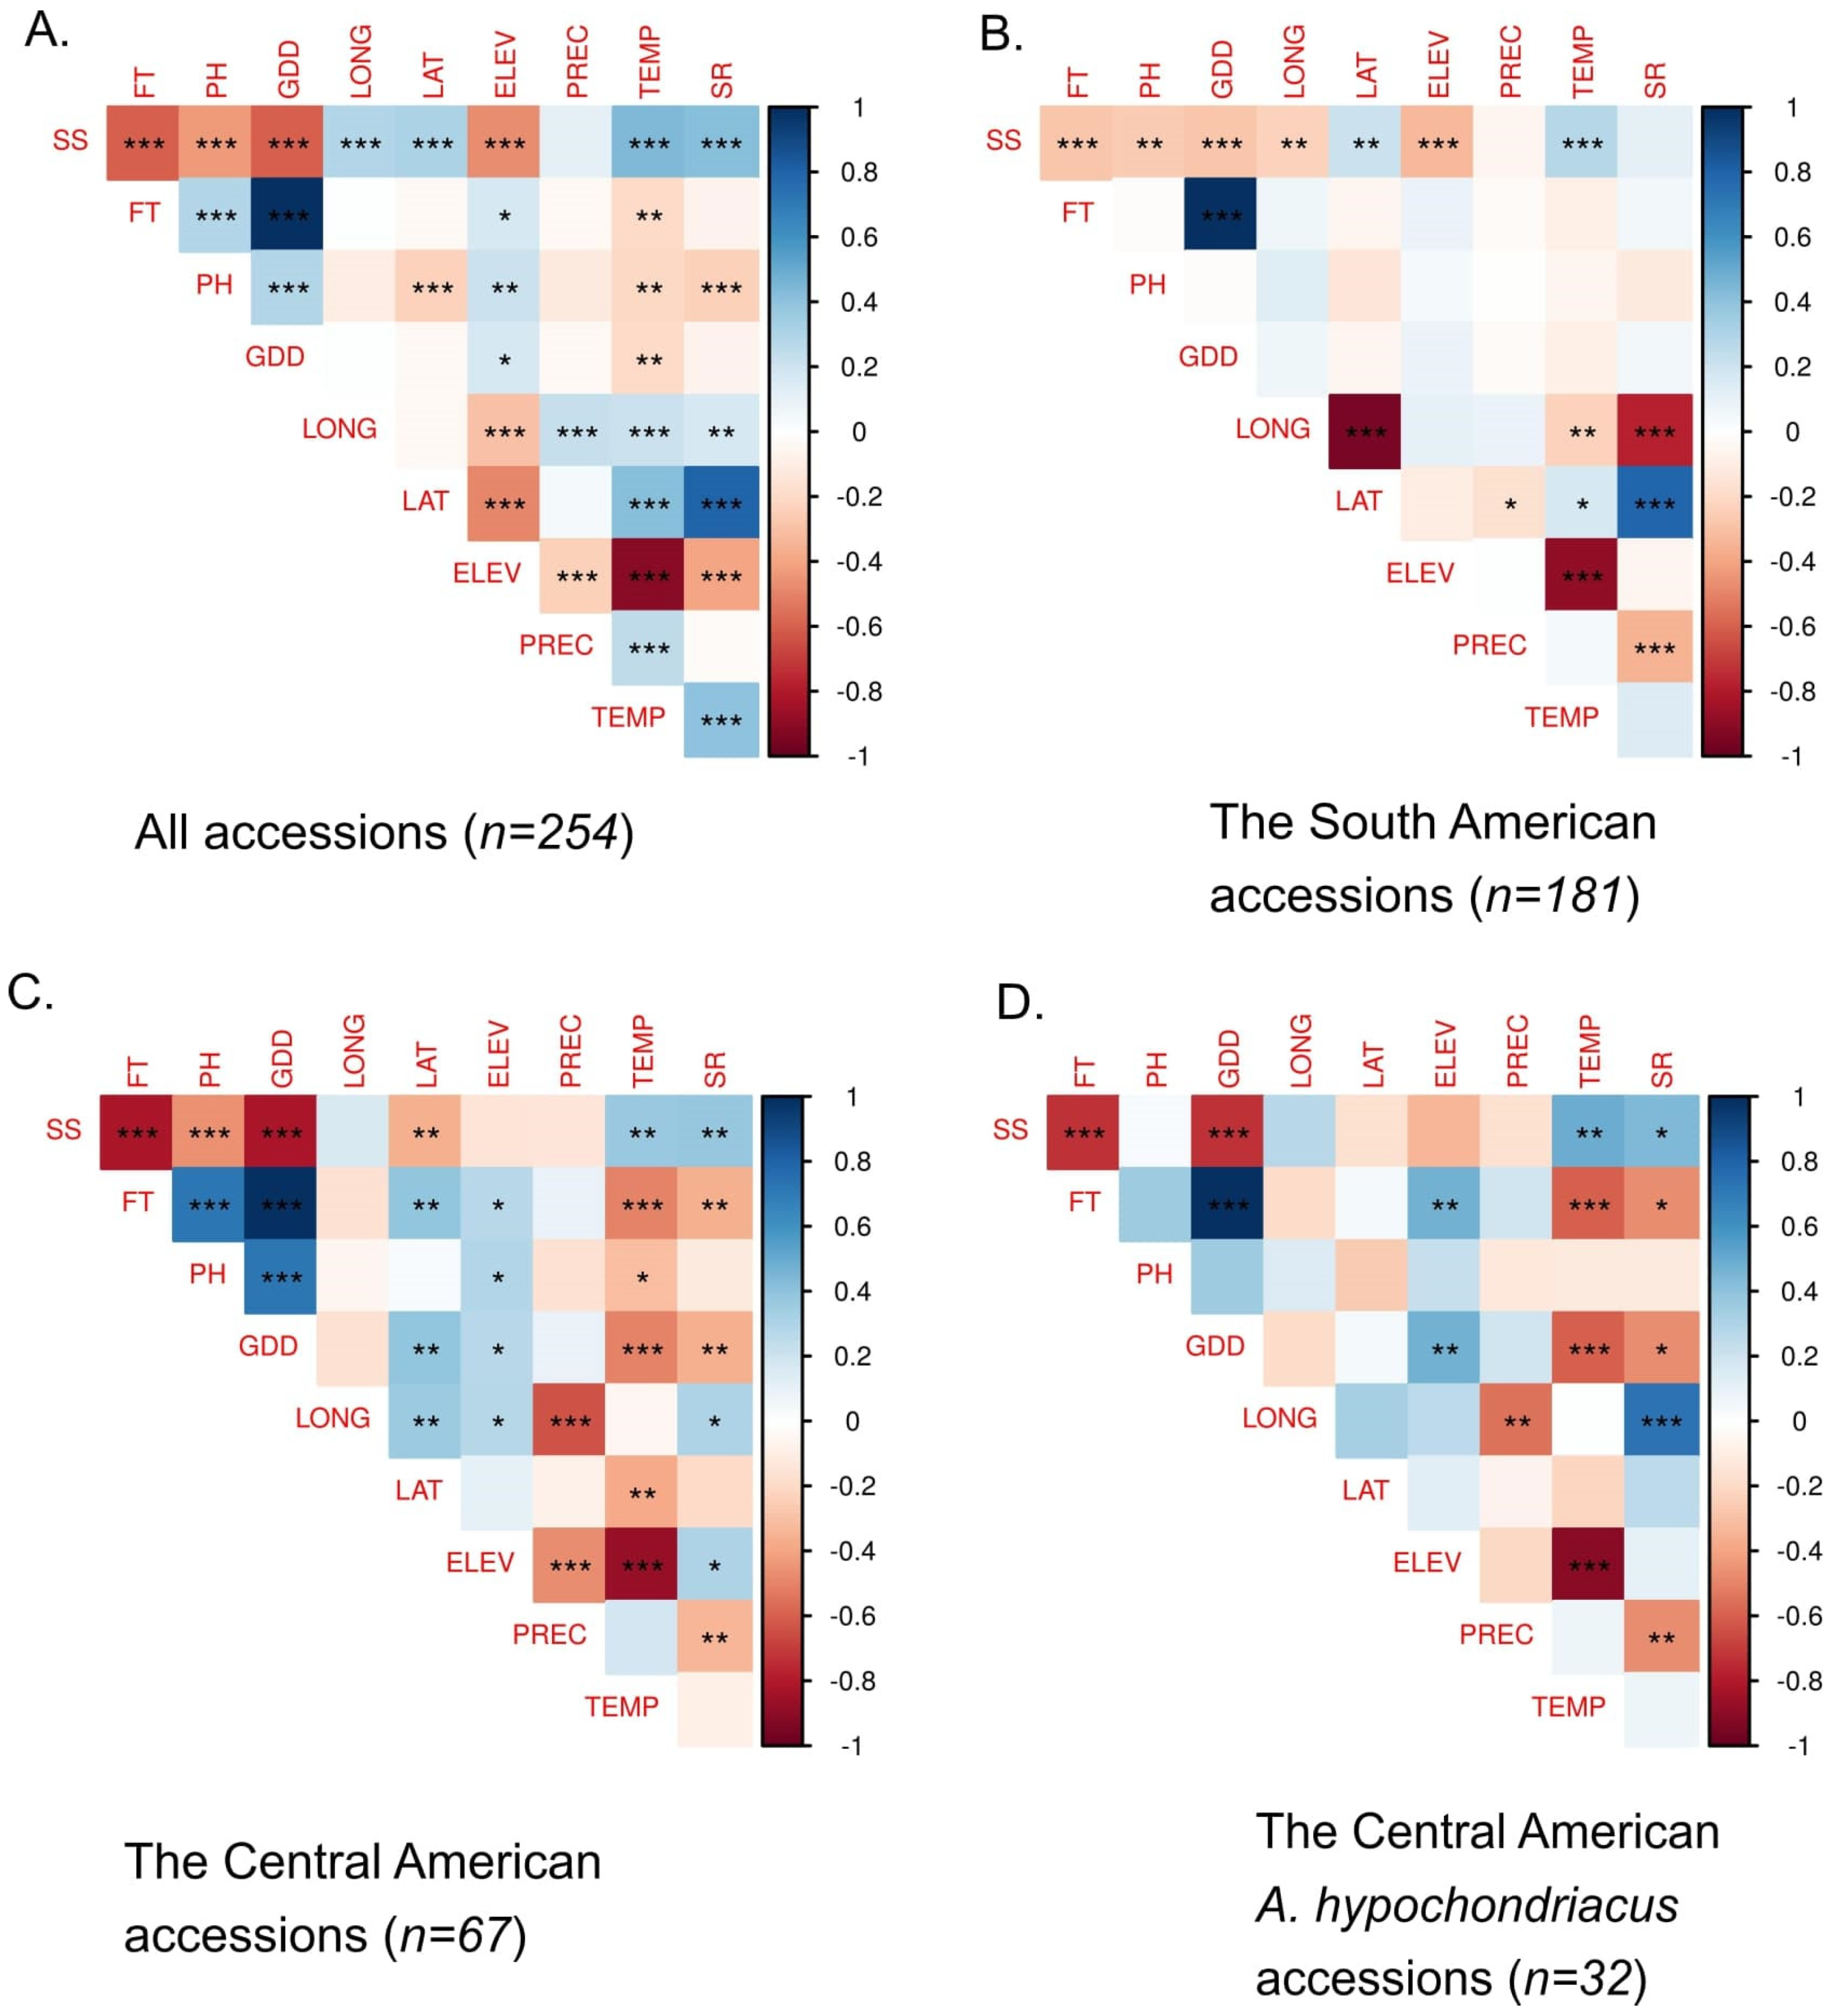
3.2. Relationship between Phenotypic Traits and Environmental Variables

We calculated correlations between phenotypic traits and environmental variables with four different datasets using the accessions from (i) all countries, (ii) South America, (iii) Central America, and (iv) A. hypochondriacus from Central America only. We estimated the correlation matrices using Spearman’s rank correlation since seed setting is coded as a binary trait, and a major interest was to investigate the traits and variables affecting seed setting. However, we studied the relationship between flowering time and plant height also using Pearson’s correlation to investigate the linear trend between these traits. Furthermore, we used the absolute values of latitude and longitude in the correlation analyses.
In the dataset including all accessions (n = 254), all traits and environmental variables were weakly to moderately but always highly significantly correlated to seed setting (p < 0.001), except precipitation (Figure 3A). Among the traits and environmental variables, flowering time, growing degree days, plant height, and elevation were negatively correlated, whereas temperature and solar radiation were positively correlated to seed setting. Likewise, latitude and longitude were weakly but positively correlated to seed setting. In addition, we observed strong correlations between several pairs of variables (Figure 3A). Flowering time and growing degree days were positively correlated (rho = 1, p < 0.001) and elevation and temperature were negatively correlated (rho = −0.90, p < 0.001). Plant height and flowering time (n = 224) showed a moderate positive correlation (r = 0.43, p < 0.001; Figure 4A). Since plant height increased together with the flowering time between 45 and 120 days but remained constant with later flowering dates, the inclusion of a polynomial term to the model improved the fit by increasing the r-squared from 0.18 to 0.33.
The collection sites of the South American accessions were located more closely to each other than to the Central American sites (Figure 1). We then repeated the correlation analysis by excluding the Central American accessions to detect their potential outlier effects. In the analysis with the second dataset (n = 181), all traits and variables except precipitation and solar radiation were significantly, but only weakly, correlated to seed setting (Figure 3B).
We also conducted the analysis with the Central American accessions only (n = 67), since this region is the center of the variation for flowering time and seed setting (Figure 2B,H and Figure 4C). Seed setting was strongly and negatively correlated to flowering time and growing degree days (rho = −0.81, p < 0.001), and also negatively correlated with latitude (rho = −0.36, p < 0.01) and positively correlated with temperature and solar radiation (p < 0.01; Figure 3C). Among environmental variables, only elevation and temperature were strongly (rho = −0.86, p < 0.001) correlated.
Finally, we repeated the analysis with the fourth set (n = 32) that included only A. hypochondriacus accessions from Central America, due to the large intraspecific variation in flowering time (Figure 4D). Flowering time and growing degree days were moderately to strongly (rho = −0.73, p < 0.001) and elevation was weakly and negatively correlated (rho = −0.34, p < 0.05), whereas temperature and solar radiation were moderately and positively correlated to seed setting (Figure 3D). In addition, we observed strong correlations between flowering time and growing degree days (rho = 1, p < 0.001) and elevation and temperature (rho = −0.90, p < 0.001).

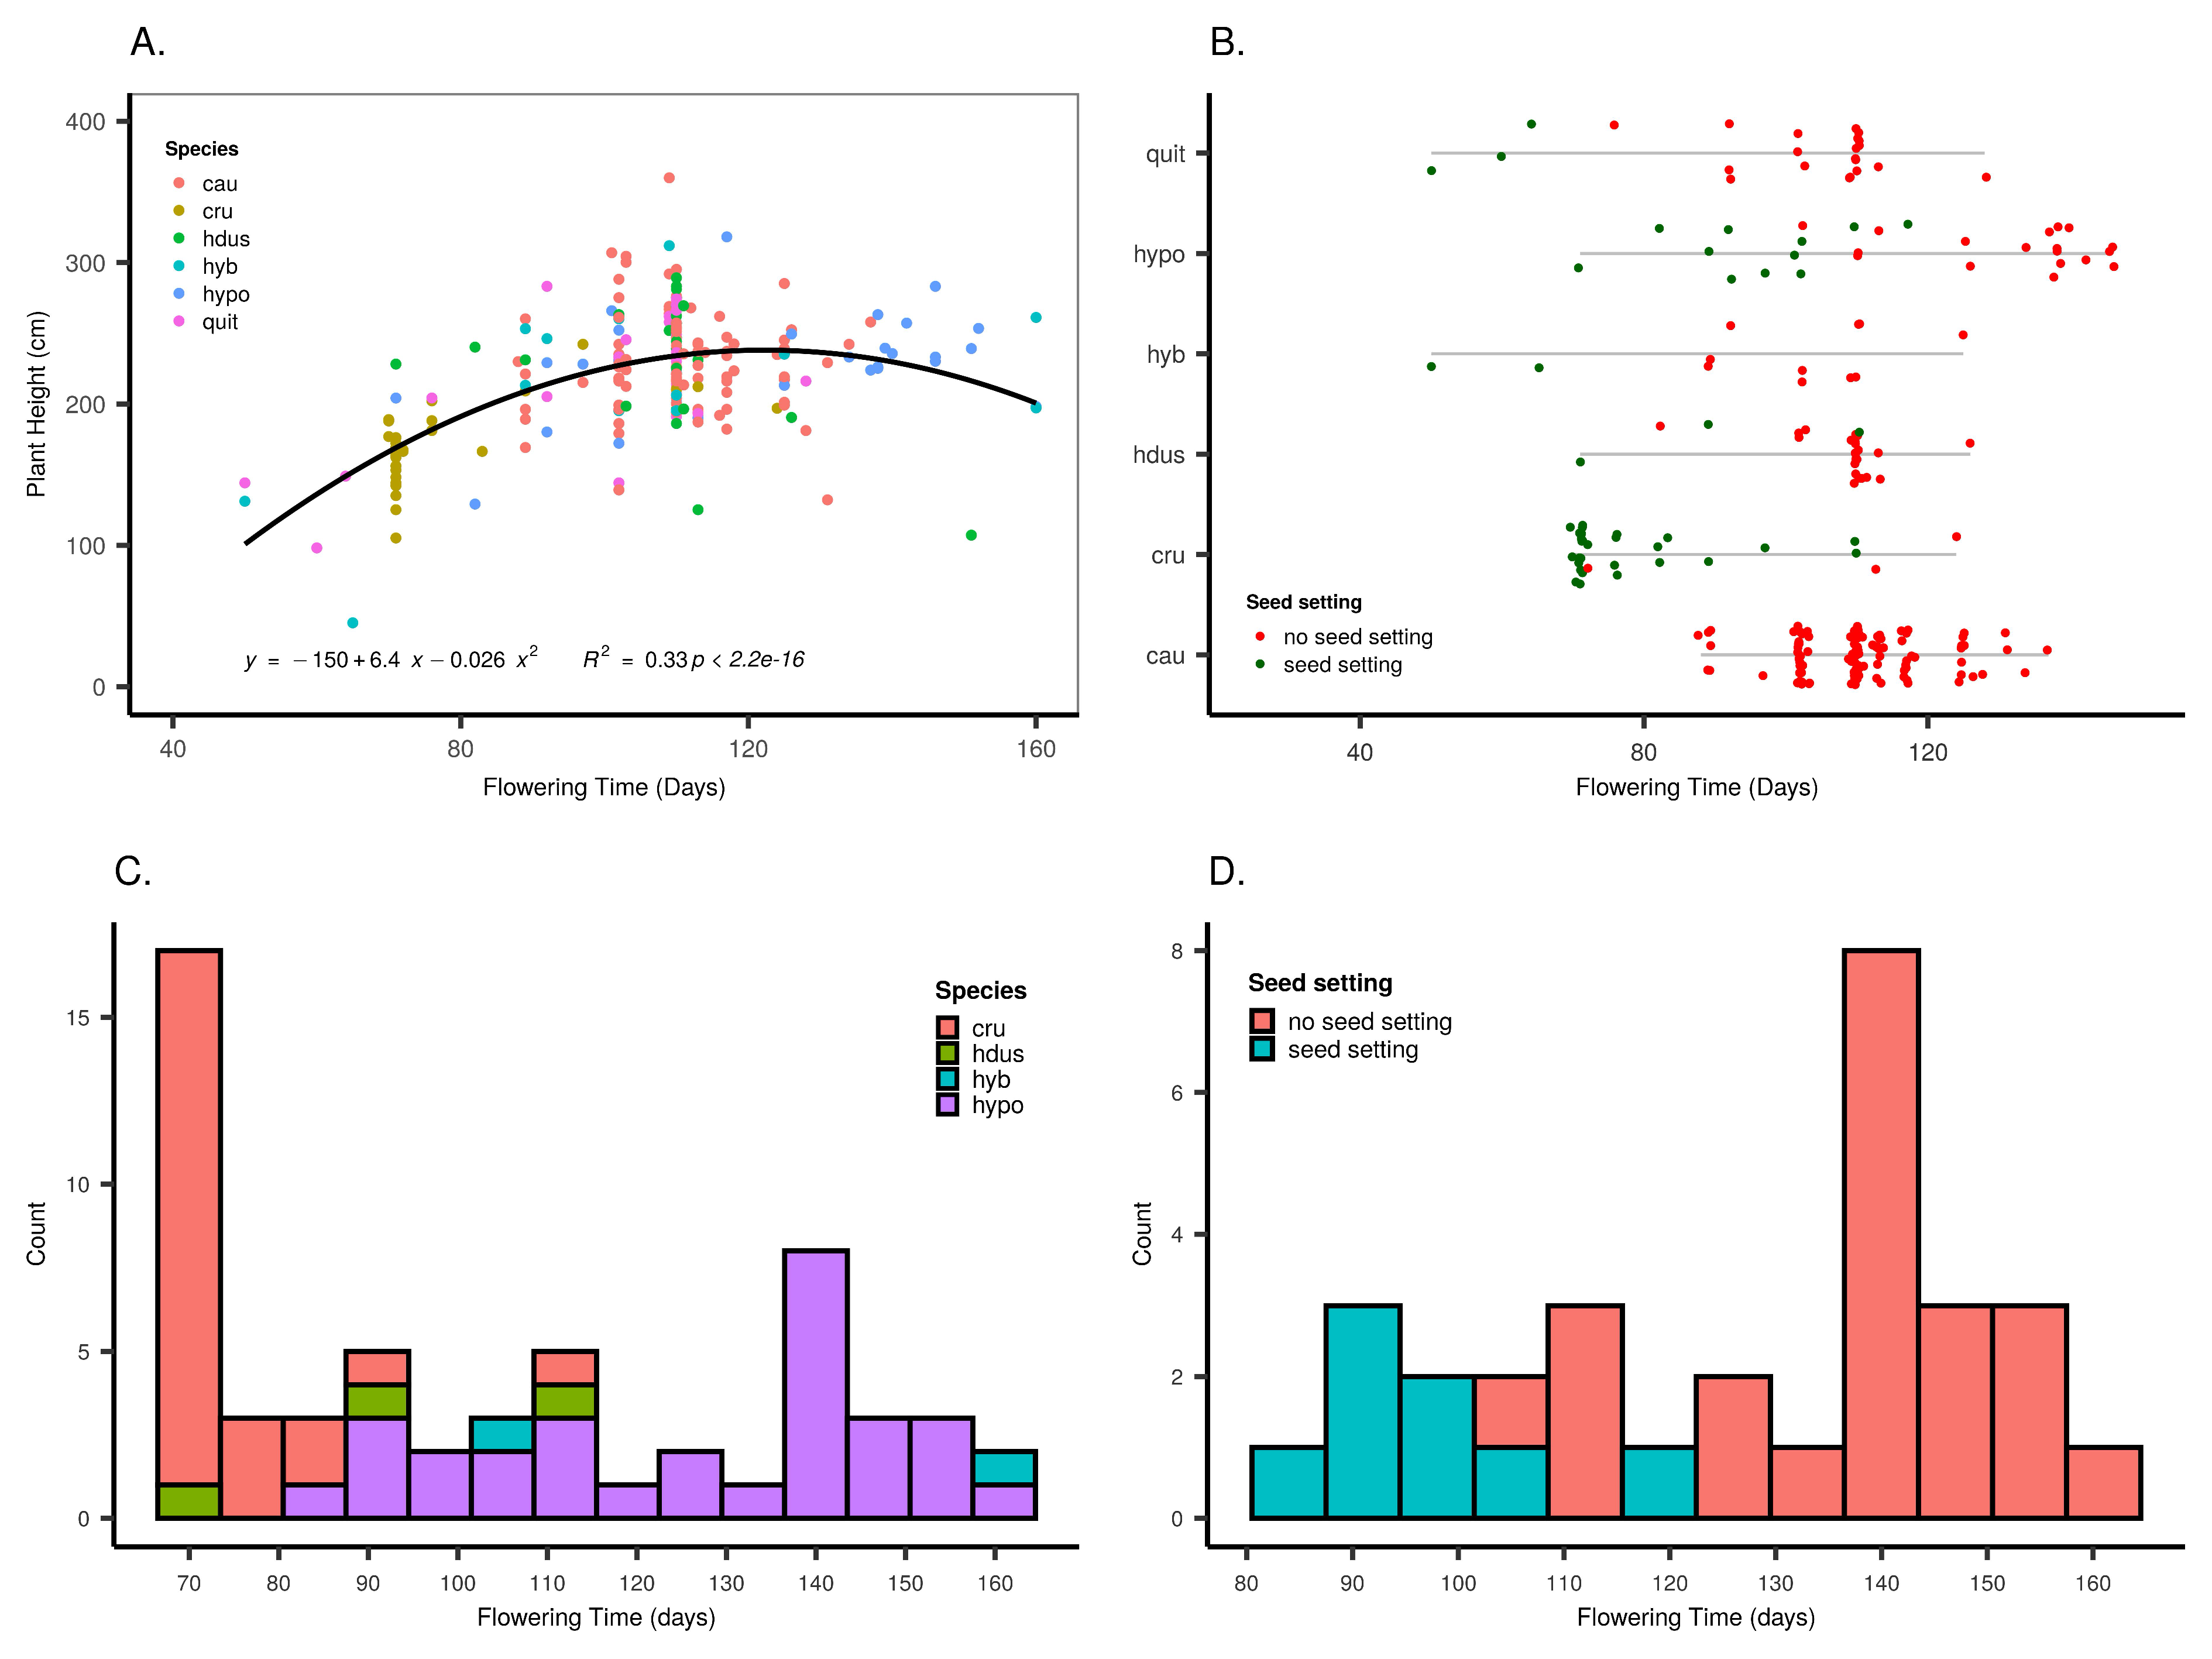
3.3. Factors Influencing Seed Setting

We focused on the flowering time distribution of the Central American accessions to understand the factors determining seed setting. A. cruentus accessions displayed little flowering time variation and included predominantly photoperiod-insensitive but only a few late-flowering accessions (Figure 4C). On the other hand, A. hypochondriacus accessions showed a very wide variation and included moderate to highly photoperiod-sensitive accessions. Furthermore, correlation analyses within Central American accessions revealed that temperature and solar radiation were moderately correlated climatic variables to seed setting in datasets three and four. Accordingly, we separated the Central American accessions into seed setting (22 × A. cruentus, 8 × A. hypochondriacus, 3 × A. hybridus) and non-seed setting (24 × A. hypochondriacus, 4 × ‘hybrids’, 3 × A. cruentus and 3 × A. hybridus) groups to compare their differences in phenotypic traits and environmental variables based on their geographical origin.
In these comparisons, these two groups from Central America significantly differed in flowering time, growing degree days, plant height, temperature and solar radiation (Supplementary Materials Figure S3, Supplementary Materials File S1). We repeated the same comparisons between seed setting (8) and non-seed setting (24) for Central American A. hypochondriacus accessions only, due to their high variation in time to flowering and seed setting (Figure 4D). In the Central American A. hypochondriacus, the two groups significantly differed in flowering time, growing degree days, temperature, solar radiation and elevation (Supplementary Materials Figure S4; Supplementary Materials File S1).
The temperature at the geographic origin of accessions was significantly higher (Supplementary Materials File S1) for: (i) the Central American group (18.49 °C) than the South American groups (13.68–14.86 °C) (Supplementary Materials Figure S2); (ii) seed setting accessions (19.82 °C) compared to non-seed setting ones (17.47 °C) within Central American accessions (Supplementary Materials Figure S3); and finally (iii) for seed setting accessions (20.87 °C) compared to non-seed setting ones (16.95 °C) within Central American A. hypochondriacus accessions (Supplementary Materials Figure S4). These results suggest that: (i) seed setting and non-seed setting accessions clearly diverged in many phenotypic traits and environmental variables; (ii) an accession’s temperature of origin should reach a certain threshold for seed setting in the temperate climate of Germany.

4. Discussion

4.1. Categorization of Photoperiodic Response

Flowering time response is a quantitative trait that depends on the growth environment in which ecological factors such as photoperiod and temperature act together [48]. The photoperiodic response of genotypes adapted to a short-day environment can be quantified if: (i) the material is photoperiod-sensitive; and (ii) long-day conditions are present during the cultivation period. We therefore categorized the photoperiodic responses of the accessions roughly into three groups. The first group was composed of photoperiod-insensitive accessions that flowered between 50 and 80 days (n = 31) and mostly set seed (n = 29). The majority of accessions in this group originated from Central America and the main representative species of this group was A. cruentus, which is characterized by short plant height and a high temperature at the geographical origin. A few accessions not originating from Central America also showed photoperiod insensitivity and set seed (Supplementary Materials Table S3). The second group was composed of mildly photoperiod-sensitive accessions that flowered between 80 and 140 days (n = 200) and rarely set seed (n = 19). The majority of accessions in this group were A. caudatus, or originated from locations in South America with high altitudes and cool temperatures. However, this group also included A. hypochondriacus accessions from Central America. We separated the second group from the third group based on the geographical origins of the accessions. The accessions in the third group (n = 18) were highly photoperiod-sensitive and all originated from Central America, compared to the second group accessions that mostly originated from South America. This group included A. hypochondriacus accessions that flowered after 140 days and A. hybridus, A. hypochondriacus and ‘hybrid’ accessions that did not flower (Supplementary Materials Table S2). All accessions in this group failed to set seed in our experiment.

4.2. Relationship between Phenotypic Traits and Environmental Variables

The correlation between flowering time and seed setting varied strongly in the different datasets defined by geographic groups. In the joint analysis of Central and South American accessions correlations were moderate to strong. Given the Central American accessions contributed the highest proportion of variation for these two traits whereas South American accessions contributed a neglectable amount of variation for seed setting, a strong correlation was observed between flowering time and seed setting within Central American accessions, and the exclusion of the Central American accessions remarkably reduced the correlation between flowering time and seed setting within the South American accessions.
The correlation analysis of latitude of origin with flowering times in the dataset consisting of South and Central American accessions was constrained (Figure 3A) because accessions from both regions were not evenly distributed along latitude but clustered in two regions (Figure 1). However, these two groups included a very wide range of photoperiodic responses, i.e., the Central American accessions ranged from photoperiod-insensitive to highly sensitive, whereas the South American accessions were mainly moderately sensitive. The narrow latitudinal variation with a very wide flowering time variation reduced the correlation between these variables.

4.3. Variation in Seed Setting

Seed setting under temperate climate and long-day conditions of Europe is a primary measure of success for local adaptation and grain yield. Among all tested accessions, mainly those of Central American origin set seed. However, some accessions originating from South America also managed to set seed (n = 16). These accessions can be categorized in two groups based on their photoperiodic responses. The first group included 10 photoperiod-insensitive accessions that flowered between 50 and 76 days (Supplementary Materials Table S3). The second group included six mild photoperiod-sensitive accessions that flowered between 82 and 110 days (Supplementary Materials Table S4). All accessions in the second group belonged to A. cruentus and A. hypochondriacus, which are native species to Central America.
We observed variation in seed setting among accessions that flowered at similar dates (Figure 4B), i.e., there was no single flowering time threshold representing all species at which accessions ceased seed setting. In contrast, a different threshold existed for each species (Figure 4B). These threshold days were 76 for A. quitensis, 89 for ‘hybrids’, 111 for A. hybridus, 113 for A. cruentus, and 124 days for A. hypochondriacus. However, such a threshold might be sensitive to strong outliers. For example, a single accession flowered at day 110 and changed the threshold from 102 to 111 in A. hybridus. Similarly, another type of outlier, an accession that behaves differently than the latitudinal group or species it belongs to, such as the photoperiod-insensitive accessions that are of non-Central America origin, may also cause such a misinterpretation. The most visible example of this pattern was A. caudatus, because many A. cruentus and A. hypochondriacus accessions that flowered later than A. caudatus accessions set seed, whereas no A. caudatus accession managed to set seed regardless of the flowering time. Hoidal et al. [30] reported an A. caudatus accession that set seed in a set of field experiments in the high latitude of Denmark (55°), which contradicts the results with A. caudatus in this study. Rivelli et al. [29] reported photoperiod sensitivity and associated late flowering in a small number of accessions of wild and cultivated amaranth species under the Mediterranean climatic conditions of Italy, which are characterized by higher annual mean temperature than Germany. Under these conditions all accessions managed to set seed. These results suggest that photoperiodic response plays a major role in flowering time, whereas high temperature has a strong effect on seed setting. Since a certain temperate threshold at the site of origin needed to be reached for seed setting under temperate Europe climatic conditions, and almost only Central America-originated accessions met that requirement (Supplementary Materials Figure S2B), seed setting variation was the highest among the Central American accessions. Altogether, these results show that photoperiod-insensitive accessions set seeds in Europe regardless of their origin, whereas accessions with mild photoperiod sensitivity may set seed provided that their site of origin reaches a certain temperature threshold, such as the mild photoperiod-sensitive accessions from Central America.

4.4. Selection of Early Flowering for Local Adaptation

Roux et al. [49] suggests that late flowering is an ancestral character in Arabidopsis thaliana and the flowering time response can be altered by the down or up-regulation of the regulatory factors such as floral repressive or promotive genes. Early flowering is a desired characteristic in maize that is cultivated at higher latitudes for a local adaptation, i.e., to be able to produce seeds and complete the filling phase before the onset of unfavorable environmental conditions such as frost [5]. In high latitudes, selection for short-day plants for earlier flowering has led the convergent evolution from an ancestral high photoperiod sensitivity to a reduced photoperiod sensitivity in several crops such as maize, sorghum, and rice [50,51,52,53,54]. Early flowering facilitates local adaptation also in high altitudes for similar reasons. Recently, Wang et al. [55] reported the parallel evolution of early flowering phenotypes in four highland maize populations compared to two lowland populations that exhibited later flowering. This study also showed that many flowering time genes were selected during highland adaptation, including genes from the photoperiod-pathway and the circadian clock. Among natural populations of the long-day plant Arabidopsis thaliana that were collected from close latitudes, populations from lower altitudes showed higher photoperiodic variation than populations from higher altitudes [56], which suggests that environmental variables associated with altitude impose natural selection on photoperiod sensitivity.
In our study, we observed a similar separation in the Central and South American accessions in the context of photoperiodic variation, i.e., a very large photoperiodic variation existed in Central America ranging from photoperiod-insensitive to highly sensitive accessions, whereas a lower range of variation existed among accessions from South America that mostly consisted of mildly photoperiod-sensitive accessions, in addition to a few exceptions. Particularly, we observed the same pattern between the Central and South American A. hybridus accessions. We tested 31 A. hybridus accessions, 25 of which originated from South America and 6 originated from Central America. The 23 South American accessions showed mild sensitivity, one showed high sensitivity and one accession did not flower, whereas 3 of the Central American accessions did not flower, indicating a high photoperiod sensitivity. Accordingly, South American A. hybridus accessions can be categorized as mildly photoperiod-sensitive, whereas a limited number of Central American A. hybridus accessions showed a wider variation in flowering time. Altogether, our results suggest a selection for reduced photoperiod sensitivity in (both grain and wild species) South American accessions including the wild putative ancestor A. hybridus.
Furthermore, we hypothesize that high photoperiod sensitivity of Central American A. hybridus accessions might have been eliminated in a potential migration event to South America in exchange to adapt to a decreasing latitude and/or increasing altitude to secure seed production under the colder temperature of South America. Stetter and Schmid [32] reported a population structure between the Central and South American lineages of A. hybridus, and Swarts et al. [57] proposed that flowering time in maize is not only correlated to population structure but also differentiates populations during the process of local adaptation. Similarly, such a differentiation between the Central and South American A. hybridus lineages may reflect local adaptation to South America.

4.5. Domestication Hypotheses in the Light of Photoperiodic Variation

Similar levels of flowering time variation among Central American A. hybridus and the Central American grain amaranths A. cruentus and A. hypochondriacus, and among South American A. hybridus accessions and South American grain species A. caudatus, respectively, agrees with a domestication model of an independent domestication of the three grain amaranth species from different subpopulations of A. hybridus, therefore supporting population genetic analyses [31,33].
The domestication model by Sauer [8] suggested that A. cruentus evolved from A. hybridus, A. hypochondriacus from a natural hybridization between A. cruentus and A. powellii, and A. caudatus from a natural hybridization between A. cruentus and A. quitensis, based on morphological characters. In our study, A. hypochondriacus accessions showed a high photoperiod sensitivity not observed in the other species. Therefore, mapping alleles responsible for this trait in A. hypochondriacus may allow us to test this domestication model. Alleles for high photoperiod sensitivity should be present in the A. powellii populations, but not in a photoperiod-insensitive A. cruentus progenitor. To test this hypothesis, photoperiodic variation of the Central American A. powellii accessions needs to be characterized. Espitia-Rangel et al. [58] studied the geographic distribution of A. cruentus and A. hypochondriacus originating from Mexico, and of their putative wild ancestors A. hybridus and A. powellii with approximately 3,000 geo-referenced accessions using passport data. They concluded that the domestication model of Sauer was supported because: (i) A. hybridus showed the widest geographic distribution which overlapped with the distribution of A. cruentus; (ii) A. hypochondriacus showed a similar latitudinal variation pattern with A. powellii and altitudinal variation pattern with A. cruentus. In contrast, A. powellii was not closely related to grain amaranths in a phylogenetic analysis of 35 amaranthus species [32]. However, the two A. powellii accessions used in this study did not originate from Central and South America. We therefore conclude that, based on our data, the first model of independent domestication from A. hybridus is more strongly supported.

5. Future Prospects

The large variation in flowering time and photoperiodic response can be harnessed in amaranth breeding programs for improved grain and biomass yield in Central Europe. We propose to use A. cruentus for grain amaranth breeding programs in temperate regions under long-day conditions. It is photoperiod-insensitive and not strongly affected by the variable photoperiods in different areas of cultivation. The species is also suitable for mechanical harvest because of a shorter plant height than the other grain amaranths. Breeding programs for biomass amaranth should consider a trade-off between earliness for high dry matter content and photoperiod sensitivity for improved dry matter yield [26], which can be combined in crosses between these two types of amaranths that differ in photoperiodic response. To this end, earliness can be selected from A. cruentus and South American accessions as donors of mild photoperiod sensitivity, since the delay in flowering time of highly photoperiod-sensitive accessions did not additionally contribute to plant height (Figure 4A). Genetic characterization of the grain amaranths and their putative wild ancestor species for adaptive traits plays an important role in utilizing the available variation in breeding programs. Therefore, testing of the species in the hybridus complex with (i) proper taxonomic and geographical sampling, (ii) under contrasting environments with varying photoperiods, and (iii) with more replicates, contributes to a more accurate photoperiodic characterization. Finally, the efficiency of speed breeding in amaranth has been demonstrated; this novel technology can be used in breeding programs and flowering time studies, and may contribute to the spread of this minor crop as an alternative to cope with the adverse effects of climate change [59].

Supplementary Materials

The following supporting information can be downloaded at: https://0-www-mdpi-com.brum.beds.ac.uk/article/10.3390/agronomy12020505/s1, Figure S1: Monthly mean values of the three environmental variables belong to the experimental location Heidfeldhof between May–October 2019; Figure S2: Box and bar plots of six environmental variables grouped by species and latitudinal groups, in each box and bar plot the respective groups were compared using a least significant difference (LSD) test and the groups with the different letters are significantly different at alpha = 0.05. No letters if there is no significant difference among the compared groups. Black asterisks indicate the mean values of each group in the box plots. Species are: cau, A. caudatus; cru, A. cruentus; hdus, A. hybridus; hyb, the ‘hybrid’ group; hypo, A. hypochondriacus and quit, A. quitensis; Figure S3: Box plots of three phenotypic traits and six environmental variables among the Central American accessions that were grouped by seed setting ‘1’ or no seed setting ‘0’. In each box plot the two groups were compared using a least significant difference (LSD) test and the groups with different letters are significantly different at alpha = 0.05. No letters if there is no significant difference among the two groups. Black asterisks indicate the mean values of each group in the box plots; Figure S4: Box plots of three phenotypic traits and six environmental variables among the Central American A. hypochondriacus accessions that were grouped by seed setting ‘1’ or no seed setting ‘0’. In each box plot the two groups were compared using a least significant difference (LSD) test and the groups with different letters are significantly different at alpha = 0.05. No letters if there is no significant difference among the two groups. Black asterisks indicate the mean values of each group in the box plots; Table S1: List of the accessions; Table S2: Accessions that did not flower; Table S3: Photoperiod-insensitive accessions that are of non-Central American origin but set seed; Table S4: Mild photoperiod-sensitive accessions that are of non-Central American origin but set seed; File S1: Statistical Analyses of Amaranth Characterization Paper.

Author Contributions

A.B. and K.S. designed the experiment. A.B. collected and analyzed the data and wrote the first version of the manuscript. Both authors edited, read and approved the final manuscript. All authors have read and agreed to the published version of the manuscript.

Funding

This work was supported by the F.W. Schnell endowed Professorship of the Stifterverband and the Hohenheim-Tübingen Regional Alliance of the Ministry of Science and Culture (MWK) of Baden-Württemberg.

Data Availability Statement

The phenotypic and climatic data is available from Figshare (10.6084/m9.figshare.19071812).

Acknowledgments

We thank the staff of the Heidfeldhof experimental station of Hohenheim University for help with the field experiment.

Conflicts of Interest

The authors declare no conflict of interest.

References

  1. Izawa, T. Adaptation of flowering-time by natural and artificial selection in Arabidopsis and rice. J. Exp. Bot. 2007, 58, 3091–3097. [Google Scholar] [CrossRef] [Green Version]
  2. Lagercrantz, U. At the end of the day: A common molecular mechanism for photoperiod responses in plants? J. Exp. Bot. 2009, 60, 2501–2515. [Google Scholar] [CrossRef] [Green Version]
  3. Craufurd, P.Q.; Wheeler, T.R. Climate change and the flowering time of annual crops. J. Exp. Bot. 2009, 60, 2529–2539. [Google Scholar] [CrossRef] [Green Version]
  4. Zhang, L.; Liu, W.; Tsegaw, M.; Xu, X.; Qi, Y.; Sapey, E.; Liu, L.; Wu, T.; Sun, S.; Han, T. Principles and practices of the photo-thermal adaptability improvement in soybean. J. Integr. Agric. 2020, 19, 295–310. [Google Scholar] [CrossRef]
  5. Jung, C.; Müller, A.E. Flowering time control and applications in plant breeding. Trends Plant Sci. 2009, 14, 563–573. [Google Scholar] [CrossRef]
  6. Ceccarelli, S. Specific adaptation and breeding for marginal conditions. Euphytica 1994, 77, 205–219. [Google Scholar] [CrossRef]
  7. Herrmann, A.; Rath, J. Biogas Production from Maize: Current State, Challenges, and Prospects. 1. Methane Yield Potential. Bioenergy Res. 2012, 5, 1027–1042. [Google Scholar] [CrossRef]
  8. Sauer, J.D. The grain amaranths and their relatives: A revised taxonomic and geographic survey. Ann. Mo. Bot. Gard. 1967, 54, 102–137. [Google Scholar] [CrossRef]
  9. National Research Council. Amaranth Modern Prospects for an Ancient Crop; National Academy Press: Washington, DC, USA, 1984; Volume 1, ISBN 9788578110796. [Google Scholar]
  10. Costea, M.; Tardif, F.J. The biology of Canadian weeds. 130. Amaranthus retroflexus L., A. powellii S. Watson and A. hybridus L. (update). Can. J. Plant Sci. 2004, 84, 631–668. [Google Scholar]
  11. Chaudhari, S.; Jordan, D.L.; York, A.C.; Jennings, K.M.; Cahoon, C.W.; Chandi, A.; Inman, M.D. Biology and Management of Glyphosate-Resistant and Glyphosate-Susceptible Palmer Amaranth (Amaranthus palmeri) Phenotypes from a Segregating Population. Weed Sci. 2017, 65, 755–768. [Google Scholar] [CrossRef]
  12. Becker, R.; Wheeler, E.L.; Lorenz, K.; Stafford, A.E.; Grosjean, O.K.; Betschart, A.A.; Saunders, R.M. A Compositional Study of Amaranth Grain. J. Food Sci. 1981, 46, 1175–1180. [Google Scholar] [CrossRef]
  13. Stallknecht, G.F.; Schulz-Schaeffer, J.R. Amaranth Rediscovered. In New Crops; Janick, J., Simon, J.E., Eds.; Wiley: New York, NY, USA, 1993; pp. 211–218. [Google Scholar]
  14. Brenner, D.M.; Baltensperger, D.D.; Kulakow, P.A.; Lehmann, J.W.; Myers, R.L.; Slabbert, M.M.; Sleugh, B.B. Genetic resources and breeding of Amaranthus. Plant Breed. Rev. 2000, 19, 227–285. [Google Scholar] [CrossRef]
  15. Liu, F.; Stützel, H. Biomass partitioning, specific leaf area, and water use efficiency of vegetable amaranth (Amaranthus spp.) in response to drought stress. Sci. Hortic. 2004, 102, 15–27. [Google Scholar] [CrossRef]
  16. von Cossel, M.; Möhring, J.; Kiesel, A.; Lewandowski, I. Methane yield performance of amaranth (Amaranthus hypochondriacus L.) and its suitability for legume intercropping in comparison to maize (Zea mays L.). Ind. Crops Prod. 2017, 103, 107–121. [Google Scholar] [CrossRef]
  17. Jain, S.K.; Hauptli, H.; Valdya, K.R. Outcrossing rate in grain amaranths. J. Hered. 1982, 73, 71–72. [Google Scholar] [CrossRef]
  18. Hauptli, H.; Jain, S. Genetic variation in outcrossing rate and correlated floral traits in a population of grain amaranth (Amaranthus cruentus L.). Genetica 1985, 66, 21–27. [Google Scholar] [CrossRef]
  19. Wu, H.; Sun, M.; Yue, S.; Sun, H.; Cai, Y.; Huang, R.; Brenner, D.; Corke, H. Field evaluation of an Amaranthus genetic resource collection in China. Genet. Resour. Crop Evol. 2000, 47, 43–53. [Google Scholar] [CrossRef]
  20. Mursec, B.; Vindis, P.; Janzekovic, M.; Brus, M.; Cus, F. Analysis of different substrates for processing into biogas Manufacturing and processing. J. Achieve Mater. Manuf. Eng. 2009, 37, 652–659. [Google Scholar]
  21. Pospišil, A. Yield and Quality of Forage Sorghum and Different Amaranth Species (Amaranthus spp.) Biomass. Agric. Conspec. Sci. 2009, 74, 85–89. [Google Scholar]
  22. Svirskis, A. Prospects for non-traditional plant species cultivated for forage in Lithuania. Not. Bot. Horti Agrobot. Cluj-Napoca 2009, 37, 215–218. [Google Scholar]
  23. Balodis, O.; Bartuševics, J.; Gaile, Z. Biomass yield of different plants for biogas production. In Environment. Technologies. Resources. Proceedings of the 8th International Scientific and Practical Conference, Rezekne, Latvia, 20–22 June 2011; Rezekne Academy of Technologies: Rēzekne, Latvia, 2011; Volume 1, pp. 238–245. ISBN 978-9984-44-070-5. [Google Scholar]
  24. Seppälä, M.; Laine, A.; Rintala, J. Screening of novel plants for biogas production in northern conditions. Bioresour. Technol. 2013, 139, 355–362. [Google Scholar] [CrossRef] [Green Version]
  25. Sitkey, V.; Gaduš, J.; Kliský, Ľ.; Dudák, A. Biogas Production From Amaranth Biomass. Acta Reg. Environ. 2013, 10, 59–62. [Google Scholar] [CrossRef] [Green Version]
  26. Baturaygil, A.; Stetter, M.G.; Schmid, K. Breeding Amaranth for Biomass: Evaluating Dry Matter Content and Biomass Potential in Early and Late Maturing Genotypes. Agronomy 2021, 11, 970. [Google Scholar] [CrossRef]
  27. Kulakow, P.A.; Jain, S.K. The inheritance of flowering time in Amaranthus species. J. Genet. 1985, 64, 85–100. [Google Scholar] [CrossRef]
  28. Andini, R.; Sulaiman, M.I.; Moulana, R.; Hmon, K.P.W.; Ohsawa, R. Application of principle component analysis in differentiating the three types of Amaranthus based on their photoperiodic flowering response. In IOP Conference Series: Earth and Environmental Science; IOP Publishing: Banda Aceh, Indonesia, 2020; Volume 425, p. 012005. [Google Scholar] [CrossRef]
  29. Rivelli, A.R.; Gherbin, P.; de Maria, S.; Pizza, S. Field evaluation of Amaranthus species for seed and biomass yields in southern Italy. Ital. J. Agron. 2008, 3, 225–229. [Google Scholar] [CrossRef] [Green Version]
  30. Hoidal, N.; Díaz Gallardo, M.; Jacobsen, S.E.; Alandia, G. Amaranth as a dual-use crop for leafy greens and seeds: Stable responses to leaf harvest across genotypes and environments. Front. Plant Sci. 2019, 10, 817. [Google Scholar] [CrossRef]
  31. Stetter, M.G.; Vidal-Villarejo, M.; Schmid, K.J. Parallel Seed Color Adaptation during Multiple Domestication Attempts of an Ancient New World Grain. Mol. Biol. Evol. 2020, 37, 1407–1419. [Google Scholar] [CrossRef]
  32. Stetter, M.G.; Schmid, K.J. Analysis of phylogenetic relationships and genome size evolution of the Amaranthus genus using GBS indicates the ancestors of an ancient crop. Mol. Phylogenet. Evol. 2017, 109, 80–92. [Google Scholar] [CrossRef] [Green Version]
  33. Kietlinski, K.D.; Jimenez, F.; Jellen, E.N.; Maughan, P.J.; Smith, S.M.; Pratt, D.B. Relationships between the weedy Amaranthus hybridus (Amaranthaceae) and the grain amaranths. Crop Sci. 2014, 54, 220–228. [Google Scholar] [CrossRef]
  34. Escobedo-López, D.; Núñez-Colín, C.A.; Espitia-Rangel, E. Adaptation of Cultivated Amaranth (Amaranthus spp.) and Their Wild Relatives in Mexico. J. Crop Improv. 2014, 28, 203–213. [Google Scholar] [CrossRef]
  35. Lightfoot, D.J.; Jarvis, D.E.; Ramaraj, T.; Lee, R.; Jellen, E.N.; Maughan, P.J. Single-molecule sequencing and Hi-C-based proximity-guided assembly of amaranth (Amaranthus hypochondriacus) chromosomes provide insights into genome evolution. BMC Biol. 2017, 15, 74. [Google Scholar] [CrossRef] [PubMed] [Green Version]
  36. Kahriman, F.; Aktaş, F.; Songur, U.; Şerment, M.; Egesel, C.Ö. Screening Turkish maize landraces for kernel oil content and oil quality traits. Plant Genet. Resour. Characterisation Util. 2020, 18, 278–286. [Google Scholar] [CrossRef]
  37. Grolemund, G.; Wickham, H. Dates and Times Made Easy with {lubridate}. J. Stat. Softw. 2011, 40, 1–25. [Google Scholar] [CrossRef]
  38. Horak, M.J.; Loughin, T.M. Growth Analysis of Four Amaranthus Species. Weed Sci. 2000, 48, 347–355. [Google Scholar] [CrossRef]
  39. Nowosad, J. Pollen: Analysis of Aerobiological Data. R Package Version 0.7.1. 2019. Available online: https://cran.r-project.org/web/packages/pollen/index.html (accessed on 3 December 2021).
  40. Fick, S.E.; Hijmans, R.J. WorldClim 2: New 1-km spatial resolution climate surfaces for global land areas. Int. J. Climatol. 2017, 37, 4302–4315. [Google Scholar] [CrossRef]
  41. Hijmans, R.J. Raster: Geographic Data Analysis and Modeling. R Package Version 3.4-13. 2020. Available online: https://CRAN.R-project.org/package=raster (accessed on 22 January 2022).
  42. Kauffman, C.S. Realizing the potential of grain amaranth. Food Rev. Int. 1992, 8, 5–21. [Google Scholar] [CrossRef]
  43. Zeileis, A.; Hothorn, T. Diagnostic Checking in Regression Relationships. R News 2002, 2, 7–10. [Google Scholar]
  44. de Mendiburu, F. Agricolae: Statistical Procedures for Agricultural Research. R Package Version 1.3-3. 2020. Available online: https://CRAN.R-project.org/package=agricolae (accessed on 18 November 2016).
  45. Harell, F.E. Hmisc: Harrell Miscellaneous. R Package Version 4.1-1. 2018. Available online: http://cran.nexr.com/web/packages/Hmisc/index.html (accessed on 3 January 2018).
  46. Wei, T.; Simko, V. R Package “Corrplot”: Visualization of a Correlation Matrix. R Package Version 0.90. 2017. Available online: https://cran.r-project.org/web/packages/corrplot/corrplot.pdf (accessed on 11 December 2021).
  47. R Core Team. R: A Language and Environment for Statistical Computing; R Foundation for Statistical Computing: Vienna, Austria, 2020. [Google Scholar]
  48. Liu, L.; Zhang, Y.; Yu, H. Florigen trafficking integrates photoperiod and temperature signals in Arabidopsis. J. Integr. Plant Biol. 2020, 62, 1385–1398. [Google Scholar] [CrossRef]
  49. Roux, F.; Touzet, P.; Cuguen, J.L.; Le Corre, V. How to be early flowering: An evolutionary perspective. Trends Plant Sci. 2006, 11, 375–381. [Google Scholar] [CrossRef]
  50. Matsubara, K.; Yamanouchi, U.; Nonoue, Y.; Sugimoto, K.; Wang, Z.X.; Minobe, Y.; Yano, M. Ehd3, encoding a plant homeodomain finger-containing protein, is a critical promoter of rice flowering. Plant J. 2011, 66, 603–612. [Google Scholar] [CrossRef]
  51. Hung, H.Y.; Shannon, L.M.; Tian, F.; Bradbury, P.J.; Chen, C.; Flint-Garcia, S.A.; McMullen, M.D.; Ware, D.; Buckler, E.S.; Doebley, J.F.; et al. ZmCCT and the genetic basis of day-length adaptation underlying the postdomestication spread of maize. Proc. Natl. Acad. Sci. USA 2012, 109, E1913–E1921. [Google Scholar] [CrossRef] [PubMed] [Green Version]
  52. Olsen, K.M.; Wendel, J.F. Crop plants as models for understanding plant adaptation and diversification. Front. Plant Sci. 2013, 4, 290. [Google Scholar] [CrossRef] [PubMed] [Green Version]
  53. Murphy, R.L.; Morishige, D.T.; Brady, J.A.; Rooney, W.L.; Yang, S.; Klein, P.E.; Mullet, J.E. Ghd7 (Ma6) Represses Sorghum Flowering in Long Days: Ghd7 Alleles Enhance Biomass Accumulation and Grain Production. Plant Genome 2014, 7. [Google Scholar] [CrossRef]
  54. Gaudinier, A.; Blackman, B.K. Evolutionary processes from the perspective of flowering time diversity. New Phytol. 2019, 225, 1883–1898. [Google Scholar] [CrossRef] [Green Version]
  55. Wang, L.; Josephs, E.B.; Lee, K.M.; Roberts, L.M.; Rellán-Álvarez, R.; Ross-Ibarra, J.; Hufford, M.B. Molecular Parallelism Underlies Convergent Highland Adaptation of Maize Landraces. Mol. Biol. Evol. 2021, 38, 3567–3580. [Google Scholar] [CrossRef] [PubMed]
  56. Lewandowska-Sabat, A.M.; Fjellheim, S.; Olsen, J.E.; Rognli, O.A. Local Populations of Arabidopsis thaliana Show Clear Relationship between Photoperiodic Sensitivity of Flowering Time and Altitude. Front. Plant Sci. 2017, 8, 1046. [Google Scholar] [CrossRef] [Green Version]
  57. Swarts, K.; Bauer, E.; Glaubitz, J.C.; Ho, T.; Johnson, L.; Li, Y.; Li, Y.; Miller, Z.; Romay, C.; Schön, C.C.; et al. Joint analysis of days to flowering reveals independent temperate adaptations in maize. Heredity 2021, 126, 929–941. [Google Scholar] [CrossRef]
  58. Espitia Rangel, E.; Mapes Sánchez, E.; Núñez-Colín, C.A.; Escobedo López, D. Geographical distribution of cultivated species of Amaranthus and their wild relatives in Mexico Eduardo. Rev. Mex. Cienc. Agrícolas 2010, 1, 427–437. [Google Scholar]
  59. Jähne, F.; Hahn, V.; Würschum, T.; Leiser, W.L. Speed breeding short-day crops by LED-controlled light schemes. Theor. Appl. Genet. 2020, 133, 2335–2342. [Google Scholar] [CrossRef]
Figure 1. Geographical distribution of the accessions used in the study (n = 226). Dot colors indicate the categorically determined latitudinal groups of the accessions. Red color indicates Central America group, green color indicates South America-I group and blue color indicates South America-II group.
Agronomy 12 00505 g001
Figure 2. Box and bar plots of four phenotypic traits grouped by species and latitudinal groups (AH), in each box and bar plot the respective groups were compared using a least significant difference (LSD) test and the groups with the different letters were significantly different at alpha = 0.05. There are no letters if there was no significant difference among the compared groups. Black asterisks (*) indicate the mean values of each group in the box plots. Species are: cau, A. caudatus; cru, A. cruentus; hdus, A. hybridus; hyb, the ‘hybrid’ group; hypo, A. hypochondriacus; and quit, A. quitensis.
Agronomy 12 00505 g002
Figure 3. Spearman’s correlation matrix of (A) all accessions, (B) the South American accessions, (C) the Central American accessions and (D) the Central American A. hypochondriacus accessions. Phenotypic traits and environmental variables are: SS, seed setting; FT, flowering time; PH, plant height; GDD, growing degree days; LONG, longitude; LAT, latitude; ELEV, elevation; PREC, precipitation and TEMP, temperature. In the correlation matrices *, **, *** indicate significance at p < 0.05, p < 0.01 and p < 0.001, respectively.
Agronomy 12 00505 g003
Figure 4. (A) The polynomial relationship between flowering time and plant height. (B) Dot plot of flowering time. Y axis indicates the species and X axis indicates the flowering days. Each dot corresponds to an accessions flowering time and the color of the dot indicates if the flowering event occurring on the corresponding day resulted in seed setting (green color) or no seed setting (red color). (C) Flowering time histogram of the Central American accessions grouped by species. (D) Flowering time histogram of the Central American A. hypochondriacus accessions grouped by seed setting behavior.
Agronomy 12 00505 g004
Publisher’s Note: MDPI stays neutral with regard to jurisdictional claims in published maps and institutional affiliations.

