Article

Short-Term Effect of In Situ Biochar Briquettes on Nitrogen Loss in Hybrid Rice Grown in an Agroforestry System for Three Years

1
Department of Silviculture, Faculty of Forestry, Universitas Gadjah Mada, Bulaksumur, Yogyakarta 55281, Indonesia
2
Department of Agronomy, Faculty of Agriculture, Universitas Gadjah Mada, Bulaksumur, Yogyakarta 55281, Indonesia
3
Department of Soil, Faculty of Agriculture, Universitas Gadjah Mada, Bulaksumur, Yogyakarta 55281, Indonesia
4
Assessment Institute for Agricultural Technology of Central Sulawesi, Ministry of Agriculture, Sigi 94362, Indonesia
*
Author to whom correspondence should be addressed.
Submission received: 28 December 2021 / Revised: 17 February 2022 / Accepted: 18 February 2022 / Published: 24 February 2022
(This article belongs to the Special Issue The Effects of Biochar on Organisms)

Abstract

:
Kayu putih (Melaleuca cajuputi) waste has the potential via in situ biochar briquettes to overcome the low availability of nitrogen in soil. This study evaluated the short-term effects of in situ biochar briquettes on nitrogen loss reduction and determined an optimum scenario for hybrid rice grown in an agroforestry system among kayu putih stands. This three-year experiment (2019–2021) was conducted using a randomised complete block design factorial with three blocks as replications. The treatments included biochar briquettes made from kayu putih waste (0-, 2-, 4-, and 6-grain plant−1 or 0, 5, 10, and 15 tonnes ha−1) and urea fertiliser (0, 100, 200, and 300 kg ha−1). The results demonstrated that the eco–environmental scenario was the most efficient strategy that improved the soil quality, the physiological characteristics, and the yield of the hybrid rice with the optimum application of the biochar briquettes at 5.54-grain plant−1 and the urea fertiliser at 230.08 kg ha−1. This alternative approach illustrated a reduction in both the usage of urea fertiliser and the loss of nitrogen by 23.31% and 26.28%, respectively, while increasing the yield of the hybrid rice by 24.73%, as compared to a single application of 300 kg urea ha−1 without biochar briquettes.

Graphical Abstract

1. Introduction

Rice is the primary food commodity cultivated by the majority of farmers in Indonesia. The Food and Agricultural Organisation (FAO) [1] has stated that rice is the principal source of income for farmers with less than one hectare of paddy land. Statistics Indonesia [2] reported that in 2019, rice production diminished by 4.60 million tons or 7.76% compared to 2018. The primary factor in this decline was the conversion of 96,512 hectares of agricultural land to non-agricultural land per year. Agricultural land is expected to recede from 8.10 million hectares to 5.10 million hectares by 2045 [3].
The implementation of hybrid rice varieties and land intensification between kayu putih (Melaleuca cajuputi) stands could augment rice production in agroforestry systems [4,5,6,7]. With a higher grain yield ranging between 6.1% and 11.9%, hybrid varieties are preferred by rice farmers compared to inbred rice [8,9]. An agroforestry system can be defined as a land-use system that integrates annual crops with perennial crops in conjunction with technological innovations [10,11]. The potential land area of kayu putih forests in Indonesia is 248,756 hectares [12]. The advantage of growing rice amongst the kayu putih stands is that there is no competition between the species for natural sunlight as the leaves and branches of the kayu putih are pruned twice annually. In addition, the root-zone differential mitigates any competition for nutrients and water [4,5,6].
In Indonesia, kayu putih forests are mostly found in alkaline soils with high clay content [12]. These ground conditions result in reduced availability of macronutrients, particularly regarding the nitrogen (N) content in the soil [13,14]. Nitrogen is one of the main elements that is required by plants in relatively large amounts. Its principal role is as the main element in the formation of chlorophyll in the leaves for photosynthesis [15]. Several studies have reported that its deficiency in rice has caused decreased cytokinin release, inhibited the photosynthetic rate as well as the root growth, resulting in stunted crops and decreased productivity [15,16,17]. There is also less N available in the soil due to several processes, namely volatilization (NH3), leaching (NO3–N), and denitrification into N2O and N2. Because hybrid rice requires high levels of N to produce a better yield, the low efficiency prediction of N fertilisation at only 45% and the high N loss in the soil result in contrasting depleted harvests [18,19,20,21,22].
The use of biochar has been suggested as an alternative solution to overcome the reduced N availability in kayu putih forests while increasing annual crop production in rainfed areas [13,23,24,25]. The biomass pyrolysis process with minimal or no oxygen conditions produces three main products: biochar, liquid, and syngas. The results of these three pyrolysis products are helpful for energy generation, soil quality improvement, waste management, and mitigating climate change or water pollution [26]. In agriculture, biochar reduces N loss from various processes (e.g., volatilisation, leaching, and denitrification) and increases nitrogen-use efficiency (NUE) and crop productivity [27,28,29,30]. Biochar has large pores on the surface (micro and macro effects), increasing porosity by 351.14% and reducing soil bulk density by 933.33% on clay textures. In addition, the application of biochar can increase the microbial content in the soil so that crop yields increase [31,32,33].
In situ kayu putih waste converted into biochar has proven to be useful as a soil-improvement agent [13,14]. Kayu putih waste originating from the distillation of leaves and branches has become a prevailing issue in nearly all the oil refineries in Indonesia due to its abundancy and availability [13]. The biochar potential of kayu putih waste is indicated by its pH (H2O) as well as its C, H, N, and O contents, which have been measured at 8.05 g kg−1, 738.8 g kg−1, 23.2 g kg−1, 1.7 g kg−1, and 22.58 g kg−1, respectively [13]. Cahayaningrum [34] and Sianturi [35] found that biochar made from kayu putih waste did not show a significant difference in the yield of hybrid maize in agroforestry systems with kayu putih stands during both the dry and wet seasons, as compared to rice-husk biochar, demonstrating that kayu putih waste biochar can replace the widely used rice-husk biochar.
Research conducted by Faridah et al. [14] revealed that the application of kayu putih waste biochar at 11.14 tonnes ha−1 to rice crops in an agroforestry system with kayu putih reduced the use of urea fertiliser by 15.75%, decreased the N loss by 63.41%, and increased the rice yield by 44.76%. The decrease in the N loss and the increase in the rice yield was also achieved by reducing the release rate of N nutrients to maximise nutrient absorption by plants [36]. Biochar briquettes made from kayu putih waste applied to soybeans under similar conditions increased the NUE by 19.07% and the soybean yield by 13.02% while reducing the N loss by 38.25% [37].
The objective of this study was to evaluate the short-term effect of in situ biochar briquettes on nitrogen loss and to determine the optimum scenarios for hybrid rice agroforestry systems with kayu putih. The results of this study provide information for farmers, researchers, corporations, and governing bodies to overcome the problem of kayu putih waste and to utilize its benefits in agroforestry systems with kayu putih to help reduce nitrogen loss and increase hybrid rice yield.

2. Materials and Methods

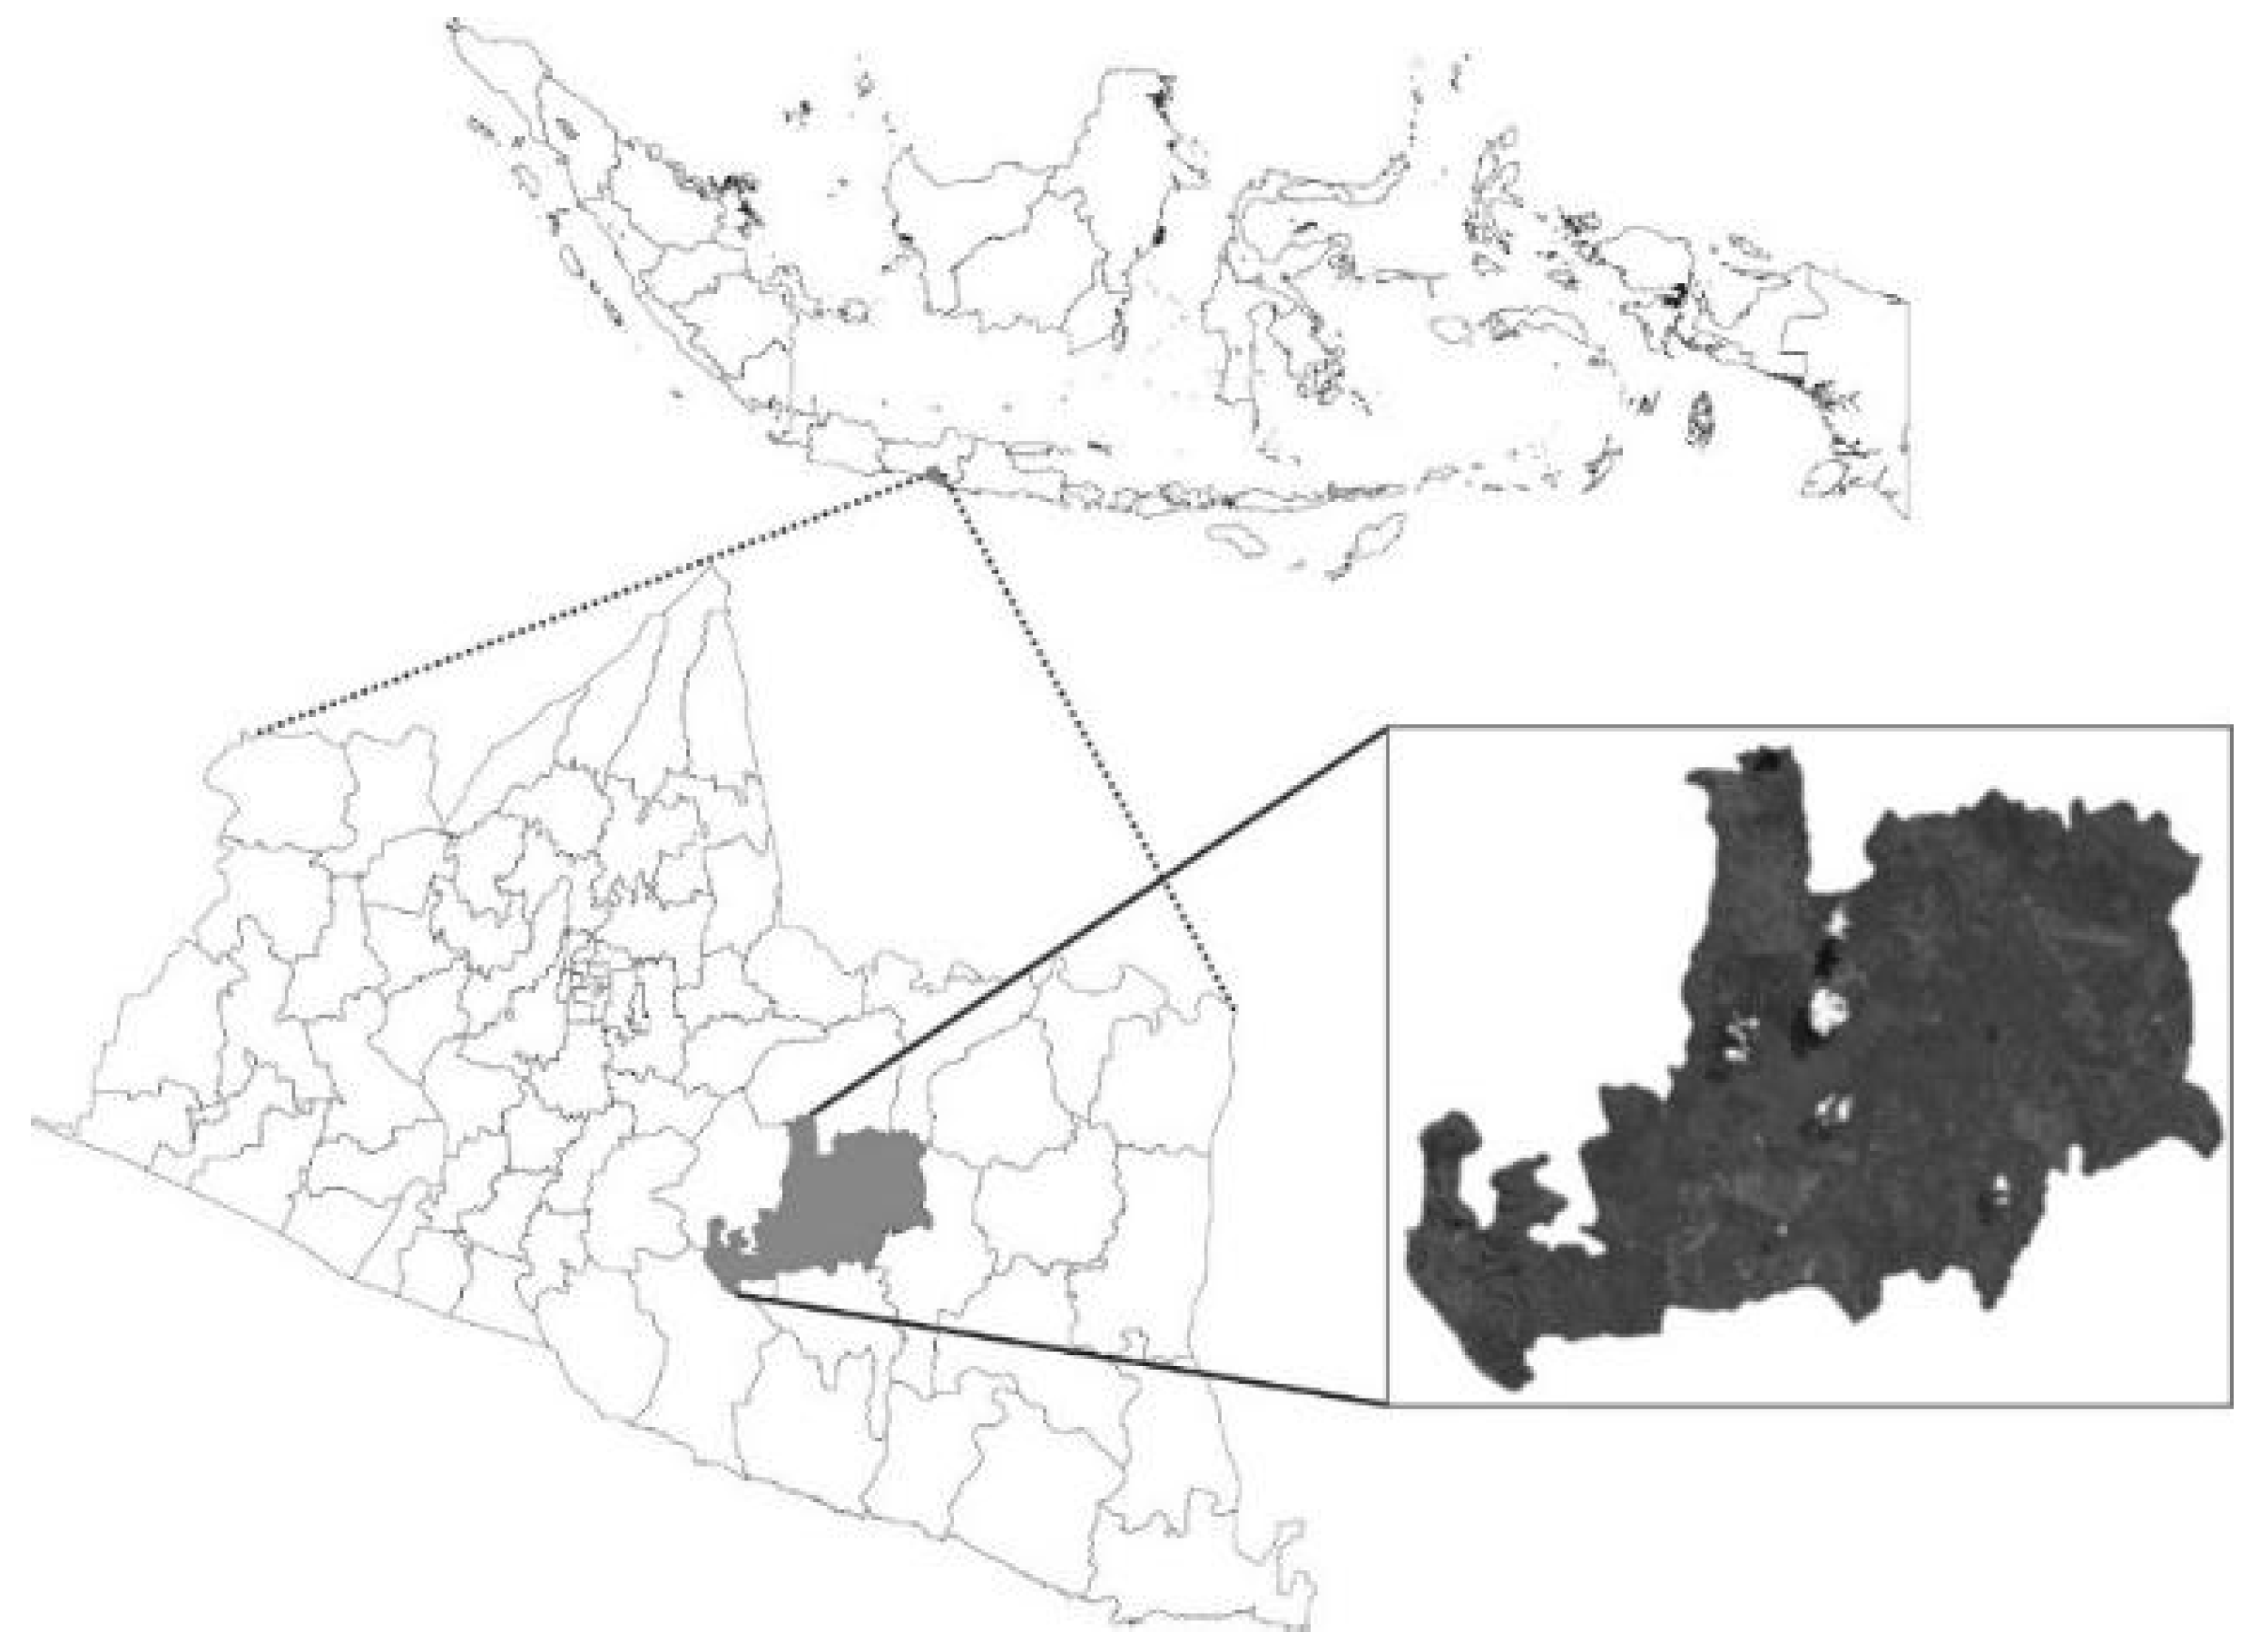
2.1. Experimental Site

The experiment was conducted over a period of three years (2019–2021) during the wet season (November–March) at the Menggoran Forest Resort (Playen Forest Section, Yogyakarta Forest Management, Indonesia). The experimental location was ±43 km to the southeast of Yogyakarta City (Figure 1). The experimental location had an altitude of ±150 m above sea level with an average total rainfall, air temperature, relative humidity, and wind speed of 1810.13 mm year−1, 26.65 °C, 82.17%, and 3.67 m s−1, respectively.
The soil type at the experimental site was Lithic Haplusterts [4,5]. Lithic Haplusterts belong to the order Vertisol and are characterized by contact with rocks at a depth of less than 50 cm from the soil surface, slickenside, with a vertic property (the seasonal cracking pattern pertains to non-irrigated soils). The soil moisture regime was categorised under the ustic moisture regime [38].
Soil texture was dominated by clay fraction (62.53%) with very low permeability (0.001 h−1). The water-holding capacity (WHC) and the total porosity (TP) were measured at 40.36% and 38.64%, respectively. The values for CEC, soil pH (H2O), and soil organic carbon (SOC) were 60.22 cmol(+) kg−1 (very high), 8.4 (alkaline), 1.80 (low), respectively. Total nitrogen (TN), phosphorus availability (P), and potassium (K) availability were measured at 0.09% (very low), 14 ppm (medium), and 0.24 cmol(+) kg−1 (low), respectively. The availabilities of calcium (Ca), magnesium (Mg), and sodium (Na) were measured at 24.52 cmol(+) kg−1 (very high), 2.23 cmol(+) kg−1 (high), and 0.85 cmol(+) kg−1 (high), respectively. Djaenudin et al. [39] stated that the study site was in the category of a marginally suitable class (S3) for upland rice cultivation.

2.2. Experimental Design

The experiment was designed by utilising the randomised complete block design factorial with three blocks as replications. The treatments included different levels of biochar briquettes made from kayu putih waste that consisted of 0-, 2-, 4-, and 6-grain plant−1 at 0, 5, 10, or 15 tonnes ha−1, respectively. The nitrogen fertiliser supplied by urea consisted of 0, 100, 200, or 300 kg ha−1, respectively, during the three-year period between 2019 and 2021.

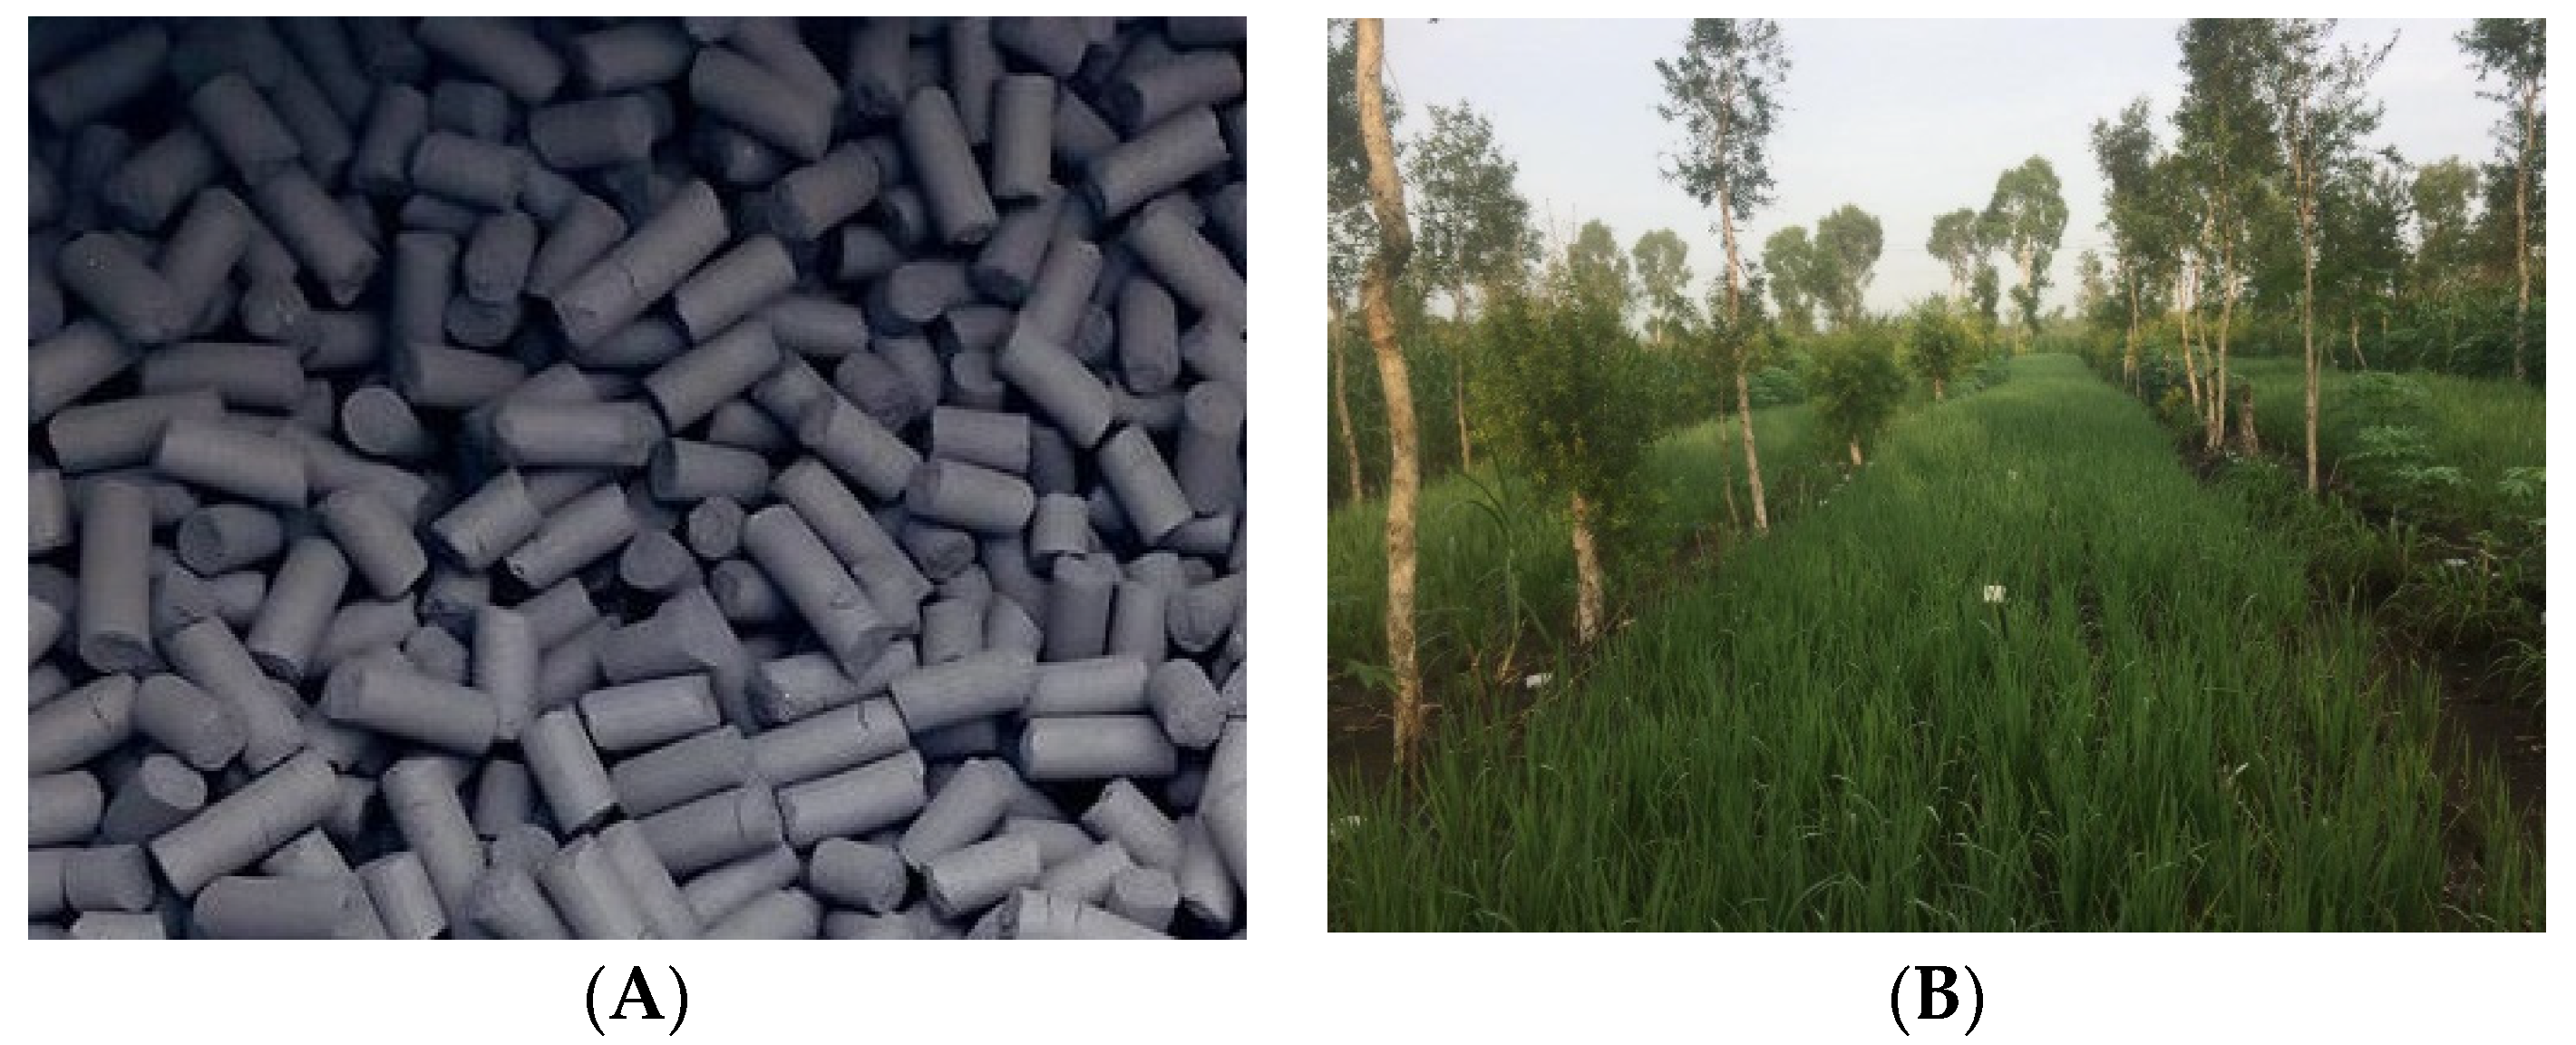
2.3. Biochar Briquettes Preparation

The biochar briquettes were produced using the in situ waste of distilled kayu putih leaves and branches. The biochar was manufactured using the traditional kiln method [40] during the first stage of its preparation. Manufacturing of biochar used a stainless kiln (capacity 40 L) at temperatures of ± 250–350 °C with a long burning time of 3.5 h. The second stage involved mixing, moulding, and drying. The mixing process comprised the incorporation of the biochar with 2% adhesive (Figure 2A). The adhesive material used was molasses. The moulding process used a machine manufactured by Royal Genset Ltd., Indonesia (15–18 hp and 200–300 kg h−1 capacity). The drying process utilised natural sunlight, yielding a moisture content of 14%. Each briquette weighed 10 g [37]. The laboratory analysis results of the biochar briquettes are provided in Table 1.

2.4. Field Layout and Treatments Application

The experiment incorporated the Mapan-05 hybrid rice variety from Primasid Andalan Utama Ltd., Indonesia. The experimental plots were strategically placed between the kayu putih stands of 24 m2 (6 m × 4 m). The harvest area for hybrid rice was 20 m2 and did not include the border crops. Soil tillage was completed prior to sowing with moderate ploughing. The hybrid rice seeds were planted directly with a spacing of 25 cm × 25 cm with one seed per planting hole. The biochar briquettes were applied one week after planting (WAP), and urea fertiliser was applied when the hybrid rice reached one and eight WAP. The urea fertiliser used in this experimental contained 45.89% of NO3–N. Phosphorus and potassium fertilisations were applied at 100 and 150 kg ha−1, one WAP, respectively. The application of biochar briquettes and inorganic fertilizers was made manually. Irrigation was not carried out during the study as the experimental plots were situated in a rainfed area (Figure 2B).

2.5. Data Collection

The observation parameters included for this study were water-holding capacity (WHC) [41], total porosity (TP) [42], soil organic carbon after harvesting (SOC) [43], total nitrogen in the soil after harvesting (TN) [44], total fungi in the soil after harvesting (TF) [45], total bacteria in the soil after harvesting (TB) [45], nitrate reductase activity (NRA) [46], total chlorophyll (TC) [47], leaf photosynthetic rate (LPR) [48], nitrogen loss (NL) [49], nitrogen-use efficiency (NUE) [50], and yield of hybrid rice (YHR) [51].
The WHC, TP, SOC, TN, TF, and TB observations were conducted during rice harvesting. The NRA, TC, and LPR were measured when the hybrid rice entered the maximum vegetative phase. The NL parameter was calculated by Equation (1) [49]:
N loss = N initial + N fertiliser N plant N residual
where Nloss is N losses (kg ha−1); Ninitial is the initial of total N content in the soil up to 30 cm depth before planting (kg ha−1); Nfertiliser is the amount of N fertiliser applied (pure N (N applied × 45.89%)) and weight of biochar briquettes applied × 0.80% (kg ha−1); Nplant is the N uptake of the rice at harvesting (kg ha−1); and Nresidual is the total N content in the soil up to 30 cm depth after harvesting (kg ha−1). The NUE parameter was calculated by Equation (2) [50]:
NUE = Y ( N initial + N fertiliser )
where Y is the yield of the hybrid rice (kg ha−1); Ninitial is the initial of the total N content in the soil; and Nfertiliser is the N fertiliser applied (pure N (N applied × 45.89%)) and weight of biochar briquettes applied × 0.80%.
The yield observation was conducted by harvesting the hybrid rice in the experimental plot, excluding the borders; then it was dried to 14% moisture content and weighed with a digital scale [51].

2.6. Statistical Approach

Each data parameter was required to be normally distributed with homogeneity variance assumptions. The normal distribution had a Q–Q plot and homogeneous variance with a residual vs. value graph [52]. Analysis of variance (ANOVA) (p < 0.05) was used to determine the interaction between treatment factors (biochar briquettes, urea fertilizer, and the experimental time period). Comparisons of response variables among experimental years was conducted using ANOVA (p < 0.05) and was followed by the least square means (LS-Means) test and the Tukey–Kramer test (p < 0.05) [52].
The response surface methodology (RSM) equation used in this experiment applied the uncoded independent variables. The response models for the two variables were fitted according to Equation (3) [53,54]:
y i = β 0 + i = 1 2 β i x i 2 + i = 1 2 j = 1 + 1 2 β ij x i x j
where yi is the predicted response; βi is the linear terms; βii is the squared terms; βij is the interaction terms; and xi and xj are the coded independent variables.
The full quadratic polynomial equation used the uncoded independent variables, according to Equation (4) [53,54]:
y: β0 + β1×1 + β2×2 + β11x12 + β12x1x2 + β22x22
where x1, x2, …, and xn are the linear terms in each of the variables; x1 and x2 are the squared terms in each of the variables; x1x2 is the first-order interaction term for each paired combination; β1 and β2 are the response-model coefficients; and β0 is the intercept coefficient.
The fitted RSM model was evaluated by the value of R squared (R2), root mean square error (RMSE), and the lack-of-fit test. The lack-of-fit test had to be less than 5% [54]. The relationship between variables was analysed by partial least square structural equations modelling (PLS–SEM) and stepwise regression [6,7]. The optimum levels of biochar briquettes and urea fertiliser were incorporated using three scenarios (economic, environmental, and eco–environmental). The economic and environmental scenarios were based on the hybrid rice yield and the nitrogen-loss parameters while eco–environmental scenarios used NUE parameters [13,53]. Estimations of the three scenarios were applied to the ridge regression [55]. The analysis of ANOVA, RSM, ridge regression, and stepwise-regression analyses were performed using PROC GLM, PROC GLIMMIX, PROC RSREG, and PROC REG, respectively, in SAS 9.4 software [56]. PLS–SEM was performed using the SmartPLS 3 software [57].

3. Results

3.1. Interaction between Biochar Briquettes, Nitrogen Fertiliser, and the Experimental Time Period

The Q–Q plot and residual vs. value graph showed that the model had normally distributed data and homogeneous variance. The results of the ANOVA analysis on the variability of the soil properties demonstrated that only B × U on the TN parameter interacted while B × Y, U × Y, and B × U × Y showed no interactions. The biochar briquettes showed significant variance in WHC, TP, SOC, TN, TF, and TB. The application of urea fertiliser displayed a significant deviation in TN level. The total time period also showed considerable differences in the variability of the soil properties, including the WHC, TP, SOC, TN, TF, and TB. The variability results of the soil properties by ANOVA are shown in Table 2.
The results of the ANOVA analysis on the physiological characteristics and hybrid rice yield variables showed an interaction between B × U in NRA, TC, LPR, NL, NUE, and YHR. In contrast, there were no interactions between B × Y, U × Y, and B × U × Y in physiological characteristics or the hybrid rice yield variables. The treatments with biochar briquettes showed noteworthy variance in NRA, TC, LPR, NL, NUE, and YHR. The urea fertiliser applications also demonstrated considerable variance in NRA, TC, LPR, NL, NUE, and YHR. The experimental time period displayed significant differences in NRA, TC, LPR, NL, NUE, and YHR. The ANOVA results of the physiological characteristics and the hybrid rice yield variables are presented in Table 3.

3.2. Comparison of Response Variables between Experimental Years

The LS-Means values showed a significant variance between the experiments conducted in 2019, 2020, and 2021 (Table 4). It was illustrated by the differences in all the response variable values tested in this experiment, namely, the WHC, TP, SOC, TN, TF, TB, NRA, TC, LPR, NL, NUE, and YHR. There was a considerable elevation in all response variables except for the NL variable which lessened in value. The average increase in WHC, TP, SOC, TN, TF, TB, NRA, TC, LPR, NL, NUE, and YHR during 2019–2021 were 19.60%, 6.37%, 9.11%, 3.22%, 896.59%, 52.65%, 8.46%, 20.69%, 12.02%, −26.02%, 56.11%, and 32.12%, respectively.

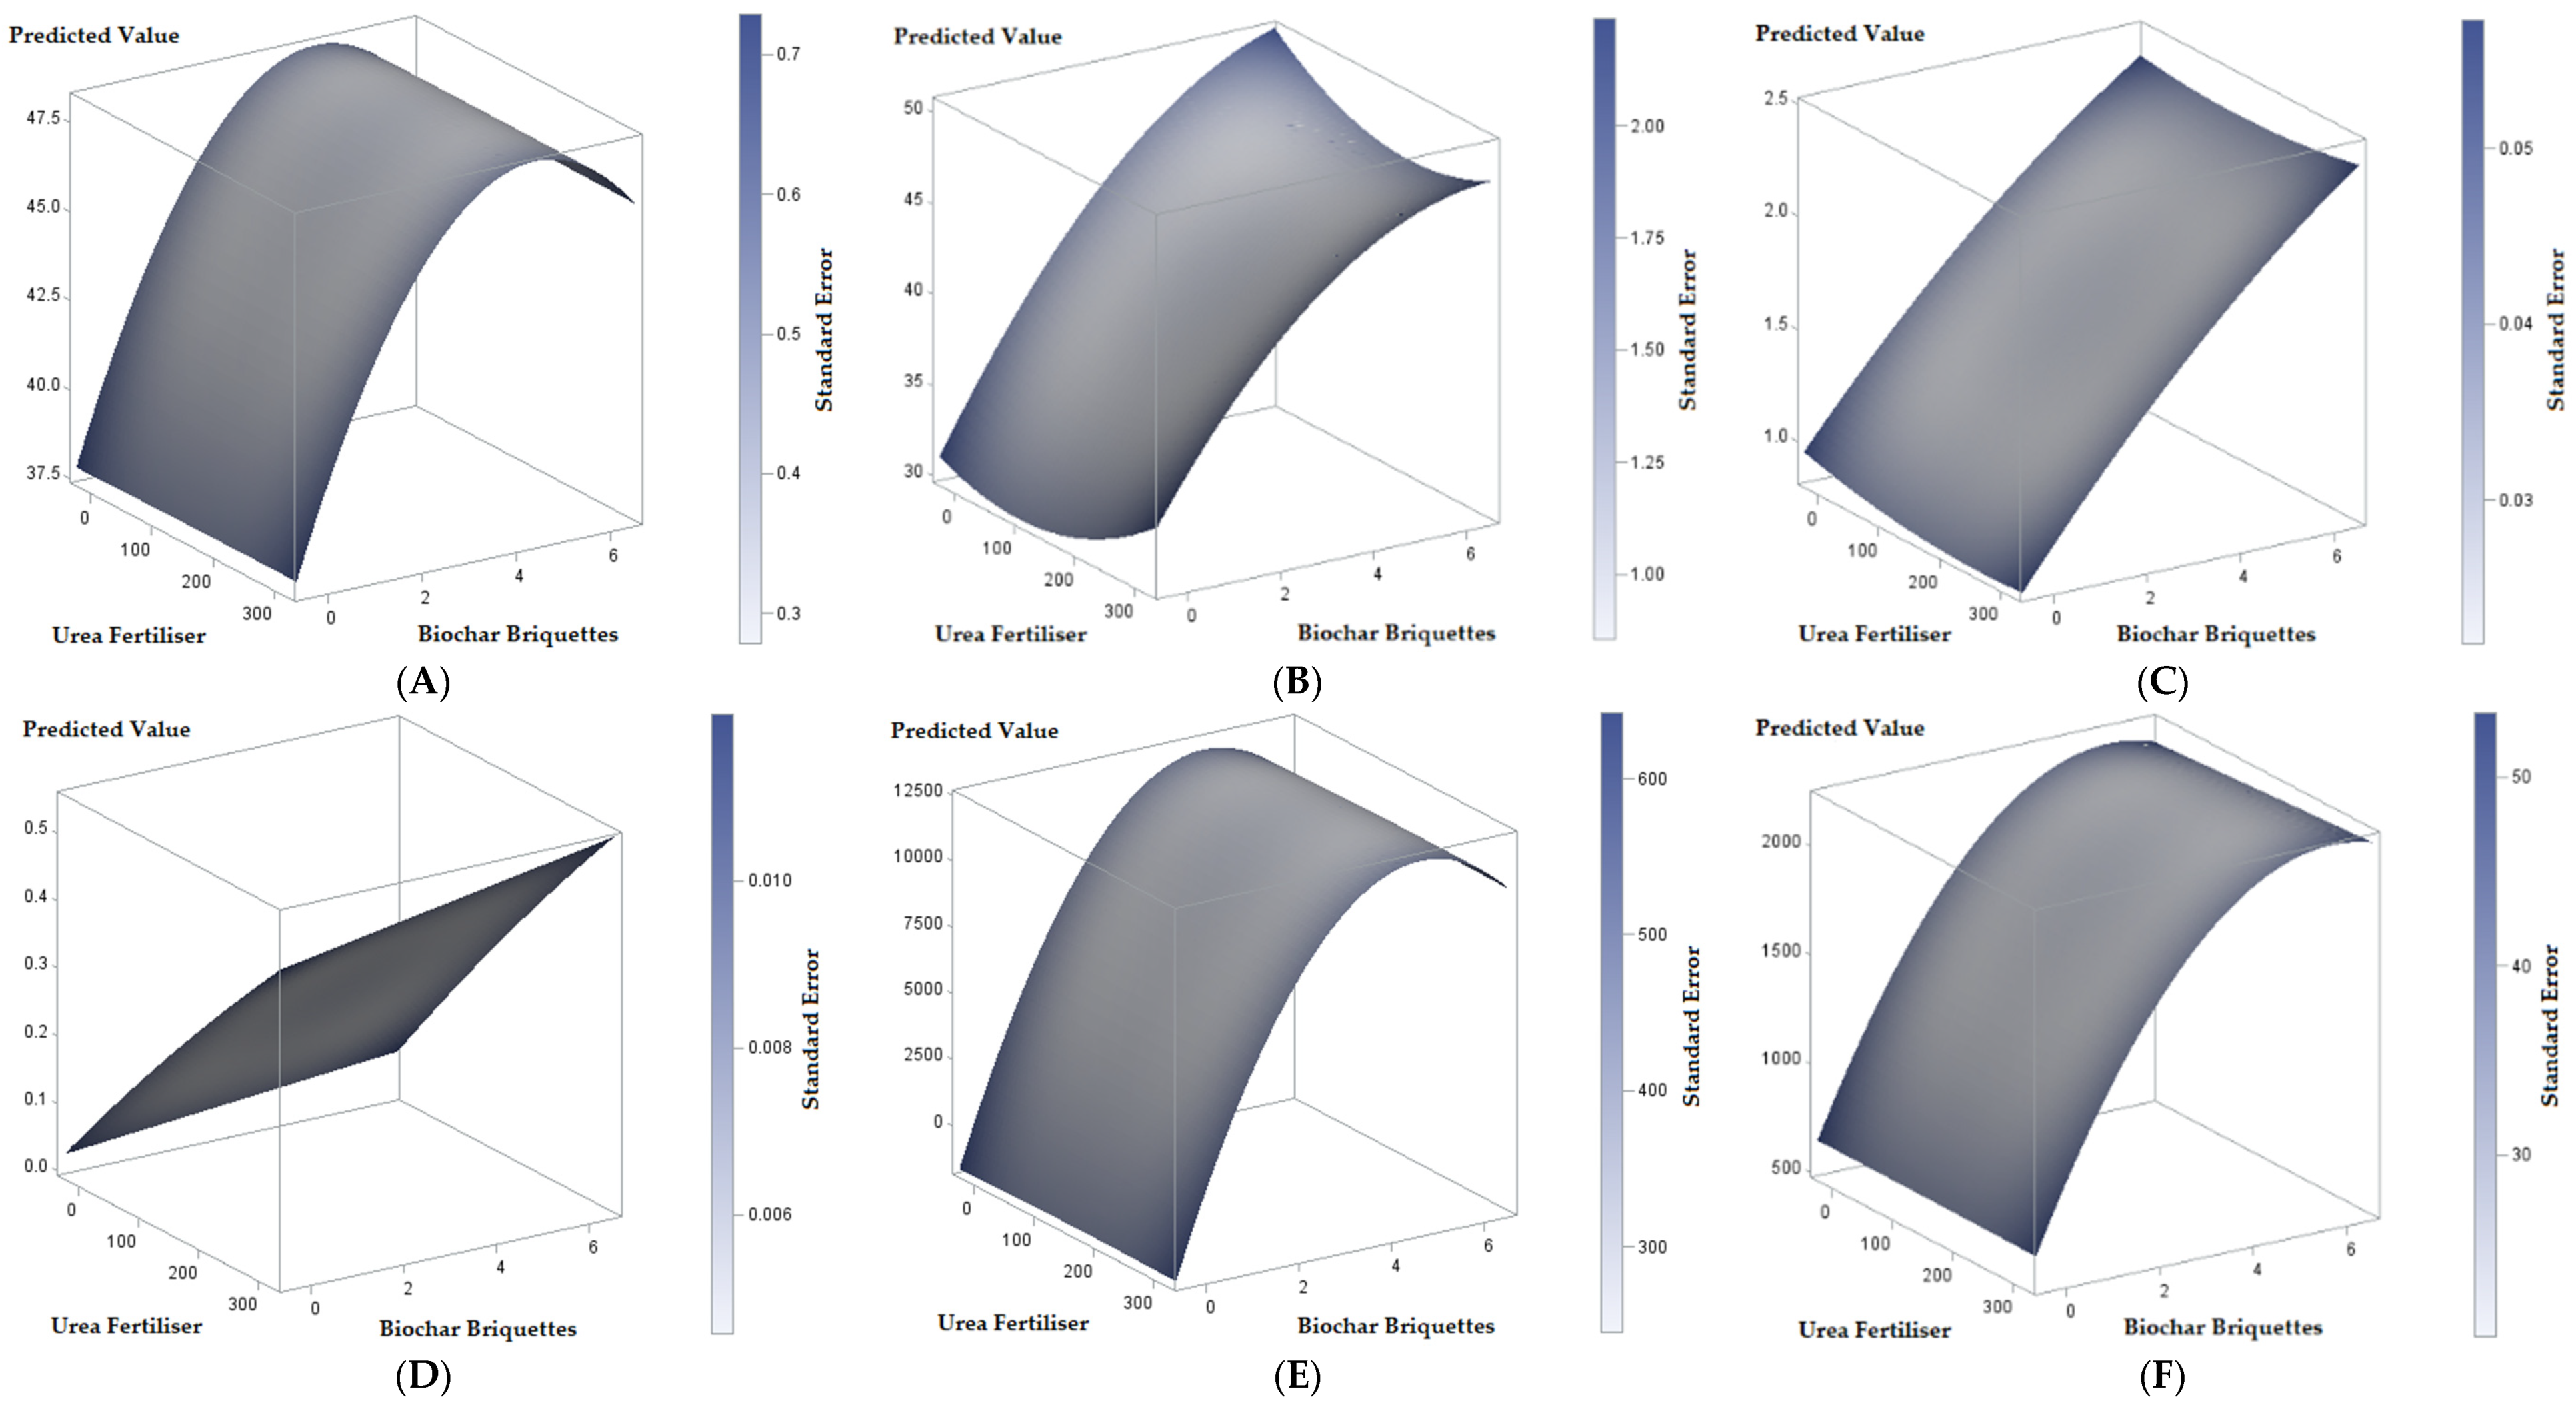
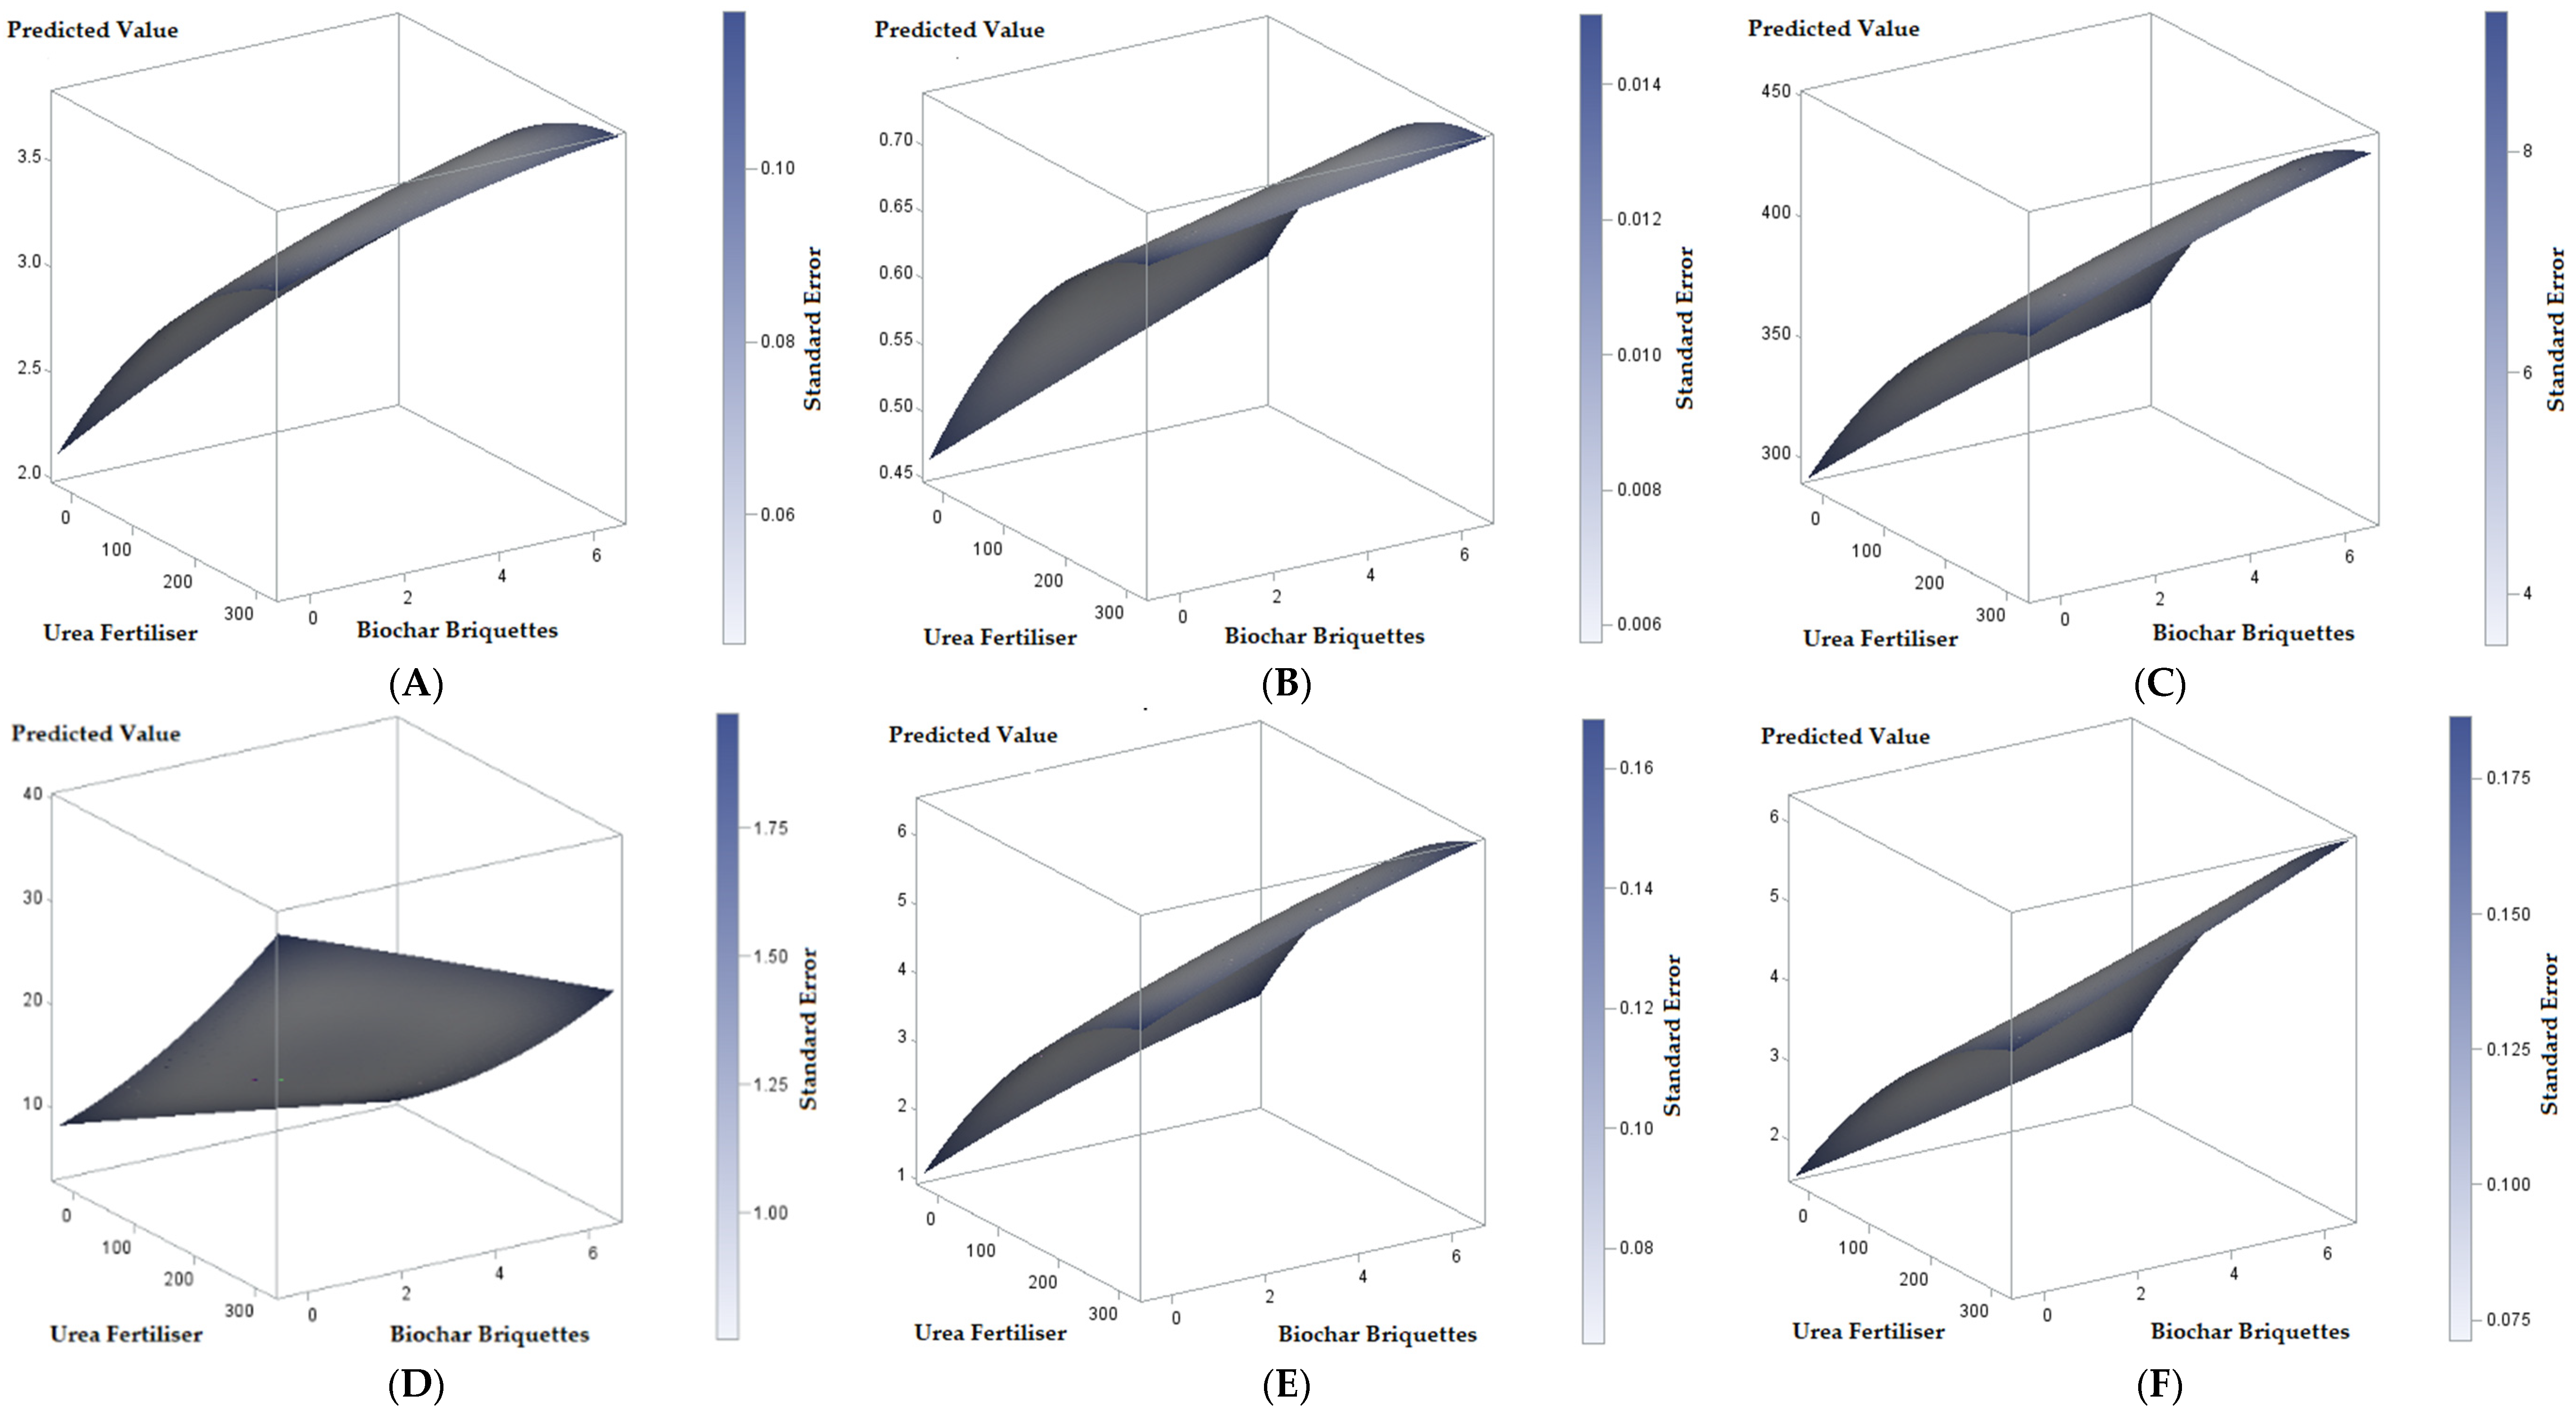
3.3. Fitted Models and Estimated Outcome of Response Variables

The RSM results for the full quadratic regression of the independent variables is presented in Table 5. The lack-of-fit test was utilised to evaluate the fitted performance of the RSM model. The lack-of-fit test displayed no significant differences in any response variables analysed in this experiment. The RSM model with a significance of less than 5% indicated that the model was feasible to use. The fitted models for the experimental variables are presented in Table 5.
The application of the biochar briquettes remarkably improved the WHC, in contrast withto the urea fertiliser, as presented in Table 5. The applications of biochar briquettes and urea fertiliser illustrated linear patterns. The applications of 6-grain plant−1 biochar briquettes and 300 kg ha−1 showed the highest WHC value at 47.52% (Table 6). The optimum application of the biochar briquettes at 4.47-grain plant−1 and the urea fertiliser at 136.23 kg ha−1 exhibited the maximal level of WHC, which was recorded at 48.18% (Figure 3A). The biochar-briquette treatment also ameliorated the TP value, as compared to the TP value when treated with urea fertiliser (Table 5). The applications of biochar briquettes and urea fertiliser showed a linear pattern. The applications of 6-grain plant−1 and 300 kg ha−1 urea fertiliser showed the highest TP value at 46.98% (Table 6). A maximum TP value of 47.34% was achieved with the optimum application of biochar briquettes and urea fertiliser at 5.52-grain plant−1 and 68.38 kg ha−1, respectively (Figure 3B).
Similarly, the biochar-briquette treatment also elevated the SOC accumulation, as compared to the urea fertiliser (Table 5). The biochar briquettes and the urea fertiliser both showed a linear pattern for the SOC. The biochar briquettes at 6-grain plant−1 and the urea fertiliser at 300 kg ha−1 resulted in the highest SOC at 2.23% (Table 6). Furthermore, the optimum application of the biochar briquettes and the urea fertiliser at 3.04-grain plant−1 and 299.99 kg ha−1 resulted in the highest SOC value at 2.25% (Figure 3C). The application of the biochar briquettes and the urea fertiliser also significantly increased the TN level (Table 5). The applications of the biochar briquettes and the urea fertiliser illustrated a similar linear pattern. The application of a 6-grain plant−1 of biochar briquettes and 300 kg ha−1 of the urea fertiliser yielded the highest TN amount at 0.50% (Table 6). The maximum TN value of 0.48% was achieved by applying the optimum application of the biochar briquettes and the urea fertiliser at 3.57-grain plant−1 and 297.19 kg ha−1, respectively (Figure 3D).
Both the biochar briquettes and the urea fertiliser exhibited a linear pattern for TF growth (Table 5). A treatment of 6-grain plant−1 of the biochar briquette and 300 kg ha−1 of the urea fertiliser resulted in TF growth of 1.18 × 10⁴ colony g soil dry weight−1 (Table 6). The optimum application of the biochar briquettes at 4.69-grain plant−1 and the urea fertiliser at 274.02 kg ha−1 resulted in an increase in TF of 1.23 × 10⁴ colony g soil dry weight−1 (Figure 3E). The treatments with the biochar briquettes showed a significant increase in TB growth, as compared to the urea fertiliser treatment, and both exhibited (Table 5) a linear pattern. The biochar briquettes and the urea fertiliser at 6-grain plant−1 and 300 kg ha−1, respectively, produced the highest TB growth of 2.24 × 10³ colony g soil dry weight−1 (Table 6). In addition, the optimum application of the biochar briquettes and the urea fertiliser at 5.55-grain plant−1 and 229.00 kg ha−1, respectively, enhanced the TB growth by 2.22 × 10³ colony g soil dry weight−1(Figure 3F).
The biochar briquettes and the urea fertiliser showed a noteworthy increase in NRA (Table 5). However, the biochar briquettes exhibited a linear pattern, whereas the urea fertiliser showed a quadratic pattern. The application of a 4-grain plant−1 of the biochar briquettes and 300 kg ha−1 of the urea fertiliser produced the highest NRA at 3.86 mol NO2 g−1 h−1 (Table 6). The maximum NRA value of 3.70 NO2 g−1 h−1 was recorded with the optimum application of the biochar briquettes at 4.76-grain plant−1 and the urea fertiliser at 271.33 kg ha−1 (Figure 4A). The biochar briquettes and the urea fertiliser also resulted in increased TC levels (Table 5). The biochar briquettes showed a linear pattern while the urea fertiliser showed a quadratic pattern. The applications of the biochar briquettes and the urea fertiliser at 4-grain plant−1 and 300 kg ha−1, respectively, produced the highest TC at 0.72 g g leaf−1 (Table 6). The optimum application of the biochar briquettes and the urea fertiliser were at 4.74-grain plant−1 and 272.38 kg ha−1, respectively, yielding the maximal TC value of 0.72 g leaf−1 (Figure 4B).
The treatments of biochar briquettes and urea fertiliser showed a coequally significant differential in the LPR analysis (Table 5). The regression patterns had a linear pattern for the biochar-briquette treatment, whereas a quadratic pattern was found for the urea fertiliser treatment. A biochar-briquette application of 4-grain plant−1 and urea fertiliser of 300 kg ha−1 produced the highest LPR at 437.12 CO2 m−2 s−1 (Table 6). The optimum application of biochar briquettes of 4.75-grain plant−1 and urea fertiliser of 271.92 kg ha−1 accelerated to the maximum LPR value of 427.47 CO2 m−2 s−1 (Figure 4C). Equivalently, the applications of biochar briquettes and urea fertiliser displayed a noteworthy difference (Table 5) in linear patterns for the NL value. The value of NL was highest at 33.60 kg ha−1 with a 0-grain plant−1 of the biochar briquettes and 300 kg ha−1 of the urea fertiliser (Table 6). The maximum NL value of 30.03 kg ha−1 was recorded by applying the optimum application of the biochar briquettes at 1.96-grain plant−1 and the urea fertiliser at 290.72 kg ha−1 (Figure 4D).
A similar result of a significant differential was noted in NUE under the treatment of biochar briquettes and urea fertiliser (Table 5). However, the biochar briquettes showed a linear pattern while the urea fertiliser exhibited a quadratic pattern. The biochar briquettes at 6-grain plant−1 and the urea fertiliser at 200 kg ha−1 resulted in the highest NUE value of 9.41 kg grain kg Nfertiliser−1. The optimum application of the biochar briquettes at 4.71-grain plant−1 and the urea fertiliser at 273.16 kg ha−1 resulted in a maximal NUE value of 5.90 kg grain kg Nfertiliser−1 (Figure 4E). The applications of biochar briquettes and urea fertiliser illustrated (Table 5) a linear pattern and a quadratic pattern, respectively, with an ameliorated YHR. The treatments using a 4-grain plant−1 of the biochar briquettes and 300 kg ha−1 urea fertiliser produced the highest YHR at 5.70 tonnes ha−1 (Table 6). The maximum YHR of 5.49 tonnes ha−1 was achieved by applying the optimum application of the biochar briquettes at 4.74-grain plant−1 and the urea fertiliser at 272.35 kg ha−1 (Figure 4F).

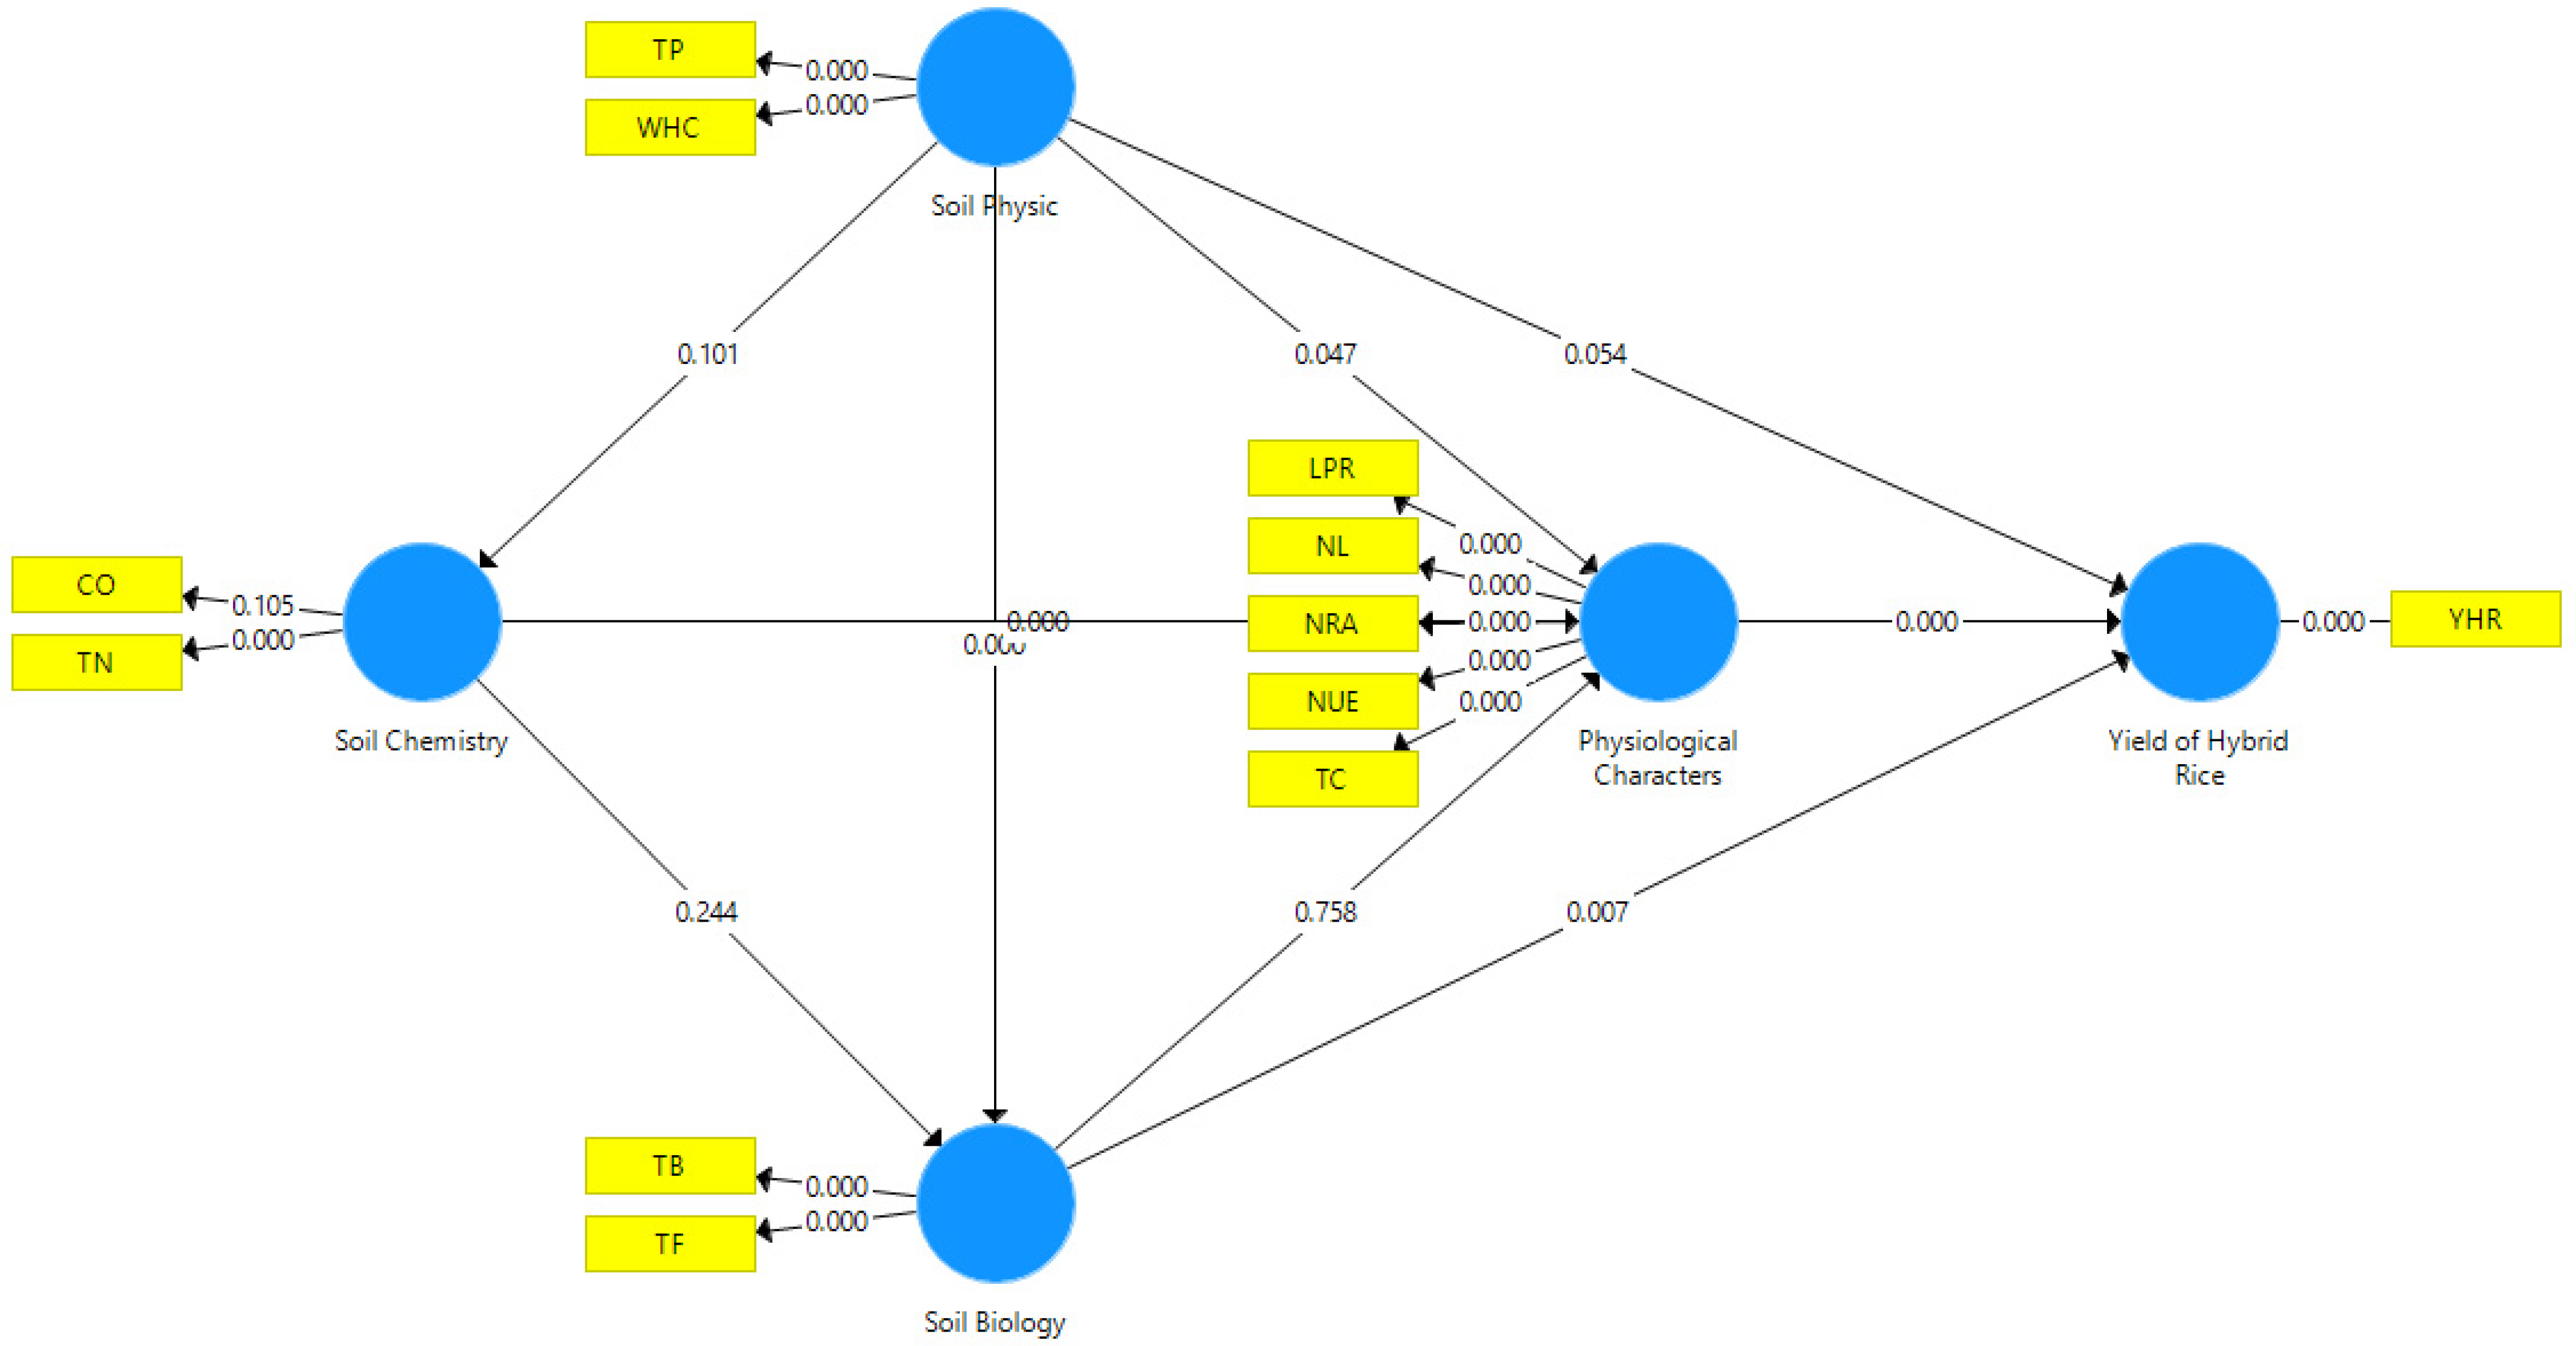
3.4. Relationship between Soil Properties, Physiological Characteristics, and Hybrid Rice Yield

The interactions between the response variables, namely, the soil physics, chemistry, biology, and physiological characteristics as well as the rice yield, were determined using SEM and stepwise regression. The SEM analysis concluded that, in general, the response variables that affected the YHR were soil properties (physics and chemistry) and physiological traits of soil (Figure 5). The parameters that affected the hybrid rice yield were determined in detail using the stepwise regression method. The stepwise regression results showed that the parameters that significantly affected the YHR were TN, TF, NRA, LPR, NL, and NUE. The regression equation was Y = −0.65 ns + 3.62 TN ** − 114,500 TF * − 0.33 NRA * + 0.01 LPR ** − 0.03 NL ** + 0.51 NUE ** (R2 = 0.998 **).

3.5. Determining the Optimum Scenarios

Determination of the optimum application under both biochar briquettes and urea fertiliser treatments for hybrid rice variables was conducted by establishing three scenarios, namely, economic, environmental, and eco–environmental (Table 7). The economic scenario included the optimum levels of the biochar briquettes at 4.73-grain plant−1 and the urea fertiliser at 272.40-grain plant−1 with a hybrid rice yield of 7.22 tonnes ha−1 (Table 7). The hybrid rice yield reduced the eco–environmental and environmental scenarios to 10.12% and 34.98%, respectively, as compared to the economic scenario.
Conversely, the environmental scenario consisted of optimal levels of biochar briquettes and urea fertiliser at 2.89-grain plant−1 and 163.98 kg ha−1, respectively, resulting in a minimum NL value of 17.90 kg ha−1 (Table 7). In both the economic and eco–environmental scenarios, the increased NL levels were recorded at 34.10% and 10.33%, respectively, as compared to the environmental scenario.
The eco–environmental scenario included an optimal level of the biochar briquettes at 5.54-grain plant−1 and the urea fertiliser at 230.08 kg ha−1 with a NUE accumulation of 9.71 kg grain kg Nfertiliser−1 (Table 7). The reduced NUE levels in the economic and environmental scenarios were measured at 0.51% and 17.06%, respectively, as compared to the eco–environmental scenario.
The most favourable eco–environmental scenario produced the highest hybrid rice yield while still sustaining the environment. The eco–environmental scenario was proficient in reducing the usage of urea fertiliser by 23.31% while increasing WHC, TP, SOC, TN, TF, TB, NRA, TC, LPR, NL, NUE, and YHR by 19.24%, 4.93%, 88.66%, 23.74%, 1015.26%, 144.41%, 12.19%, 0.73%, 6.27%, −41.21%, 34.86%, and 40.41%, respectively, as compared to a single urea application of 300 kg ha−1 without the biochar briquettes.

4. Discussion

Biochar briquettes have been used to slow the release of nutrients while reducing their loss, especially for nitrogen and its derivates [36,37]. Zhao et al. [58] reported that the leaching process resulted in NH4+–N and NO3–N losses recorded at 28.10% and 187.00%, respectively. It has been shown to significantly reduce N loss through ammonia volatilisation [36]. When urea fertiliser was applied topically, it caused a total loss of 35% of nitrogen, whereas when co-treated with briquettes, only 4% of total N was lost in the process [59].
Our research conducted between 2019 and 2021 analysed a significant increase in all response variables, except for the NL variable, which declined considerably. The increases were due to the accumulation of biochar-briquette residue in the soil. This was evidenced by the increasing values for most variables, namely, WHC, TP, SOC, TN, TF, and TB during each year of our research (2019–2021) at rates of 5.36%, 21.37%, and 47.37%, respectively. As mentioned in Table 1, biochar made from kayu putih waste had a high C, H, O, N, and S content to improve this research’s soil properties. Biochar affects the nutrient absorption by plants by changing the dynamics of the nutrient release from the soil system to the plants [60,61,62].
In previous studies, the incorporation of biochar briquettes into soil not only improved the physical properties and qualities of the soil, but it also enhanced the clay’s texture by increasing the water retention and the porosity, aggregating stability, and reducing the bulk density [32,63,64]. In addition, biochar also ameliorates the chemical and biological properties of the soil. Increased biochar application has been positively correlated to an increase in C, N, and microbial content in soil [65,66,67,68]. Urea fertilisation only showed a significant increase in TN while WHC, TP, SOC, TF, and TB did not exhibit a considerable differential in our research. Diniz et al. [69] showed that N fertilisation at 20, 40, and 80 kg ha−1 could not increase soil microbes in Oxisol soils.
NRA is a molybdoenzyme that converts nitrate to nitrite [15]. The increase in NRA in hybrid rice was positively correlated with the increased application of biochar briquettes and urea fertilisation into the soil. However, while biochar slows the release of N in the soil, this has been shown to have implications for the availability of N in the soil, which results in an increase in the NRA content [70]. Research conducted by Loussaert et al. [71] showed that an increase in NH4+–N and NO3–N sourced from N fertilisers was correlated with an increase in the NRA contents of the plants.
Chlorophyll is an essential pigment and one of the main factors contributing to the photosynthesis process. The primary function of chlorophyll is to absorb sunlight at various wavelengths [72]. The addition of biochar briquettes and urea fertilisation into the soil increased the TC in the hybrid rice. In previous research, biochar played a significant role in increasing the chlorophyll content of groundnuts during phase 3 tetrafoliolate (V3), beginning bloom (R1), and beginning pod (R3) [73]. Biochar conspicuously affected the chlorophyll content, thereby increasing not only the PS II activity but also facilitating the electron transport as well as ameliorating the photosynthesis rate in [74]. Comparatively, urea fertilisation also contributed to elevating the TC level in the hybrid rice in our study. A study conducted by Lai et al. [75] reported that the application of biochar at 9.00 tonnes ha−1 and N fertilisation at 120 kg ha−1 notably raised the chlorophyll content in rice.
Photosynthesis is an important component of and one of the major determinants in increasing crop production [76]. The increase in the LPR of the hybrid rice was in line with the increase in the application of the biochar briquettes and the urea fertiliser. Biochar stimulates the root growth, which improves the water supply to the plants and consequently boosts the photosynthesis rate [77]. Zhang et al. [78] reported that an increase in N application was in line with an increased CO2 concentration between cells, stomatal conductance, transpiration, and photosynthesis in soybean crops. Another study conducted by Nurmalasari et al. [79] showed that the application of kayu putih biochar and urea fertilisation by 13.29 tonnes ha−1 and 245.35 kg ha−1, respectively, increased the LPR by 18.09%.
Nitrogen loss is a major concern that influences its availability in the plants. Biochar briquettes have been shown to play a role in decreasing NL in hybrid rice by reducing NO3−N and NH4+−N leaching in the soil and enabling the adsorption of these ions onto the biochar surface [80]. In addition, 15.00% of the total organic matter applied reduced the N loss by 27.00% in [81]. Other studies have revealed that adding 2% and 4% biochar to the clay texture reduced the loss of N by 29.19% and NO3–N by 28.65%. However, the application of N fertiliser significantly increases the NL in vegetable commodities [57]. Alam et al. [13] reported that using a mixture of biochar and compost made from kayu putih waste proved to be an effective alternative to reduce the nitrogen loss while increasing the soybean yield in crops planted between kayu putih stands.
NUE is a measure of the economic and the environmental efficiency for agro-ecosystem sustainability [82]. Sarfraz et al. [83] showed that a 50% increase in efficiency when using N fertiliser as well as an increase in NUE of 65% could be achieved by adding 1% w w−1 biochar to the soil. The addition of urea fertiliser affects the dynamics of the NUE value. The application of low N fertilisers by farmers has generally resulted in low NUE levels [84].
The YHR increased with expanded applications of both biochar briquettes and urea fertilisation in our study. This was in line with the research conducted by Nurmalasari et al. [79], who showed that kayu putih waste biochar could improve maize yield by 61.78% while the efficient use of nitrogen from urea rose by 18.22%. In addition, the biochar briquettes made from kayu putih waste at 3.70-grains−1 or 9.25 tonnes ha−1 combined with the ammonium–sulphate fertiliser at 76.31 kg ha−1 increased soybean yield by 13.02%, while reducing losses by 38.25% compared to the application of a single N fertiliser application at 100 kg ha−1 [37]. Another study concerning rice showed that the application of N fertiliser at 240 kg ha−1 that was applied at 30% in the seedling phase, 20% at 10 days after planting (DAP), and 50% at 36 DAP resulted in an improvement in rice harvest of 10.20 tonnes ha−1, or an increase of 46.87% compared to without N fertiliser [85].
The eco–environmental scenario is the most suitable strategy because it can sustain a balance between the production and the land. This is in line with research conducted by Koocheki et al. [53], who obtained an optimum application of water irrigation, nitrogen fertiliser, and plant density in canola. In addition, Alam et al. [13] also used an eco–environmental scenario to determine the optimum application of biochar, compost, and ammonium sulphate in soybeans in an agroforestry system with kayu putih.

5. Conclusions

The experimental results demonstrated significant improvements in all response variables during the time period of 2019–2021, except for the NL variable, which declined considerably. The average increase in the values for WHC, TP, SOC, TN, TF, TB, NRA, TC, LPR, NL, NUE, and YHR from 2019 to 2021 were 19.60%, 6.37%, 9.11%, 3.22%, 896.59%, 52.65%, 8.46%, 20.69%, 12.02%, 26.02%, 56.11%, and 32.12%, respectively. The parameters that affected the hybrid rice yield were TN, TF, NRA, LPR, NL, and NUE. The eco–environmental scenario was proven to be the most efficient strategy for improving the soil quality, physiological characteristics, and YHR with the optimum application of biochar briquettes at 5.54-grain plant−1 and the urea fertiliser at 230.08 kg ha−1. This alternative approach not only reduced the usage of urea fertiliser by 23.31% but also increased the WHC, TP, SOC, TN, TF, TB, NRA, TC, LPR, NL, NUE, and YHR by 17.34%, 7.06%, 8.10%, 2.42%, 838.02%, 46.48%, 6.12%, 16.58%, 9.05%, −26.28%, 47.07%, and 24.73%, respectively, as compared to a single application of 300 kg urea ha−1 without biochar briquettes.

Author Contributions

Conceptualization, P.S. and T.A.; methodology, E.T.S.P., S.H., M.H.W. and T.A.; software, M.H.W. and T.A.; validation, P.S., E.T.S.P., D.K., S.H. and T.A.; formal analysis, T.A.; investigation, P.S., D.K., S.H. and T.A.; resources, P.S. and T.A.; data curation, S.H., D.K. and T.A.; writing—original draft preparation, P.S. and T.A.; writing—review and editing, P.S., E.F., H.H.N., E.T.S.P., D.K., S.H., R.B., M.H.W. and T.A.; visualization, T.A.; supervision, P.S., D.K., S.H. and T.A.; project administration, T.A.; funding acquisition, P.S., E.F., H.H.N., R.B. and T.A. All authors have read and agreed to the published version of the manuscript.

Funding

This research received no external funding.

Institutional Review Board Statement

Not applicable for studies not involving humans or animals.

Informed Consent Statement

Informed consent was obtained from all subjects involved in the study.

Data Availability Statement

The data presented in this study are available on request from the corresponding author.

Acknowledgments

The authors thank the field technicians of Teguh for their technical assistance and the laboratory technicians at the Soil Laboratory, Microbiology Laboratory, and Crop Production and Management Laboratory, Faculty of Agriculture of the Universitas Gadjah Mada, Indonesia.

Conflicts of Interest

The authors declare no conflict of interest.

References

  1. FAO. World Food and Agriculture Statistical Pocketbook 2019; The Food and Agriculture Organization (FAO): Rome, Italy, 2013; Available online: http://www.fao.org/3/ca6463en/ca6463en.pdf (accessed on 15 September 2021).
  2. Statistics Indonesia. The Harvested Area and Rice Production in Indonesia. 2019. Available online: http://www.bps.go.id/pressrelease/2020/02/04/1752/luas-panen-dan-produksi-padi-pada-tahun-2019-mengalami-penurunan-dibandingkan-tahun-2018-masing-masing-sebesar-6-15-dan-7-76-persen.html (accessed on 15 September 2021).
  3. Mulyani, A.; Nursyamsi, D.; Syakir, M. Strategi pemanfaatan sumberdaya lahan untuk pencapaian swasembada beras berkelanjutan. J. Sumberd. Lahan 2017, 11, 11–22. [Google Scholar] [CrossRef]
  4. Alam, T.; Kurniasih, B.; Suryanto, P.; Basunanda, P.; Supriyanta; Ambarwati, E.; Widyawan, M.H.; Handayani, S.; Taryono. Stability analysis for soybean in agroforestry system with kayu putih. SABRAO J. Breed Genet. 2019, 51, 405–418. [Google Scholar]
  5. Suryanto, P.; Putra, E.T.S.; Alam, T. Minimum soil quality determinant for rice and ‘kayu putih’ yield under hilly areas. J. Agron. 2017, 16, 115–123. [Google Scholar] [CrossRef]
  6. Suryanto, P.; Kurniasih, B.; Faridah, E.; Nurjanto, H.H.; Rogomulyo, R.; Handayani, S.; Kastono, D.; Muttaqin, A.S.; Alam, T. Influence of furrow with organic material and Chromolaena odorata compost on upland rice productivity in an agroforestry system with Melaleuca cajuputi. Biodiversitas 2020, 21, 780–791. [Google Scholar]
  7. Suryanto, P.; Taryono, T.; Supriyanta, S.; Kastono, D.; Putra, E.T.S.; Widyawan, M.H.; Alam, T. Assessment of soil quality parameters and yield of rice cultivars in Melaleuca cajuputi agroforestry system. Biodiversitas 2020, 21, 3463–3470. [Google Scholar] [CrossRef]
  8. Huang, M.; Jiang, L.; Xia, B.; Zou, Y.; Jiang, P.; Ao, H. Yield gap analysis of super hybrid rice between two subtropical environments. Aust. J. Crop. Sci. 2013, 7, 600–608. [Google Scholar]
  9. Xu, L.; Yuan, S.; Wang, X.; Yu, X.; Peng, S. High yields of hybrid rice do not require more nitrogen fertilizer than inbred rice: A meta–analysis. Food Energy Secur. 2021, 10, 341–350. [Google Scholar] [CrossRef]
  10. Dawson, I.K.; Place, F.; Torquebiau, E.; Malézieux, E.; Iiyama, E.; Sileshi, G.W.; Kehlenbeck, K.; Masters, E.; McMullin, S.; Jamnadass, R. Agroforestry, Food and Nutritional Security; The Food and Agriculture Organization (FAO): Rome, Italy, 2013; Available online: http://www.fao.org/forestry/37082–04957fe26afbc90d1e9c0356c48185295.pdf (accessed on 15 September 2021).
  11. Suryanto, P.; Sadono, R.; Yohanifa, A.; Widyawan, M.H.; Alam, T. Semi–natural regeneration and conservation in agroforestry system models on small–scale farmers. Biodiversitas 2021, 22, 858–865. [Google Scholar] [CrossRef]
  12. Kartikawati, N.K.; Rimbawanto, A.; Susanto, M.; Baskorowati, L.; Prastyono. Budidaya dan Prospek Pengembangan Kayu Putih (Melaleuca cajuputi); IPB Press: Bogor, Indonesia, 2014; pp. 1–3. [Google Scholar]
  13. Alam, T.; Suryanto, P.; Handayani, S.; Kastono, D.; Kurniasih, B. Optimizing application of biochar, compost and nitrogen fertilizer in soybean intercropping with kayu putih (Melaleuca cajuputi). Rev. Bras. Cienc. Solo 2020, 44, e0200003. [Google Scholar] [CrossRef]
  14. Faridah, E.; Suryanto, P.; Nurjanto, H.H.; Putra, E.T.S.; Falah, M.D.; Widyawan, M.H.; Alam, T. Optimizing application of biochar amendment for nitrogen use efficiency in upland rice under Melaleuca cajuputi stands. Indian J. Agric. Res. 2021, 55, 105–109. [Google Scholar] [CrossRef]
  15. Marschner, H. Marschner’s Mineral Nutrition of Higher Plants, 3rd ed.; Academic Press: Cambridge, MA, USA, 2011; pp. 135–150. [Google Scholar]
  16. Liu, T.; Huang, J.; Chai, K.; Cao, C.; Li, C. Effects of N fertilizer sources and tillage practices on NH3 volatilization, grain yield, and N use efficiency of rice fields in Central China. Front. Plant Sci. 2018, 9, 385. [Google Scholar] [CrossRef]
  17. Wang, Q.; Zhu, Y.; Zou, X.; Li, F.; Zhang, J.; Kang, Z.; Li, X.; Yin, C.; Lin, Y. Nitrogen deficiency-induced decrease in cytokinins content promotes rice seminal root growth by promoting root meristem cell proliferation and cell elongation. Cells 2020, 9, 916. [Google Scholar] [CrossRef] [PubMed] [Green Version]
  18. Darras, K.F.A.; Corre, M.D.; Formaglio, G.; Tjoa, A.; Potapov, A.; Brambach, F.; Sibhatu, K.T.; Grass, I.; Rubiano, A.A.; Buchori, D. Reducing fertilizer and avoiding herbicides in oil palm plantations–Ecological and economic valuations. Front. Glob. Chang. 2019, 2, 65. [Google Scholar] [CrossRef] [Green Version]
  19. Pardon, L.; Bessou, C.; Nelson, P.N.; Dubos, B.; Ollivier, J.; Marichal, R.; Caliman, J.P.; Gabrielle, B.B. Key unknowns in nitrogen budget for oil palm plantations: A review. Agron. Sustain. Dev. 2016, 36, 20. [Google Scholar] [CrossRef] [Green Version]
  20. Yadegari, M.; Shamshiri, R.R.; Shariff, A.R.M.; Balasundram, S.K.; Mahns, B. Using SPOT–7 for Nitrogen fertilizer management in oil palm. Agriculture 2020, 10, 133. [Google Scholar] [CrossRef] [Green Version]
  21. Liu, G.; Yang, Z.; Du, J.; He, A.; Yang, H.; Xue, G.; Yu, C.; Zhang, Y. Adding NBPT to urea increases N use efficiency of maize and decreases the abundance of N–cycling soil microbes under reduced fertilizer–N rate on the North China Plain. PLoS ONE 2020, 15, e0240925. [Google Scholar] [CrossRef]
  22. Lu, J.; Wang, D.; Liu, K.; Chu, G.; Huang, L.; Tian, X.; Zhang, Y. Inbred varieties outperformed hybrid rice varieties under dense planting with reducing nitrogen. Sci. Rep. 2020, 10, 8769. [Google Scholar] [CrossRef]
  23. Guo, L.; Bornø, M.L.; Niu, W.; Liu, F. Biochar amendment improves shoot biomass of tomato seedlings and sustains water relations and leaf gas exchange rates under different irrigation and nitrogen regimes. Agric. Wat. Manag. 2021, 245, 106580. [Google Scholar] [CrossRef]
  24. Ghorbani, M.; Amirahmadi, E.; Zamanian, K. In–situ biochar production in paddies: Direct involvement of farmers in greenhouse gases reduction policies besides increasing nutrients availability and rice production. Land Degrad. Dev. 2021, 32, 3893–3904. [Google Scholar] [CrossRef]
  25. Kang, S.W.; Yun, J.J.; Park, J.H.; Cho, J.S. Exploring suitable biochar application rates with compost to improve upland field environment. Agronomy 2021, 11, 1136. [Google Scholar] [CrossRef]
  26. Lehmann, J.; Joseph, S. Biochar for Environmental Management: Science, 1st ed.; Earthscan: London, UK, 2009; pp. 2–5. [Google Scholar]
  27. Medeiros, D.C.C.S.; Nzediegwu, C.; Benally, C.; Messele, S.A.; Kwak, J.-H.; Naeth, M.A.; Ok, Y.S.; Chang, S.X.; El-Din, M.G. Pristine and engineered biochar for the removal of contaminants co-existing in several types of industrial wastewaters: A critical review. Sci. Tot. Environ. 2022, 809, 151120. [Google Scholar] [CrossRef] [PubMed]
  28. Abdel–Fattah, T.M.; Mahmoud, M.E.; Ahmed, S.B.; Huff, M.D.; Lee, J.W.; Kumar, S. Biochar from woody biomass for removing metal contaminants and carbon sequestration. J. Ind. Eng. Chem. 2015, 22, 103–109. [Google Scholar] [CrossRef]
  29. Coumaravel, K.; Santhi, R.; Maragatham, S. Effect of biochar on yield and nutrient uptake by hybrid maize and on soil fertility. Indian J. Agric. Res. 2015, 49, 185–188. [Google Scholar] [CrossRef]
  30. Selvarajh, G.; Ch’ng, H.Y.; Md Zain, N.; Sannasi, P.; Azmin, S.N.H.M. Improving soil nitrogen availability and rice growth performance on a tropical acid soil via mixture of rice husk and rice straw biochars. Appl. Sci. 2021, 11, 108. [Google Scholar] [CrossRef]
  31. Alkharabsheh, H.M.; Seleiman, M.F.; Battaglia, M.L.; Shami, A.; Jalal, R.S.; Alhammad, B.A.; Almutairi, K.F.; Al–Saif, A.M. Biochar and its broad impacts in soil quality and fertility, nutrient leaching and crop productivity: A Review. Agronomy 2021, 11, 993. [Google Scholar] [CrossRef]
  32. Blanco-Canqui, H. Biochar and soil physical properties. Soil Sci. Soc. Am. J. 2017, 81, 687. [Google Scholar] [CrossRef] [Green Version]
  33. Zhang, Q.-Z.; Dijkstra, F.A.; Liu, X.-R.; Wang, Y.-D.; Huang, J.; Lu, N. Effects of biochar on soil microbial biomass after four years of consecutive application in the North China Plain. PLoS ONE 2014, 9, e102062. [Google Scholar] [CrossRef] [Green Version]
  34. Cahayaningrum, F. The Effect of Biochar and Urea for Growth and Yield of Maize (Zea mays L.) under Kayu Putih Stands in Dry Season. Bachelor’s Thesis, Faculty of Agriculture, Universitas Gadjah Mada, Yogyakarta, Indonesia, 2021. [Google Scholar]
  35. Sianturi, S.R.N. The Effect of Biochar Types and Urea for Growth and Yield of Maize (Zea mays L.) under Kayu Putih Stands in Wet Season. Bachelor’s Thesis, Faculty of Agriculture, Universitas Gadjah Mada, Yogyakarta, Indonesia, 2021. [Google Scholar]
  36. Torane, H.B.; Kasture, M.C.; Kokare, V.G.; Sanap, P.B. Effect of bio–degradable coated fertilizer briquettes and their application time on growth, yield, and nutrient content on soil properties of cucumber in lateritic soil of Konkan Maharashtra. Int. J. Chem. Stud. 2017, 5, 27–32. [Google Scholar]
  37. Alam, T.; Suryanto, P.; Kastono, D.; Putra, E.T.S.; Handayani, S.; Widyawan, M.H.; Muttaqin, A.S.; Kurniasih, B. Evaluation of interactions between biochar briquette with ammonium sulfate fertilizer for controlled nitrogen loss in soybean intercopping with Melaleuca cajuputi. Legume Res. 2021, 4, 339–343. [Google Scholar]
  38. Boettinger, J.; Chiaretti, J.; Ditzler, C.; Galbraith, J.; Kerschen, K.; Loerch, C.; McDanie, P.; McVey, S.; Monger, C.; Owens, P. Illustrated Guide to Soil Taxonomy, Version 2; United States Department of Agriculture, Natural Resources Conservation Service: Washington, DC, USA, 2015; pp. 1–12. [Google Scholar]
  39. Djaenudin, D.; Marwan, H.; Subagjo, H.; Hidayat, A. Technical Instructions Land Evaluation for Agricultural Commodities; Indonesian Agency for Agricultural Research and Development, Ministry of Agriculture: Bogor, Indonesia, 2011; p. 38. [Google Scholar]
  40. Emrich, W. Handbook of Biochar Making–The Traditional and Industrial Methods; Springer: Dordrecht, The Netherlands, 1985; pp. 19–106. [Google Scholar]
  41. Klute, A. Water capacity. In Methods of Soil Analysis: Part 1 Physical and Mineralogical Properties, Including Statistics of Measurement and Sampling, 9.1; Black, C.A., Ed.; American Society of Agronomy, Inc.: Madison, WI, USA, 1965; pp. 273–278. [Google Scholar]
  42. Vomocil, J.A. Porosity. In Methods of Soil Analysis: Part 1 Physical and Mineralogical Properties, Including Statistics of Measurement and Sampling, 9.1; Black, C.A., Ed.; American Society of Agronomy, Inc.: Madison, WI, USA, 1965; pp. 299–314. [Google Scholar]
  43. Nelson, D.W.; Sommers, L.E. Total carbon, organic carbon, and organic matter. In Methods of Soil Analysis: Part 2 Chemical and Microbiological Properties, 9.2.2, 2nd ed.; Page, A.L., Ed.; American Society of Agronomy, Inc., Soil Science Society of America, Inc.: Madison, WI, USA, 1982; pp. 539–579. [Google Scholar]
  44. Stenholm, A.; Holmstrom, S.; Ragnarsson, A. Total nitrogen in waste water analysis: Comparison of devarda’s alloy method and high temperature oxidation followed by chemiluminescence detection. J. Anal. Chem. 2009, 64, 1047–1053. [Google Scholar] [CrossRef]
  45. David, A.B.; Davidson, C.E. Estimation method for serial dilution experiments. J. Microbiol. Methods 2014, 107, 214–221. [Google Scholar] [CrossRef] [PubMed] [Green Version]
  46. Krywult, M.; Bielec, D. Method of measurement of nitrate reductase activity in field conditions. J. Eco. Eng. 2013, 14, 7–11. [Google Scholar]
  47. Gross, J. Pigmentin Vegetable, Chlorophyll and Caretinoids; Springer: Washington, DC, USA, 2012; pp. 8–16. [Google Scholar]
  48. Li–Cor Bioscience Inc. Using the Li–6400: Portable Photosynthesis System.; Li–Cor Inc.: Lincoln, OR, USA, 2001; pp. 1–60. [Google Scholar]
  49. Fageria, N.K. Nitrogen Management in Crop Production; CRC Press: Boca Raton, FL, USA, 2014; pp. 217–233. [Google Scholar]
  50. Rathke, G.W.; Behrens, T.; Diepenbrock, W. Integrated nitrogen management strategies to improve seed yield, oil content and nitrogen efficiency of winter oilseed rape (Brassica napus L.): A review. Agric. Ecosyst. Environ. 2006, 117, 80–108. [Google Scholar] [CrossRef]
  51. IRRI. Steps to Successful Rice Production; International Rice Research Institute: Los Baños, Philippines, 2015; pp. 20–25. [Google Scholar]
  52. Welham, S.J.; Gezan, S.A.; Clark, S.J.; Mead, A. Statistical Methods in Biology: Design and Analysis of Experiments and Regression; CRC Press: Boca Raton, FL, USA, 2015; pp. 24–27. [Google Scholar]
  53. Koocheki, A.; Mahallati, M.N.; Moradi, R.; Mansoori, H. Optimizing water, nitrogen and crop density in canola cultivation using response surface methodology and central composite design. Soil Sci. Plant Nutr. 2014, 60, 286–298. [Google Scholar] [CrossRef]
  54. Myers, R.H.; Montgomery, D.C.; Cook, C.M.A. Response Surface Methodology: Process and Product Optimization using Designed Experiments; John Wiley and Sons: Hoboken, NJ, USA, 2009; pp. 13–61. [Google Scholar]
  55. Marquardt, D.W.; Snee, R.D. Ridge regression in practice. Am. Stat. 1975, 29, 3–20. [Google Scholar]
  56. SAS Institute Inc. Step-by-Step Programming with Base SAS® 9.4, 2nd ed.; SAS Institute Inc.: Cary, NC, USA, 2013. [Google Scholar]
  57. Smith, J.L.; Halvorson, J.J.; Papendick, R.I. Using multiplevariable indicator kriging for evaluating soil quality. Soil Sci. Soc. Am. J. 1993, 57, 743–749. [Google Scholar] [CrossRef]
  58. Zhao, H.; Li, X.; Jiang, Y. Response of nitrogen losses to excessive nitrogen fertilizer application in intensive greenhouse vegetable production. Sustainability 2019, 11, 115. [Google Scholar] [CrossRef] [Green Version]
  59. IFDC. Fertilizer Deep Placement–IFDC; International Fertilizer Development Center (IFDC): Alabama, USA, 2013; Available online: https://ifdc.org/2013/09/23/fertilizer-deep-placement/ (accessed on 15 September 2021).
  60. Alling, V.; Hale, S.E.; Martinsen, V.; Mulder, J.; Smebye, A.; Breedveld, G.D.; Cornelissen, G. The role of biochar in retaining nutrients in amended tropical soils. J. Plant Nutr. Soil. Sci. 2014, 177, 671–680. [Google Scholar] [CrossRef]
  61. Angst, T.E.; Sohi, S.P. Establishing release dynamics for plant nutrients from biochar. GCB Bioenergy 2013, 5, 221–226. [Google Scholar] [CrossRef]
  62. Oladele, S.; Adeyemo, A.; Awodun, M. Influence of rice husk biochar and inorganic fertilizer on soil nutrients availability and rain–fed rice yield in two contrasting soils. Geoderma 2019, 336, 1–11. [Google Scholar] [CrossRef]
  63. Ding, Y.; Liu, Y.; Liu, S.; Huang, X.; Li, Z.; Tan, X.; Zeng, G.; Zhou, L. Potential benefits of biochar in agricultural soils: A Review. Pedosphere 2017, 27, 645–661. [Google Scholar] [CrossRef]
  64. Omondi, M.O.; Xia, X.; Nahayo, A.; Liu, X.; Korai, P.K.; Pan, G. Quantification of biochar effects on soil hydrological properties using meta–analysis of literature data. Geoderma 2016, 274, 28–34. [Google Scholar] [CrossRef]
  65. Cao, T.; Meng, J.; Liang, H.; Yang, X.; Chen, W. Can biochar provide ammonium and nitrate to poor soils? Soil column incubation. J. Soil Sci. Plant Nutr. 2017, 17, 253–265. [Google Scholar] [CrossRef] [Green Version]
  66. Luo, Y.; Durenkamp, M.; Nobili, M.; Lin, Q.; Devonshire, B.J.; Brookes, P.C. Microbial biomass growth, following incorporation of biochars produced at 350 °C or 700 °C, in a silty–clay loam soil of high and low pH. Soil Biol. Biochem. 2013, 57, 513–523. [Google Scholar] [CrossRef]
  67. Khadem, A.; Raiesi, F. Responses of microbial performance and community to corn biochar in calcareous sandy and clayey soils. Appl. Soil Ecol. 2017, 114, 16–27. [Google Scholar] [CrossRef]
  68. Singh, G.; Mavi, M.S. Impact of addition of different rates of rice–residue biochar on C and N dynamics in texturally diverse soils. Arch. Agron. Soil Sci. 2018, 64, 1419–1431. [Google Scholar] [CrossRef]
  69. Diniz, L.T.; Ramos, M.L.G.; Junior, W.Q.R.; Cruz, A.F.; de Franca, L.V.; Diniz, B.T.; Amabile, R.F. Effect of nitrogen fertilization on soil microbial biomass in an Oxisol cultivated with irrigated barley in the Brazilian Cerrado. Acta Agron. 2016, 65, 137–143. [Google Scholar] [CrossRef]
  70. Haider, G.; Steffens, D.; Müller, C.; Kammann, C.I. Standard extraction methods may underestimate nitrate stocks captured by field aged biochar. J. Environ. Qual. 2016, 45, 1196–1204. [Google Scholar] [CrossRef]
  71. Loussaert, D.; Clapp, J.; Mongar, N.; O’Neill, D.P.; Shen, B. Nitrate assimilation limits nitrogen use efficiency (NUE) in maize (Zea mays L.). Agronomy 2018, 8, 110. [Google Scholar] [CrossRef] [Green Version]
  72. Croft, H.; Chen, J.M.; Luo, X.; Bartlett, P.; Chen, B.; Staebler, R.M. Leaf chlorophyll content as a proxy for leaf photosynthetic capacity. Glob. Chang. Biol. 2017, 23, 3513–3524. [Google Scholar] [CrossRef]
  73. Ngulube, M.; Mweetwa, A.M.; Phiri, E.; Njoroge, S.C.M.; Chalwe, H.; Shitumbanuma, V.; Brandenburg, R.L. Effects of biochar and gypsum soil amendments on groundnut (Arachis hypogaea L.) dry matter yield and selected soil properties under water stress. Afr. J. Agric. Res. 2018, 13, 1080–1090. [Google Scholar]
  74. Lyu, S.; Du, G.; Liu, L.; Zhao, L.; Lyu, D. Effects of biochar on photosystem function and activities of protective enzymes in Pyrus ussuriensis Maxim. under drought stress. Acta Physiol Plant 2016, 38, 220. [Google Scholar] [CrossRef]
  75. Lai, L.; Ismail, M.R.; Muharam, F.M.; Yusof, M.M.; Ismail, R.; Jaafar, N.M. Effects of rice straw biochar and nitrogen fertilizer on rice growth and yield. Asian J. Crop Sci. 2017, 9, 159–166. [Google Scholar] [CrossRef] [Green Version]
  76. Xie, X.; Li, B.; Shen, S. Impact of high temperature stress on photosynthetic characteristic and yield of rice (Oryza sativa) at heading. Indian J. Agric. Sci. 2012, 82, 516–522. [Google Scholar]
  77. Bruun, E.W.; Petersen, C.T.; Hansen, E.; Holm, J.K.; Hauggaard–Nielsen, H. Biochar amendment to coarse sandy subsoil improves root growth and increases water retention. Soil Use Manag. 2014, 30, 109–118. [Google Scholar] [CrossRef]
  78. Zhang, X.; Huang, G.; Bian, X.; Zhao, Q. Effects of root interaction and nitrogen fertilization on the chlorophyll content root activity, photosynthetic characteristics of intercropped soybean and microbial quantity in the rhizosphere. Plant Soil Environ. 2013, 59, 80–88. [Google Scholar] [CrossRef]
  79. Nurmalasari, A.I.; Suryanto, P.; Alam, T. Effectiveness of Melaleuca cajuputi biochar as a leaching loss for nitrogen fertilizer and intercropping in maize. Indian J. Agric. Res. 2020, 54, 506–510. [Google Scholar]
  80. Rubin, R.L.; Anderson, T.R.; Ballantine, K.A. Biochar simultaneously reduces nutrient leaching and greenhouse gas emissions in restored wetland soils. Wetlands 2020, 40, 1981–1991. [Google Scholar] [CrossRef]
  81. Wang, X.Q.; Zhao, Y.; Wang, H.; Zhao, X.Y.; Cui, H.Y.; Wei, Z.M. Reducing nitrogen loss and phytotoxicity during beer vinasse composting with biochar addition. Was. Manag. 2017, 61, 150–156. [Google Scholar] [CrossRef]
  82. Montemurro, F.; Diacono, M. Towards a better understanding of agronomic efficiency of nitrogen: Assessment and improvement strategies. Agronomy 2016, 6, 31. [Google Scholar] [CrossRef]
  83. Sarfraz, R.; Shakoor, A.; Abdullah, M.; Arooj, A.; Hussain, A.; Xing, S. Impact of integrated application of biochar and nitrogen fertilizers on maize growth and nitrogen recovery in alkaline calcareous soil. Soil Sci. Plant Nutr. 2017, 63, 488–498. [Google Scholar] [CrossRef]
  84. Abebe, Z.; Feyisa, H. Effects of nitrogen rates and time of application on yield of maize: Rainfall variability influenced time of N application. Int. J. Agron. 2017, 2017, 1545280. [Google Scholar] [CrossRef] [Green Version]
  85. Pan, S.; Huang, S.; Zhai, J.; Wang, J.; Cao, C.; Cai, M.; Zhan, M.; Tang, X. Effects of N management on yield and n uptake of rice in Central China. J. Integr. Agric. 2012, 11, 1993–2000. [Google Scholar] [CrossRef]
Figure 1. Geographical locations of the experimental site (latitude 7°52′59.5992″ S to 7°59′41.1288″ S and longitude 110°26′21.462″ E to 110° 35′7.4868″ E).
Agronomy 12 00564 g001
Figure 2. (A) Biochar briquettes sourced from kayu putih waste. (B) Hybrid rice between kayu putih stands.
Agronomy 12 00564 g002
Figure 3. The response of soil properties to in situ biochar briquettes (grain plant−1) and urea fertiliser (kg ha−1). (A) Water-holding capacity (%), (B) Total porosity (%), (C) Soil organic carbon in the soil after harvesting (%), (D) Total nitrogen in the soil after harvesting, (E) Total fungi in the soil after harvesting (colony g soil dry weight−1), and (F) Total bacteria in the soil after harvesting (colony g soil dry weight−1).
Agronomy 12 00564 g003
Figure 4. The response of physiological characteristics and yield of hybrid rice to in situ biochar briquettes (grain plant−1) and urea fertiliser (kg ha−1). (A) Nitrate reductase activity (μmol NO2 g−1 h−1), (B) Total chlorophyll (g g leaf−1), (C) Leaf photosynthesis rate (CO2 m−2 s−1), (D) Nitrogen loss (kg ha−1), (E) Nitrogen-use efficiency (kg grain kg Nfertiliser−1), and (F) Yield of hybrid rice (tonnes ha−1).
Agronomy 12 00564 g004
Figure 5. Relationship between soil properties (physic, chemistry, biology), physiological traits, and yield of hybrid rice.
Agronomy 12 00564 g005
Table 1. The nutrient content and molar ratio of biochar briquettes.
Chemistry Characteristics 1Molar Ratio 1
pHCHONSH/CO/C(O + N)/C(O + N + S)/C
(1:10 H2O)(%)
8.0573.92.3222.60.800.370.370.230.240.24
1 pH: Potential of hydrogen; C: Carbon; H: Hydrogen; O: Oxygen; N: Nitrogen; and S: Sulphur.
Table 2. Means square of ANOVA in soil properties.
Factors 2Soil Properties 1
WHCTPSOCTNTFTB
B321.58 **963.55 **6.98 **0.01 **5.87 × 10⁸ **8.06 × 10⁶ **
U0.001 ns42.08 ns0.03 ns0.67 **4.06 × 10⁴ ns2.99 × 104 ns
Y555.55 **87.03 **0.19 **0.0008 **1.23 × 10⁹ **4.21 × 10⁶ **
B × U0.01 ns54.09 ns0.03 ns0.0008 **2.76 × 10⁴ ns8.99 × 102 ns
B × Y62.25 ns97.37 ns0.08 ns0.000002 ns1.45 × 108 ns7.24 × 105 ns
U × Y0.0001 ns45.80 ns0.0004 ns0.001 ns2.04 × 105 ns6.71 × 102 ns
B × U × Y0.0001 ns46.15 ns0.0004 ns0.000003 ns1.68 × 104 ns1.86 × 102 ns
1 ns indicates not significant at p < 0.05. ** significant at p < 0.01. WHC: Water-holding capacity (%); TP: Total porosity (%); SOC: Soil organic carbon in the soil after harvesting (%); TN: Total nitrogen in the soil after harvesting; TF: Total fungi in the soil after harvesting (colony g soil dry weight−1); and TB: Total bacteria in the soil after harvesting (colony g soil dry weight−1). 2 B: Biochar briquettes; U: Urea fertiliser; and Y: Year’s period.
Table 3. Means square of the ANOVA for physiological characteristics and yield of hybrid rice.
FactorsPhysiological Characteristics and Yield of Hybrid Rice 1
NRATCLPRNLNUEYHR
B0.93 **0.014 **5742.37 **243.77 **7.73 **5.24 **
U4.33 **0.14 **37,816.55 **2087.78 **46.56 **37.47 **
Y0.55 **0.12 **14,914.79 **344.58 **27.31 **9.66 **
B × U0.11 **0.0007 **194.36 **45.89 **0.24 **0.35 **
B × Y0.02 ns0.0003 ns67.41 ns4.93 ns0.17 ns0.12 ns
U × Y0.02 ns0.002 ns95.43 ns72.04 ns0.34 ns1.02 ns
B × U × Y0.01 ns0.0002 ns57.94 ns1.22 ns0.21 ns0.02 ns
1 ns not significant at (p < 0.05). ** significant at (p < 0.01). NRA: Nitrate reductase activity (μmol NO2 g−1 h−1); TC: Total chlorophyll (g g leaf−1); LPR: Leaf photosynthesis rate (CO2 m−2 s−1); NL: Nitrogen loss (kg ha−1); NUE: Nitrogen-use efficiency (kg grain kg Nfertiliser−1); and YHR: Yield of hybrid rice (tonnes ha−1). 2 B: Biochar briquettes; U: Urea fertiliser; and Y: Year’s period.
Table 4. Least square means (LS-Means) of hybrid rice.
Response Variables 2Years 1
201920202021
WHC40.60 c46.72 b48.56 a
TP39.87 c43.41 b42.96 a
SOC1.59 c1.71 b1.74 a
TN0.28 c0.29 b0.29 c
TF1.27 × 103 c1.12 × 104 b1.27 × 104 a
TB1.31 × 103 b1.85 × 103 a2.00 × 103 a
NRA3.09 c3.21 b3.35 a
TC0.58 c0.65 b0.70 a
LPR359.33 c381.22 b402.51 a
NL21.63 a15.89 b16.00 b
NUE3.23 c4.45 b5.04 a
YHR3.42 c4.01 b4.52 a
1 Numbers followed by the same letter and rows showed no significant difference in the Tukey–Kramer Test (p < 0.05). 2 WHC: Water-holding capacity (%); TP: Total porosity (%); SOC: Soil organic carbon in the soil after harvesting (%); TN: Total nitrogen in the soil after harvesting; TF: Total fungi in the soil after harvesting (colony g soil dry weight−1); TB: Total bacteria in the soil after harvesting (colony g soil dry weight−1); NRA: Nitrate reductase activity (μmol NO2 g−1 h−1); TC: Total chlorophyll (g g leaf−1); LPR: Leaf photosynthesis rate (CO2 m−2 s−1); NL: Nitrogen loss (kg ha−1); NUE: Nitrogen-use efficiency (kg grain kg Nfertiliser−1); and YHR: Yield of hybrid rice (tonnes ha−1).
Table 5. Regression coefficients and fitted model.
Variables 2Response of Independent Variables 1R2RMSELack of Fit
β0β1x1β2x2β11x12β12x1x2β22x22
WHC40.11 **3.60 **0.0003 ns–0.41 ns–0.00003 ns–0.0000004 ns0.9350.9040.136
TP33.29 **4.31 **–0.02 ns–0.28 ns–0.002 ns–0.00007 ns0.8302.7760.467
SOC1.08 **0.25 **–0.0007 ns–0.008 ns–0.00005 ns–0.000002 ns0.9820.0710.101
TN0.07 **0.007 **0.001 **–0.00002 ns0.00002 **–0.0000004 ns0.9920.0150.572
TF1337.38 **4646.69 *0.84 ns–496.90 ns0.01 ns–0.002 ns0.97279.6140.885
TB928.73 **444.59 **0.01 ns–39.53 **0.03 ns–0.00006 ns0.98666.2110.890
NRA2.36 **0.12 *0.006 **–0.004 ns–0.0001 **–0.000007 *0.9040.1460.301
TC0.50 **0.01 *0.001 **–0.00004 ns–0.00002 **–0.000001 **0.9430.0190.990
LPR311.17 **7.09 *0.49 **–0.22 ns0.001 **–0.0006 **0.92711.4790.945
NL11.62 **–1.82 **0.06 **0.10 ns–0.001 **0.00005 ns0.9591.9690.547
NUE4.68 **0.22 *0.02 **0.009 ns0.0004 **–0.00003 **0.8990.5030.801
YHR2.01 **0.12 *0.01 **0.002 ns0.0003 **0.00002 **0.9690.2310.990
1 X1: Biochar briquettes (grain plant−1) and X2: Urea fertiliser (kg ha−1). * and ns significant and not significant, respectively, at (p < 0.05). ** significant at (p < 0.01). x1 and x2 indicate biochar briquettes (grain plant−1) and urea fertiliser (kg ha−1), respectively. 2 WHC: Water-holding capacity (%); TP: Total porosity (%); SOC: Soil organic carbon in the soil after harvesting (%); TN: Total nitrogen in the soil after harvesting; TF: Total fungi in the soil after harvesting (colony g soil dry weight−1); TB: Total bacteria in the soil after harvesting (colony g soil dry weight−1); NRA: Nitrate reductase activity (μmol NO2 g−1 h−1); TC: Total chlorophyll (g g leaf−1); LPR: Leaf photosynthesis rate (CO2 m−2 s−1); NL: Nitrogen loss (kg ha−1); NUE: Nitrogen-use efficiency (kg grain kg Nfertiliser−1); and YHR: Yield of hybrid rice (tonnes ha−1).
Table 6. Least square means (LS-Means) of independent variables under experimental factors.
RunsDependent Variables 1Estimates Response of Independent Variables 2
X1X2WHCTPSOCTNTFTBNRATCLPRNLNUEYHR
10039.8136.541.080.081.07 × 1039.13 × 1022.210.51312.959.295.272.26
22046.6141.651.590.089.45 × 1031.73 × 1032.530.53326.268.025.202.29
34047.1844.851.910.101.11 × 1041.99 × 1032.840.56337.325.795.782.53
46047.5348.052.230.101.12 × 1042.20 × 1033.020.58342.275.625.952.65
5010039.8324.691.050.191.07 × 1038.96 × 1023.130.60348.5921.625.322.82
6210046.6041.651.490.209.74 × 1031.74 × 1033.160.61364.7018.376.293.29
7410047.2043.781.910.221.11 × 1042.01 × 1033.170.63375.7910.467.003.66
8610047.5649.122.330.251.12 × 1042.22× 1033.250.67395.779.478.614.42
9020039.8635.880.900.321.08 × 1039.03 × 1023.230.66388.5824.657.294.14
10220046.6040.581.490.369.73 × 1031.75 × 1033.280.68399.3919.788.074.57
11420047.1944.851.800.381.11 × 1042.03 × 1033.480.70406.9217.878.524.86
12620047.5548.052.330.401.17 × 1042.23 × 1033.620.71419.3316.569.415.31
13030039.8235.881.000.451.07 × 1039.07 × 1023.370.70400.8233.607.204.62
14230046.6840.581.590.479.68 × 1041.75 × 1033.550.71407.7330.397.704.89
15430047.1644.851.910.481.11 × 1042.04 × 1033.860.72437.1228.818.955.70
16630047.5246.982.230.501.18 × 1042.24 × 1033.790.72432.7825.139.035.69
1 X1: Biochar briquettes (grain plant−1) and X2: Urea fertiliser (kg ha−1). 2 WHC: Water-holding capacity (%); TP: Total porosity (%); SOC: Soil organic carbon in the soil after harvesting (%); TN: Total nitrogen in the soil after harvesting; TF: Total fungi in the soil after harvesting (colony g soil dry weight−1); TB: Total bacteria in the soil after harvesting (colony g soil dry weight−1); NRA: Nitrate reductase activity (μmol NO2 g−1 h−1); TC: Total chlorophyll (g g leaf−1); LPR: Leaf photosynthesis rate (CO2 m−2 s−1); NL: Nitrogen loss (kg ha−1); NUE: Nitrogen-use efficiency (kg grain kg Nfertiliser−1); and YHR: Yield of hybrid rice (tonnes ha−1).
Table 7. Optimized value of in situ biochar briquettes and nitrogen fertiliser for response variables.
Variables and Treatments 1Scenarios
EconomicEnvironmentalEco–Environmental
Response VariablesWHC47.9847.1147.48
TP34.2037.3037.65
SOC1.681.541.89
TN0.370.250.34
TF1.23 × 1041.07 × 1041.19 × 104
TB2.19 × 1031.90 × 1032.22 × 103
NRA3.823.423.78
TC0.720.660.71
LPR430.05394.51425.96
NL24.0117.9119.75
NUE9.668.059.71
YHR7.294.696.49
Independent Variables 2X14.732.895.54
X2272.40163.98230.08
1 WHC: Water-holding capacity (%); TP: Total porosity (%); SOC: Soil organic carbon in the soil after harvesting (%); TN: Total nitrogen in the soil after harvesting; TF: Total fungi in the soil after harvesting (colony g soil dry weight−1); TB: Total bacteria in the soil after harvesting (colony g soil dry weight−1); NRA: Nitrate reductase activity (μmol NO2 g−1 h−1); TC: Total chlorophyll (g g leaf−1); LPR: Leaf photosynthesis rate (CO2 m−2 s−1); NL: Nitrogen loss (kg ha−1); NUE: Nitrogen-use efficiency (kg grain kg Nfertiliser−1); and YHR: Yield of hybrid rice (tonnes ha−1). 2 X1: Biochar briquettes (grain plant−1) and X2: Urea fertiliser (kg ha−1).
Publisher’s Note: MDPI stays neutral with regard to jurisdictional claims in published maps and institutional affiliations.

