Article

Genome-Wide Association Analyses Reveal Candidate Genes Controlling Harvest Index and Related Agronomic Traits in Brassica napus L.

State Key Laboratory of Crop Stress Biology for Arid Areas and College of Agronomy, Northwest A&F University, Yangling, Xianyang 712100, China
*
Author to whom correspondence should be addressed.
Submission received: 21 February 2022 / Revised: 13 March 2022 / Accepted: 23 March 2022 / Published: 27 March 2022
(This article belongs to the Topic Plant Breeding, Genetics and Genomics)

Abstract

:
Harvest index (HI) is a complex and vital agronomic trait that is closely related to the economic benefits of rapeseed. In this study, we measured the HI and 13 HI-related agronomic traits of 104 core breeding lines of rapeseed during 3 years and sequenced the populations using the Bnapus50K array. The phenotypic analyses showed the complex connections among HI and other traits. A total of 212 significant SNPs related to the traits and 22 stable SNPs were identified. Four SNPs, A01_1783685 (PH and SYP), C06_26638717 (PH and NSS), C03_4731660 (MIL and MINS), and C09_36899682 (PH and BYP), were identified as potential pleiotropic loci. Compared to previous reports, 49 consensus loci were obtained that were related to PH, TSW, NSP, BAI, NSS, SL, BN, MINS, SYP, and BYP. Twelve stable SNPs were detected as promising novel loci related to BN (A05_19368584 and A05_19764389), SL (A06_23598999, A06_23608274, and C07_38735522), PH (C04_47349279, C04_47585236, and C09_36899680), MINS (C05_6251826), NSS (C06_22559430 and C06_22570315), and HI (C05_6554451). In addition, 39 putative genes were identified in the candidate intervals. This study provides novel insights into the genetic mechanisms of HI and HI-related traits, and lays a foundation for molecular marker development and casual gene cloning to improve the harvest index of rapeseed.

1. Introduction

Harvest index (HI), i.e., co-efficient of economics, is the ratio of economic yield to the total biomass production above the ground. For grain-producing crops, the “sink” capacity of the grains is the basis for the transfer and storage of assimilation products. The efficiency of the transformation and distribution of the assimilation product “source” to the seed represents the unobstructed “flow” [1,2]. Harvest index is always used for evaluating the “flow” in the “source-sink-translocation” theory.
Rapeseed (Brassica napus L., AACC, 2n = 38) is one of the most important oilseed crops worldwide. With the improvement of varieties and cultivation techniques, the crop harvest index continues to increase. Despite this, the HI of rapeseed is generally between 10% and 30%, which is much lower than that of tobacco (over 60%), rice (50–60%), peanut (50–60%), maize (40–50%), and wheat (40–50%) [3,4,5]. The increase in the output of rice, wheat, and barley mainly benefits from the increased harvest index after the Green Revolution [6], so the yield of rapeseed can be enhanced by increasing the HI as well. Although the complexity of HI can be affected by plant structures, various environmental factors, and nutrient distribution [3,7], we can increase HI by adjusting related factors.
In recent years, an increasing number of reports of B. napus have been published on the major agronomic traits, such as plant height (PH), siliqua length (SL), thousand-seed weight (STW), branch angle (BA), and so on [8,9,10]. Nevertheless, the studies about the harvest index or the relationship with the agronomic traits were denumerable. Nine SNPs were identified to be significantly associated with HI, explaining 3.42% of the phenotypic variance [11]. Lu et al. identified 294 single nucleotide polymorphisms (SNPs) significantly associated with HI and four HI-related traits by GWAS using 520 B. napus accessions, and 33 functional candidate genes were predicted in the intervals [12]. A segregation DH population containing 348 lines from the cross between “KenC-8” and “N53-2” was used to detect quantitative trait loci (QTL) for HI, seed yield, biomass yield, and PH, and 160 QTL, 163 epistatic loci pairs for the studied traits [2]. Luo et al. used a segregating population of B. napus, identified 1904 consensus QTL accounting for 22 traits, and formed a network containing developmental traits, seed quality traits, seed yield, and seed-yield components [13]. These results not only show us the feasibility of GWAS to locate quantitative trait loci (QTL) for complex agronomic traits, but improve our knowledge of interactions among complex traits and their related traits.
In this study, we focused on 104 core breeding inbred lines of B. napus, sequenced by the Bnapus50K array, and cultivated them across three cropping seasons. HI and 13 HI-related traits were measured for GWAS to associate significant SNPs. A trait-SNP network was constructed, and promising candidate genes were forecast. Our study will provide an important basement for the genetic mechanism improving the harvest index of rapeseed.

2. Materials and Methods

2.1. Material Planting and Field Management

The 104 rapeseed germplasms are the core breeding inbred lines from the rapeseed germplasm resource lab of Northwest A&F University, and each line has at least one excellent agronomic trait. All of these materials were planted and measured in the Caoxinzuang experimental base (34°30′ N, 108°09′ E) of Northwest A&F University in Yangling during the 2017–2018 cropping season, 2018–2019 cropping season, and 2020–2021 cropping season. A completely randomized design was adopted with row width of 2 m, row spacing of 35 cm, and plant spacing of 10 cm, respectively. Each material was planted in two rows. Fresh and tender leaves were sampled at the budding stage and kept at −80 °C until further use.

2.2. Phenotype Collection

Five representative plants were selected randomly from each inbred line and labeled in order separately. The plant traits of each individual were investigated. We directly measured the plant height (PH, cm), main inflorescence length (MIL, cm), the numbers of primary valid branch (BN), silique length (SL, cm), silique width (SW, cm), number of effective siliques on main inflorescence (MINS), and number of seeds per silique (NSS). The branch angles (BA) were photographed and the values were acquired by AutoCAD software, including top branch angle (TBA, °), middle branch angle (MBA, °), and basal branch angle (BBA, °). The individual above-ground portions were harvested, placed into net bags, and dried under the sunlight. The shoot dry weight (biomass yield per plant, BYP, g) and the weight of the seeds (seed yield per plant, SYP, g) were weighed. Thousand-seed weight (TSW, g) was measured by a Wansheng Automatic seed test analyzer. Then, the branch angle index (BAI) was calculated by TBA, MBA, and BBA as follows:
BAI = ( x i B A i min ) / ( B A i max B A i min ) / 3
where x is the measured value, and i represents the TBA, MBA, and BBA, respectively. Silique density of the main inflorescence (MISD) was calculated by MIL/MINS, the number of siliques per plant (NSP) was calculated by SYP/(NSS × TSW), and harvest index (HI, %) was calculated by SYP/BYP.

2.3. DNA Isolation, Sequencing, and Quality Controlling

The genomic DNA was isolated from the leaves using the Tiangen DNAsecure Plant kit (Cat. #DP320-03) following the manufacturer’s protocol. The quality of DNA was checked on 1% agarose gel and the DNA concentrations were diluted to the range of 50–100 ng/uL. DNA sequencing was performed according to the Infinium assay standard protocol (Infinium HD Assay Ultra Protocol Guide, http://www.illumina.com/, accessed on 7 April 2020) using the Bnapus50K array [14] at the Greenfafa Institute (Wuhan, China). The SNPs were eliminated according to the rules with an absence rate of more than 65% and the smallest allele frequency less than 1%. The missing genotypes were imputed in Beagle v.21Apr21.304 with default parameter settings [15].

2.4. Population Structure Analysis

Approximately 26 K SNPs from these 104 B. napus lines were used for phylogenetic tree construction. The phylogenetic tree was constructed with Tassel 5.0 using a neighbor-joining algorithm [16] and displayed by the iTOL web tool (https://itol.embl.de/, accessed on 28 August 2021). Linkage disequilibrium between any two SNPs on one chromosome was estimated with r2 using PLINK [17]. The parameters with a sliding window of 50 kb (in steps of 10 SNPs) were used, and SNPs related to other SNPs in the window with r2 > 0.2 were removed. The population structure was determined by ADMIXTURE v.1.3.0 [18] and STRUCTURE 2.3.4 [19]. For ADMIXTURE five runs were performed with default parameters for each number of populations (K) set from 1 to 10, and the most likely K value was determined by the log probability of the data. For STRUCTURE, five independent runs were performed under the admixture model with K-value from 1 to 10, burn-in period of 10,000 iterations, and 100,000 Markov chain Monte Carlo. The principal component score of the samples was also computed by the principal component analysis (PCA).

2.5. Genome-Wide Associated Loci

All the analyses were performed using TASSEL5 [16] and the mrMLM v4.0.2 [20]. A mix linear model (MLM) was used by TASSEL5 with the covariate matrix from PCA and the kinship matrix. The p-value = 10 × 10−4 was used to establish a significance threshold for the result of TASSEL. For the mrMLM, five algorithms were applied to associate significant SNPs, including FASTmrMLM, ISIS EM-BLASSO, mrMLM, FASTmrEMMA, and pLARmEB [20]. The analysis process was referred to the protocol provided by the mrMLM and the PCA matrix was used as the covariance for GWAS by the default parameters. The previously obtained genotypic data of these 104 plants, along with their BLUP values, were used for genome-wide association. The significant SNPs detected by any two of the algorithms or environments above were regarded as reliable and stable loci for the trait.

2.6. Network Construction

The traits, environments, and associated SNPs were retained to build the phenotype-SNP network. The same traits among different environments were linked by Pearson’s correlation coefficients, and the different traits were connected by partial correlation coefficients. The width of edges connecting the SNPs to the traits represented the SNP phenotypic variation. We also linked the physical proximity SNPs. Network construction and visualization were performed using Cytoscape v.3.5.1 [21].

2.7. Candidate Gene Identification

Linkage disequilibrium (LD) analysis and visualization were performed by the software LDBlockShow with the default parameters [22]. All genes within the same LD block (r2 > 0.6) of the significant SNPs were assessed as potential candidates. In addition, candidate genes outside the LD blocks but within 100 KB flanking were also predicted as possible candidate genes [23,24,25]. Gene functional annotations were obtained by protein BLAST in the Kyoto Encyclopedia of Genes and Genomes (KEGG, https://www.genome.jp/kegg/, accessed on 4 December 2021), TAIR (https://www.arabidopsis.org/, accessed on 4 December 2021), and Brassicaceae Database (BRAD, http://39.100.233.196/, accessed on 4 December 2021). Then, gene expressions during five developmental stages, including bolting, initial flowering, full-bloom, podding, and maturation, were extracted from the BrassicaEDB v.1.0 (https://brassica.biodb.org/, accessed on 7 December 2021) [26].

2.8. Data Analyses and Visualization

The phenotypic data were analyzed by Excel, and visualized by ggpubr in R, TBtools [27] and the online webtool “Hiplot” (https://hiplot.com.cn, accessed on 9 January 2022). The partial correlation coefficient is a coefficient that describes the relationship between X and Y when removing the effects of the other control variables under multi-factor conditions [28]. The correlation and partial correlation analyses were performed in the R environment (R v.4.0.2, http://www.r-project.org/, accessed on 9 January 2022) by the R packages PerformanceAnalytics v.2.0.4 (https://github.com/braverock/PerformanceAnalytics, accessed on 2 September 2021) and pltPcorrelation v.0.1.0 (https://gitee.com/wqssf102/pltpcorrelation, accessed on 2 September 2021), respectively. The heritability (h2) was computed as follows [29]:
h 2 = σ G 2 / ( σ G E 2 / n + σ G 2 + σ e 2 / n r )
where σ G 2 is the genotypic variance, σ G E 2 is the genotype × environment variance, σ e 2 is the error variance, n is the number of locations, and r is the number of replications. The estimates of σ G E 2 , σ G 2 , and σ e 2 were analyzed by the analysis of variance using the lmer function of the R/lme4. The best linear unbiased prediction (BLUP) was obtained by fitting the mixed linear model in the R/lem4 for the inbred lines using Y~1 + (1|line) + (1|year), where Y is the trait data, the parenthesis represents the random effects, “1|” represents groups, “line” represents all experimental lines used, and “year” represents the 3 years.
The locations of SNP/QTL on chromosomes were displayed via MapChart, and the Manhattan plots and quantile-quantile (QQ) plots were drawn by CMplot in R. The significance between the two groups of data was determined by the Wilcoxon test.

3. Results

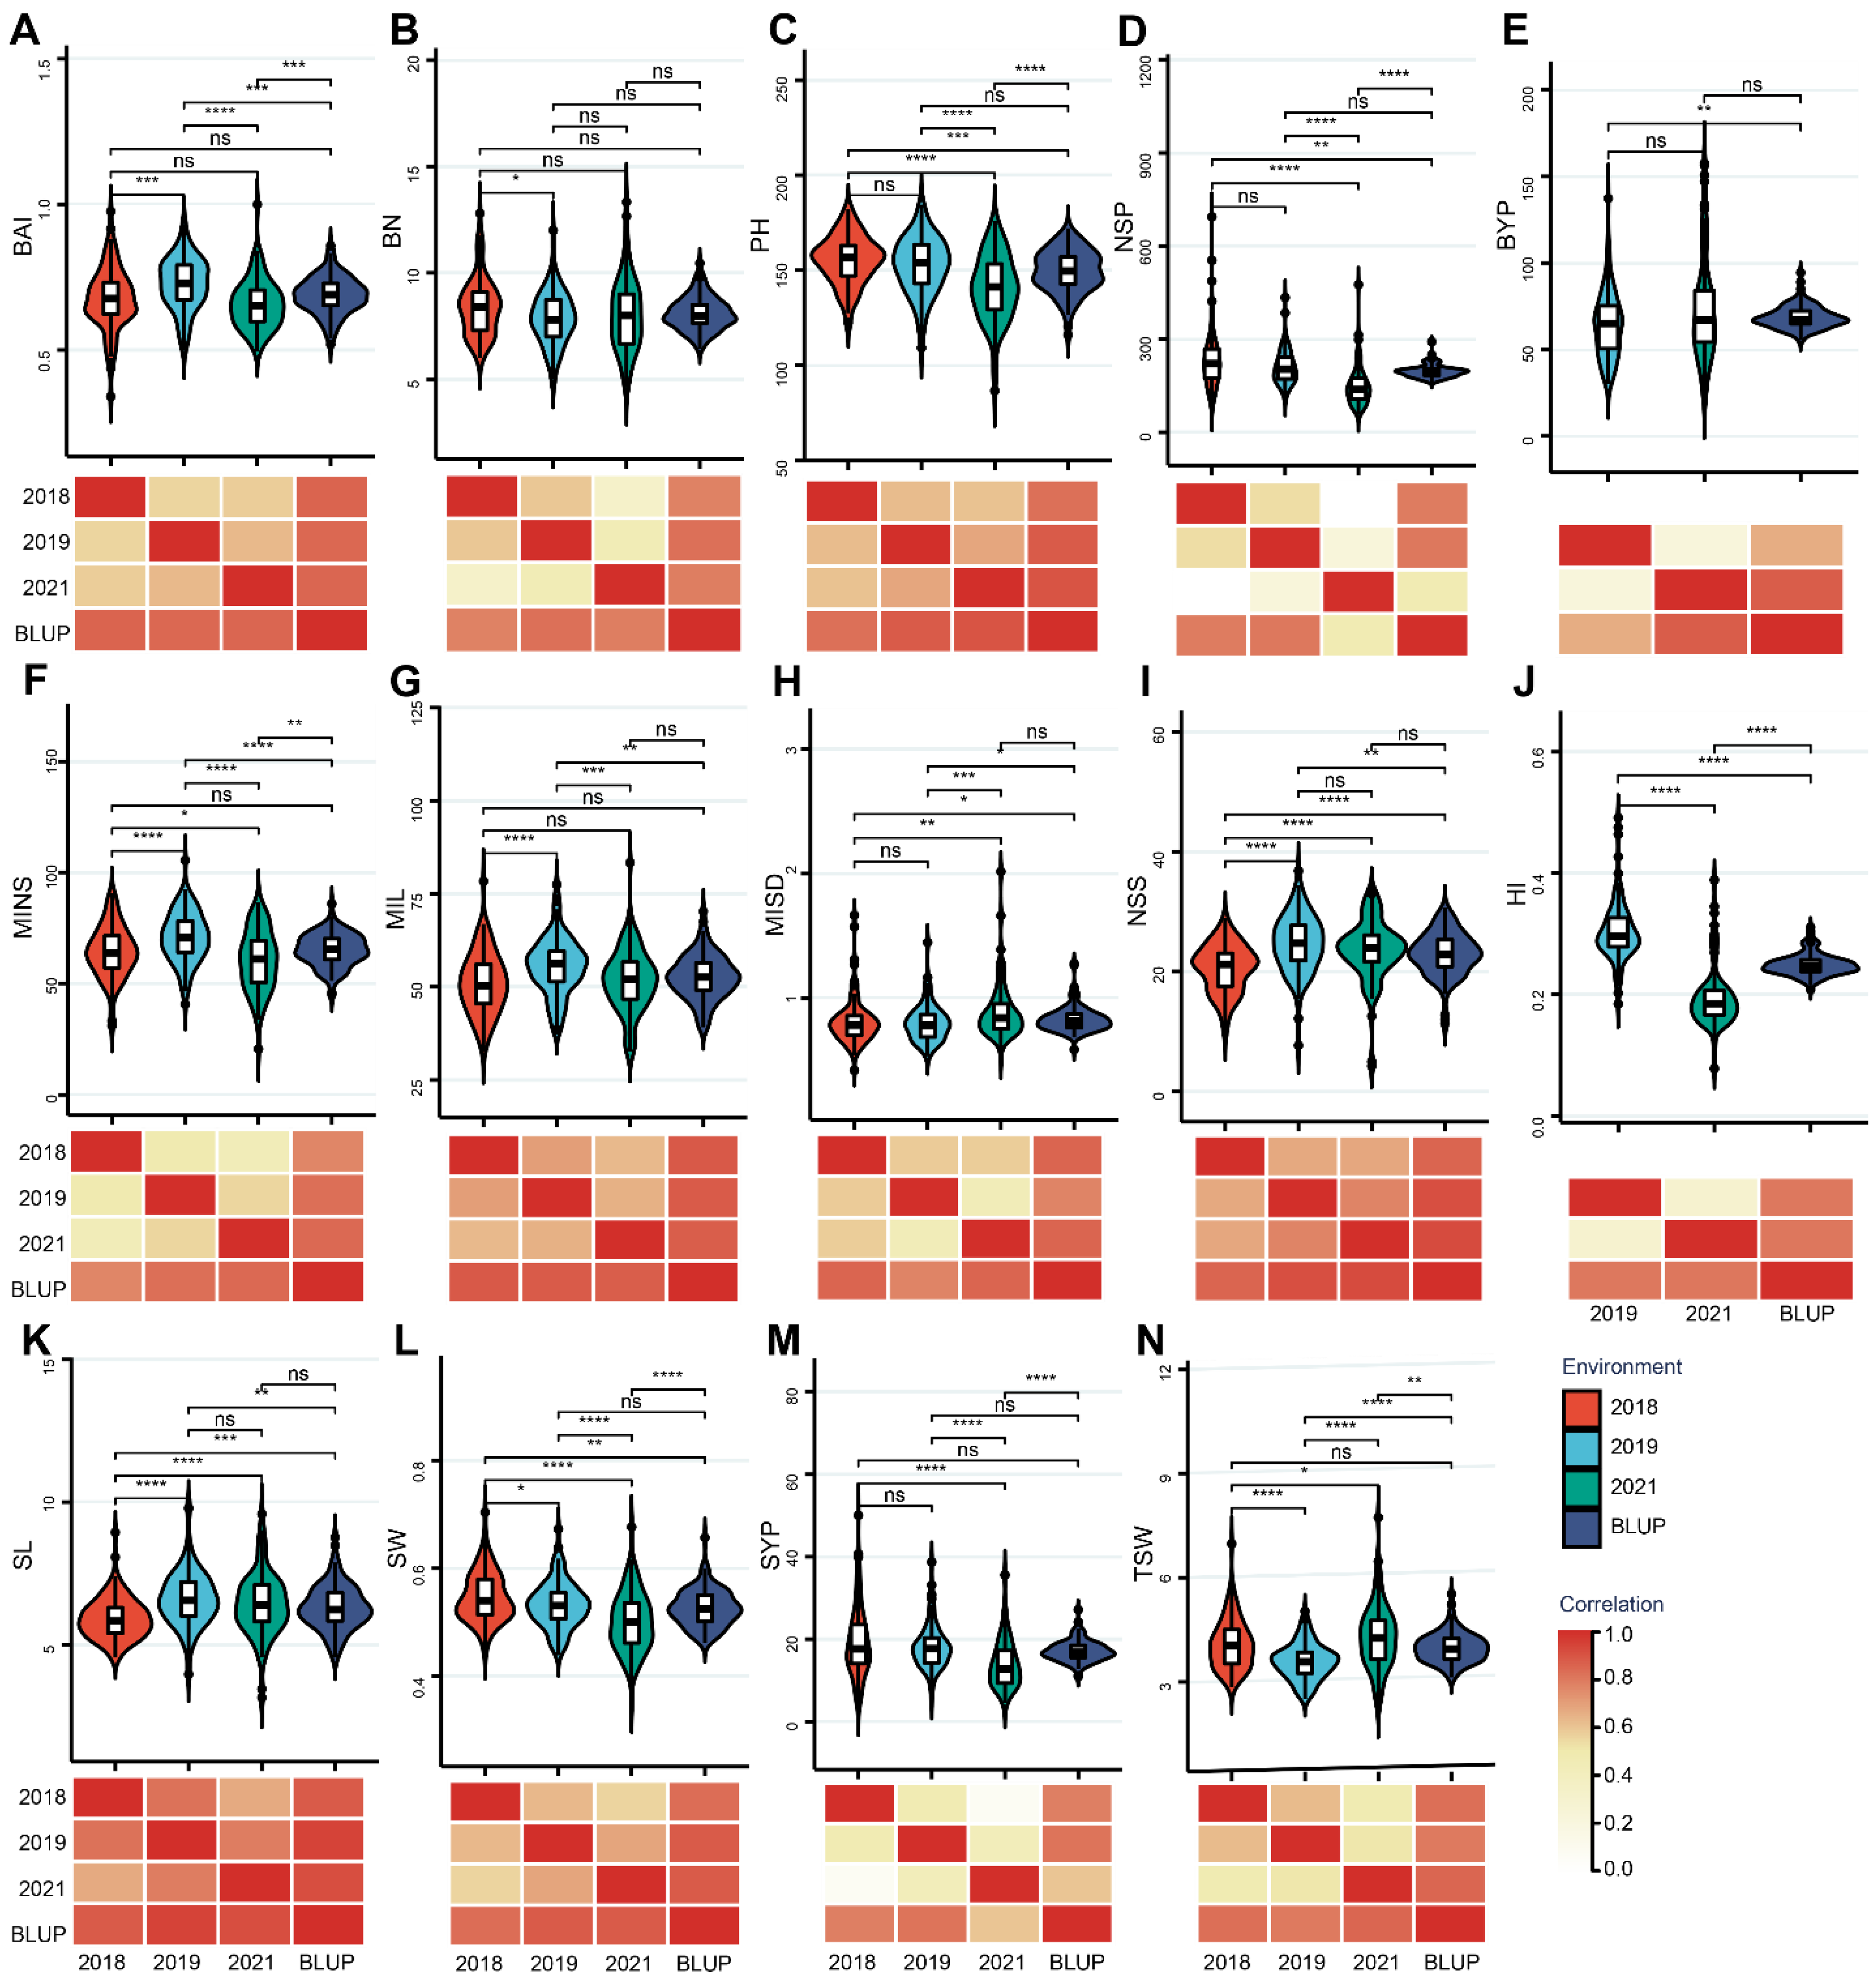
3.1. Phenotypic Variation for Different Agronomy Traits

The phenotypic data of the agronomy traits were recorded for 3 years. The statistical parameters (average, maximum, minimum, standard deviation, coefficient of variation (CV), and h2) related to the traits are summarized in Table S1. The violin plots display the distribution patterns of phenotypic values (Figure 1). Variations of all the traits were widely and continuously distributed, and the correlations for the trait among different years were middle to high (Figure 1). The PH (CV = 9.32%) and SW (CV = 8.4%) were the two least CVs, while the highest average variation coefficients were SYP (CV = 31.71%), NSP (CV = 29.22%), and BYP (CV = 26.61%). The HI (CV = 16.36%) ranged from 0.18 to 0.49 in 2019 and 0.08 to 0.39 in 2021. Moreover, these traits (SYP, BYP, NSP, and HI) showed weak or no correlation among different years (Figure 1) and the heritabilities were also the lowest with the h2 from 0.43 to 0.57 (Table S1). It suggested that these four traits were easily affected by environmental conditions and difficult to measure accurately.
We measured the three-part branch angles (BA) for each plant including TBA, MBA, and BBA. However, there were large differences between the angles of different parts, and the correlations among them were not strong (Figure S1). Thus, we calculated BAI to integrate these angles for further studies. For the rest of the traits, the statistical parameters were displayed in Table S1 as well. The correlations for all the traits among different years were middle to high (Figure 1). The heritabilities (h2) of them were highly repeatable, ranging from 0.43 to 0.90. The most stable inherited traits were SL and NSS with a heritability of 0.90 and 0.88, respectively. Several significant partial correlations were observed between all traits (Figure S2). Notably, HI only showed significant correlations with SYP (0.46 ***) and BYP (−0.58 ***), suggesting it was determined by SYP and BYP. For SYP, it was extremely significantly related to PH (0.22 **), BN (0.29 ***), NSS (0.46 ***), NSP (0.35 ***), and TSW (0.29 ***). For BYP, extremely significantly correlations were determined with MIL (−0.27 ***), MINS (0.24 ***), and MISD (0.23 ***). In addition, PH had a positive contribution to SYP (0.22 *) and BYP (0.15 *), and MISD showed the opposite contributions to SYP (−0.18 *) and BYP (0.23 **). Thus, although HI was a complex trait that was difficult to measure accurately and repeatedly, we can improve it indirectly by regulating its key factors.

3.2. Population Structure and Genome-Wide Association Analysis

All of the pairwise genetic distances among the 104 rapeseed lines were determined from the SNP genotypes, and 3476 independent SNPs were used for calculating population structure. Population structure was assessed for K values ranging from 1 to 10 with the lowest cross-validation error using the ADMIXTURE software. As a result, the LD decay changed continuously, and when K = 5, the cross-validation error was the lowest (Figure S3). For STRUCTURE, variation of Delta K suggested that the population could be assigned to seven groups (Figure S3C). Furthermore, a neighbor-joining tree determined from the SNP genotypes showed that the 104 rapeseed lines could be classified into five divergent groups (Figure S3D). Therefore, PCA = 5 was applied as the covariance for GWAS.
To ensure the reliability of GWAS results, genome-wide association mapping was executed with six algorithms by Tassel5 [16] and mrMLM [20]. Most of the ideal models were presented in accordance with the observed −log10(p-value) vs. the expected −log10(p-value) in the QQ plots (Figures S4 and S5). For different algorithms (i.e., SNPs detected by the same trait in different environments), there were differences in the detections of QTL of the six methods (Figure 2A), FASTmrEMMA (70), FASTmrMLM (318), ISIS EM-BLASSO (236), mrMLM (188), pLARmEB (300), and MLM (163). Among them, 183 SNPs detected by at least two algorithms were considered as credible loci. For different environments (i.e., SNPs detected by the same trait with different algorithms), a total of 279, 260, 305, and 431 loci were detected in 2018, 2019, 2021, and BLUP, respectively (Figure S2B). One hundred and seventeen significant SNPs (the same SNPs for different traits were treated as the repeated SNPs) associated with a certain phenotype were identified by any two environments of 2018, 2019, 2021, and BLUP, which were considered as credible loci as well. The SNPs C06_22559430 and A03_22103527 were simultaneously detected by the four environments of NSS and TSW, respectively (Table S2). Nine significant SNPs were identified across three different environments related to PH (4/9), SL (3/9), NSS (1/9), and MINS (1/9). These SNPs repeatedly detected in multiple environments can be regarded as reliable loci for controlling traits.
We combined the above credible SNPs detected by different algorithms and environments and excluded the minor QTLs with PVE of less than 1%. Three hundred and twenty-four QTLs involved in 212 SNPs above were used for further analysis. The traits mostly detected at QTLs were BAI (39/324), MISD (37/324), NSS (35/324), SL (34/324), TSW (34/324), PH (33/324), and MIL (26/324) (Table S3). These QTL were widely distributed on 19 chromosomes. The most distributed chromosomes were A01, A03, A05, C05, C06, and C09. Chromosome A08 contained only one SNP associated with MISD at A08_16931989. Five SNPs for the harvest index were detected on A05, C05, C08, and C09, three for BYP on A06, C02, and C05, and fourteen for SYP, mainly on A01, C04, A03_random, and A06_random.

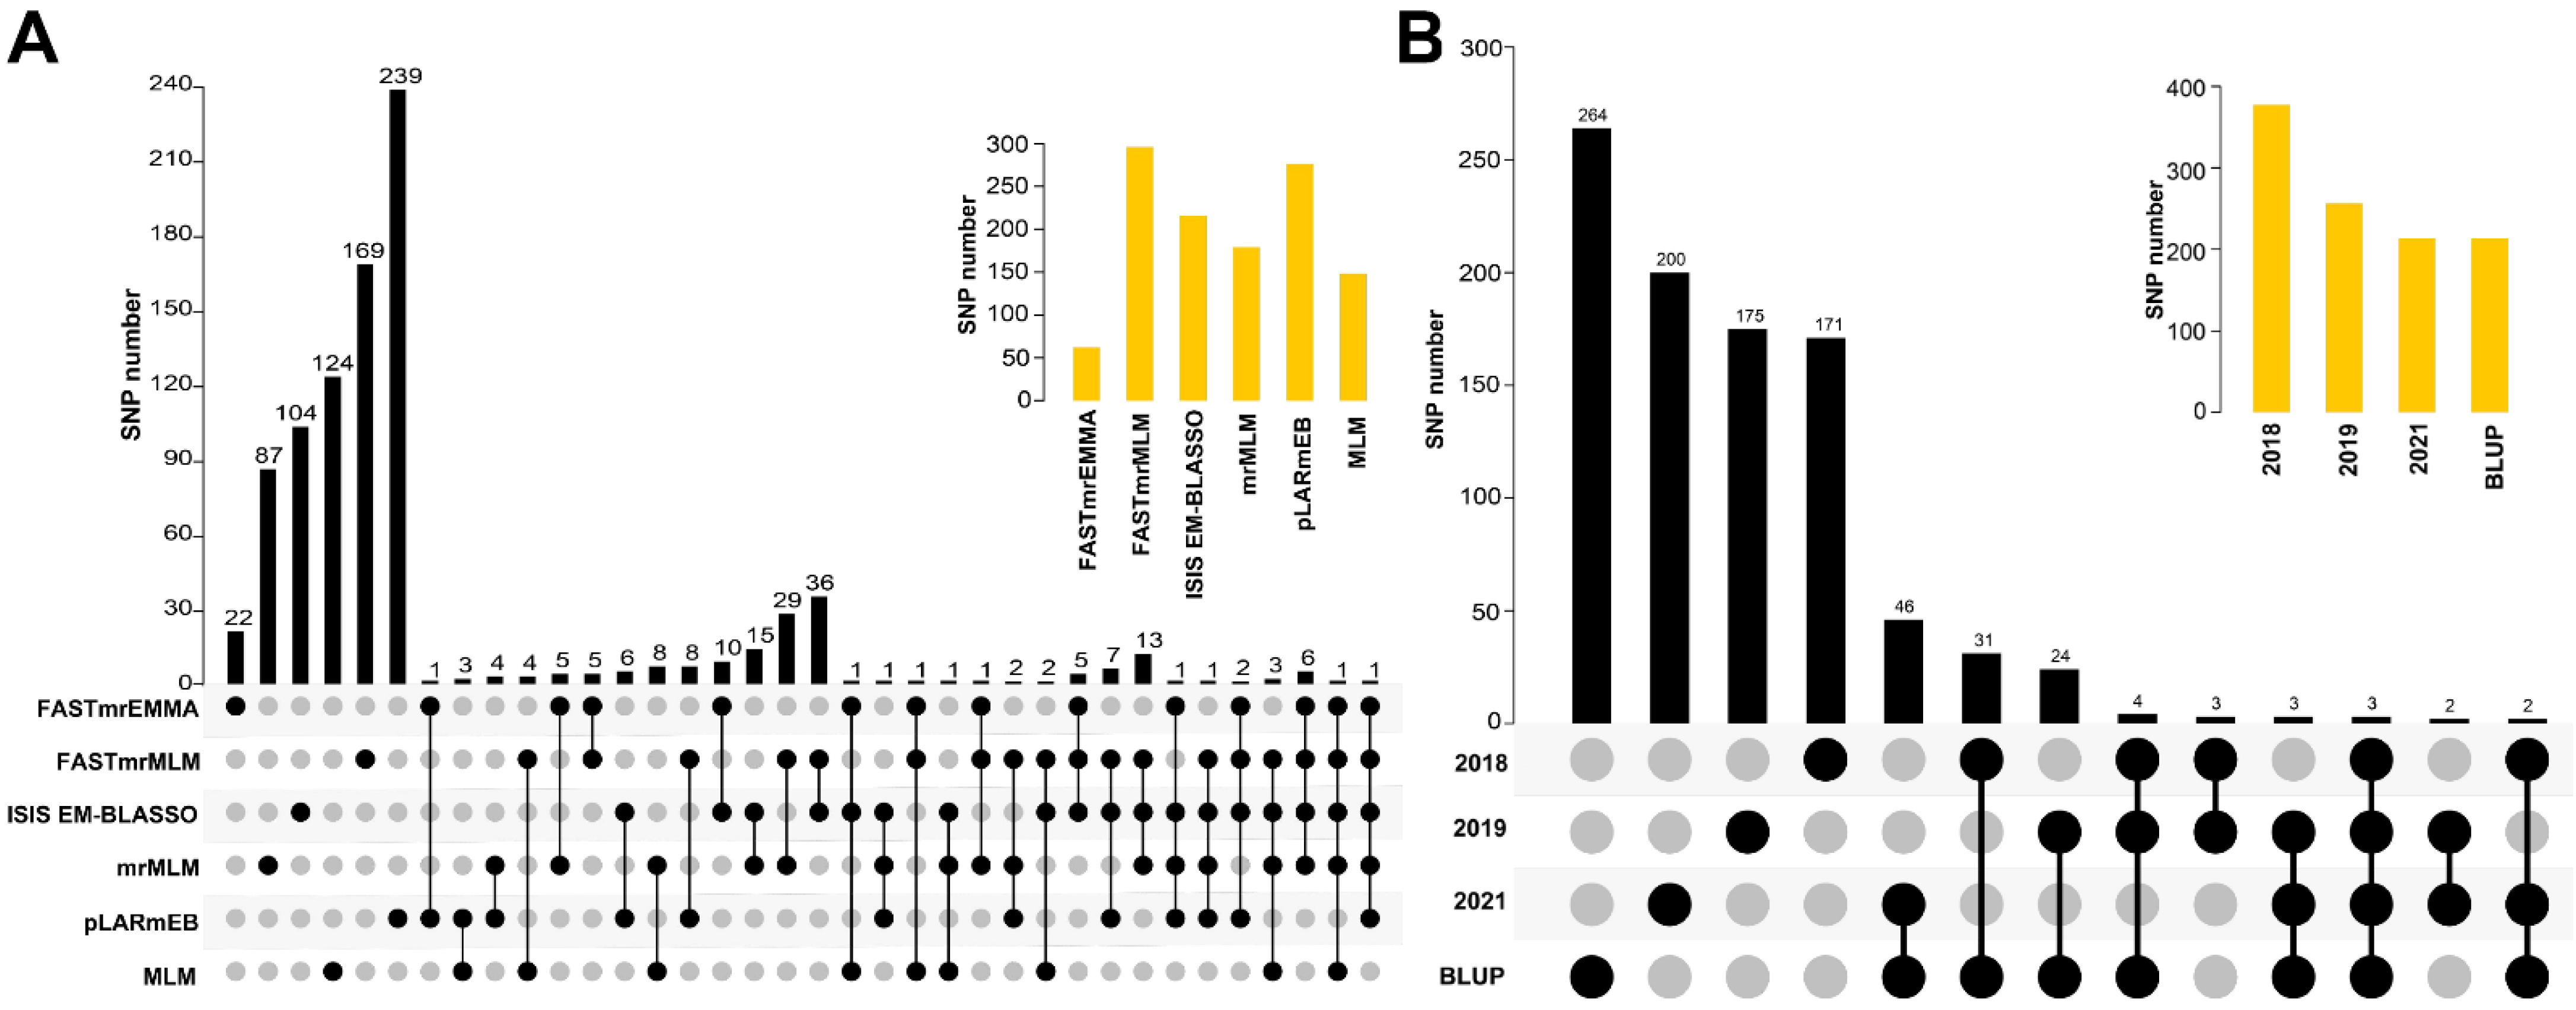
3.3. Comparison of the Stable SNPs

Appropriately reducing plant height can not only improve lodging tolerance but also increase harvest index. For PH, four SNPs, namely A02_random_355708, A03_25488780, C09_36899682, and C04_47349279, were co-detected by three environments with PVE 5.2–35.6%. These were stable SNPs for controlling plant PH. Since multi-environmental phenotypic data were used in GWAS, we examined the association of the SNPs with BLUP values. As expected, all of them showed extremely significant associations with PH (Figure 3A). Interestingly, the majority of them showed a significant correlation with SYP, such as A01_1783685 and A03_25488780, while the A allele of SNP C09_36899682 was also associated with low BYP. Moreover, C09_36899682 explained for over 27.4% of the phenotypic variation of PH, and others only explained for 5.5–18.1% (Table S2). C09_36899682 could be an effective locus to control PH to decrease BYP without reducing SYP.
Silique and seed characteristics are important factors of seed yield. For NSS (Figure 3B), C06_22559430 and A07_random_1623623 were co-detected by at least three environments explaining the phenotypic variation from 4.5 to 21.2%. The T allele of C06_22559430 was associated with high NSS, but the A allele of A07_random_1623623 did not show significant association with NSS distribution. For TSW, A03_22103527 was detected by TSW across four environments, and the G allele showed higher TSW than the A allele (Figure 3C).
For pleiotropic SNPs, A01_1783685 was identified by PH_2018 and SYP_2018, and C06_26638717 was detected by PH_2019, PH_2021, NSS_2021, and NSS_BLUP (Figure 4 and Table S2). Notably, A01_1783685 and C06_26638717 were located in the interval related to PH as shown in previous studies [13,30,31] (Figure 4). However, they have not been detected by SYP or NSS. Meanwhile, C03_4731660, co-detected by MIL_2019 and MINS_2019 (Figure 5 and Table S2), has not been reported to be associated with MIL or MINS. These results implied that these loci might play multiple roles in plant growth.
For harvest index, C05_6554451 was significantly associated with HI_2019 and HI_BLUP, explaining for 13.4% and 4.6% phenotypic variation, respectively. C05_6554451 was detected to be significantly associated with HI_BLUP (p = 0.0044), and the A allele was high harvest index (Figure 3D). In addition, we also analyzed the significance between other agronomic traits and the allele of stable detection loci of traits (Figure 3). These results provided favorable alleles to regulate HI directly and indirectly.

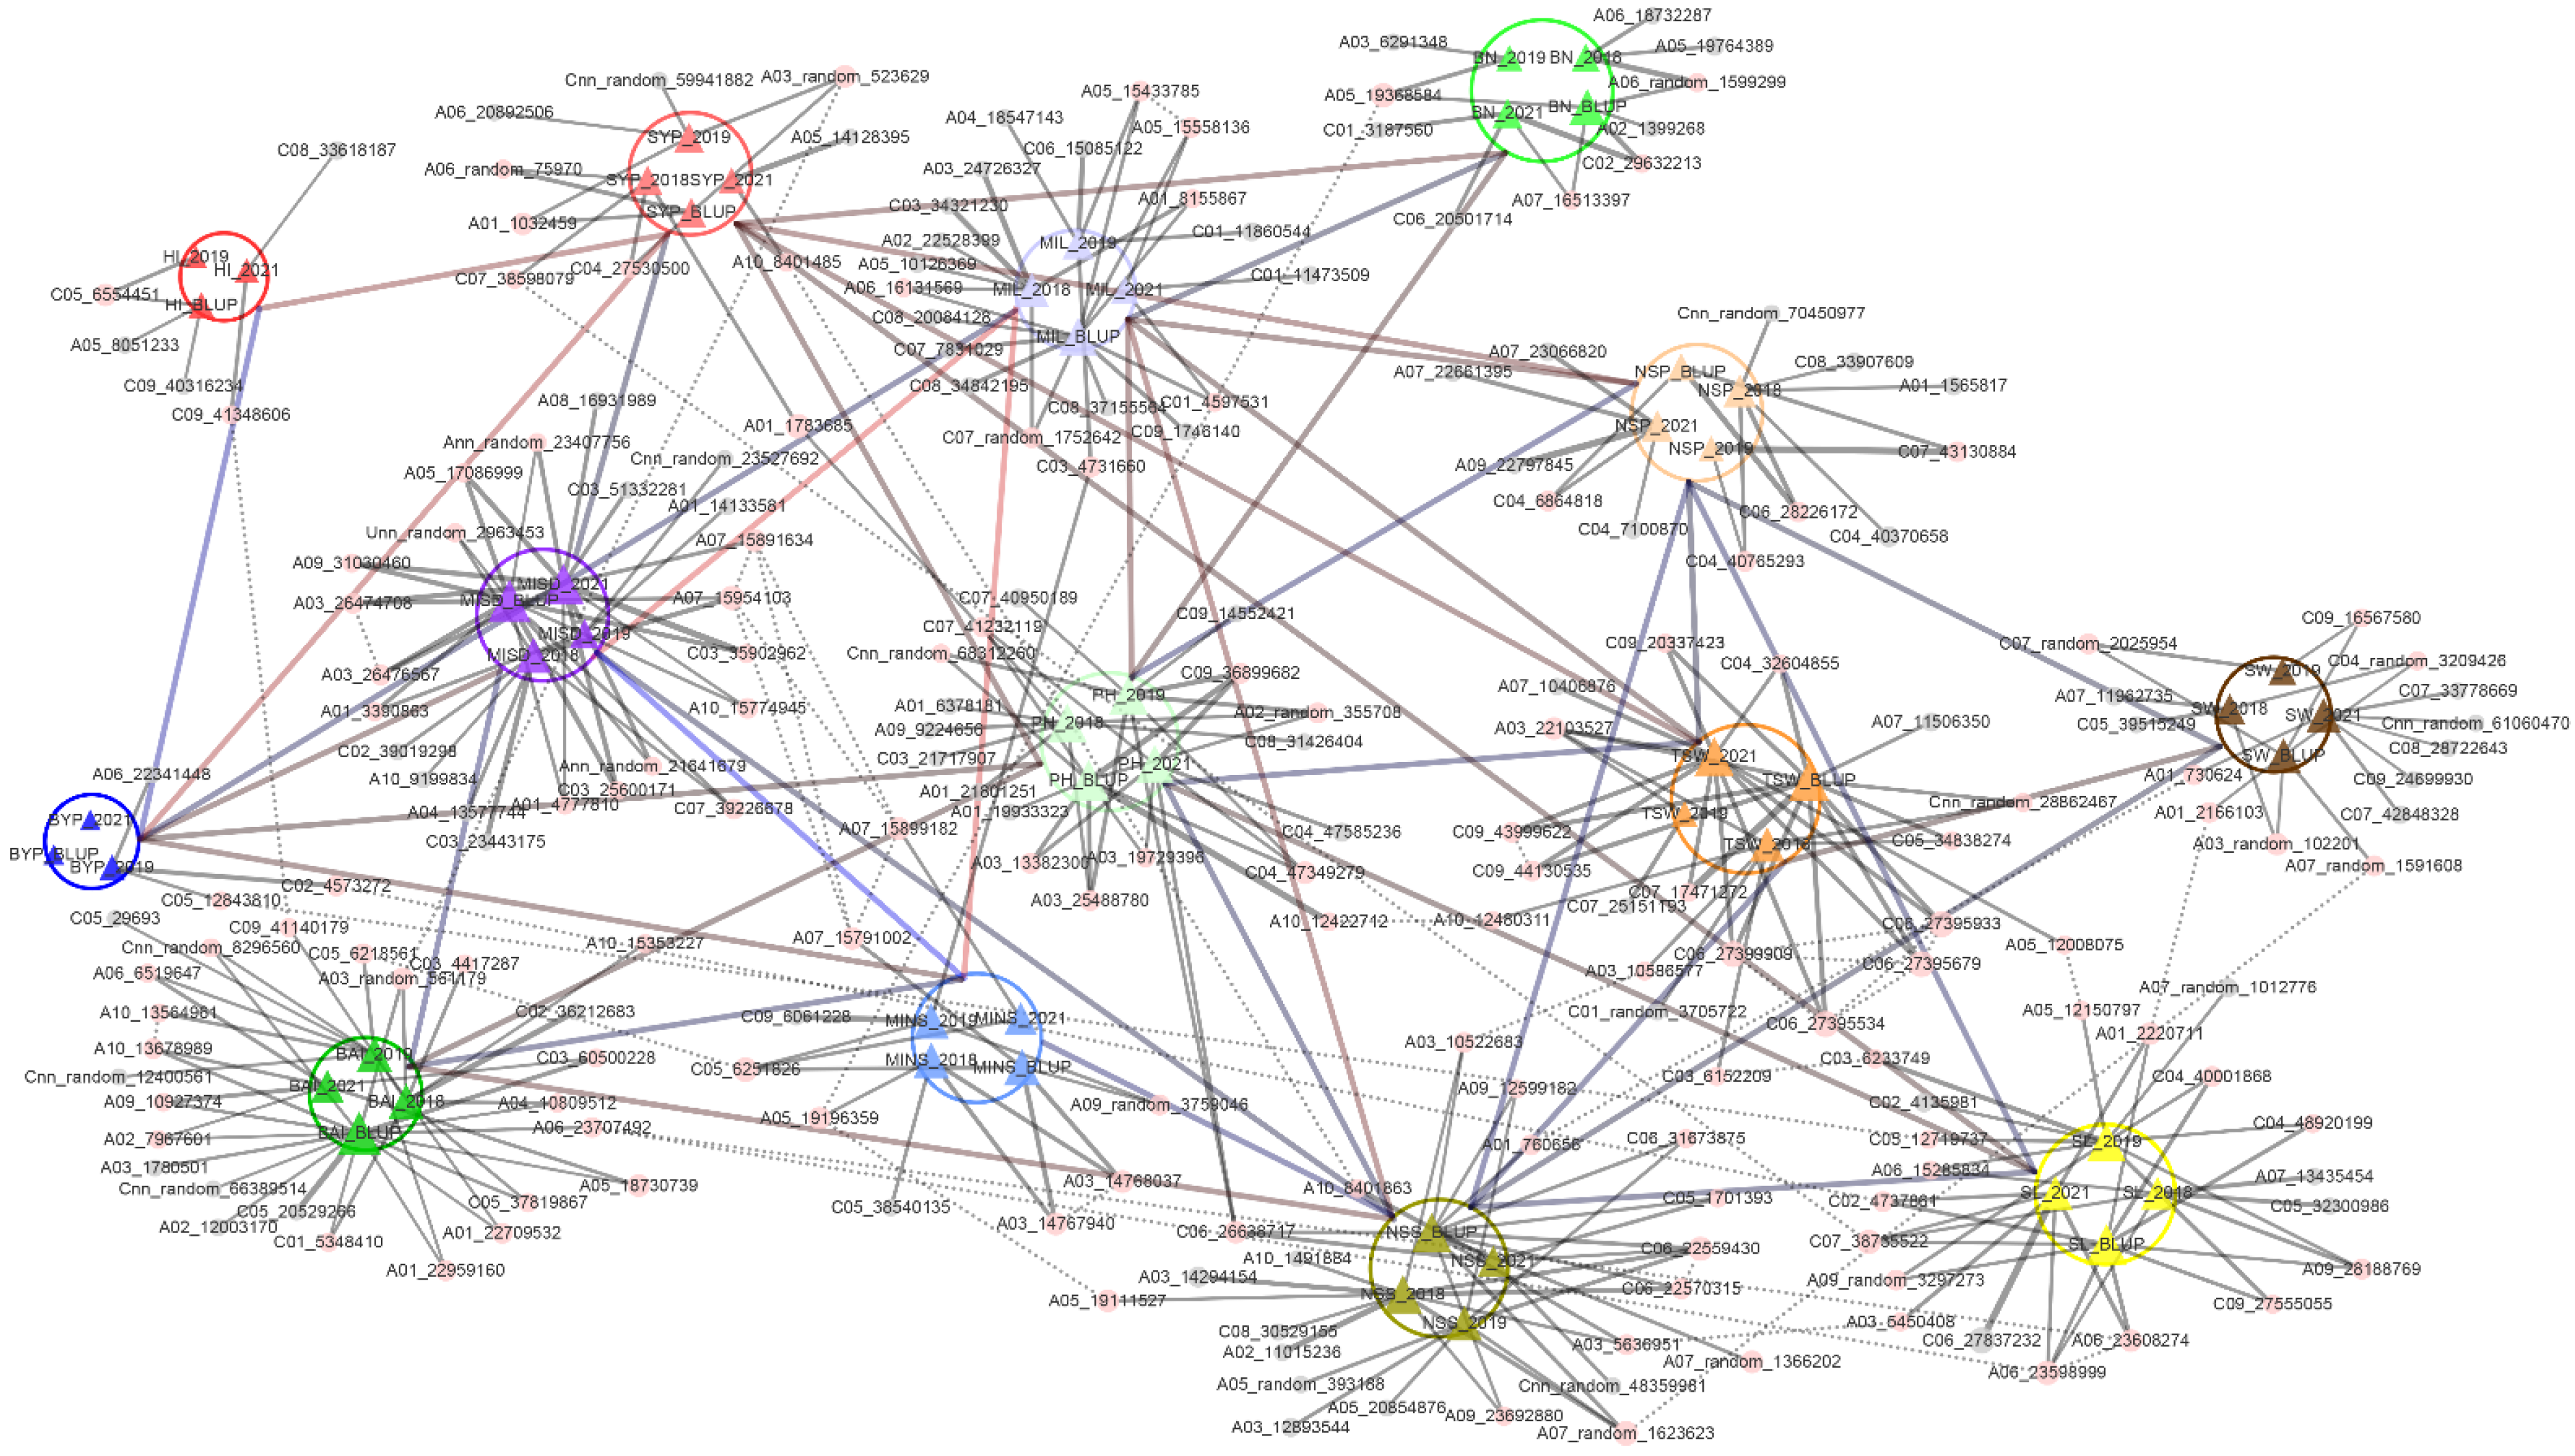
3.4. Network of Significant SNPs Associated with Phenotypes

Based on the partial correlated relationships among the traits and the significant SNPs for the traits (Figure 5), we found that the 14 traits in this study tended to be correlated relationships, suggesting that they might be genetically coregulated. To dissect the correlations across different traits clearly, a phenotype-SNP network was constructed. At the trait level, all the traits were linked directly or indirectly by partial correlated relationships. For trait to SNP, they were associated with the PVE of significant SNP. At the SNP level, SNPs related to more than one trait or environment or adjacent to other significant SNPs were marked. Based on the networks, it was easily to find that some SNPs were associated with the certain trait across multiple years, and some with multiple phenotypes, such as A03_22153527, C06_26638717, and A06_23598999. Meanwhile, the adjacent SNPs were also displayed, and these genomic intervals may control multiple phenotypes. Overall, the network provided a visualized map for hub stable or pleiotropic SNPs, and suggested that complex relationships existed in HI and the other traits.

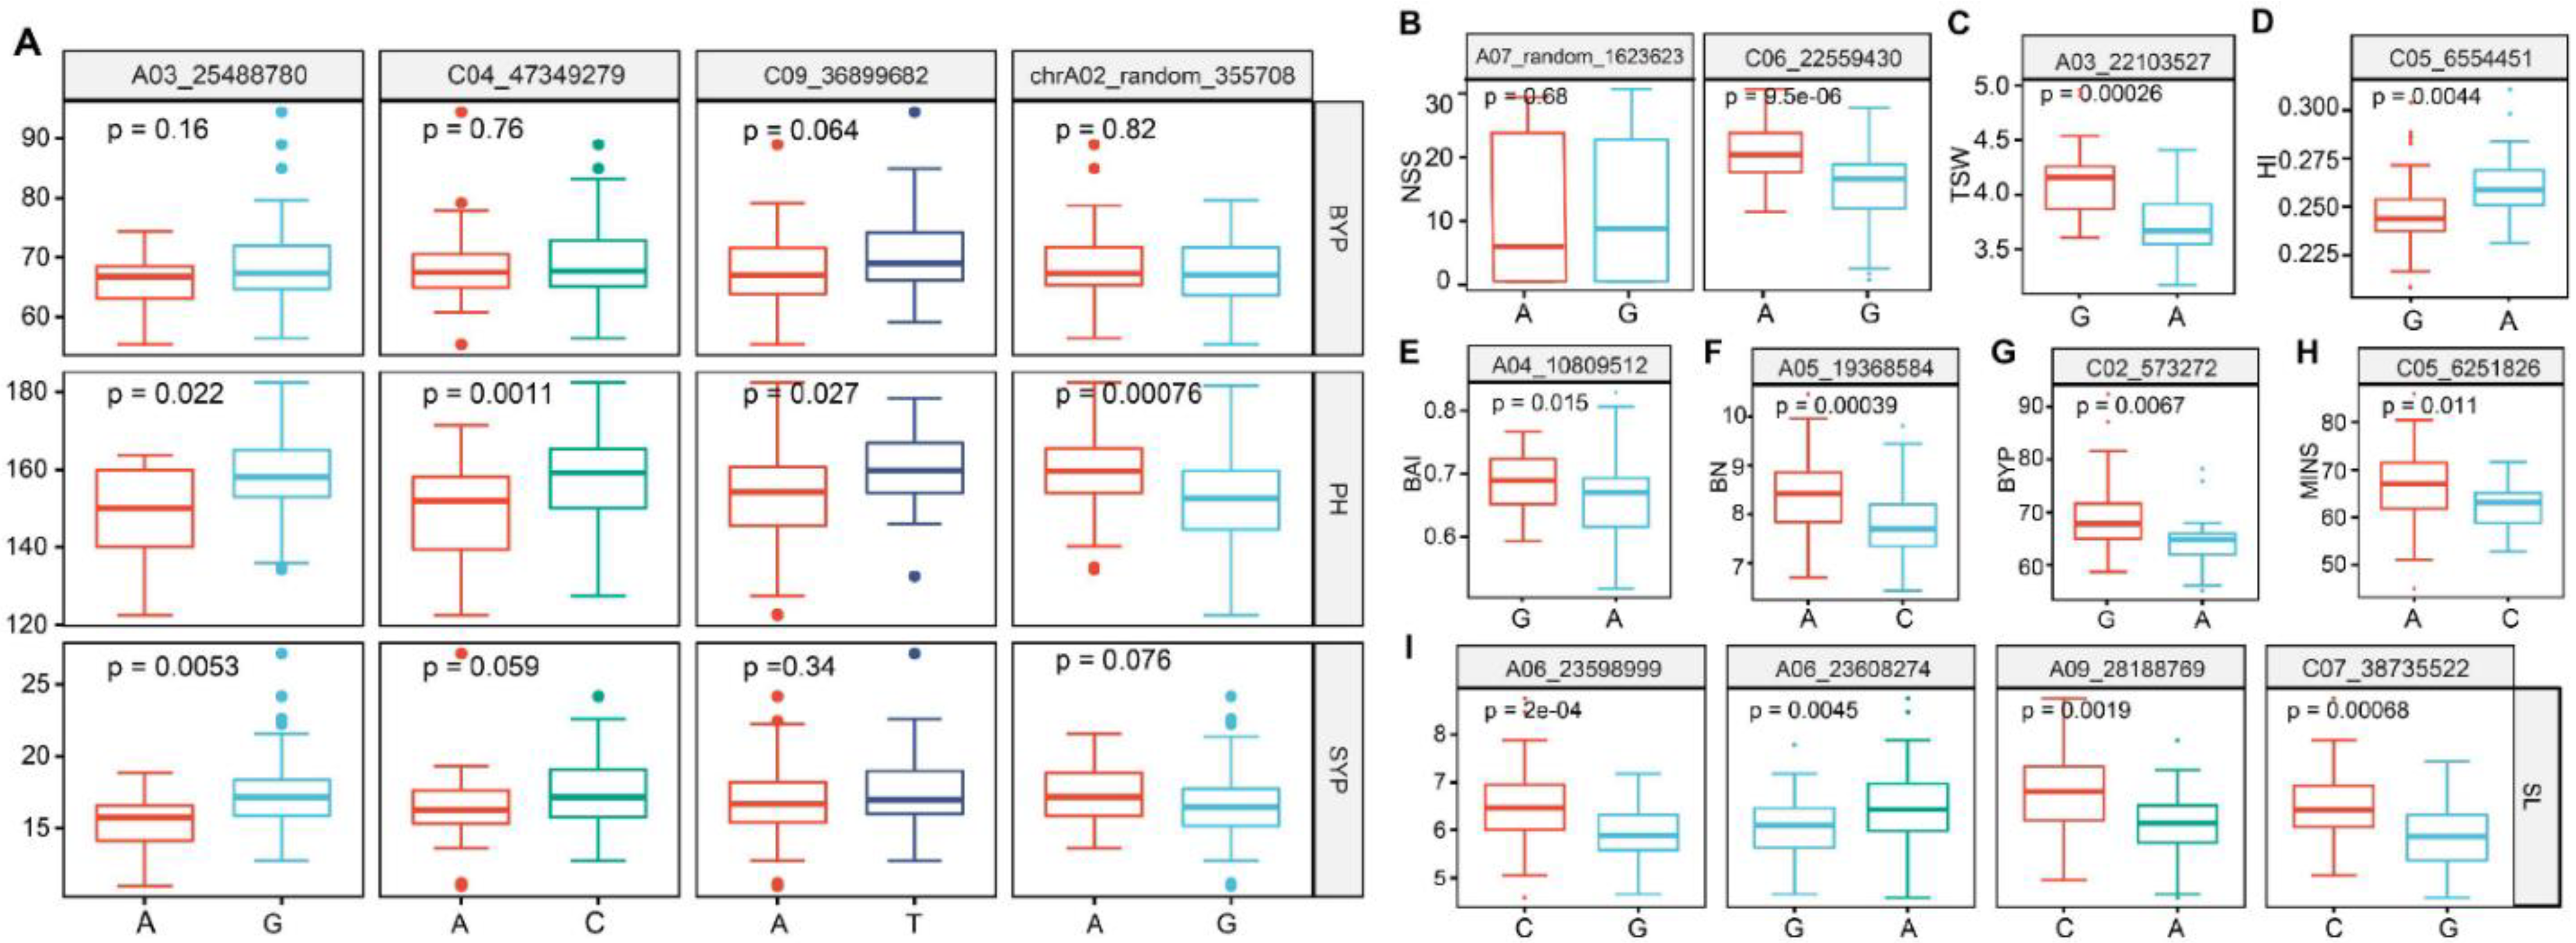
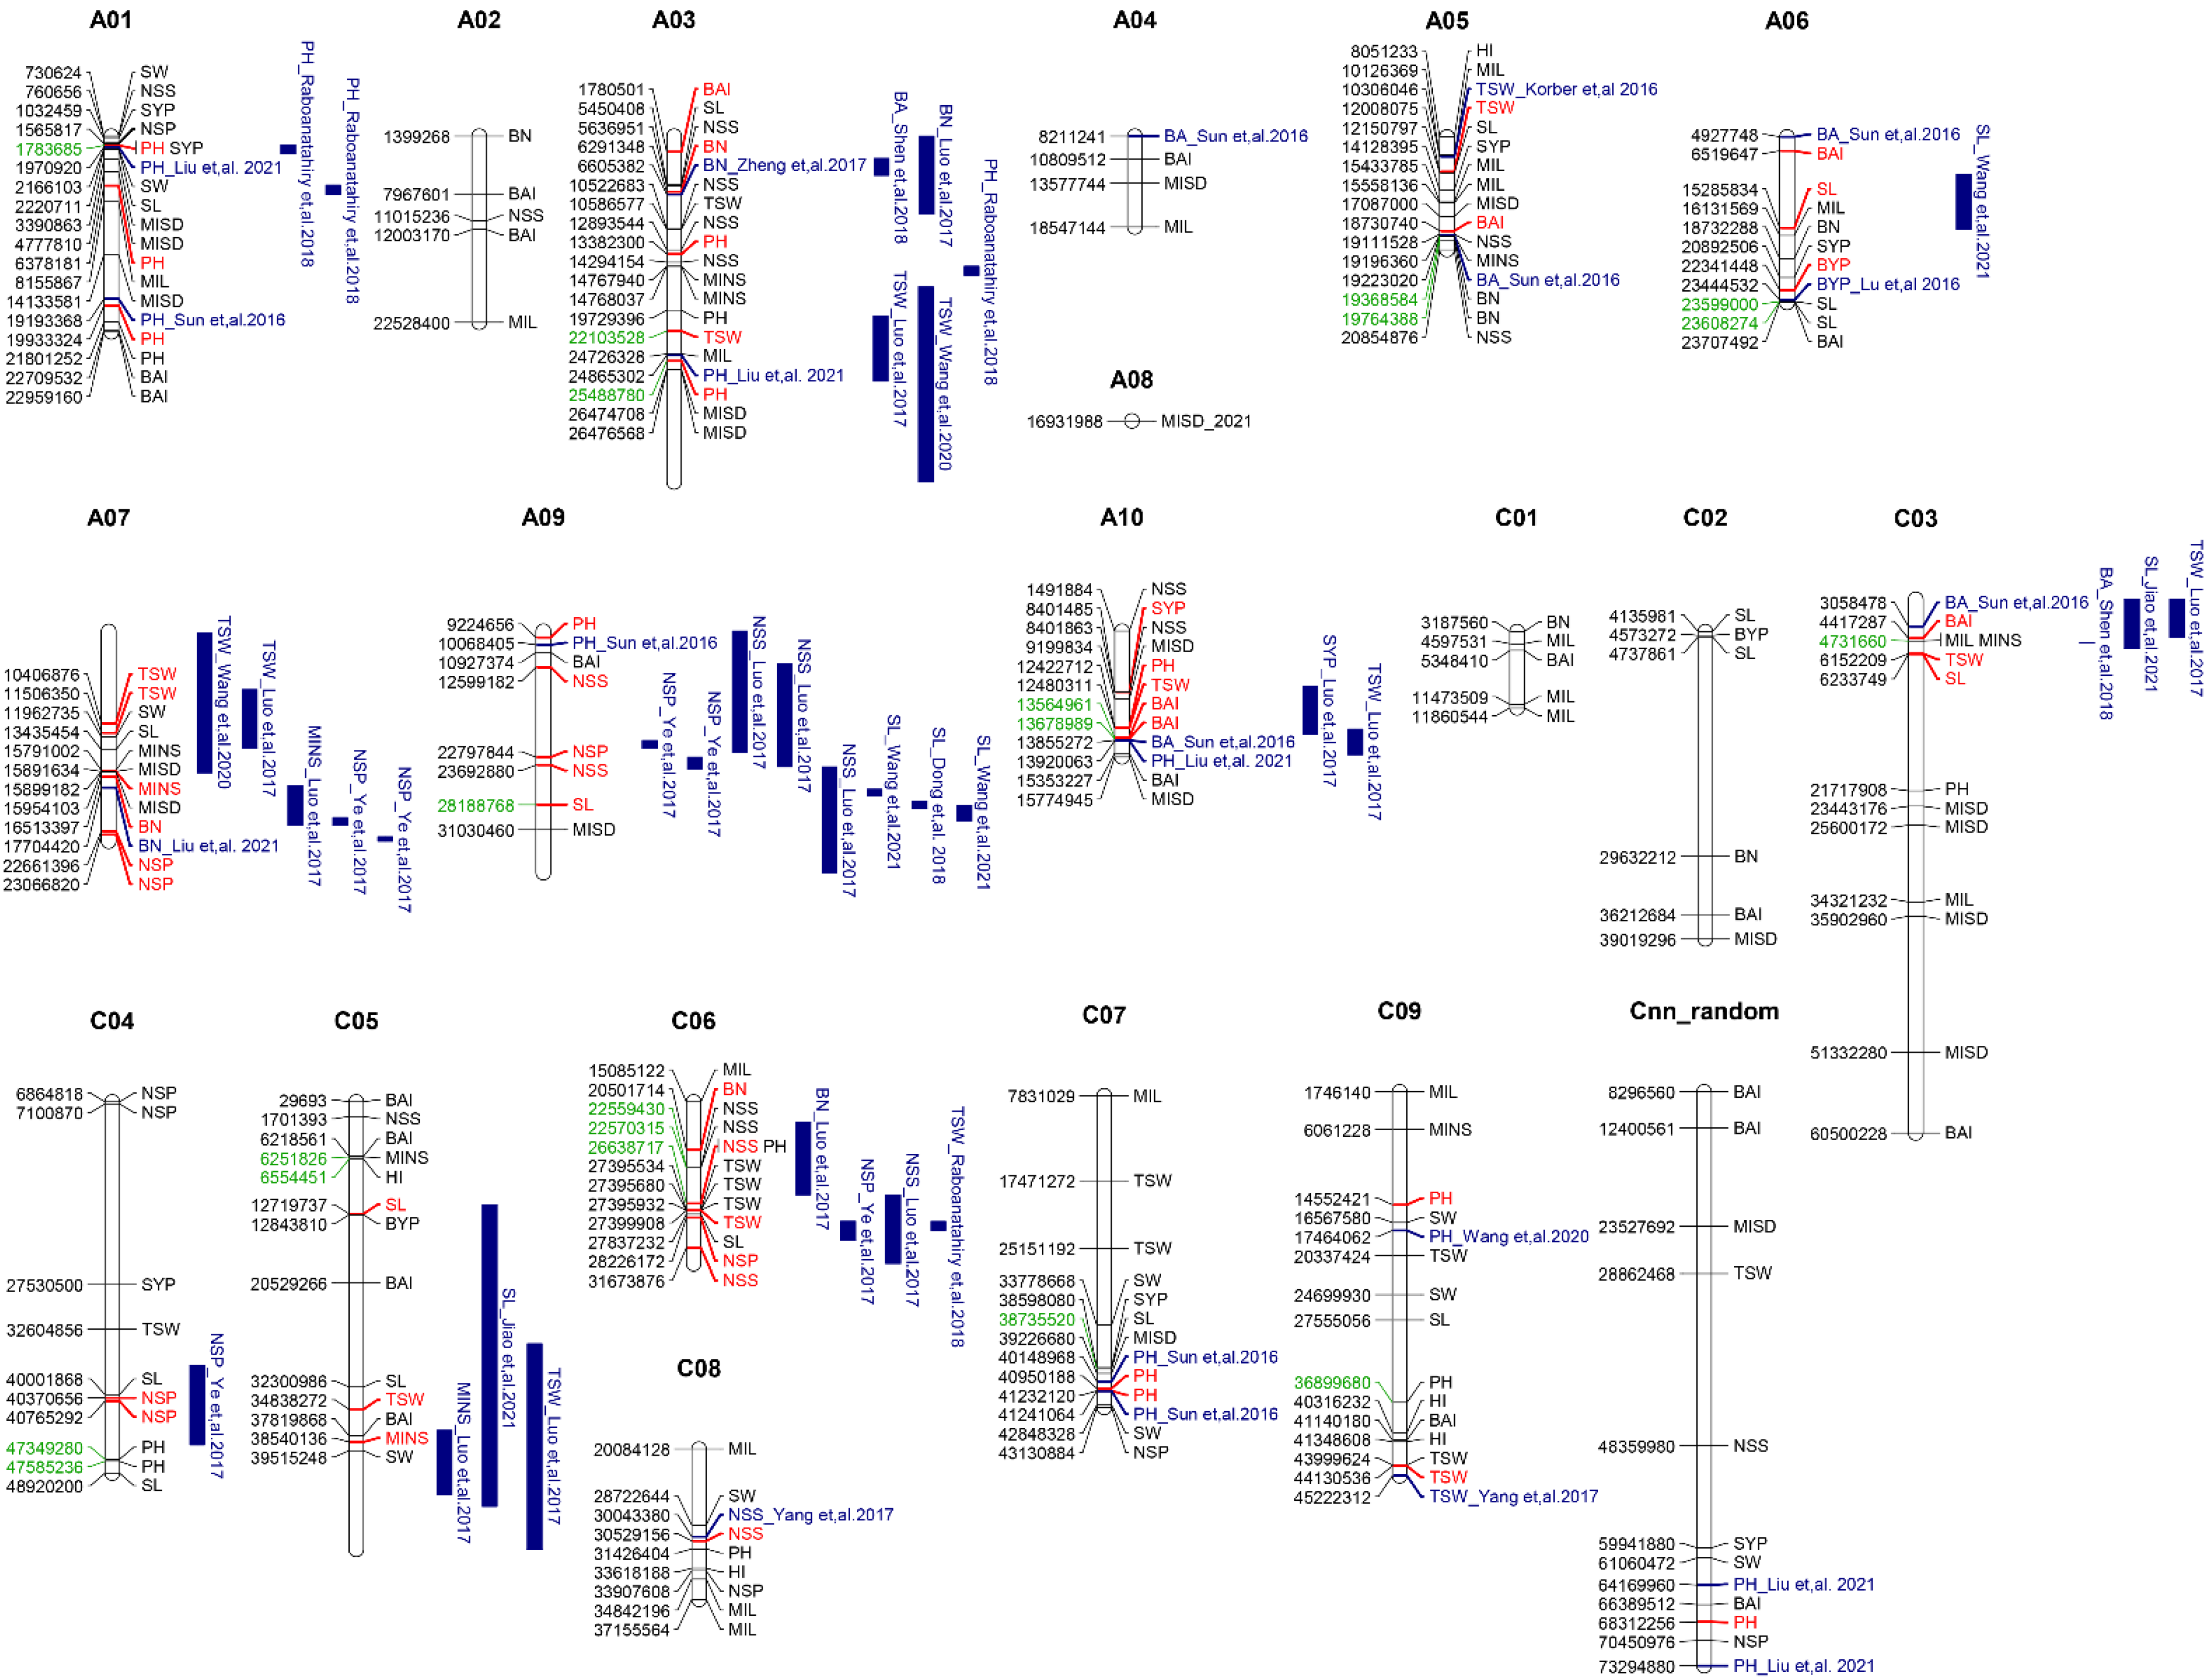
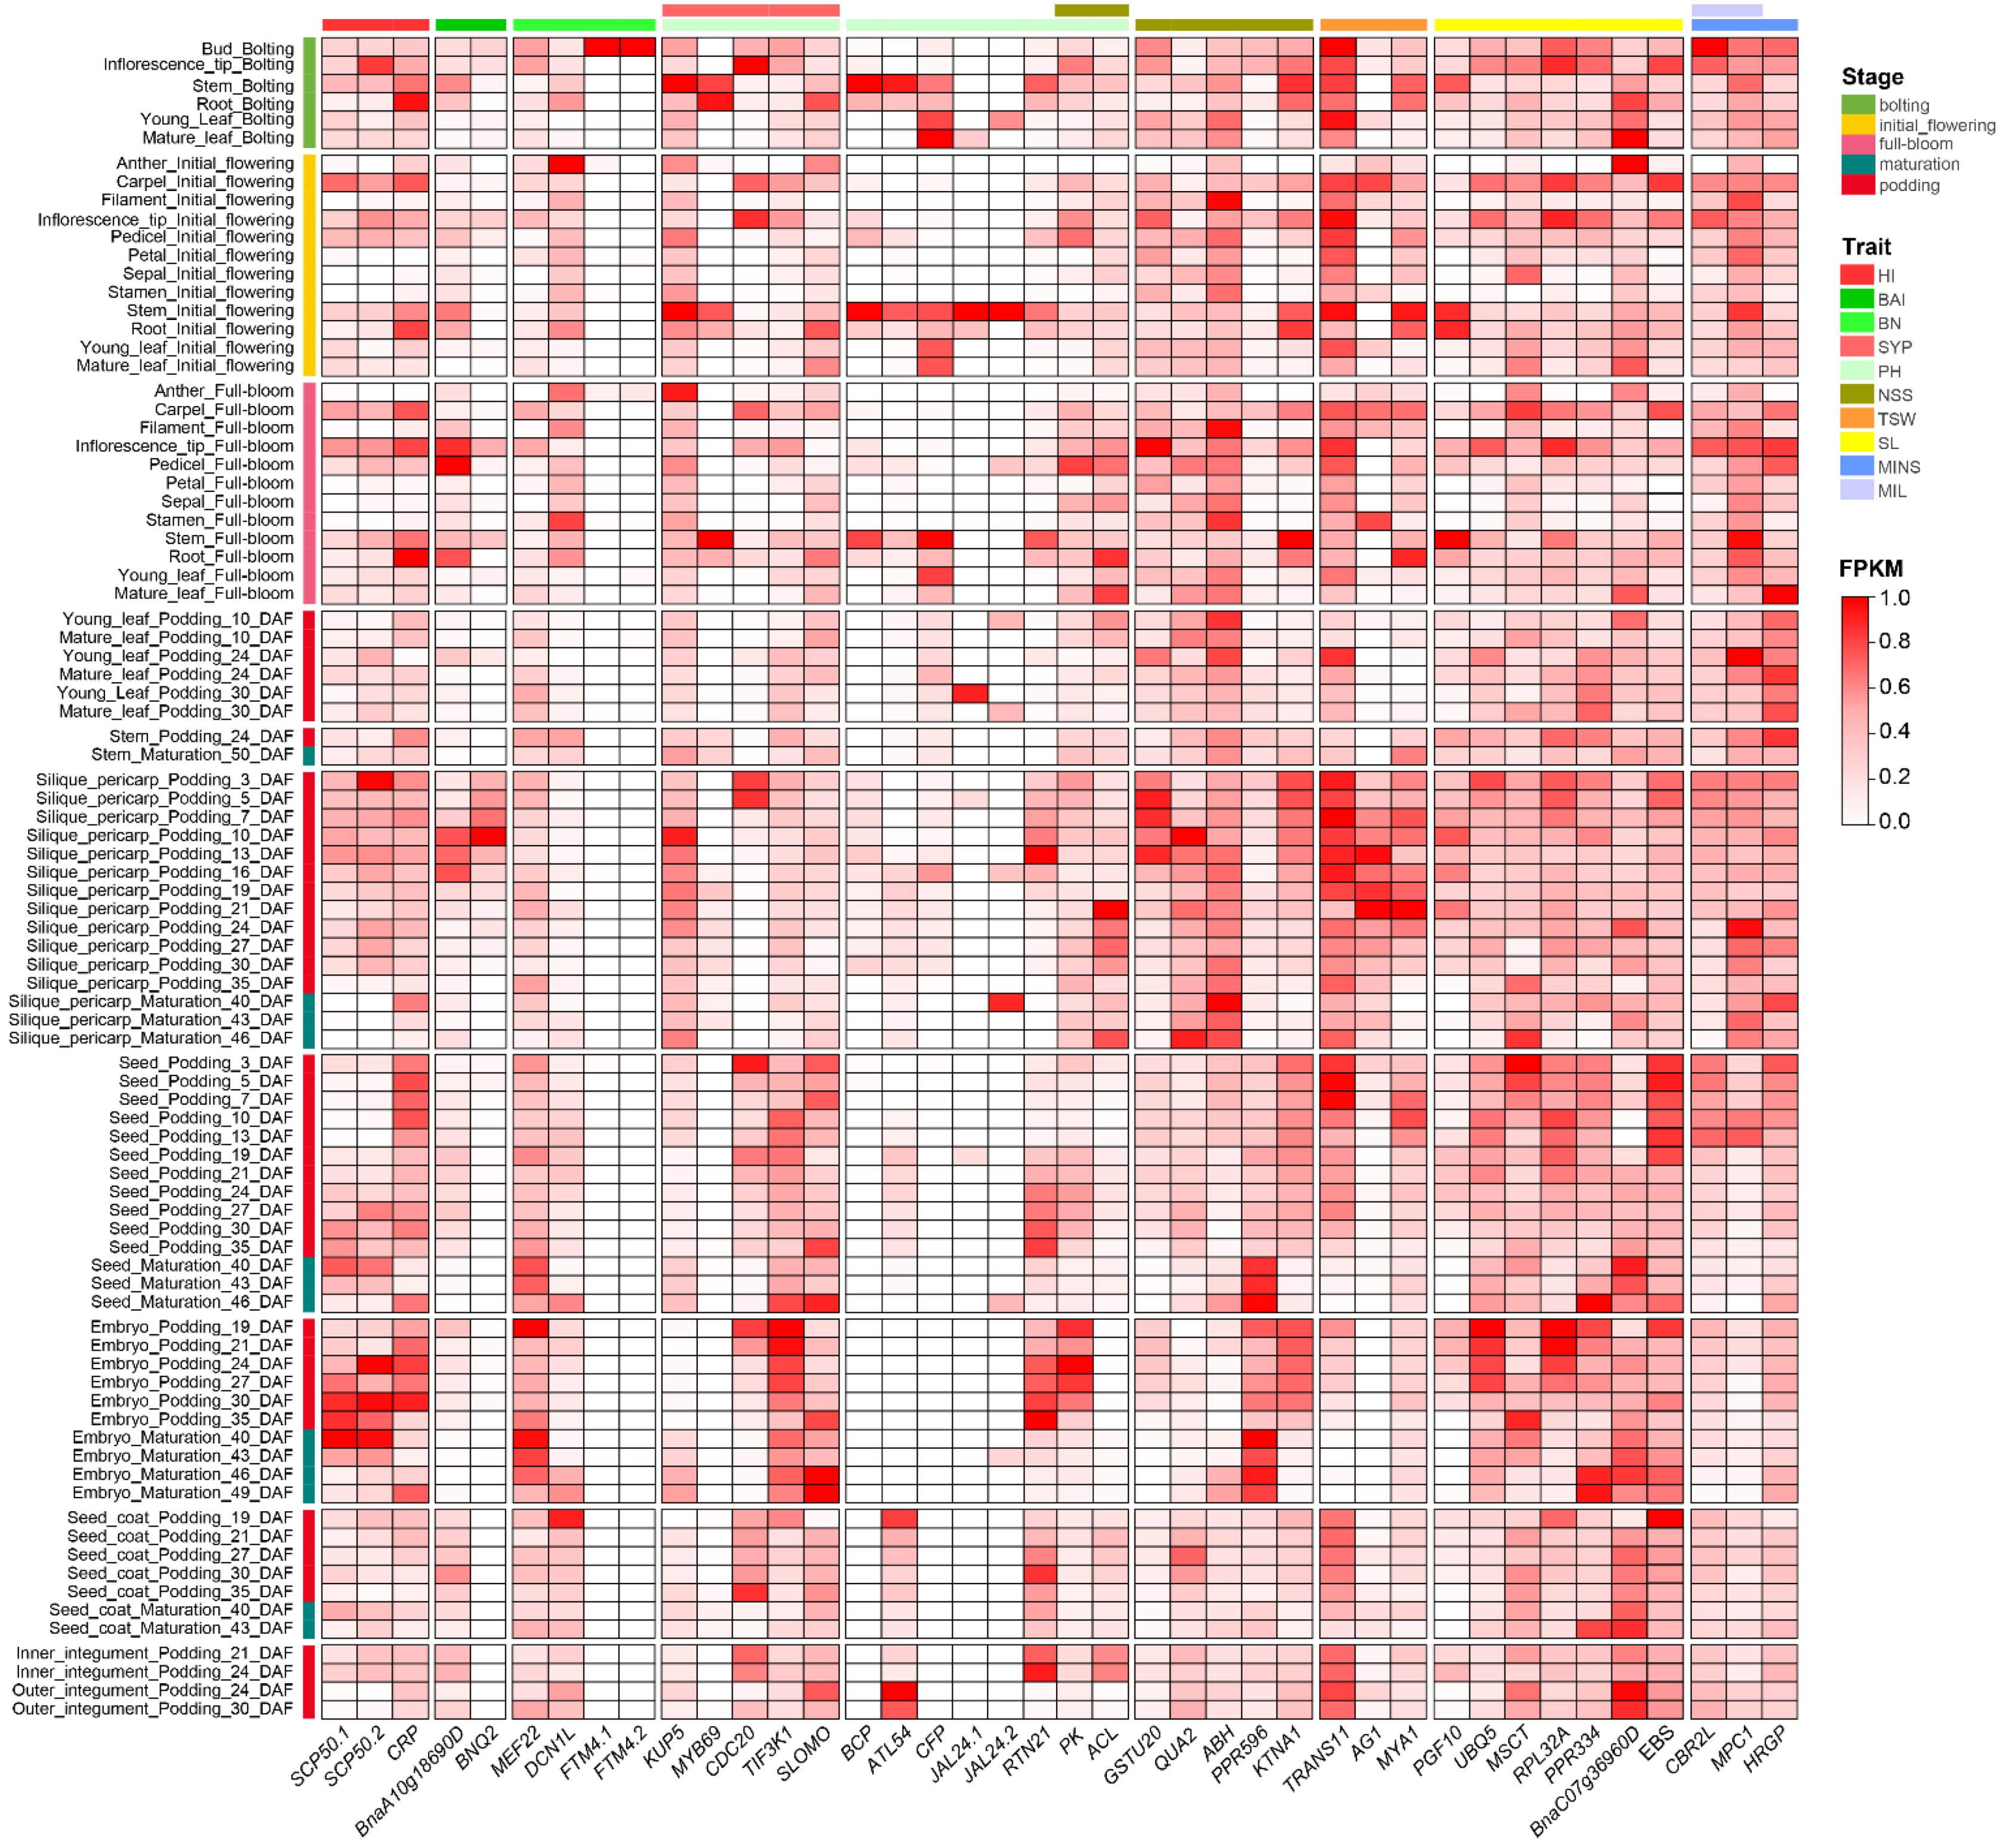
3.5. Identification of Candidate Genes for Stable Loci

According to the phenotype-SNP network of the GWAS results (Figure 5), the stable significant SNPs and pleiotropic SNPs were determined as stable loci. In addition, significant SNPs for HI and significant SNPs adjacent to the stable loci were also listed as stable loci. Twenty-two SNPs associated with the agronomic traits were filtered as promising QTLs. Potential candidate genes were identified in the intervals of significant marker-trait associations by investigating all genes within shared LD blocks or with physical proximity within 100 KB upstream or downstream of the SNPs (Figure S6). The genomic regions from 100 KB of both flanks of the significant SNPs were inspected for putative candidate genes for each agronomic trait. The candidate genes of different QTLs were selected by spatial and temporal expression and functional annotations. A total of 39 putative candidate genes were identified in these intervals (Table 1), and the gene expressions during bolting, initial flowering, full-bloom, podding, and maturation stage in the BrassicaEDB were displayed (Figure 6 and Table S4). All of the candidates were highly expressed in certain tissues of the bud, stem, carpel, inflorescence tip, silique pericarp, embryo, and so on.
For HI, BnaC05g11300D (SCP50.1, Serine carboxypeptidase-like 50), BnaC05g11310D (SCP50.2), and BnaC05g11350D (CRP, Cysteine-rich peptide family) were located in the region of C05_6554451. They showed higher expression in inflorescence tip, embryo, and root.
For TSW, three genes including BnaA03g43740D (TRANS11, Translocase 11), BnaA03g43820D (AG1, Floral homeotic protein AGAMOUS), and BnaA03g43840D (MYA1, MYOSIN 1) were located in the candidate region of A03_22103527. For SL, BnaA09g39690D (PGF10, Polygalaturonase clade F 10) and BnaA09g39760D (UBQ5, Ubiquitin 5) were identified in the A09_28188769 interval, and BnaC07g36830D (PPR334, Pentatricopeptide repeat 334) and BnaC07g36960D (Hypothetical protein) were located in the interval of C07_38735522 and C07_38598079. For the two SNPs only significantly associated with NSS, five genes were predicted as candidate genes. BnaC06g20430D (GSTU20, Glutathione S-transferase U20) and BnaC06g20510D (QUA2, Pectin methyltransferase QUA2) were identified in the intervals of C06_22559430 and C06_22570315. The other three, viz. ABH (alpha/beta-Hydrolasese superfamily), PPR596 (Pentatricopeptide repeat 596), and KTNA1 (Katanin p60 ATPase-containing subunit A1), were located in the regions of A07_random_1623623.
For BAI, two putative candidate genes were identified on A10 (A10_13564961 and A10_13678989), including BnaA10g18690D (Hypothetical protein) and BnaA10g18940D (BNQ2, Banquo 2). For the significant SNPs of BN (A05_19368584 and A05_19764389), three promising genes were identified including BnaA05g26410D (DCN1L, Defective in cullin neddylation protein), BnaA05g26840D (FTM4.1, Floral transition at the meristem 4), and BnaA05g26860D (FTM4.2). For PH, 13 candidate genes were identified on three chromosomes, viz. A01, A03, C04, C06, C09, and A02_random for the significant SNPs. Among them, six genes, BnaA02g35610D (BCP, Blue copper protein), BnaA03g49330D (CFP, Cotton fiber protein), BnaC04g49260D (JAL24.1, Jacalin-related lectin 24), BnaC04g49270D (JAL24.2), BnaA02g35620D (ATL54, RING-H2 finger protein ATL54), and BnaC09g33520D (RTN21, Reticulon protein 21), were predicted for controlling plant height. Two genes, BnaC06g25100D (PK, Protein kinase superfamily) and BnaC06g25110D (ACL, Actin cross-linking protein), were identified in the region of C06_26638717, which were associated with PH and NSS. Five genes were located in the interval of A01_1783685 co-detected by PH and SYP, including KUP5 (K+ uptake permease 5), MYB69 (MYB domain protein 69), CDC20 (Cell division cycle 20), TIF3K1 (Eukaryotic translation initiation factor), and SLOMO (Slow motion). These genes were highly expressed in the stem during bolting and flowering stages.
For MINS, BnaC05g10890D (HRGP, Hydroxyproline-rich glycoprotein family protein), BnaC03g09950D (CBR2L, NADH-cytochrome b5 reductase-like protein), and BnaC03g09960D (MPC1, Mitochondrial pyruvate carrier 1) were the promising candidate genes located in C05_6251826 or C03_4731660. For C03_4731660 (MINS and MIL), the genes BnaC03g09950D (CBR2L, NADH-cytochrome b5 reductase-like protein) and BnaC03g09960D (MPC1, Mitochondrial pyruvate carrier 1) were located in the region of C03_4731660.

4. Discussion

HI was found to be one of the crucial factors for enhancing biomass and seed yield [32,33]. However, the harvest index shows a big difference among different crops and is sensitive to environmental factors. In the present study, the correlation coefficient and heritability of HI in different years are relatively low, consistent with previous reports [2,11].
Population genetic structure refers to a non-random distribution of genetic variation in a species or population. In previous studies, B. napus accessions were generally divided into three subgroups, which were mainly contributed to their ecotypes [34,35,36]. There were also reports that GWAS groups were divided into other numbers of subgroups, such as five subgroups [31]. In this study, the ADMIXTURE and STRUCTURE software were used for determining the population structure, results of which were more than three subgroups, probably because 104 inbred lines were mainly semi-winter ecotypes. Combined with the population evolution tree and PCA, the top five principal components were used for the correction of the population structure to control the false-positive results.
For a complex trait, it should take associated traits into consideration, which could provide a better understanding of complex traits for crop [13]. In this study, a total of 14 major agronomic traits were measured that involved plant architecture and economic traits. The partial correlations among HI and the other traits indicated that HI was negatively correlated with BYP and positively correlated with SYP, while some specific traits could connect to HI indirectly by interacting with other traits (Figure S2). In addition, we constructed the association networks across different traits and SNPs (Figure 4). It revealed the complex genetic connections among the agronomic traits. In breeding practice, to improve target traits, favorable alleles of other traits in recipient varieties should be maintained as possible. The network could help to establish a strategy for variety development. For instance, NSS and PH showed the highest connectivity with the most edges linked to other traits, indicating they should be vital traits. If HI is improved by NSS, this should increase SYP and avoid the BYP benefited to break the heritable covariations. Thus, C06_2259430 and A03_10522683 could be the best ones chosen. The same goes for the other traits.
Three hundred and twenty-four SNPs related to 212 SNPs were identified to be involved in the 14 traits. Since the increase of the HI of rice is due to the integration of semi-dwarf genes [6,37], breeders have been working to reduce the plant height of rapeseed to increase the HI of rapeseed. However, the PH usually shows positive correlations with the seed yield and biomass [13,33], indicating PH may be genetically linked to seed yield and biomass. We identified one stable SNPs C09_36899682 detected by PH, which was also related to BYP but had no correlation with SYP. This result provides a novel locus for dwarfing the plant to improve HI.
Plant architecture improvement plays an important role in the increase of crop yield. Several related QTLs of agronomic traits on rapeseed have been reported. Compared to previous reports [10,12,13,30,31,36,38,39,40,41,42,43,44], 49 of 212 loci shared an overlapped region for the same traits based on the reference genome of Darmor-bzh [23] (Figure 5), including PH (11 loci), TSW (9 loci), BAI (7 loci), NSP (6 loci), NSS (5 loci), SL (4 loci), BN (3 loci), MINS (2 loci), SYP (1 locus), and BYP (1 locus). It implied that the significant SNPs of our study were dependable compared with previous results. From the location of the significant SNP, some SNPs for different traits were linked in a certain segment, such as 12.4–13.9 Mb on A10 and 26.6–28.2 Mb on C06. Due to the linkage of the trait locus and the locus pleiotropism, it is challenging to decipher the genetic network of agronomic traits. There are consensus or physical close loci among previous studies and this study, such as the interval of SNPs of A01_1783865 for PH, A03_6291348 for BN, A07_10401876, and A07_11506350 for TSW. These results demonstrate the reliability of this report and provide potential loci for controlling agronomic traits. Some pleiotropic SNPs were also detected, including A01_1783685 (PH and SYP), C06_26638717 (PH and NSS), and C03_4731660 (MIL and MINS), which might be the loci playing multiple roles during plant development. Besides, 12 promising novel significant SNPs were detected that are related to BN (A05_19368584 and A05_19764389), SL (A06_23598999, A06_23608274, and C07_38735522), PH (C04_47349279, C04_47585236, and C09_36899680), MINS (C05_6251826), NSS (C06_22559430 and C06_22570315), and HI (C05_6554451).
HI is mainly related to plant height, inflorescences, flower, pod, branches, and flowers, which is also influenced by environmental conditions such as light, temperature, and nutrient status [45]. Gene functions and expressions help predict candidate genes controlling the traits. In this study, 39 candidate genes were predicted in 22 significant SNP intervals, all of which were highly expressed in relative tissues and involved in the development of cell wall, flower, xylem, and whole plant. The important candidate genes were discussed as follows.
Within the interval of C05_6554451 for HI, BnaC05g11350D codes the CRP protein, while CRPs function as regulators of cell–cell communication in plants, and participate in plant growth, pollen tube growth, and fertilization process [46,47,48].
Plant development is the process of cell division, growth and differentiation. Among these genes, CDC20, identified by A01_1783685 and A01_1565817 for PH and SYP, encodes a cell division cycle 20 protein that is indispensable for normal plant development and fertility. In this region, SLOMO coding an F-box protein is considered as a candidate gene. In Arabidopsis thaliana, the rate of inflorescence meristems organ formation of the slomo mutant is significantly reduced, indicating SLOMO regulates organ initiation at the shoot meristem [49]. KTNA1 was detected on A07_random for NSS, whose orthologs in Arabidopsis thaliana were shown to control cell plate/daughter wall formation [50]. HRGP located on C05 was identified for MINS, encoding a hydroxyproline-rich glycoprotein family protein that functions in early leaf and root vascular differentiation [51].
Floral organogenesis plays a vital role in plant height, branch number, branch angel, main inflorescence length, silique length and width, and number of seeds per silique. In this study, five genes, AG1, BNQ2, TRANS11, EBS, FTM4.1, and FTM4.2, were predicted as the requirements for floral organ growth in Arabidopsis thaliana [52,53,54,55,56]. For example, AG1 is a floral homeotic gene encoding a MADS domain transcription factor, suppression of which favors a reversion of floral meristems from determinate to indeterminate development [52]. FTM4, encoding a leucine-rich repeat protein, is induced in the early inflorescence meristem, and mutations of FTM4 delay flowering [53]. The phenotypes of bnq2 and bnq3 mutants show pale-green sepals and carpels, and purple inflorescence stems and siliques [54], and the double or high order mutants show dwarf vegetative growth and reduced fertility with unequal genetic redundancy [55]. Moreover, we identified some genes functioning in pollen germination and tube growth, including PGF10 and RPL32A. All of these genes showed high expressions in the inflorescence tips, silique pericarp, and stems (Figure 6).
Three candidate genes were related to fiber and pectin involved in SL, PH, and NSS. UBQ5 and QUA2, encoding pectin methyl esterase and pectin methyltransferase, respectively, participate in cell wall formation [57,58,59]. qua2 showed a 50% reduction in homogalacturonan content compared with the wild type [59]. CFP was predicted to encode a cotton fiber protein, but this has not been verified till now.
In addition, KUP5 was located on A01 for PH and SYP, while the uptake and transport of K+ were the key to plant growth and responses to the environment. Several genes have not been functionally annotated or their functions are still indeterminate. However, their expressions showed highly specific in certain tissues. Thus, these genes were also considered as putative candidates for HI and HI-related traits.
These B. napus lines are core breeding materials with at least one outstanding trait, from which some excellent rapeseed varieties have been cultivated. We phenotyped the traits over three-year periods and approached GWAS using six algorithms to ensure the accuracy of our GWAS results. However, the number of the GWAS population is not high enough, which might make it prone to false positive results. Hence, significant SNPs are needed to validate the repeatability, and the candidate genes need to be verified as well.

5. Conclusions

In this study, HI and 13 HI-related traits were investigated in 104 core breeding lines of rapeseed. HI showed a complex network with other traits. We performed genome-wide association analyses using the Bnapus50K array. A total of 212 significant SNPs involved in 324 QTL related to the studied traits, and 22 stable SNPs were identified. Three pleiotropic SNPs were obtained, namely A01_1783685 (PH and SYP), C06_26638717 (PH and NSS), and C03_4731660 (MIL and MINS). Twelve promising novel SNPs were detected that are related to BN (A05_19368584 and A05_19764389), SL (A06_23598999, A06_23608274, and C07_38735522), PH (C04_47349279, C04_47585236, and C09_36899680), MINS (C05_6251826), NSS (C06_22559430 and C06_22570315), and HI (C05_6554451). Meanwhile, 39 candidate genes were predicted in stable SNP intervals by their gene expressions and function annotations. The obtained significant SNPs and candidate genes facilitate the development of molecular markers and casual gene cloning. These results provide further support for the improvement of the harvest index in rapeseed.

Supplementary Materials

The following supporting information can be downloaded at https://0-www-mdpi-com.brum.beds.ac.uk/article/10.3390/agronomy12040814/s1: Figure S1: Pearson correlation among the branch angles. Figure S2: Partial correlation among the agronomic traits. Figure S3: Population structure variation and phylogeny tree in rapeseed. Figure S4: Manhattan plots and quantile-quantile plots of estimated −log10 (p-value) for the test traits using mrMLM. Figure S5: Manhattan plots and quantile-quantile plots of estimated −log10 (p-value) for the test traits using TASSEL 5.0. Figure S6: Linkage disequilibrium (LD) block analyses of the stable significant SNPs. Table S1: Phenotypic analyses of 104 rapeseed inbred lines. Table S2: Significant SNPs associated with HI and HI-related traits across four environments. Table S3: Distribution of significant SNPs to environments and chromosomes. Table S4: Candidate gene expression in the BrassicaEDB.

Author Contributions

Conceptualization, A.X.; formal analysis, M.Q., N.G. and J.S.; funding acquisition, A.X.; investigation, N.G., J.S., M.Z. and Y.Z.; project administration, Z.H. and A.X.; resources, A.X.; software, M.Q. and J.S.; supervision, Z.H. and A.X.; visualization, M.Q.; writing—original draft, M.Q.; writing—review & editing, Z.H. and A.X. All authors have read and agreed to the published version of the manuscript.

Funding

This research was jointly supported by the grants from the National Key Research and Development Program of China (2018YFD0100600) and the Key Research and Development Program Yangling Seed Industry Innovation Center (ylzy-yc2021-01).

Institutional Review Board Statement

Not applicable.

Informed Consent Statement

Not applicable.

Data Availability Statement

Not applicable.

Acknowledgments

This research benefited from grants from the Ministry of Science and Technology of China and the Yangling Seed Industry Innovation Center. We would like to thank Donghong Zhang and Jingchen Wang of Northwest A&F University who assisted the investigation during the cropping periods.

Conflicts of Interest

The authors declare no conflict of interest.

Abbreviations

BABranch angle
BAIBranch angle index
BBABasal branch angle
BLUPBest linear unbiased prediction
BNNumbers of primary valid branch
BYPBiomass yield per plant
CVCoefficient of variation
GWASGenome-wide association study
HIHarvest index
LDLinkage disequilibrium
MBAMiddle branch angle
MILMain inflorescence length
MINSNumber of effective siliques on main inflorescence
MISDSilique density of the main inflorescence
MLMMix linear model
NSPSiliques per plant
NSSNumber of seeds per silique
PCAPrincipal component analysis
PHPlant height
QQ plotQuantile-quantile plot
QTLQuantitative trait locus/loci
SLSilique length
SNPSingle nucleotide polymorphism
SWSilique width
SYPSeed yield per plant
TBATop branch angle
TSWThousand-seed weight

References

  1. Richards, R.A. Selectable traits to increase crop photosynthesis and yield of grain crops. J. Exp. Bot. 2000, 51, 447–458. [Google Scholar] [CrossRef] [PubMed]
  2. Chao, H.; Raboanatahiry, N.; Wang, X.; Zhao, W.; Chen, L.; Guo, L.; Li, B.; Hou, D.; Pu, S.; Zhang, L.; et al. Genetic dissection of harvest index and related traits through genome-wide quantitative trait locus mapping in Brassica napus L. Breed Sci. 2019, 69, 104–116. [Google Scholar] [CrossRef] [PubMed] [Green Version]
  3. Hay, R.K.M. Harvest index: A review of its use in plant breeding and crop physiology. Ann. Appl. Biol. 1995, 126, 197–216. [Google Scholar] [CrossRef]
  4. Xie, G.; Han, D.; Wang, X.; Xue, S. Harvest index and residue factor of non-cereal crops in China. J. China Agric. Univ. 2011, 16, 9–17. [Google Scholar]
  5. Xie, G.; Han, D.; Wang, X.; Lv, R. Harvest index and residue factor of cereal crops in China. J. China Agric. Univ. 2011, 16, 1–8. [Google Scholar]
  6. Evenson, R.E.; Gollin, D. Assessing the impact of the green revolution, 1960 to 2000. Science 2003, 300, 758–762. [Google Scholar] [CrossRef] [Green Version]
  7. Lu, K.; Shen, G.-Z.; Liang, Y.; Fu, M.-L.; He, B.; Tie, L.-M.; Zhang, Y.; Peng, L.; Li, J.-N. Analysis of Yield Components with High Harvest Index in Brassica napus under Environments Fitting Different Yield Levels. Acta Agron. Sin. 2017, 43, 82–96. [Google Scholar] [CrossRef]
  8. Pal, L.; Sandhu, S.K.; Bhatia, D.; Sethi, S. Genome-wide association study for candidate genes controlling seed yield and its components in rapeseed (Brassica napus subsp. napus). Physiol. Mol. Biol. Plants 2021, 27, 1933–1951. [Google Scholar] [CrossRef]
  9. Hu, D.; Jing, J.; Snowdon, R.J.; Mason, A.S.; Shen, J.; Meng, J.; Zou, J. Exploring the gene pool of Brassica napus by genomics-based approaches. Plant Biotechnol. J. 2021, 19, 1693–1712. [Google Scholar] [CrossRef]
  10. Sun, C.; Wang, B.; Wang, X.; Hu, K.; Li, K.; Li, Z.; Li, S.; Yan, L.; Guan, C.; Zhang, J.; et al. Genome-Wide Association Study Dissecting the Genetic Architecture Underlying the Branch Angle Trait in Rapeseed (Brassica napus L.). Sci. Rep. 2016, 6, 33673. [Google Scholar] [CrossRef] [Green Version]
  11. Luo, X.; Ma, C.; Yue, Y.; Hu, K.; Li, Y.; Duan, Z.; Wu, M.; Tu, J.; Shen, J.; Yi, B.; et al. Unravelling the complex trait of harvest index in rapeseed (Brassica napus L.) with association mapping. BMC Genom. 2015, 16, 379. [Google Scholar] [CrossRef] [PubMed] [Green Version]
  12. Lu, K.; Xiao, Z.; Jian, H.; Peng, L.; Qu, C.; Fu, M.; He, B.; Tie, L.; Liang, Y.; Xu, X.; et al. A combination of genome-wide association and transcriptome analysis reveals candidate genes controlling harvest index-related traits in Brassica napus. Sci. Rep. 2016, 6, 36452. [Google Scholar] [CrossRef] [PubMed] [Green Version]
  13. Luo, Z.; Wang, M.; Long, Y.; Huang, Y.; Shi, L.; Zhang, C.; Liu, X.; Fitt, B.D.L.; Xiang, J.; Mason, A.S.; et al. Incorporating pleiotropic quantitative trait loci in dissection of complex traits: Seed yield in rapeseed as an example. Theor. Appl. Genet. 2017, 130, 1569–1585. [Google Scholar] [CrossRef] [PubMed] [Green Version]
  14. Xiao, Q.; Wang, H.; Song, N.; Yu, Z.; Imran, K.; Xie, W.; Qiu, S.; Zhou, F.; Wen, J.; Dai, C.; et al. The Bnapus50K array: A quick and versatile genotyping tool for Brassica napus genomic breeding and research. G3 2021, 11, jkab241. [Google Scholar] [CrossRef]
  15. Browning, B.L.; Browning, S. Genotype Imputation with Millions of Reference Samples. Am. J. Hum. Genet. 2016, 98, 116–126. [Google Scholar] [CrossRef] [Green Version]
  16. Bradbury, P.J.; Zhang, Z.; Kroon, D.E.; Casstevens, T.M.; Ramdoss, Y.; Buckler, E.S. TASSEL: Software for association mapping of complex traits in diverse samples. Bioinformatics 2007, 23, 2633–2635. [Google Scholar] [CrossRef]
  17. Chang, C.C.; Chow, C.C.; Tellier, L.C.; Vattikuti, S.; Purcell, S.M.; Lee, J.J. Second-generation PLINK: Rising to the challenge of larger and richer datasets. GigaScience 2015, 4, 7. [Google Scholar] [CrossRef]
  18. Alexander, D.H.; Novembre, J.; Lange, K. Fast model-based estimation of ancestry in unrelated individuals. Genome Res. 2009, 19, 1655–1664. [Google Scholar] [CrossRef] [Green Version]
  19. Falush, D.; Stephens, M.; Pritchard, J.K. Inference of population structure using multilocus genotype data: Linked loci and correlated allele frequencies. Genetics 2003, 164, 1567–1587. [Google Scholar] [CrossRef]
  20. Zhang, Y.-W.; Tamba, C.L.; Wen, Y.-J.; Li, P.; Ren, W.-L.; Ni, Y.-L.; Gao, J.; Zhang, Y.-M. mrMLM v4.0.2: An R Platform for Multi-locus Genome-wide Association Studies. Genom. Proteom. Bioinform. 2020, 18, 481–487. [Google Scholar] [CrossRef]
  21. Shannon, P.; Markiel, A.; Ozier, O.; Baliga, N.S.; Wang, J.T.; Ramage, D.; Amin, N.; Schwikowski, B.; Ideker, T. Cytoscape: A software environment for integrated models of Biomolecular Interaction Networks. Genome Res. 2003, 13, 2498–2504. [Google Scholar] [CrossRef] [PubMed]
  22. Dong, S.S.; He, W.M.; Ji, J.J.; Zhang, C.; Guo, Y.; Yang, T.L. LDBlockShow: A fast and convenient tool for visualizing linkage disequilibrium and haplotype blocks based on variant call format files. Brief Bioinform. 2021, 22, bbaa227. [Google Scholar] [CrossRef] [PubMed]
  23. Chalhoub, B.; Denoeud, F.; Liu, S.; Parkin, I.A.; Tang, H.; Wang, X.; Chiquet, J.; Belcram, H.; Tong, C.; Samans, B.; et al. Early allopolyploid evolution in the post-Neolithic Brassica napus oilseed genome. Science 2014, 345, 950–953. [Google Scholar] [CrossRef] [Green Version]
  24. Zhou, Q.; Han, D.; Mason, A.S.; Zhou, C.; Zheng, W.; Li, Y.; Wu, C.; Fu, D.; Huang, Y. Earliness traits in rapeseed (Brassica napus): SNP loci and candidate genes identified by genome-wide association analysis. DNA Res. 2018, 25, 229–244. [Google Scholar] [CrossRef] [PubMed] [Green Version]
  25. Khanzada, H.; Wassan, G.M.; He, H.; Mason, A.S.; Keerio, A.A.; Khanzada, S.; Faheem, M.; Solangi, A.M.; Zhou, Q.; Fu, D.; et al. Differentially evolved drought stress indices determine the genetic variation of Brassica napus at seedling traits by genome-wide association mapping. J. Adv. Res. 2020, 24, 447–461. [Google Scholar] [CrossRef] [PubMed]
  26. Chao, H.; Li, T.; Luo, C.; Huang, H.; Ruan, Y.; Li, X.; Niu, Y.; Fan, Y.; Sun, W.; Zhang, K.; et al. BrassicaEDB: A Gene Expression Database for Brassica Crops. Int. J. Mol. Sci. 2020, 21, 5831. [Google Scholar] [CrossRef]
  27. Chen, C.; Chen, H.; Zhang, Y.; Thomas, H.R.; Frank, M.H.; He, Y.; Xia, R. TBtools: An Integrative Toolkit Developed for Interactive Analyses of Big Biological Data. Mol. Plant 2020, 13, 1194–1202. [Google Scholar] [CrossRef]
  28. Wang, J. Partial correlation coefficient. In Encyclopedia of Systems Biology; Dubitzky, W., Wolkenhauer, O., Cho, K.-H., Yokota, H., Eds.; Springer: New York, NY, USA, 2013; pp. 1634–1635. [Google Scholar]
  29. Knapp, S.J. Confidence intervals for heritability for two-factor mating design single environment linear models. Theor. Appl. Genet. 1986, 72, 587–591. [Google Scholar] [CrossRef]
  30. Raboanatahiry, N.; Chao, H.; Dalin, H.; Pu, S.; Yan, W.; Yu, L.; Wang, B.; Li, M. QTL Alignment for Seed Yield and Yield Related Traits in Brassica napus. Front. Plant Sci. 2018, 9, 1127. [Google Scholar] [CrossRef] [Green Version]
  31. Liu, H.; Wang, J.; Zhang, B.; Yang, X.; Hammond, J.P.; Ding, G.; Wang, S.; Cai, H.; Wang, C.; Xu, F.; et al. Genome-wide association study dissects the genetic control of plant height and branch number in response to low-phosphorus stress in Brassica napus. Ann. Bot. 2021, 128, 919–930. [Google Scholar] [CrossRef]
  32. Liu, W.; Hou, P.; Liu, G.; Yang, Y.; Guo, X.; Ming, B.; Xie, R.; Wang, K.; Liu, Y.; Li, S. Contribution of total dry matter and harvest index to maize grain yield—A multisource data analysis. Food Energy Secur. 2020, 9, e256. [Google Scholar] [CrossRef]
  33. Biabani, A.; Foroughi, A.; Karizaki, A.R.; Rassam, G.A.; Hashemi, M.; Afshar, R.K. Physiological traits, yield, and yield components relationship in winter and spring canola. J. Sci. Food Agric. 2021, 101, 3518–3528. [Google Scholar] [CrossRef] [PubMed]
  34. Wu, D.; Liang, Z.; Yan, T.; Xu, Y.; Xuan, L.; Tang, J.; Zhou, G.; Lohwasser, U.; Hua, S.; Wang, H.; et al. Whole-Genome Resequencing of a Worldwide Collection of Rapeseed Accessions Reveals the Genetic Basis of Ecotype Divergence. Mol. Plant 2019, 12, 30–43. [Google Scholar] [CrossRef] [PubMed] [Green Version]
  35. Lu, K.; Wei, L.; Li, X.; Wang, Y.; Wu, J.; Liu, M.; Zhang, C.; Chen, Z.; Xiao, Z.; Jian, H.; et al. Whole-genome resequencing reveals Brassica napus origin and genetic loci involved in its improvement. Nat. Commun. 2019, 10, 1154. [Google Scholar] [CrossRef] [PubMed] [Green Version]
  36. Dong, H.; Tan, C.; Li, Y.; He, Y.; Wei, S.; Cui, Y.; Chen, Y.; Wei, D.; Fu, Y.; He, Y.; et al. Genome-Wide Association Study Reveals Both Overlapping and Independent Genetic Loci to Control Seed Weight and Silique Length in Brassica napus. Front. Plant Sci. 2018, 9, 921. [Google Scholar] [CrossRef]
  37. Zhang, Q. Strategies for developing Green Super Rice. Proc. Natl. Acad. Sci. USA 2007, 104, 16402–16409. [Google Scholar] [CrossRef] [Green Version]
  38. Körber, N.; Bus, A.; Li, J.; Parkin, I.A.P.; Wittkop, B.; Snowdon, R.J.; Stich, B. Agronomic and Seed Quality Traits Dissected by Genome-Wide Association Mapping in Brassica napus. Front. Plant Sci. 2016, 7, 386. [Google Scholar] [CrossRef]
  39. Sun, C.; Wang, B.; Yan, L.; Hu, K.; Liu, S.; Zhou, Y.; Guan, C.; Zhang, Z.; Li, J.; Zhang, J.; et al. Genome-Wide Association Study Provides Insight into the Genetic Control of Plant Height in Rapeseed (Brassica napus L.). Front. Plant Sci. 2016, 7, 1102. [Google Scholar] [CrossRef] [Green Version]
  40. Yang, Y.; Shen, Y.; Li, S.; Ge, X.; Li, Z. High Density Linkage Map Construction and QTL Detection for Three Silique-Related Traits in Orychophragmus violaceus Derived Brassica napus Population. Front. Plant Sci. 2017, 8, 1512. [Google Scholar] [CrossRef] [Green Version]
  41. Ye, J.; Yang, Y.; Chen, B.; Shi, J.; Luo, M.; Zhan, J.; Wang, X.; Liu, G.; Wang, H. An integrated analysis of QTL mapping and RNA sequencing provides further insights and promising candidates for pod number variation in rapeseed (Brassica napus L.). BMC Genom. 2017, 18, 71. [Google Scholar] [CrossRef] [Green Version]
  42. Shen, Y.; Xiang, Y.; Xu, E.; Ge, X.; Li, Z. Major Co-localized QTL for Plant Height, Branch Initiation Height, Stem Diameter, and Flowering Time in an Alien Introgression Derived Brassica napus DH Population. Front. Plant Sci. 2018, 9, 390. [Google Scholar] [CrossRef] [PubMed] [Green Version]
  43. Shen, Y.; Xu, E.; Xiang, Y.; Li, Z.; Yang, Y.; Ge, X. Novel and major QTL for branch angle detected by using DH population from an exotic introgression in rapeseed (Brassica napus L.). Theor. Appl. Genet. 2017, 131, 67–78. [Google Scholar] [CrossRef] [PubMed]
  44. Wang, H.; Yan, M.; Xiong, M.; Wang, P.; Liu, Y.; Xin, Q.; Wan, L.; Yang, G.; Hong, D. Genetic dissection of thousand-seed weight and fine mapping of cqSW.A03-2 via linkage and association analysis in rapeseed (Brassica napus L.). Theor. Appl. Genet. 2020, 133, 1321–1335. [Google Scholar] [CrossRef]
  45. Basu, U.; Parida, S.K. Restructuring plant types for developing tailor-made crops. Plant Biotechnol. J. 2021, in press. [Google Scholar] [CrossRef] [PubMed]
  46. Okuda, S.; Tsutsui, H.; Shiina, K.; Sprunck, S.; Takeuchi, H.; Yui, R.; Kasahara, R.D.; Hamamura, Y.; Mizukami, A.; Susaki, D.; et al. Defensin-like polypeptide LUREs are pollen tube attractants secreted from synergid cells. Nature 2009, 458, 357–361. [Google Scholar] [CrossRef]
  47. Marshall, E.; Costa, L.M.; Gutierrez-Marcos, J. Cysteine-rich peptides (CRPs) mediate diverse aspects of cell-cell communication in plant reproduction and development. J. Exp. Bot. 2011, 62, 1677–1686. [Google Scholar] [CrossRef] [Green Version]
  48. Aalen, R.B. Maturing peptides open for communication. J. Exp. Bot. 2013, 64, 5231–5235. [Google Scholar] [CrossRef] [Green Version]
  49. Lohmann, D.; Stacey, N.; Breuninger, H.; Jikumaru, Y.; Muller, D.; Sicard, A.; Leyser, O.; Yamaguchi, S.; Lenhard, M. Slow Motion is required for within-plant auxin homeostasis and normal timing of lateral organ initiation at the shoot meristem in Arabidopsis. Plant Cell 2010, 22, 335–348. [Google Scholar] [CrossRef] [Green Version]
  50. Panteris, E.; Kouskouveli, A.; Pappas, D.; Adamakis, I.-D. Cytokinesis in fra2 Arabidopsis thaliana p60-katanin Mutant: Defects in Cell Plate/Daughter Wall Formation. Int. J. Mol. Sci. 2021, 22, 1405. [Google Scholar] [CrossRef]
  51. Stiefel, V.; Ruiz-Avila, L.; Raz, R.; Pilar Valles, M.; Gomez, J.; Pages, M.; Martinez-Izquierdo, J.A.; Ludevid, M.D.; Langdale, J.A.; Nelson, T.; et al. Expression of a maize cell wall hydroxyproline-rich glycoprotein gene in early leaf and root vascular differentiation. Plant Cell 1990, 2, 785–793. [Google Scholar]
  52. Wang, Q.; Sajja, U.; Rosloski, S.; Humphrey, T.; Kim, M.C.; Bomblies, K.; Weigel, D.; Grbic, V. HUA2 Caused Natural Variation in Shoot Morphology of A. thaliana. Curr. Biol. 2007, 17, 1513–1519. [Google Scholar] [CrossRef] [PubMed] [Green Version]
  53. Torti, S.; Fornara, F.; Vincent, C.; Andres, F.; Nordstrom, K.; Gobel, U.; Knoll, D.; Schoof, H.; Coupland, G. Analysis of the Arabidopsis shoot meristem transcriptome during floral transition identifies distinct regulatory patterns and a leucine-rich repeat protein that promotes flowering. Plant Cell 2012, 24, 444–462. [Google Scholar] [CrossRef] [PubMed] [Green Version]
  54. Mara, C.D.; Huang, T.; Irish, V.F. The Arabidopsis floral homeotic proteins APETALA3 and PISTILLATA negatively regulate the BANQUO genes implicated in light signaling. Plant Cell 2010, 22, 690–702. [Google Scholar] [CrossRef] [PubMed] [Green Version]
  55. Shin, K.; Lee, I.; Kim, E.; Park, S.K.; Soh, M.-S.; Lee, S. Paclobutrazol-resistance Gene Family Regulates Floral Organ Growth with Unequal Genetic Redundancy in Arabidopsis thaliana. Int. J. Mol. Sci. 2019, 20, 869. [Google Scholar] [CrossRef] [PubMed] [Green Version]
  56. Yang, Z.; Qian, S.; Scheid, R.N.; Lu, L.; Chen, X.; Liu, R.; Du, X.; Lv, X.; Boersma, M.D.; Scalf, M.; et al. EBS is a bivalent histone reader that regulates floral phase transition in Arabidopsis. Nat. Genet. 2018, 50, 1247–1253. [Google Scholar] [CrossRef]
  57. Lionetti, V.; Fabri, E.; De Caroli, M.; Hansen, A.R.; Willats, W.G.; Piro, G.; Bellincampi, D. Three Pectin Methylesterase Inhibitors Protect Cell Wall Integrity for Arabidopsis Immunity to Botrytis. Plant Physiol 2017, 173, 1844–1863. [Google Scholar] [CrossRef] [Green Version]
  58. Ishikawa, M.; Kuroyama, H.; Takeuchi, Y.; Tsumuraya, Y. Characterization of pectin ethyltransferase from soybean hypocotyls. Planta 2000, 210, 782–791. [Google Scholar] [CrossRef]
  59. Mouille, G.; Ralet, M.C.; Cavelier, C.; Eland, C.; Effroy, D.; Hematy, K.; McCartney, L.; Truong, H.N.; Gaudon, V.; Thibault, J.F.; et al. Homogalacturonan synthesis in Arabidopsis thaliana requires a Golgi-localized protein with a putative methyltransferase domain. Plant J. 2007, 50, 605–614. [Google Scholar] [CrossRef]
Figure 1. Phenotypic analysis for HI and HI-related traits. Upper parts of (AN) are statistical analyses of the respective test traits. The violin plots display the distribution patterns of phenotypic values. The width of the violin plot represents the density of the distribution. The black horizontal line in the box plot shows the median value, and the upper and lower boxes in the box represent the upper and lower quartiles of the data set. Statistical significance is determined by the Wilcoxon test. *, **, ***, and **** represent significant at 0.05, 0.01, 0.001, and 0.0001, and ns is short for no significance. Lower parts of (AN) show the relationships among the respective environments. The redder the color, the stronger the correlation. BN, numbers of primary valid branch; BAI, branch angle index; BYP, biomass yield per plant; HI, harvest index; MIL, main inflorescence length; MINS, number of effective siliques on main inflorescence; MISD, silique density of the main inflorescence; NSP, number of siliques per plant; NSS, number of seeds per silique; PH, plant height; SL, silique length; SW, silique width; SYP, seed yield per plant; TSW, thousand-seed weight.
Agronomy 12 00814 g001
Figure 2. Distribution of SNPs identified in different environments and algorithms. (A) Veen of significant SNPs detected by different algorithms. Here, the SNPs detected for a certain trait (without distinguishing the environments) by different algorithms are regarded as one SNP. Upper right displays distribution of SNPs identified by different algorithms. (B) Veen of significant SNPs detected by different environments. The SNPs detected for a certain trait in different environments (without distinguishing the algorithms) are regarded as one SNP. Upper right displays distribution of SNPs identified in different environments.
Agronomy 12 00814 g002
Figure 3. Trait distribution for the alleles of significant SNPs. (A) BYP, PH, and SYP distribution for the significant SNPs detected by PH. The horizontal line in the box plot shows the median value, and the upper and lower boxes represent the upper and lower quartiles of the data set. Statistical significance is determined by the Wilcoxon test. (BI) show distributions for the alleles of stable significant SNPs detected by NSS, TSW, HI, BAI, BN, BYP, MINS, and SL, respectively.
Agronomy 12 00814 g003
Figure 4. Comparison of related SNPs/QTL localization on the chromosome between current and previous reports. The related SNPs/QTL of previous studies are colored blue, and the rest loci are detected in this study. For the loci in this study, the physical positions of stable significant SNPs are colored green and the SNP is labeled in red if it is adjacent to the reported QTL/SNPs.
Agronomy 12 00814 g004
Figure 5. Phenotype-SNP network for 14 traits in rapeseed. Traits are solid triangles and SNPs are solid circles. Different traits are displayed in different colors. The links represent the significant correlations among them and the colors that vary from blue to red represent the partial correlation coefficients. SNPs associated to more than one trait or environment or adjacent to other significant SNPs are in pink. SNPs with a physical distance of fewer than 200 KB are connected by dotted lines.
Agronomy 12 00814 g005
Figure 6. Heatmap of candidate gene expressions among different tissues. Each row indicates a tissue, and different colors represent different development stages and traits. More detailed information displayed in Table S4.
Agronomy 12 00814 g006
Table 1. Summary of candidate genes predicted for agronomic traits.
Gene IdSNPTraitTrait & SNPGene NameProtein Name
BnaA01g03380DA01_1783685PH; SYPPH-SYP.A01_1783685KUP5K+ uptake permease 5
BnaA01g03490DA01_1783685PH; SYPPH-SYP.A01_1783685MYB69MYB domain protein 69
BnaA01g03590DA01_1783685PH; SYPPH-SYP.A01_1783685CDC20Cell division cycle 20
BnaA01g03600DA01_1783685PH; SYPPH-SYP.A01_1783685TIF3K1Eukaryotic translation initiation factor
BnaA01g03630DA01_1783685PH; SYPPH-SYP.A01_1783685SLOMOSlow motion
BnaA02g35610DA02_random_355708PHPH.A02_random_355708BCPBlue copper protein
BnaA02g35620DA02_random_355708PHPH.A02_random_355708ATL54RING-H2 finger protein ATL54
BnaA03g43740DA03_22103527TSWTSW.A03_22103527TRANS11Translocase 11
BnaA03g43820DA03_22103527TSWTSW.A03_22103527AG1Floral homeotic protein AGAMOUS
BnaA03g43840DA03_22103527TSWTSW.A03_22103527MYA1MYOSIN 1
BnaA03g49330DA03_25488780PHPH.A03_25488780CFPCotton fiber protein
BnaA05g26410DA05_19368584; A05_19764389BNBN.A05_19368584; BN.A05_19764389DCN1LDefective in cullin neddylation protein
BnaA05g26840DA05_19368584; A05_19764389BNBN.A05_19368584; BN.A05_19764389FTM4.1Leucine-rich repeat protein
BnaA05g26860DA05_19368584; A05_19764389BNBN.A05_19368584; BN.A05_19764389FTM4.2Leucine-rich repeat protein
BnaA06g35950DA06_23598999; A06_23608274SLSL.A06_23598999; SL.A06_23608274MSCTMan1-Src1p-carboxy-terminal domain protein
BnaA06g35970DA06_23598999; A06_23608274SLSL.A06_23598999; SL.A06_23608274RPL32A60S ribosomal protein L32-1
BnaA07g38220DA07_random_1623623NSSNSS.A07_random_1623623ABHalpha/beta-Hydrolases superfamily protein
BnaA07g38350DA07_random_1623623NSSNSS.A07_random_1623623PPR596Pentatricopeptide repeat 596
BnaA07g38370DA07_random_1623623NSSNSS.A07_random_1623623KTNA1Katanin p60 ATPase-containing subunit A1
BnaA09g39690DA09_28188769SLSL.A09_28188769PGF10Polygalaturonase clade F 10
BnaA09g39760DA09_28188769SLSL.A09_28188769UBQ5Ubiquitin 5
BnaA10g18690DA10_13564961; A10_13678989BAIBAI.A10_13564961; BAI.A10_13678989BnaA10g18690DHypothetical protein
BnaA10g18940DA10_13564961; A10_13678989BAIBAI.A10_13564961; BAI.A10_13678989BNQ2Banquo 2
BnaC03g09950DC03_4731660MIL; MINSMIL-MINS.C03_4731660CBR2LNADH-cytochrome b5 reductase-like protein
BnaC03g09960DC03_4731660MIL; MINSMIL-MINS.C03_4731660MPC1Mitochondrial pyruvate carrier 1
BnaC04g49260DC04_47349279; C04_47585236PHPH.C04_47349279; PH.C04_47585236JAL24.1Jacalin-related lectin 24
BnaC04g49270DC04_47349279; C04_47585236PHPH.C04_47349279; PH.C04_47585236JAL24.2Jacalin-related lectin 24
BnaC05g10890DC05_6251826MINSMINS.C05_6251826HRGPHydroxyproline-rich glycoprotein family protein
BnaC05g11300DC05_6554451HIHI.C05_6554451SCP50.1Serine carboxypeptidase-like 50
BnaC05g11310DC05_6554451HIHI.C05_6554451SCP50.2Serine carboxypeptidase-like 50
BnaC05g11350DC05_6554451HIHI.C05_6554451CRPCysteine-rich peptide family protein
BnaC06g20430DC06_22559430; C06_22570315NSSNSS.C06_22559430; NSS.C06_22570315GSTU20Glutathione S-transferase U20
BnaC06g20510DC06_22559430; C06_22570315NSSNSS.C06_22559430; NSS.C06_22570315QUA2Pectin methyltransferase QUA2
BnaC06g25100DC06_26638717PH; NSSPH-NSS.C06_26638717PKProtein kinase superfamily protein
BnaC06g25110DC06_26638717PH; NSSPH-NSS.C06_26638717ACLActin cross-linking protein
BnaC07g36830DC07_38735522SLSL.C07_38735522PPR334Pentatricopeptide repeat 334
BnaC07g36960DC07_38735522SLSL.C07_38735522BnaC07g36960DHypothetical protein
BnaC07g37120DC07_38735522SLSL.C07_38735522EBSEarly Bolting in Short Days
BnaC09g33520DC09_36899682PHPH.C09_36899682RTN21Reticulon protein 21
Publisher’s Note: MDPI stays neutral with regard to jurisdictional claims in published maps and institutional affiliations.

