Article

No Effect of Biostimulants on the Growth, Yield and Nutritional Value of Shallots Grown for Bunch Harvest

by
Anna Francke
1,*,
Joanna Majkowska-Gadomska
1,
Zdzisław Kaliniewicz
2 and
Krzysztof Jadwisieńczak
2
1
Department of Agroecosystems and Horticulture, University of Warmia and Mazury in Olsztyn, 10-957 Olsztyn, Poland
2
Department of Heavy Duty Machines and Research Methodology, University of Warmia and Mazury in Olsztyn, 10-957 Olsztyn, Poland
*
Author to whom correspondence should be addressed.
Submission received: 30 March 2022 / Revised: 9 May 2022 / Accepted: 10 May 2022 / Published: 10 May 2022
(This article belongs to the Special Issue Enhanced Product Quality of Plant Material from Field Crops)

Abstract

:
Shallots (Allium cepa L. Aggregatum group) are cultivated on small areas, mostly to harvest mature bulbs with dry scales. Due to their exceptional taste and nutritional value, and a short growing season, they can also be grown for early bunch harvest. New shallot cultivation strategies are being sought to meet consumers’ growing expectations regarding the quality of vegetables, and their increasing awareness of global food safety. Therefore, the aim of this study was to evaluate the effect of selected biostimulants on the biometric parameters, yield and nutritional value of shallot bulbs and leaves. The experimental factors were as follows: two biostimulant types—Effective Microorganisms (EM) and Goëmar Goteo (GG), two shallot cultivars—Bonilla F1 and Matador F1, grown for bunch harvest, and year of the study. Shallot leaves had a higher content of L-ascorbic acid, reducing sugars and nitrates than bulbs. Young bulbs had a higher content of DM and total sugars than leaves. The leaves and bulbs of shallot plants treated with EM accumulated the highest amounts of minerals. Macronutrient ratios were closer to optimal in shallot leaves than bulbs. The nitrate content of bulbs was inversely proportional to the nitrate content of leaves. Therefore, an increase in the nitrate content of leaves by around 330% led to an approximately 40% decrease in the nitrate content of bulbs. The correlations between the parameters of the chemical composition of shallots and shallot leaves show that the increase in the dry matter content of the bulbs (by approx. 60%) was accompanied by an increase in the L-ascorbic acid content in the leaves (by approx. 240%). The use of biostimulants in the cultivation of A. cepa L. Aggregatum group contributed to the reduction of L-ascorbic acid content in bulbs and had no positive effect on the leaves. Moreover, no positive effect of biostimulants on the reduction of nitrate content in shallot leaves and bulbs was observed, which is undesirable from the consumer’s point of view. After the use of biopreparations, the yield of shallots was lower than that of the control—by approx. 14% (EM) and approx. 4% (GG). Therefore, the measurable benefits of biostimulants in the cultivation of shallots grown for early bunch harvest do not balance the costs of their purchase and use.

1. Introduction

Bulb vegetables are extensively cultivated for culinary uses, including as spices, and pharmaceutical applications. The genus Allium comprises more than 750 species, both perennial and biannual. One of them is the shallot (Allium cepa L. Aggregatum group) whose bulbs are smaller than those of common onion (Allium cepa L.). Shallots are formed in clusters of several or more than ten offsets [1,2]. In comparison with common onions, which are the second (after tomatoes) most widely cultivated vegetables worldwide, the economic importance of shallots is low [3]. They are usually grown in home gardens in Europe, America and Asia. Mature bulbs with dry scales or (less frequently) young plants with small bulbs and leaves are harvested. The latter harvesting strategy should be popularized due to the exceptional taste of young shallots, easy propagation and a short growing season. Young shallots can be harvested when the leaves are still green and the bulbs have not fully developed, i.e., 30 to 40 days after planting (DAP) [4,5,6,7]. Allium vegetables are rich in antioxidants, mainly quercetin, glycosides and flavonoids [8].
Consumers’ expectations regarding the quality of vegetables, and their awareness of global food safety have been increasing steadily. Improved quality of vegetables should be accompanied by maximizing yields per unit area while minimizing adverse environmental impacts. Therefore, environmentally friendly and economically viable products should be applied in vegetable cultivation [9,10,11]. In the era of global climate change, modern crop production must involve the use of not only fungicides, herbicides and insecticides but also products known as plant growth regulators and biostimulants. Research has shown that biostimulants exert a beneficial influence on crop yields, and improve plant resistance to diseases and pests. They also affect metabolic and enzymatic processes in plants, thus increasing their yields and quality [12,13]. According to Du Jardin [14], a plant biostimulant is any substance or microorganism applied to plants, seeds or in the rhizosphere with the aim to stimulate natural processes in plants, enhance nutrition efficiency and/or abiotic stress tolerance, regardless of its nutrient content, or a mixture of such substances and/or microorganisms. Biostimulants contain biologically active substances such as protein hydrolyzates, amino acids, marine algal extracts, fulvic acids, humic acids, nitrogen (N) compounds, beneficial microorganisms (bacteria and fungi), chitosan and, less frequently, microbial extracts, biochar and concentrated enzymes [14,15,16].
The macroalgae differ from other organic-based products in their high abundance of specific carbohydrates, namely alginate, fucoidan, and laminarin, which are abundant in brown algae, carrageen in red algae, and ulvan derived from green algae [17]. The positive effects of applying seaweed extract components to crops are largely related to stress relief since they are known to have antioxidant effects, which can reduce cell damage from reactive oxygen species that occur during times of abiotic or biotic stress. In addition to the carbohydrates, seaweed extracts contain plant hormones, brassinosteroids, polyamines, and betaines [18]. It is the complex combination of these compounds that induce beneficial plant responses such as improved plant growth, tolerance to abiotic and biotic stresses, and enhanced crop quality through greater nutrient uptake.
Effective Microorganism (EM) technology uses naturally occurring microorganisms that are able to cleanse and enliven nature. Microorganisms contribute significantly to the improvement of soil structure. The mucous substances they produce adhere to the caries and mineral particles, creating a lumpy structure [19]. Microorganisms also produce bioactive material useful to plants, such as hormones and growth promoters, which trigger cell division. Effective microorganisms (EM) are increasingly applied often to stimulate nutrient cycling and plant growth. They are not nutrients, and they can only help plants to take in nutrients and stimulate their resistance to stress factors [20]. EMs also affect soil physical and chemical properties and its biological activity. There are other positive results of their application such as improvement of soil structure and fertility, elimination of putrefactive processes, acceleration of organic compound mineralization and improvement of the availability of such nutrients as N and P [21].
Biostimulants have attracted growing interest because they stimulate physiological and biochemical processes in plants, modify the proportions of photosynthetic pigments in leaves (carotenoids and chlorophyll), increase the antioxidant potential, increase root mass, improve nutrient utilization efficiency and contribute to reducing fertilizer use [22]. The research hypothesis postulates that the tested biostimulants can have a positive influence on the morphology and yield of shallots grown for bunch harvest, and contribute to an increase in the content of selected organic and mineral compounds in bulbs and leaves.
Therefore, the aim of this study was to determine the effect of two types of biostimulants on the biometric parameters, yield and nutritional value of the leaves and bulbs of shallots grown for early bunch harvest.

2. Materials and Methods

2.1. Plant Materials and Growing Conditions

The study was conducted in 2015–2016 in the Experimental Garden of the Faculty of Agriculture and Forestry, University of Warmia and Mazury in Olsztyn (53°45′ N, 20°29′ E; 125 m a.s.l.). A three-factorial experiment had a randomized block design with three replications. The experimental factors were as follows:
(I) two biostimulant types:
-
Effective Microorganisms (EM Ogród; Greenland Technologia EM Ltd., Trzcianki, Poland): the tested EM biostimulant is certified and recognized as safe for the environment (EM Ogród certificate no. PZH/HT-2713/2012). The biostimulant based on EM contains approximately 80 species of beneficial microorganisms representing five different groups: photosynthetic bacteria (Rhodopseudomonas palustris, Rhodobacter sphaeroides), lactic acid bacteria (Lactobacillus plantarum, Lactobacillus casei, Streptococcus lactis), yeasts (Saccharomyces cerevisiae, Candida utilis), actinobacteria (Streptomyces albus, Streptomyces griseus) and molds (Aspergillus oryzae, Penicillium spp., Mucor hiemalis). This biopreparation is produced by natural fermentation and is not chemically synthesized; it is GMO-free. The exact composition of this microbiological product is unknown as it is protected by copyright.
-
Goëmar Goteo (GG; Arysta LifeScience Poland Ltd., Warsaw, Poland): biostimulant contains biologically active filtrate from the seaweed Ascophyllum nodosum (source of auxins, cytokinins, vitamins, macro- and microelement supporting various metabolic process and eliciting root-growth-promoting activity) with the addition of phosphorus (13% P2O5), and potassium (5% K2O).
(II) two shallot cultivars grown for bunch harvest (Figure 1):
-
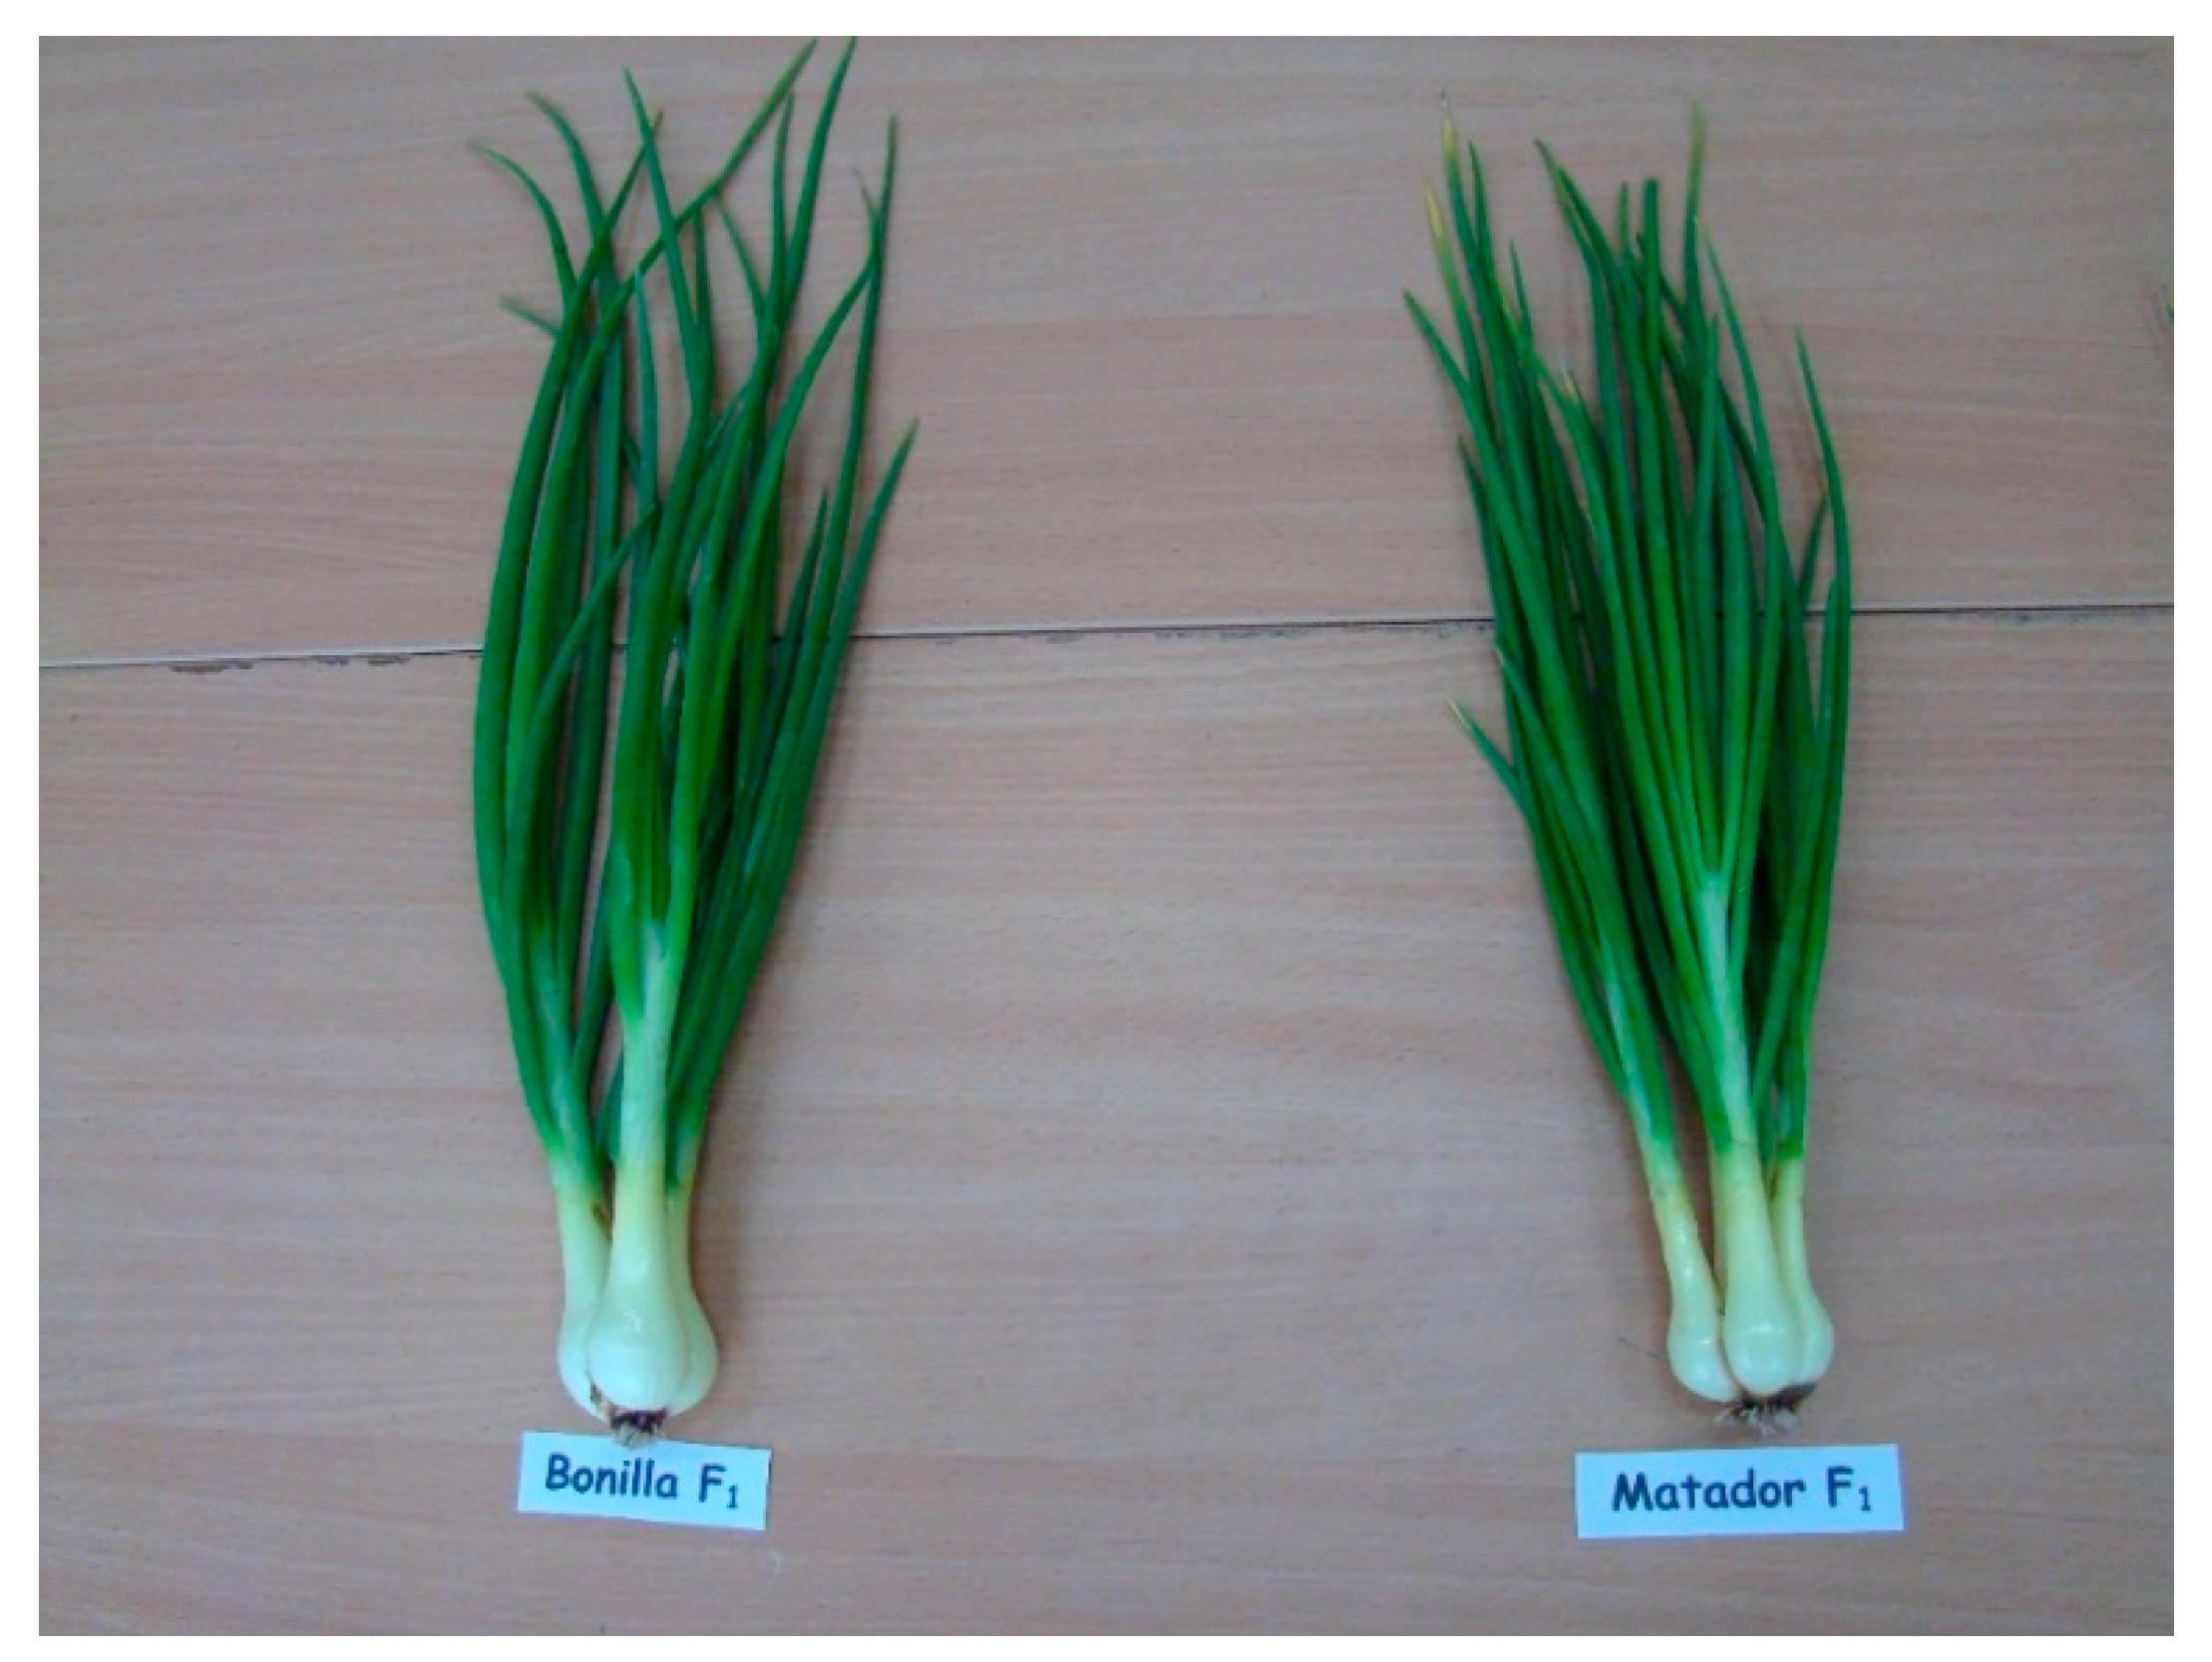
Bonilla F1 (Bejo Zaden Poland, Konotopa, Poland): a variety with a mild taste, very fertile, medium late, with yellow, well-adhering scales and a high dry matter content. It matures 85–90 days after sowing. Useful for very long storage.
-
Matador F1 (Bejo Zaden Poland): medium early variety, very fertile, with a pungent flavor. Large, spherical bulbs, 4–5 cm in diameter. Strong, red-brown scales. High dry matter content. Resistant to knocking out in inflorescence shoots. The vegetation period from sowing is 115 days. Very good suitability for long storage.
(III) year of the study.
The effects of the above factors on the growth, yield and nutritional value of shallots were determined. The biostimulants were applied in accordance with the manufacturers’ recommendations as 1% solution of EM and 0.1% solution of GG for plant watering. In the control treatment, where biostimulants were not applied, plants were only watered. Shallot plants were grown in loamy sand classified as Haplic Cambisol (Eutric) according to WRB [23].
Before the experiment had been established, chemical analyses of soil were performed by standard methods. N-NO3 content was determined by the colorimetric method with the use of phenol disulfonic acid (UV–1201V spectrophotometer, Shimadzu Corporation, Kyoto, Japan). The content of phosphorus (P) was determined by the colorimetric method (UV–1201V spectrophotometer, Shimadzu Corporation, Kyoto, Japan), calcium (Ca) and potassium (K)—by atomic emission spectrometry (AES) (Flame Photometers, BWB Technologies Ltd., Newbury, UK), and magnesium (Mg)—by atomic absorption spectrophotometry (AAS) (AAS1N, Carl Zeiss, Jena, Germany). Salinity was measured by the conductometric method (N5773 Conductivity Meter, Tel-Eko Projekt Ltd., Wrocław, Poland), chloride (Cl) content and pH in H2O were determined by the potentiometric method. Due to minor differences in the obtained values, the results were presented as means for two years of the study (Table 1).
Chemical analyses of soil were performed in the certified Chemical and Agricultural Research Laboratory in Olsztyn (Accreditation Certificate no. AB 277 issued by the Polish Center for Accreditation in Warsaw). Soil was abundant in P, K, Ca and Mg, and supplemental fertilization with those elements was not needed throughout the experiment. Due to the low nitrate N content of soil, N was applied at a single rate of 60 kg·ha−1 in the form of ammonium nitrate before small bulbs were planted in the field. The N requirements of shallots were determined based on the N requirements of common onions because both species belong to the same botanical family and have similar nutrient requirements. The fertilizer was applied uniformly over the soil surface, and then thoroughly mixed with soil. Carrot was the preceding crop. Before the experiment, soil was prepared with a rotary cultivator (two passes at a depth of 30 cm and speed of approx. 0.1–0.3 m·s−1). Shallots were propagated from sets (small bulbs with a diameter of ≥2.0 cm) that were grown from seeds that had been planted in the previous year. In both 2015 and 2016, small bulbs were planted in the field on 29 April. The plot area was 3 m2, and 100 small bulbs were manually planted in each plot at 30 cm× 10 cm spacing at a depth of 3 cm. The shallots plants were watered with water (control) or biostimulant solutions (0.1% GG or 1% EM) using a watering can. The preparations were applied twice during the growing season (14 and 28 DAP) at a dose of 1 dm3 per m−2.
During the experiment, the recommended cultivation practices for shallots were applied, plants were watered keeping the soil moisture at the level of 70%. Weeds were removed manually. Since symptoms of pathogenic infections or pest infestations were not observed, and the growing season was short, chemical plant protection agents were not applied.
The growth and development of shallot plants were evaluated based on observations and measurements performed in the field and after harvest. Leaf greenness was determined before harvest on leaves involved in photosynthesis (SPAD 502 Chlorophyll Meter, Minolta, Osaka, Japan). The measurements were performed on three fully developed leaves of five plants selected randomly in each treatment, and the results were averaged.
Shallot plants were harvested in the second week of June, at maturity, when green leaves were fully developed and bulbs were juicy. After harvest, marketable yield and cluster mass were determined to the nearest 1 g using the Radwag PST 750 R2 laboratory precision balance (Radwag, Radom, Poland). Leaf length (accuracy of ±1 mm) was measured with a ruler, and the number of leaves was determined. The proportion of leaves in the marketable yield was determined based on their mass.

2.2. Meteorological Conditions

Weather conditions during the growing season of shallots were described based on the data provided by the Hydrological and Meteorological Station in Olsztyn. In the 2015 growing season, in April and May, lower air temperatures were recorded in relation to the multi-year averages (by 0.6 and 1.0 °C, respectively) (Table 2). During the shallot cultivation period in 2016, the air temperatures were higher than in many years, especially in May (0.9 °C) and June (1.6 °C). In the years of research, during the growing season of shallots, rainwater deficiencies were noted in relation to the average long-term rainfall totals (Table 2). A very unfavorable distribution of precipitation occurred in April–June 2016 (72.6 mm).

2.3. Laboratory Analyses of Plant Materials

During harvest, representative samples of shallot plants (10 plants each) were collected for laboratory analyses from each plot, and average samples were prepared in accordance with Polish Standard PN-A-75050:1972 [24]. The chemical composition of leaves (l) and bulbs (b) was analyzed in the laboratory of the Department of Horticulture, University of Warmia and Mazury in Olsztyn, to determine the content of: dry matter (cb)—by drying to constant weight at a temperature of 105 °C in the Pol-Eko Aparatura SLW 535 SD laboratory dryer (Pol-Eko, Wodzisław Śląski, Poland) [25], total and reducing sugars—by the Luff-Schoorl method [26], L-ascorbic acid—by the method proposed by Tillmans and modified by Pijanowski [27] and nitrates—by the colorimetric method with the TECHCOMP UV2310II spectrometer (Techcomp, Ltd., Shanghai, China), using salicylic acid [28].
The ascorbate-nitrate index (i) was calculated based on the content of L-ascorbic acid (cL) and nitrates (cN) in the edible parts of shallots, according to the formula [29]:
i = c L c N
The concentrations of macronutrients were determined in dry and wet mineralized plant materials, in three replications. Plants were dried for 24 h at a temperature of 65 °C in the Binder ED400 dryer (Binder GmbH, Tuttlingen, Germany), and then they were ground in the Grindomix GM300 knife mill (Retsch GmbH, Haan, Germany). In order to determine their macronutrient content, the samples were wet mineralized in H2SO4 with the addition of H2O2 as the oxidizing agent using the SpeedDigester K-439 unit (Büchi Labortechnik AG, Flawil, Switzerland).
Shallot bulbs and leaves were analyzed to determine the content of total N—by the Kjeldahl method, P—by the colorimetric method (UV-1201V spectrophotometer, Shimadzu Corporation, Kyoto, Japan), K and Ca—by AES (Flame Photometers, BWB Technologies Ltd., Newbury, UK), and Mg—by AAS (AAS1N, Carl Zeiss, Jena, Germany). Due to minor differences in the obtained values, the results were presented as means for two years of the study. The following weight ratios were also calculated for macronutrients:—Ca:P, Ca:Mg, K:Mg, K:(Ca + Mg) and K:Ca.

2.4. Statistical Analysis

The results of measurements of the morphological parameters, yield and chemical composition of shallot plants were analyzed statistically using Statistica Pl ver. 13.3 software [30]. The results were regarded as statistically significant at α = 0.05. The compliance of the distribution of the determined features with the normal distribution was verified with the Shapiro–Wilk test. The variations in the analyzed parameters were determined by two-way and three-way analysis of variance (ANOVA), and homogeneous groups were identified by Tukey’s test. The strength of relationships between selected traits of shallot plants was evaluated by calculating Pearson’s correlation coefficients, and the functions describing those relationships were derived by regression analysis. The functions available in the Statistica package were tested, and the simplest function with a sufficiently high coefficient of determination (minimum 0.4) was selected.

3. Results and Discussion

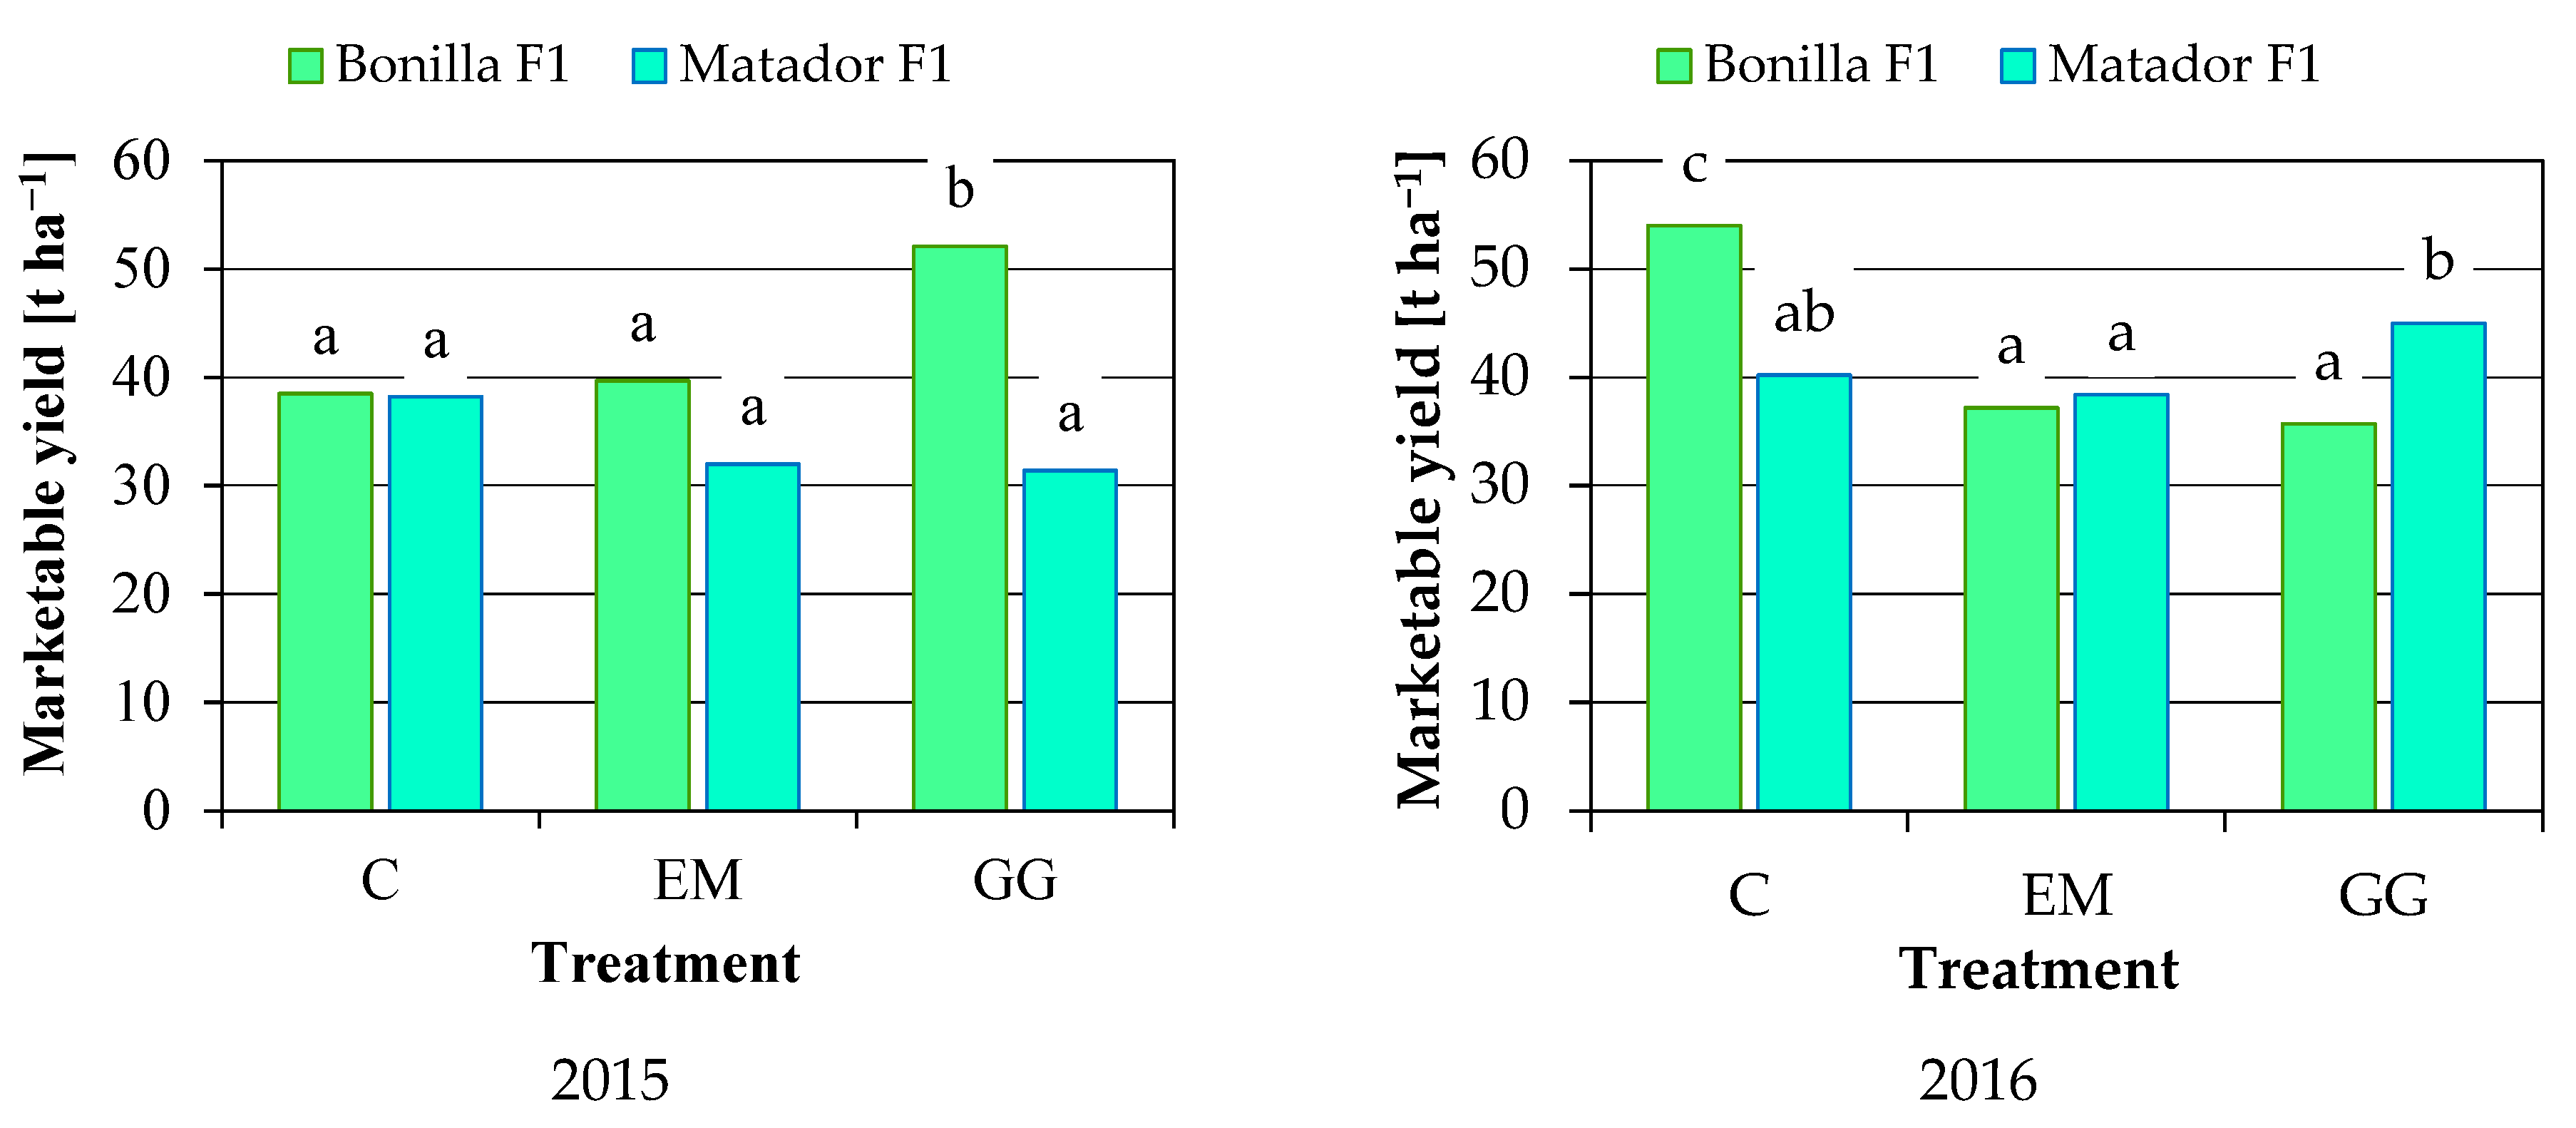
3.1. Morphological Parameters and Marketable Yield of Shallot Plants

The characteristic traits of the analyzed shallot cultivars and modern cultivation technologies can significantly affect crop yield and quality and, as a consequence, production profitability. The values of selected morphological parameters and the marketable yield of two shallot cultivars grown for two consecutive years with the use of biostimulants are presented in Table 3 and Figure 2. The average values of the above parameters were significantly affected by cultivar and year, but not by the experimental treatments. Significant differences in the marketable yield, the proportion of leaves in the yield and leaf length were noted between the analyzed cultivars. The average marketable yield ranged from 37.5 t · ha−1 (Matador F1) to 42.9 t · ha−1 (Bonilla F1), the proportion of leaves in the yield ranged from 53.3% (Matador F1) to 62.3% (Bonilla F1), and leaf length ranged from 30 cm (Matador F1) to 39 cm (Bonilla F1).
In both years of the study, environmental factors during the growing season affected the proportion of leaves in the yield and leaf greenness (SPAD). The proportion of leaves in the marketable yield reached 51.5% in 2015 and 64.1% in 2016 on average. The leaf greenness index (SPAD) ranged from 73 in 2015 to 96 in 2016. The studied cultivars responded differently to the application of biostimulants in terms of cluster mass and the number of leaves (treatment × cultivar interaction). The application of biostimulants in each year of the study affected leaf greenness (SPAD) (treatment × year interaction). The interaction effects of all three factors were observed for the marketable yield and the proportion of leaves in the yield. The application of 1% EM led to a minor decrease in the marketable yield, cluster mass, the number of leaves and the leaf greenness index (SPAD), and a minor increase in the proportion of leaves in the yield and leaf length, relative to the respective values in the control treatment. The application of 0.1% GG exerted similar effects, compared with the control treatment, except for a small increase in the number of leaves. The values of all analyzed parameters were higher in cv. Bonilla F1. Weather conditions had a more beneficial influence on the marketable yield, cluster mass, the proportion of leaves in the yield and leaf greenness (SPAD) in 2016 than in 2015. These findings indicate that the tested biostimulants had a minor effect on the yield and biometric parameters of shallots grown for early bunch harvest. The results of other studies are ambiguous and inconclusive. A positive influence of biostimulants on crop yields was observed by Gajc-Wolska et al. [31] in endive (Cichorium endivia L.), by Marcinek and Hetman [32] in sparaxis (Sparaxis tricolor (Schneev.) Ker Gawl.), and by Grajkowski and Ochmian [33] in raspberry (Rubus idaeus L.). Among others, Hussein and Joo [34] and Shaheen et al. [35] found that the use of EM increased crop productivity. Marschner [36] reported that the stimulating effect of microorganisms on plant growth could be caused by the fact that they produce secondary metabolites, growth hormones, phytochelatin, organic acids and B vitamins. Xu Hui-Lian et al. [37] observed that EM stimulated photosynthetic processes and increased the weight of plants. In a study by Michalski [38], the effect of titanium on the nutritional status of strawberries (Fragaria × ananassa Duchesne) varied across years. In turn, Mikulewicz et al. [39] noted differences in the yields of common onion (Allium cepa L.) depending on the type of amino acid biostimulants. Majkowska-Gadomska et al. [40] demonstrated that exogenously applied biostimulants did not improve the yields of three herb species of the family Lamiaceae, summer savory (Satureja hortensis L.), marjoram (Origanum majorana L.) and lemon balm (Melissa officinalis L.). Thevanathan et al. [41] and Bai et al. [42] found that marine algal extracts significantly increased (by 35%) the height of legume plants. A positive effect of seaweed extracts on the biometric parameters of plants was noted by Abbas et al. [43], Szczepanek et al. [44] and Hidangmayum and Sharmain [45] in common onions, by Sulakhudin et al. [46] in shallots, and by Kapczyńska et al. [47] in Pennisetum ‘Vertigo’. In the work of Rosłon et al. [48], peppermint (Mentha × piperita) and basil (Ocimum basilicum L.) plants treated with marine algal extract (GG) were taller than control plants. However, basil (Ocimum basilicum L.) plants treated with EM were shorter than control plants [49]. The leaf greenness index (SPAD) is a measure of the relative chlorophyll content of leaves. Szczepanek et al. [44] noted higher SPAD values in common onions treated with the Kelpak biostimulant. In the experiment performed by Majkowska-Gadomska et al. [50], the leaf greenness index (SPAD) in Capsicum annuum L. was similar in plants sprayed with biostimulants and in control plants. Similar observations were made by Chen et al. [51] who investigated the effects of seaweed extracts on sugarcane (Saccharum officinarum L.). In contrast, the application of EM led to a decrease in the leaf greenness index (SPAD) in basil [49] and lettuce [52].

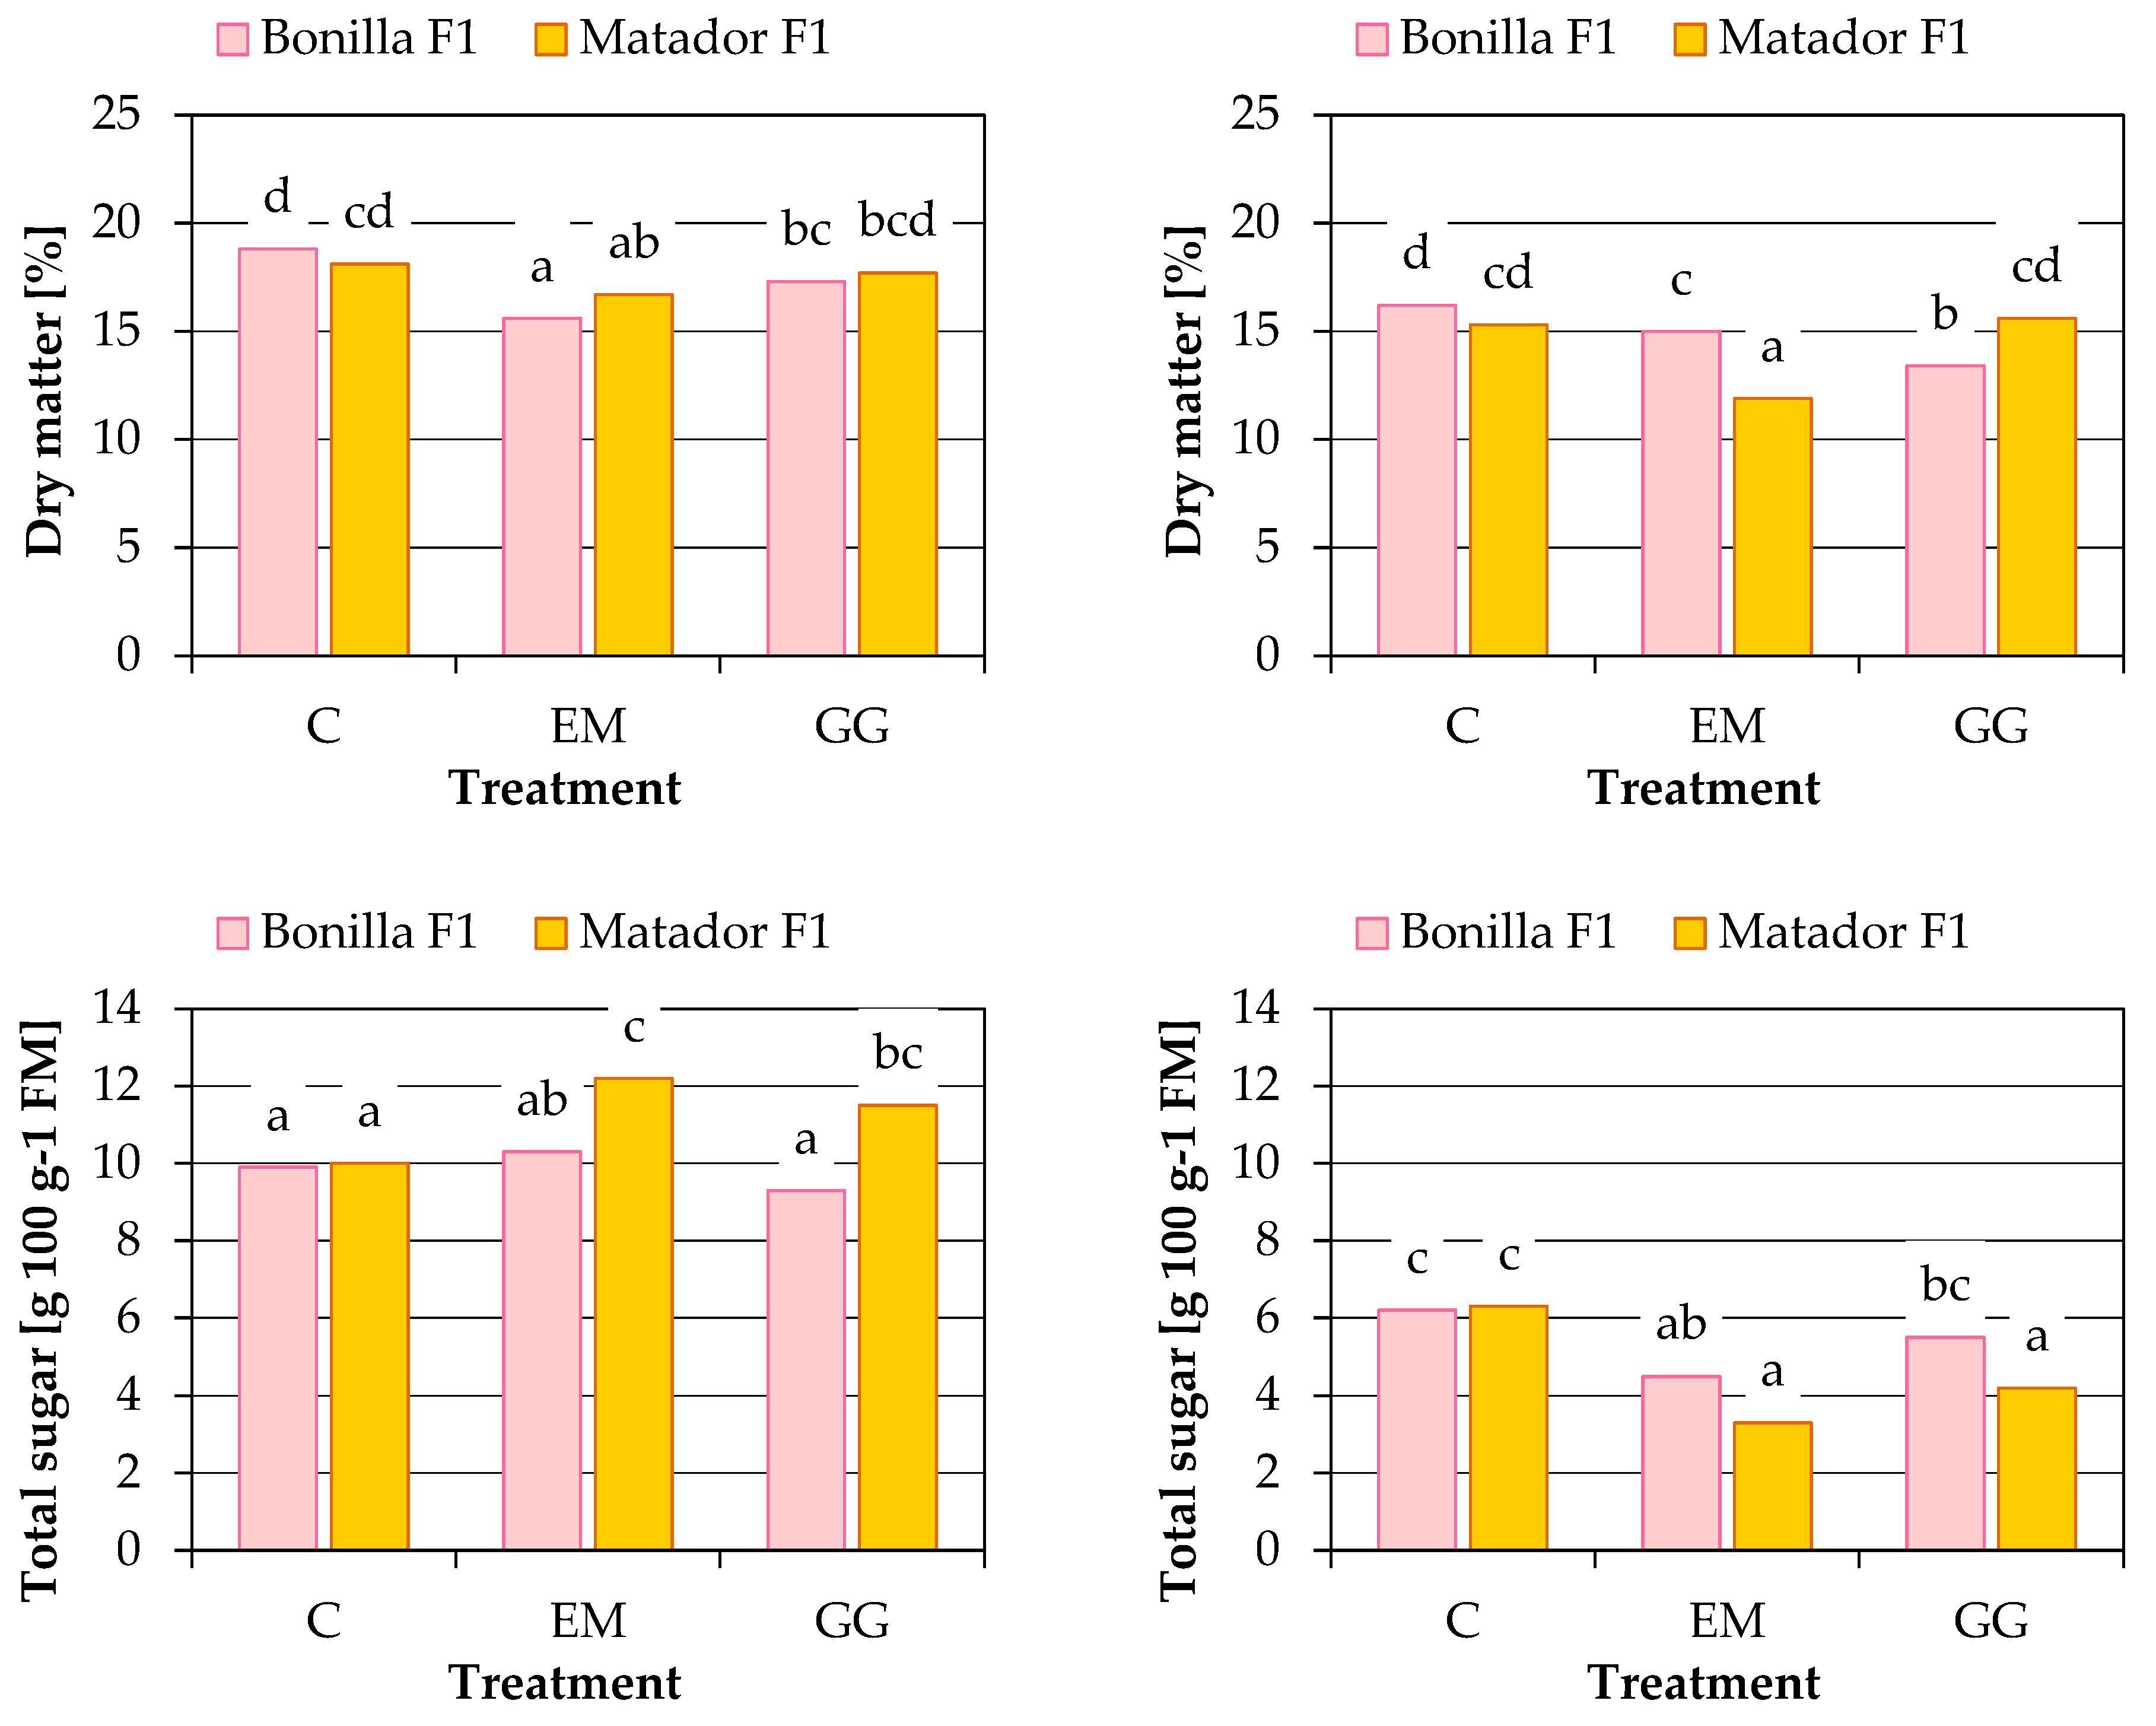
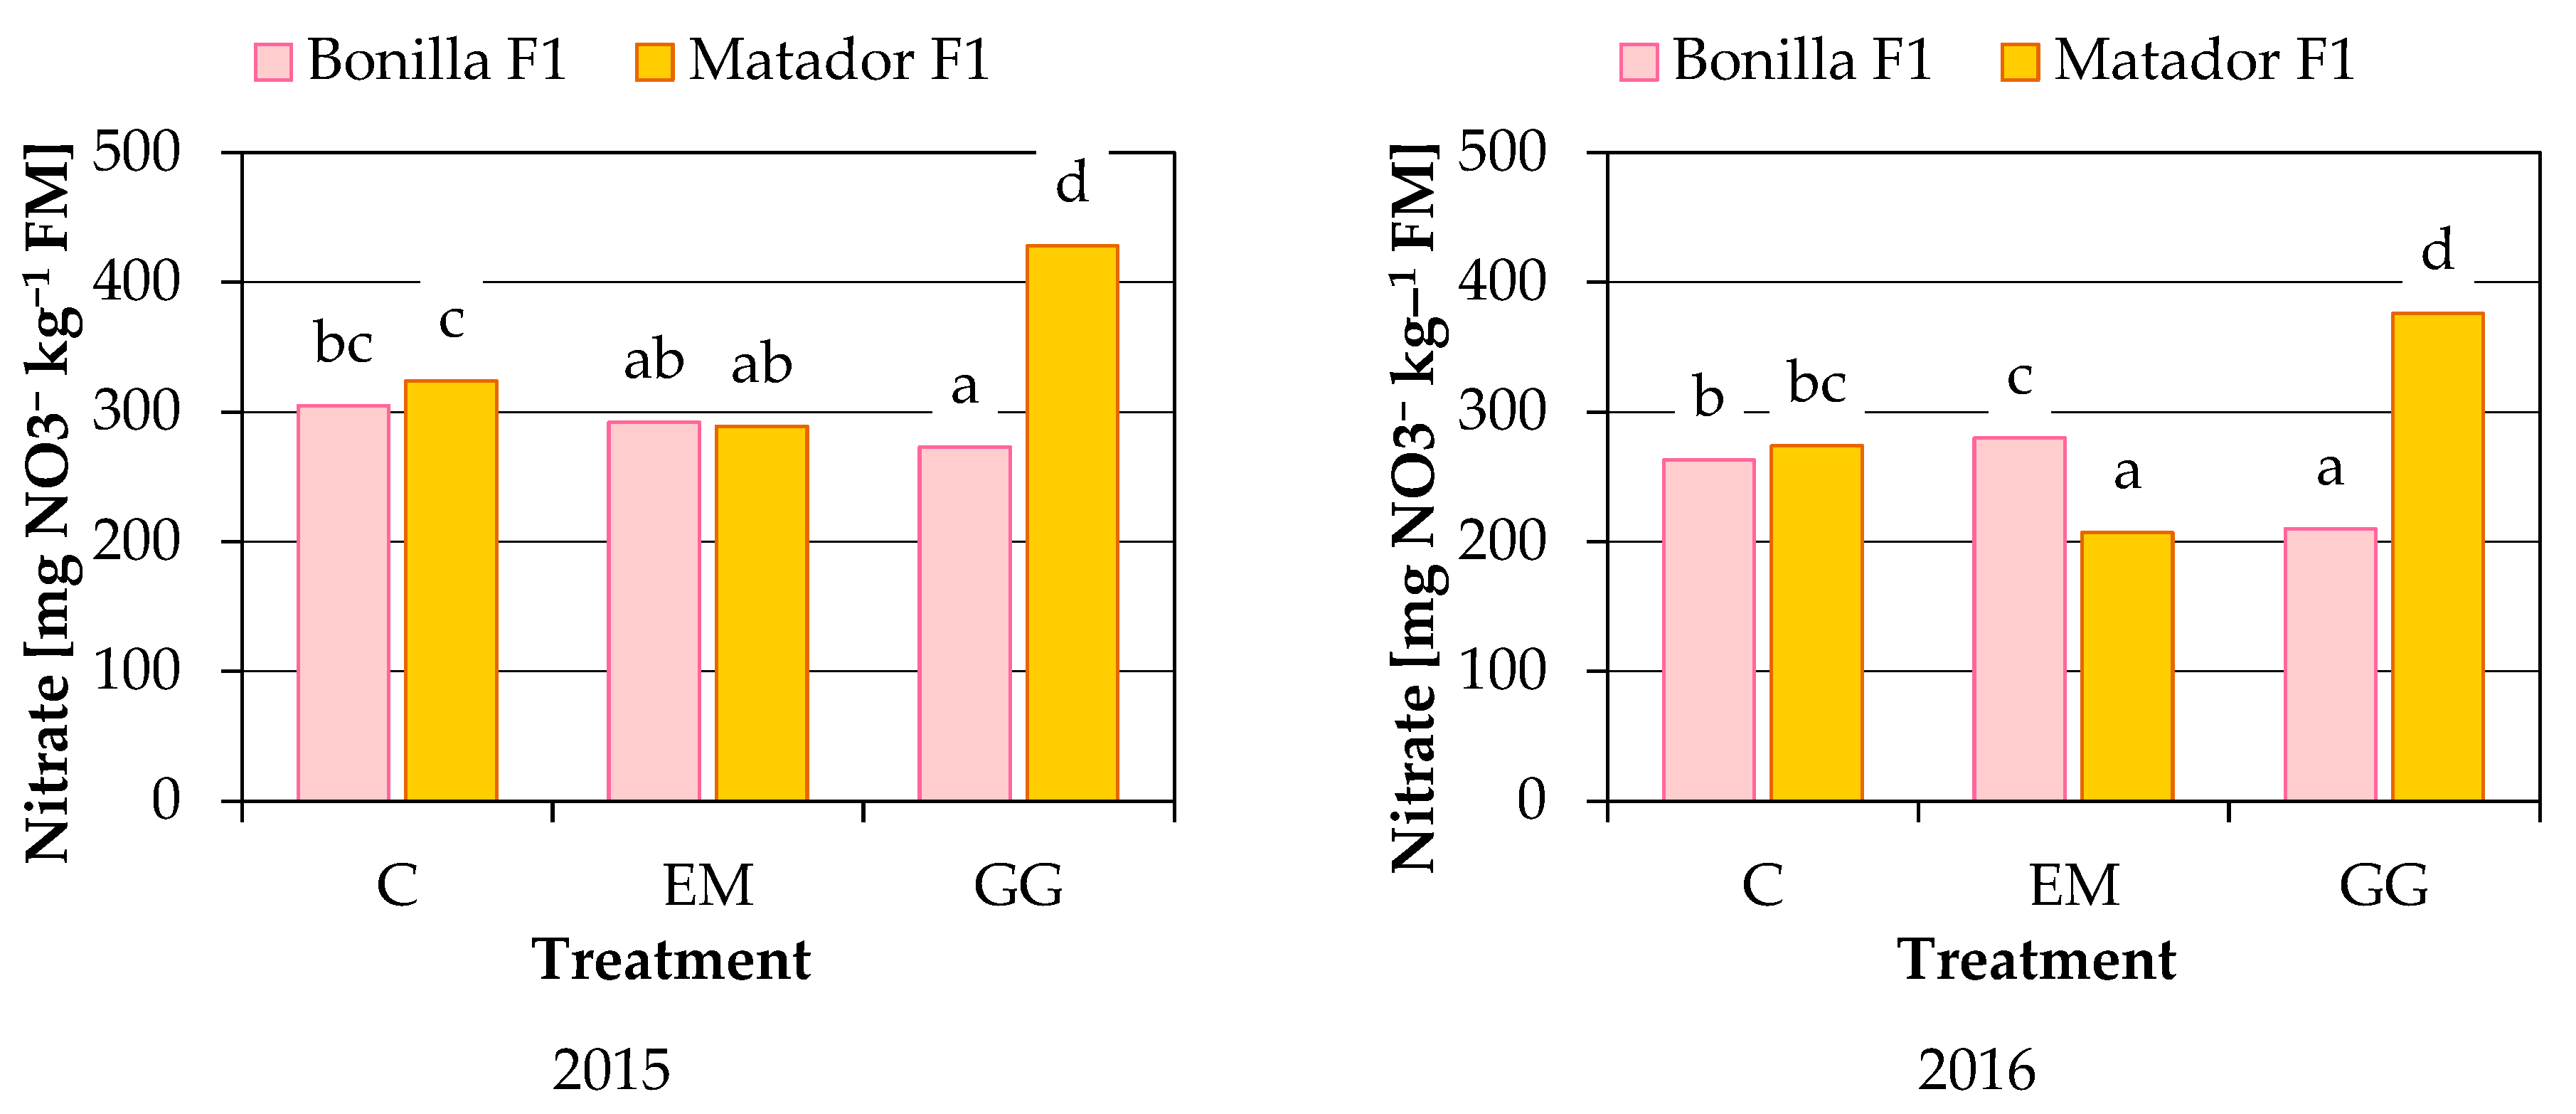
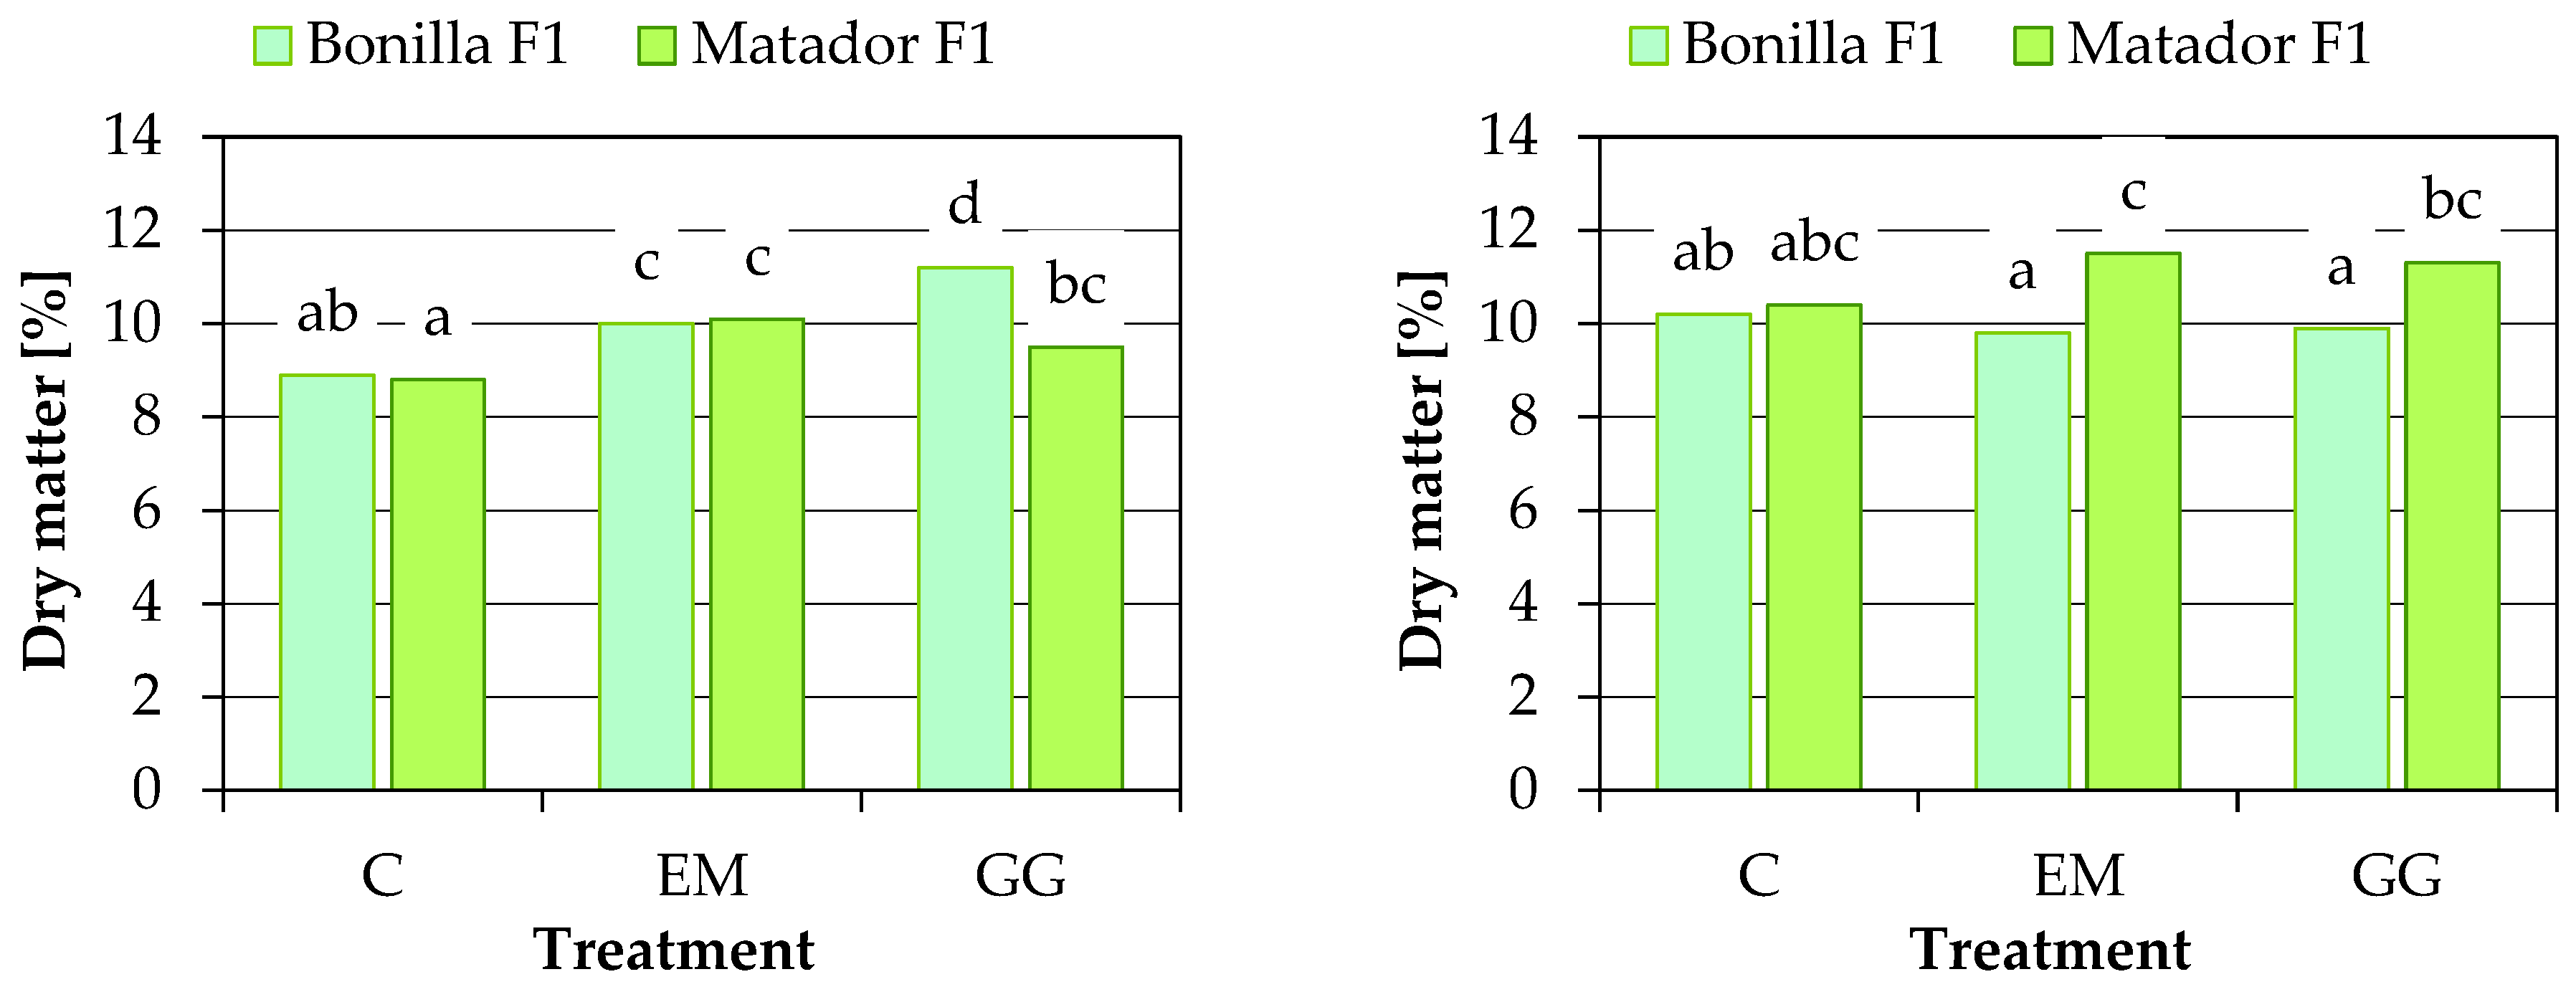
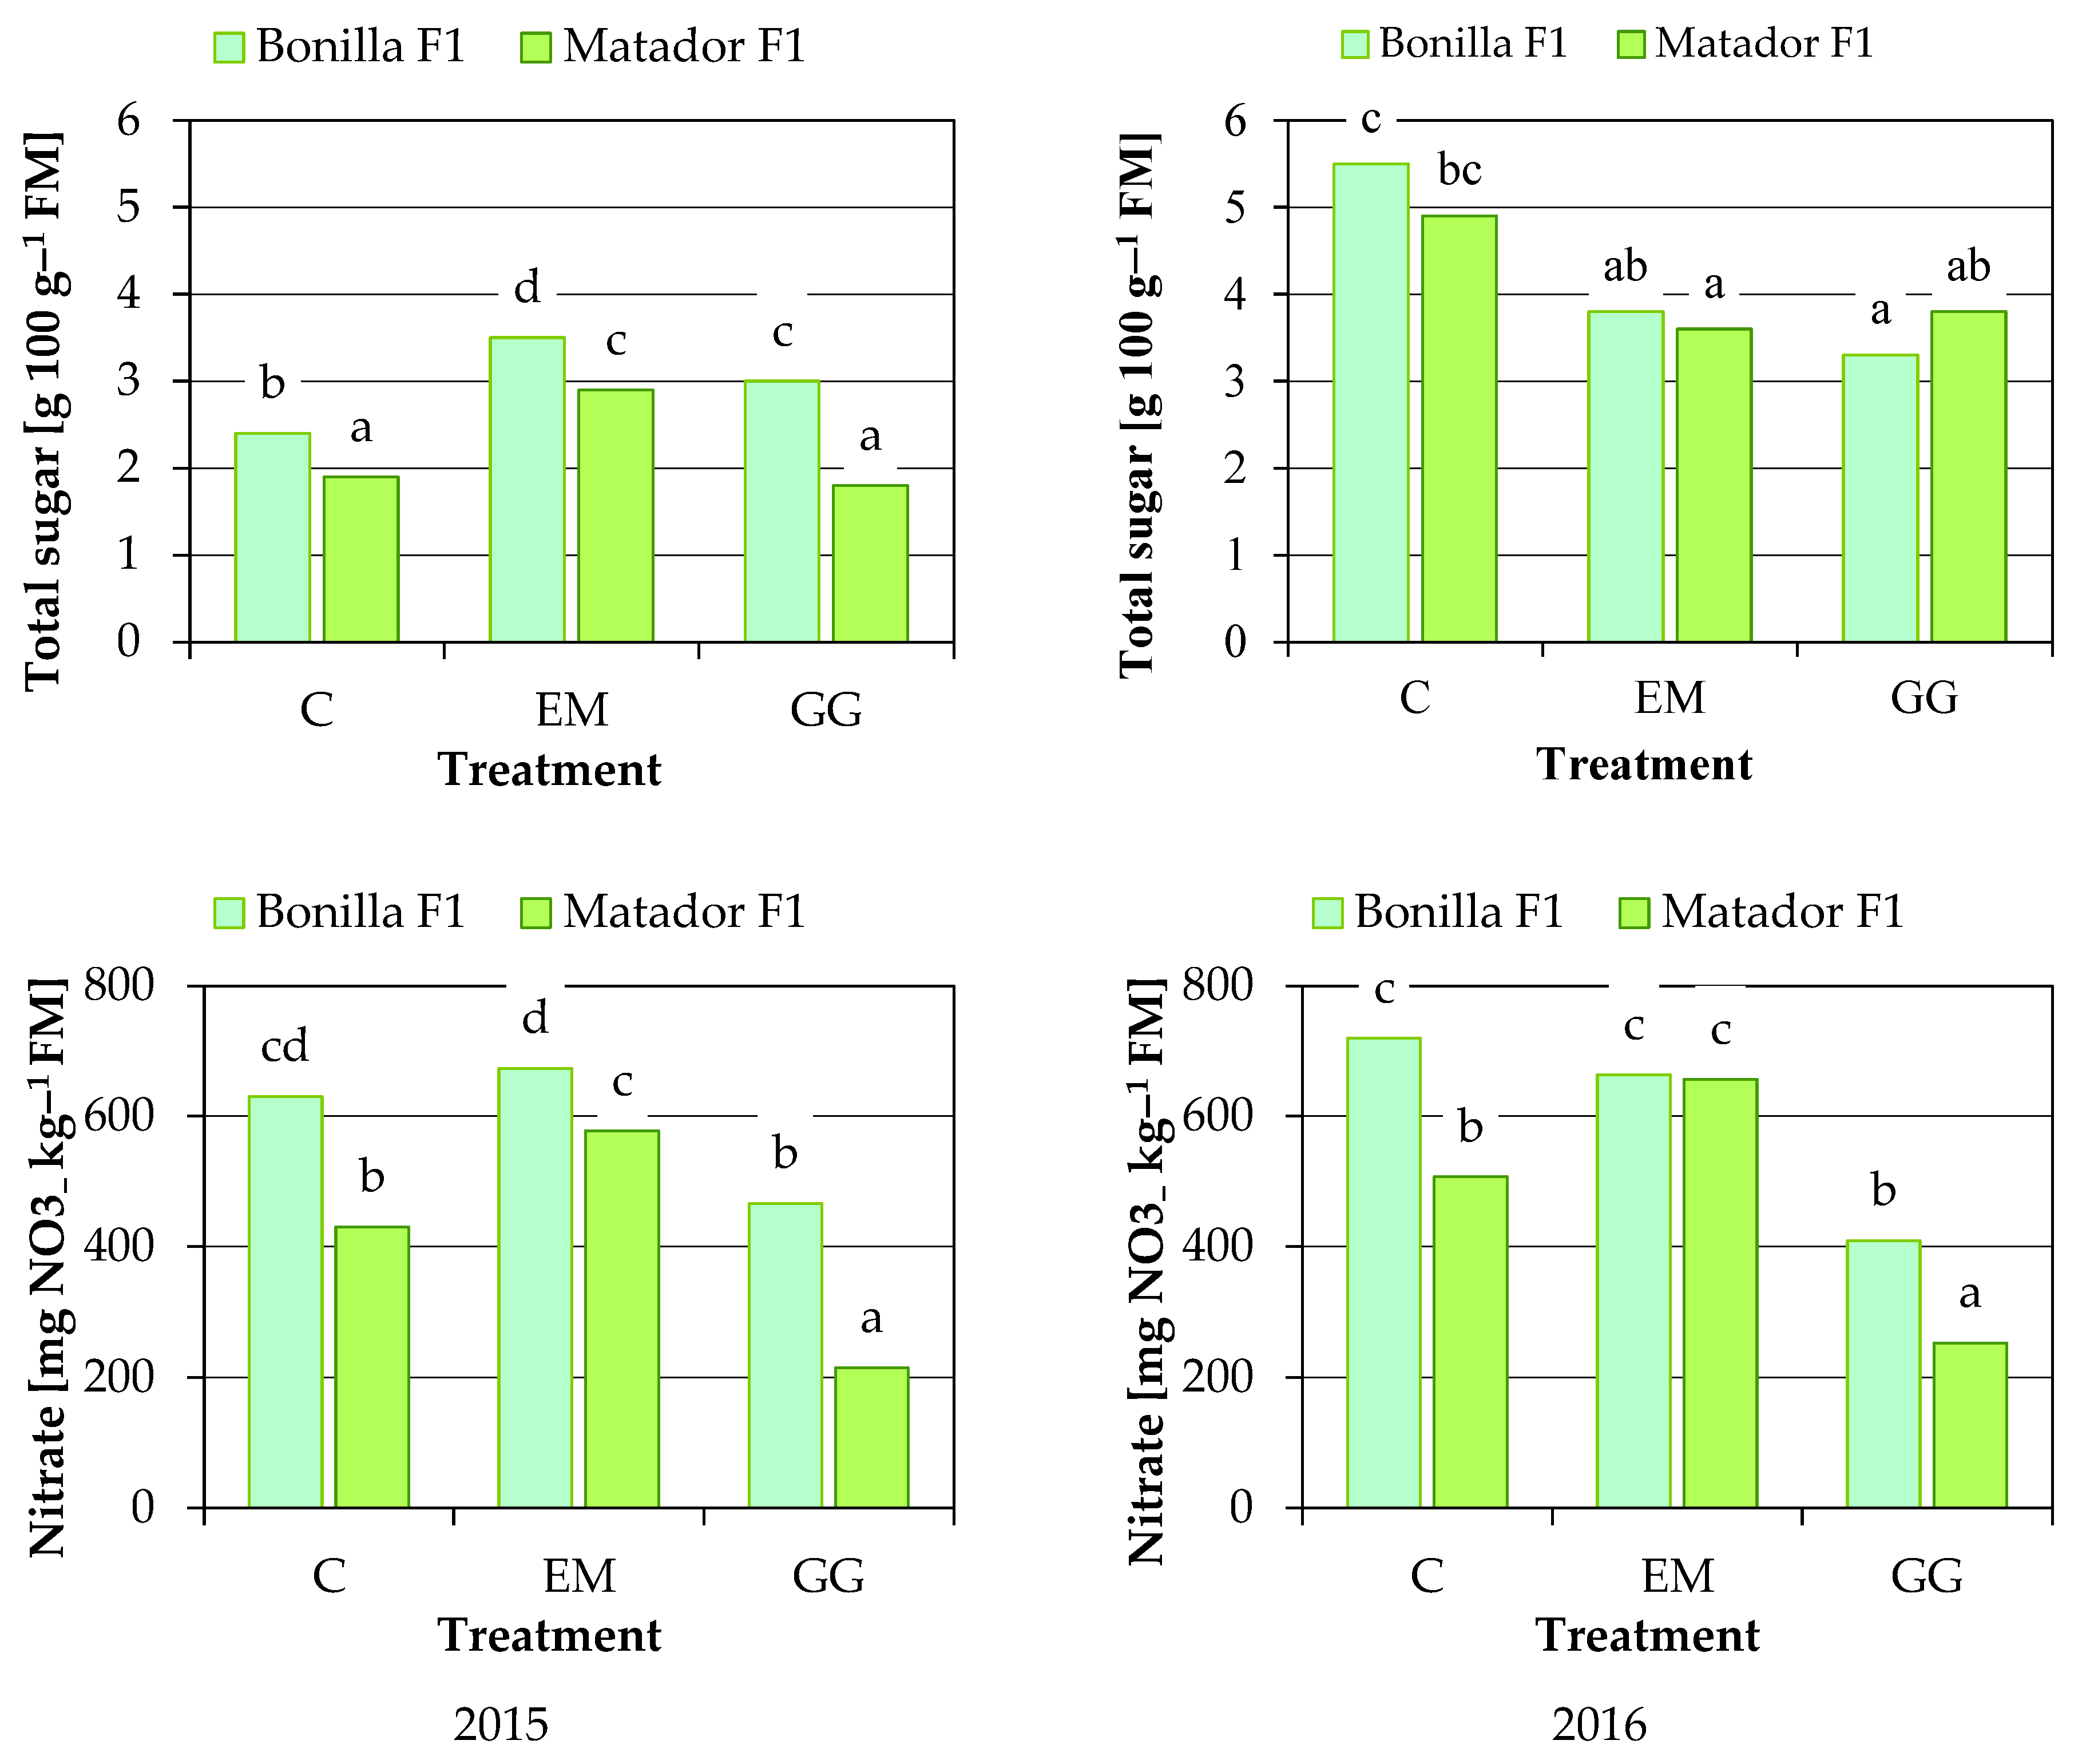
3.2. Chemical Composition of Shallot Plants

The proximate chemical composition of bulbs of the analyzed shallot cultivars is presented in Table 4 and Figure 3.
The application of biostimulants decreased the content of L-ascorbic acid, dry matter and total sugars in bulbs, and the ascorbate-nitrate index, relative to the respective values in the control treatment; however, only the difference in dry matter content between groups EM and C was statistically significant. The application of 1% EM decreased, and the application of 0.1% GG increased the nitrate content of bulbs, compared with the control treatment. Shallot bulbs of cv. Bonilla F1, compared with cv. Matador F1, had a higher content of L-ascorbic acid (12.7 vs. 11.4 mg 100 g−1 FM), dry matter (16.1 vs. 15.9%) and reducing sugars (1.6 vs. 1.0 g 100 g−1 FM) and a higher ascorbate-nitrate index (0.45 vs. 0.36), and a lower content of total sugars (7.6 vs. 7.9 g 100 g−1 FM) and nitrates (270 vs. 317 N-NO3 kg−1 FM), but only the differences in reducing sugar content and the ascorbate-nitrate index were significant. Weather conditions during the growing season significantly affected the chemical composition of bulbs: the content of L-ascorbic acid, dry matter, total sugars and nitrates and the ascorbate-nitrate index were lower, whereas reducing sugar content was higher in 2016 than in 2015. An interaction between three experimental factors (treatment, cultivar and year) was noted for all analyzed parameters of the chemical composition of bulbs. The differences in the total sugar content of bulbs resulted mainly from the effects of environmental factors during the growing season (treatment × year interaction and cultivar × year interaction). The tested biostimulants exerted different effects on the nitrate content of bulbs due to the differences between the studied cultivars (treatment × cultivar interaction). The cultivar × year interaction had a significant effect on the ascorbate-nitrate index.
The proximate chemical composition of leaves of the analyzed shallot cultivars is presented in Table 5 and Figure 4. The application of 1% EM increased the content of L-ascorbic acid, dry matter and nitrates, and decreased the content of total sugars and reducing sugars in leaves, and the ascorbate-nitrate index, relative to the respective values in the control treatment, although the noted differences were not statistically significant. The application of 0.1% GG increased the dry matter content of leaves and the ascorbate-nitrate index, and decreased the values of the remaining parameters, compared with the control treatment, and the differences in dry matter content, nitrate content and the ascorbate-nitrate index were significant. Shallot leaves of cv. Bonilla F1, compared with cv. Matador F1, had a lower content of L-ascorbic acid (31.7 vs. 33.2 mg 100 g−1 FM) and dry matter (10.0 vs. 10.3%) and a lower ascorbate-nitrate index (0.54 vs. 0.97), and a higher content of total sugars (3.6 vs. 3.1 g 100 g−1 FM), reducing sugars (2.5 vs. 2.0 g 100 g−1 FM) and nitrates (594 vs. 440 N-NO3 kg−1 FM), but only the differences in nitrate content and the ascorbate-nitrate index were significant. The chemical composition of leaves differed significantly between the years of the study, and L-ascorbic acid content and the ascorbate-nitrate index were lower, whereas the values of the remaining parameters were higher in 2016 than in 2015. The effects exerted by the tested biostimulants differed between the analyzed shallot cultivars with respect to the nitrate content of leaves and the ascorbate-nitrate index, and between the years of study with respect to the content of L-ascorbic acid, total sugars and reducing sugars in leaves, and the ascorbate-nitrate index. The content of L-ascorbic acid, dry matter and reducing sugars in leaves of the studied shallot cultivars was affected by weather conditions during the growing season. There was no interaction between three experimental factors (treatment, cultivar and year) only for the nitrate content of leaves.
Similarly to the present experiment, previous studies also revealed that biostimulants affected the dry matter content of plants. The application of GG increased the dry matter content of endivia (Cichorium endivia L.) leaves [31], and EM increased the dry matter content of meadow vegetation [53]. In a study by Mikulewicz et al. [39], the dry matter content of common onions varied in response to the applied amino acid biostimulants. Biopreparations can exert different effects on the L-ascorbic acid content of plants, depending on species and edible parts. In the study by Godlewska et al. [54], in most cases, plant biostimulants increased the content of L-ascorbic acid in leaves and roots of radish (Raphanus sativus var. sativus), similar to the studies by Rouphael et al. [10] in spinach leaves. A decrease in L-ascorbic acid content was noted in garlic (Allium sativum L.) after the application of Calleaf Aminovital and Maximus Amino Protect [55], and in raspberries after the application of Atonik, Tytanit and Biochikol [33]. In previous experiments, different types of biostimulants decreased the content of total sugars and reducing sugars in the edible parts of many crop species [39,50,51]. In the current study, an analysis of the chemical composition of shallot plants revealed that leaves, compared with bulbs, had an approximately two-fold higher content of L-ascorbic acid, reducing sugars and nitrates, and an approximately two-fold lower content of dry matter and total sugars.
According to Commission Regulation (EU) No. 1258/2011 of 2 December 2011 [56] regarding the maximum levels for nitrates in foodstuffs, the maximum permissible levels of nitrates in fresh lettuce have been set at 3000–4000 N-NO3 kg−1 FM. Such standards have not been established for Allium species. In the present study, the nitrate content of shallot leaves and young bulbs was relatively low. Nitrate concentrations in plants vary depending on species, climate and soil conditions, and fertilization, which was identical in all treatments in this experiment [57]. Adequate nutrition promotes plant growth and development, and supports organic matter cycling and reduction of harmful residues. In experiments conducted by Majkowska-Gadomska et al. [40,55], biostimulants contributed to decreasing the nitrate content of the edible parts in all analyzed herb species—summer savory, marjoram and lemon balm, as well as garlic. In contrast, Rouphael et al. [10] reported that spinach (Spinacia oleracea L.) leaves treated with seaweed-based extracts (Ascophyllum nodosum) accumulated 35% more nitrates than the leaves of control plants. Similarly to shallot leaves and bulbs, the nitrate content of raspberries was affected by the type of the applied biostimulants [33]. The ascorbate-nitrate index (IAN) is one of the key measures of the nutritional value and safety of vegetables. Vegetables characterized by a higher content of L-ascorbic acid than nitrates are safer and deliver more health benefits to humans [58]. Based on the values of the ascorbate-nitrate index, Lachman et al. [29] categorized vegetables into three groups: <0.5 risk-posing species, 0.5–1.0 neutral species, >1.0 safe/beneficial species. In the current study, the values of the ascorbate-nitrate index ranged from 0.34 to 0.51 in shallot bulbs, and from 0.52 to 1.16 in leaves. These values were considerably higher than those reported by Muráriková and Neugebauerová [59] in basil plants, which were much below 0.5 in nearly all treatments. In the experiments performed by Wadas et al. [60], and Wadas and Raczuk [61], the tubers of different potato (Solanum tuberosum L.) cultivars were characterized by very high values of the ascorbate-nitrate index, i.e., a high level of food safety.

3.3. Macronutrient Content of Shallot Plants

The content of N, P, K, Ca and Mg in shallot bulbs is presented in Table 6. The tested biostimulants increased the concentrations of Ca and Mg in bulbs, and the differences in Mg content were significant relative to the control treatment. The application of EM increased the levels of N, P and K in bulbs, whereas the application GG decreased their content, compared with the control treatment. The concentrations of N, P, K and Mg in bulbs of two shallot cultivars were similar, and a significant difference was noted only in Ca content, which was higher in plants of cv. Bonilla F1 than in plants of cv. Matador F1. An interaction between treatment and cultivar was observed for the content of N, K and Ca in shallot bulbs.
The content of the analyzed macronutrients in shallot leaves is presented in Table 7. The tested biostimulants increased their P content (significant difference between the EM treatment and the control treatment) and decreased Ca content (significant difference between EM and GG treatments vs. the control treatment). The application of EM decreased N content and increased the content of P (significant difference) and K in shallot leaves relative to the control treatment. The application of GG decreased the concentrations of N, K and Mg in leaves, compared with control plants that received only water, but the noted differences were not significant. Leaves of cv. Matador F1 had a higher content of N, P, Ca and Mg, and lower K content than leaves of cv. Bonilla F1, but significant differences were observed only for the levels of P and Ca. An interaction between treatment and cultivar was found for the content of N, Ca and Mg in shallot leaves.
Macronutrients perform important functions in the human body, including the regulation and maintenance of the acid-base balance. The recommended daily macronutrient intake exceeds 100 mg. The mineral status of plants affects the nutritional value of foods and contributes to the healthy growth and development of crops [62]. During the growing season, plants are exposed to adverse environmental conditions and abiotic stresses, including salinity, and mineral deficiencies [63]. Kleiber et al. [52,64] noted a minor, statistically non-significant rising trend in the macronutrient content of lettuce and tomato leaves treated with EM. A biostimulant based on EM induced an increase in the content of N, P, K, Ca and Mg in meadow vegetation [53]. In a study by Frąszczak et al. [49], EM exerted a significant, stimulatory effect on N, P and K uptake by the aerial parts of basil plants, but it negatively affected Ca and Mg uptake. An increase in macronutrient accumulation in response to seaweed extracts was observed by Gajc-Wolska et al. [31] in endivia leaves, and by Chen et al. [51] in the aerial parts of sugarcane plants.
Shallot leaves, compared with bulbs, were characterized by higher levels of all analyzed macronutrients: N (by approx. 100%), P (by approx. 20%), K (by approx. 160%), Ca (by approx. 60%) and Mg (by approx. 180%). In the experiment performed by Majkowska-Gadomska and Arcichowska-Pisarska [65], the leaves of Welsh onion (Allium fistulosum L.) also contained considerably higher amounts of macronutrients than scapes.
The nutritional value of edible plant parts is determined not only by the content of minerals, but also by their ratios. The optimal ratios between macronutrients in foods of plant origin should be as follows: Ca:P—2:1, Ca:Mg—3:1, K (Ca + Mg)—1.6–2.2:1, K:Mg—2–6:1, and K:Ca—2–4:1 [66,67]. The above ratios may vary widely depending on various factors, including plant species, plant part, maturity, harvest date and fertilization. Wider than optimal Ca:Mg and Ca:P ratios may be indicative of dietary Mg and P deficiencies. According to Rosanoff et al. [68], the dietary Ca:Mg ratio should not exceed 2.8:1 because diets with Ca:Mg > 2.8 may increase the risk of cardiovascular disease and diabetes.
Macronutrient ratios in shallot bulbs and leaves are presented in Table 8 and Table 9. The application of biostimulants led to a significant decrease in the Ca:P ratio in leaves, whereas no significant differences were found in the values of the remaining macronutrient ratios between experimental and control treatments (except for the K:Mg ratio in bulbs, which was significantly lower in the GG treatment than in the control treatment). The tested biostimulants exerted different effects on K:Ca, Ca:P and K:(Ca + Mg) ratios in shallot bulbs. The application of EM, compared with GG, increased the values of K:Ca, K:Mg and K:(Ca + Mg) ratios, and decreased the values of Ca:P and Ca:Mg ratios in both bulbs and leaves. The analyzed cultivars were characterized by different values of K:Ca, Ca:P, Ca:Mg and K:(Ca + Mg) ratios in bulbs, and K:Ca and K:(Ca + Mg) ratios in leaves. The tested biostimulants exerted varied effects on macronutrient ratios in plants of the analyzed shallot cultivars (treatment × cultivar interaction), including Ca:P and Ca:Mg ratios in bulbs and leaves, and Ca:P, Ca:Mg and K:Mg ratios in leaves.
The Ca:Mg ratio in shallot plants was too wide in all treatments, ranging from 15.21 to 16.85 in bulbs, and from 8.49 to 9.34 in leaves. Varied and very wide Ca:Mg ratios were also observed by Pitura and Michałojć [69] in lettuce, kale and celery, and by Francke et al. [70] in mizuna (Brassica rapa L. var. japonica). In the current study, the Ca:P ratio in shallot leaves and bulbs ranged from 4.76 to 6.11 and from 3.95 to 4.78, respectively, and these values were too wide in all cases. The K:Mg ratio was also wider than optimal. From a nutritional perspective, it was more desirable in shallot leaves. The K:Ca ratio ranged from 1.35 to 1.55 in bulbs (too narrow), and from 2.31 to 2.62 in leaves (normal). The K:(Ca + Mg) ratio was too narrow in bulbs, and normal in leaves (2.09–2.34). Similar results were reported by Majkowska-Gadomska and Arcichowska-Pisarska [65] who found that macronutrient ratios were closer to optimal in leaves than scapes of different Welsh onion cultivars.

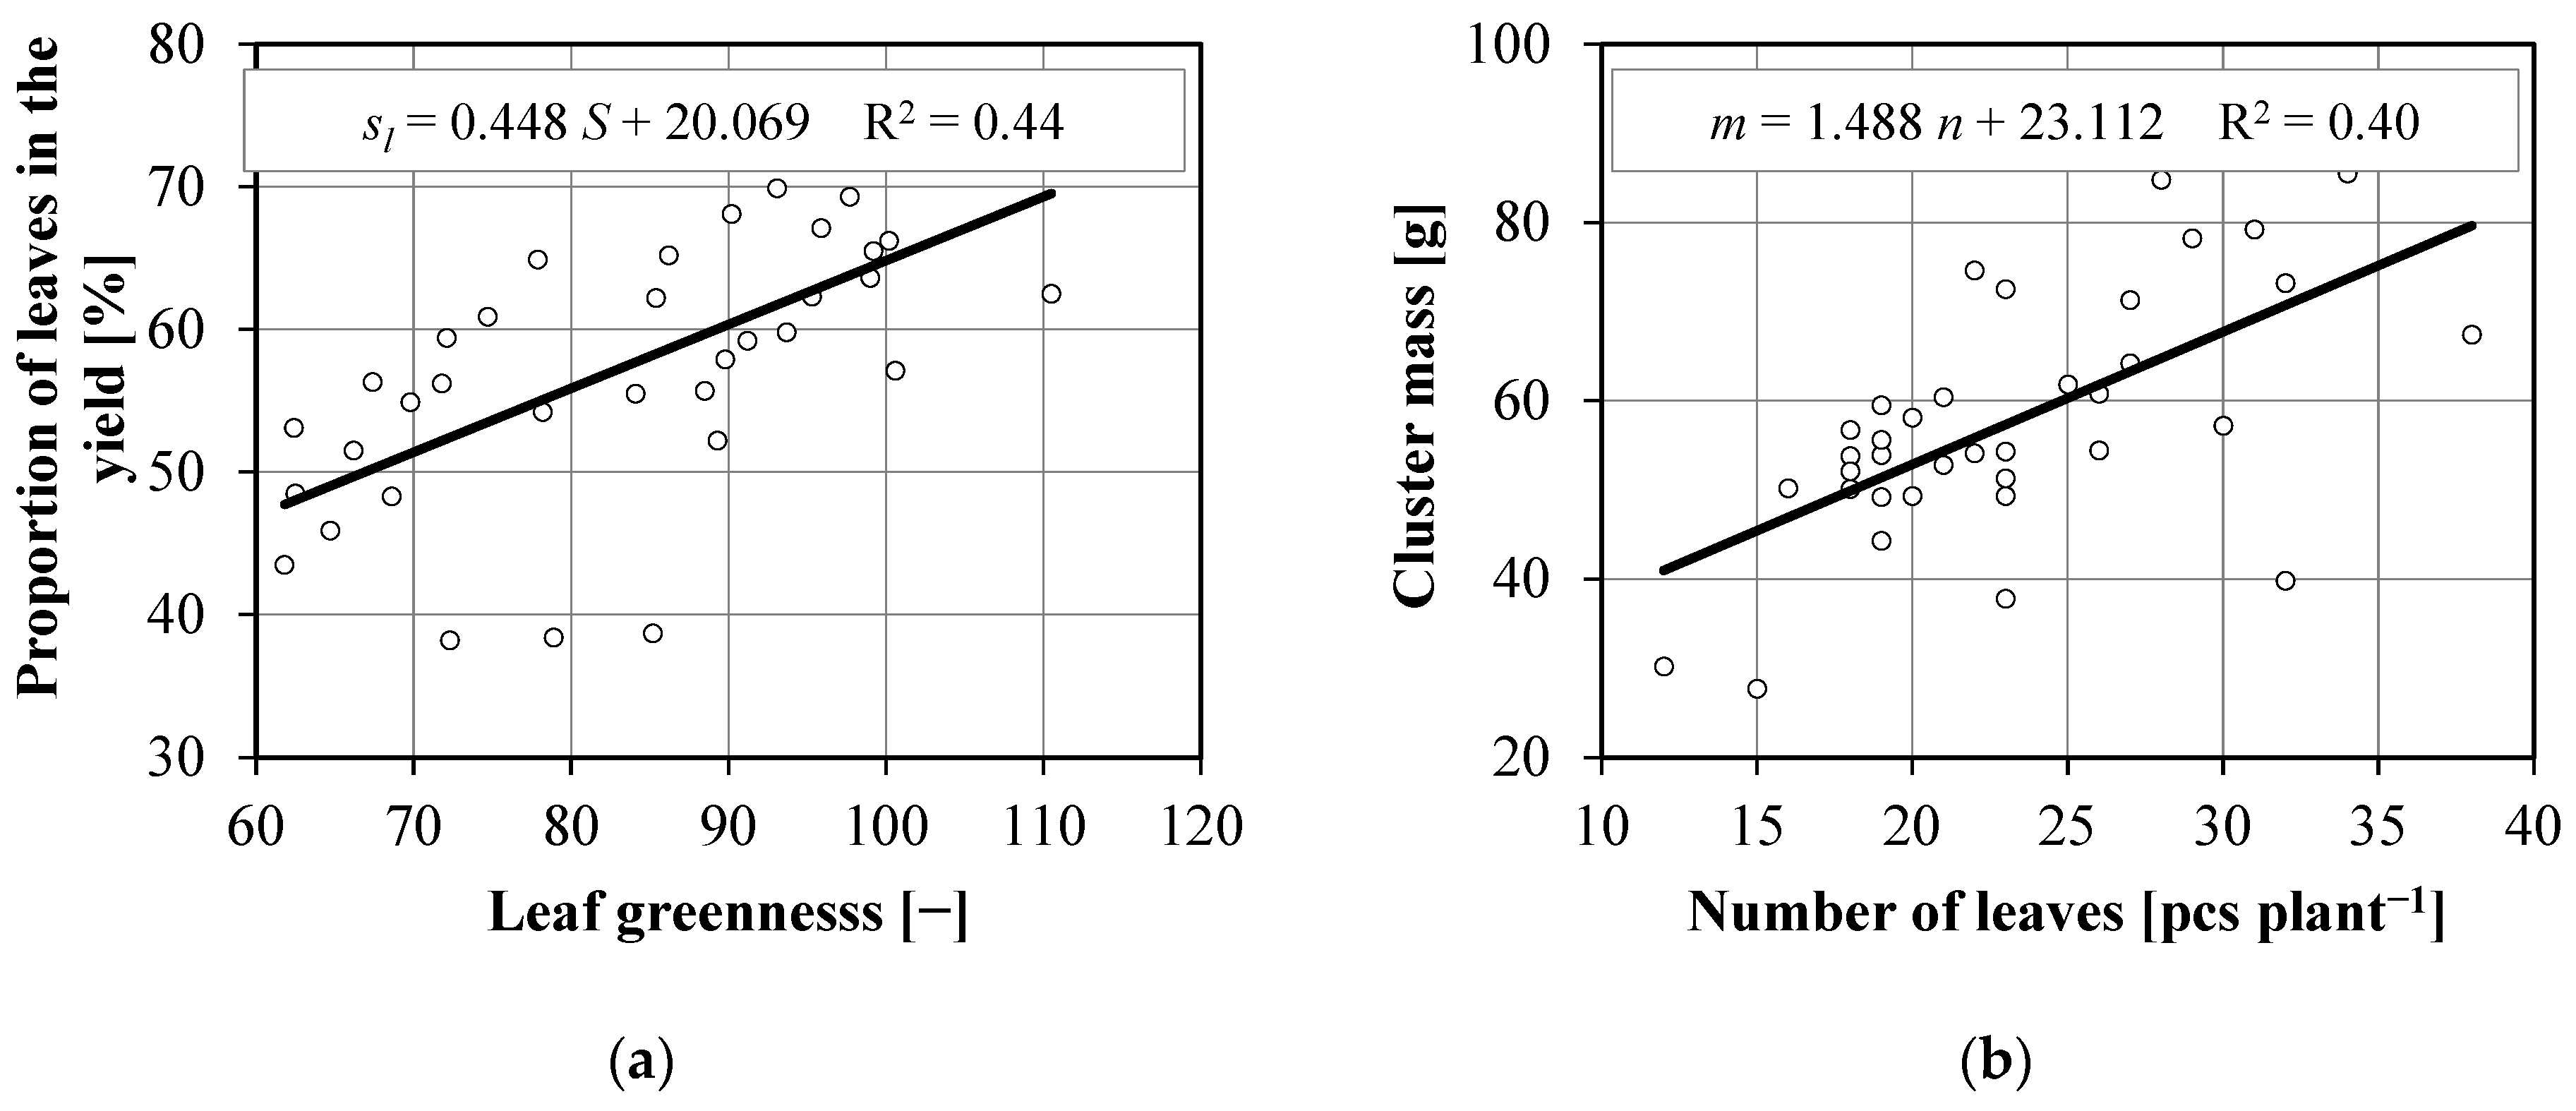
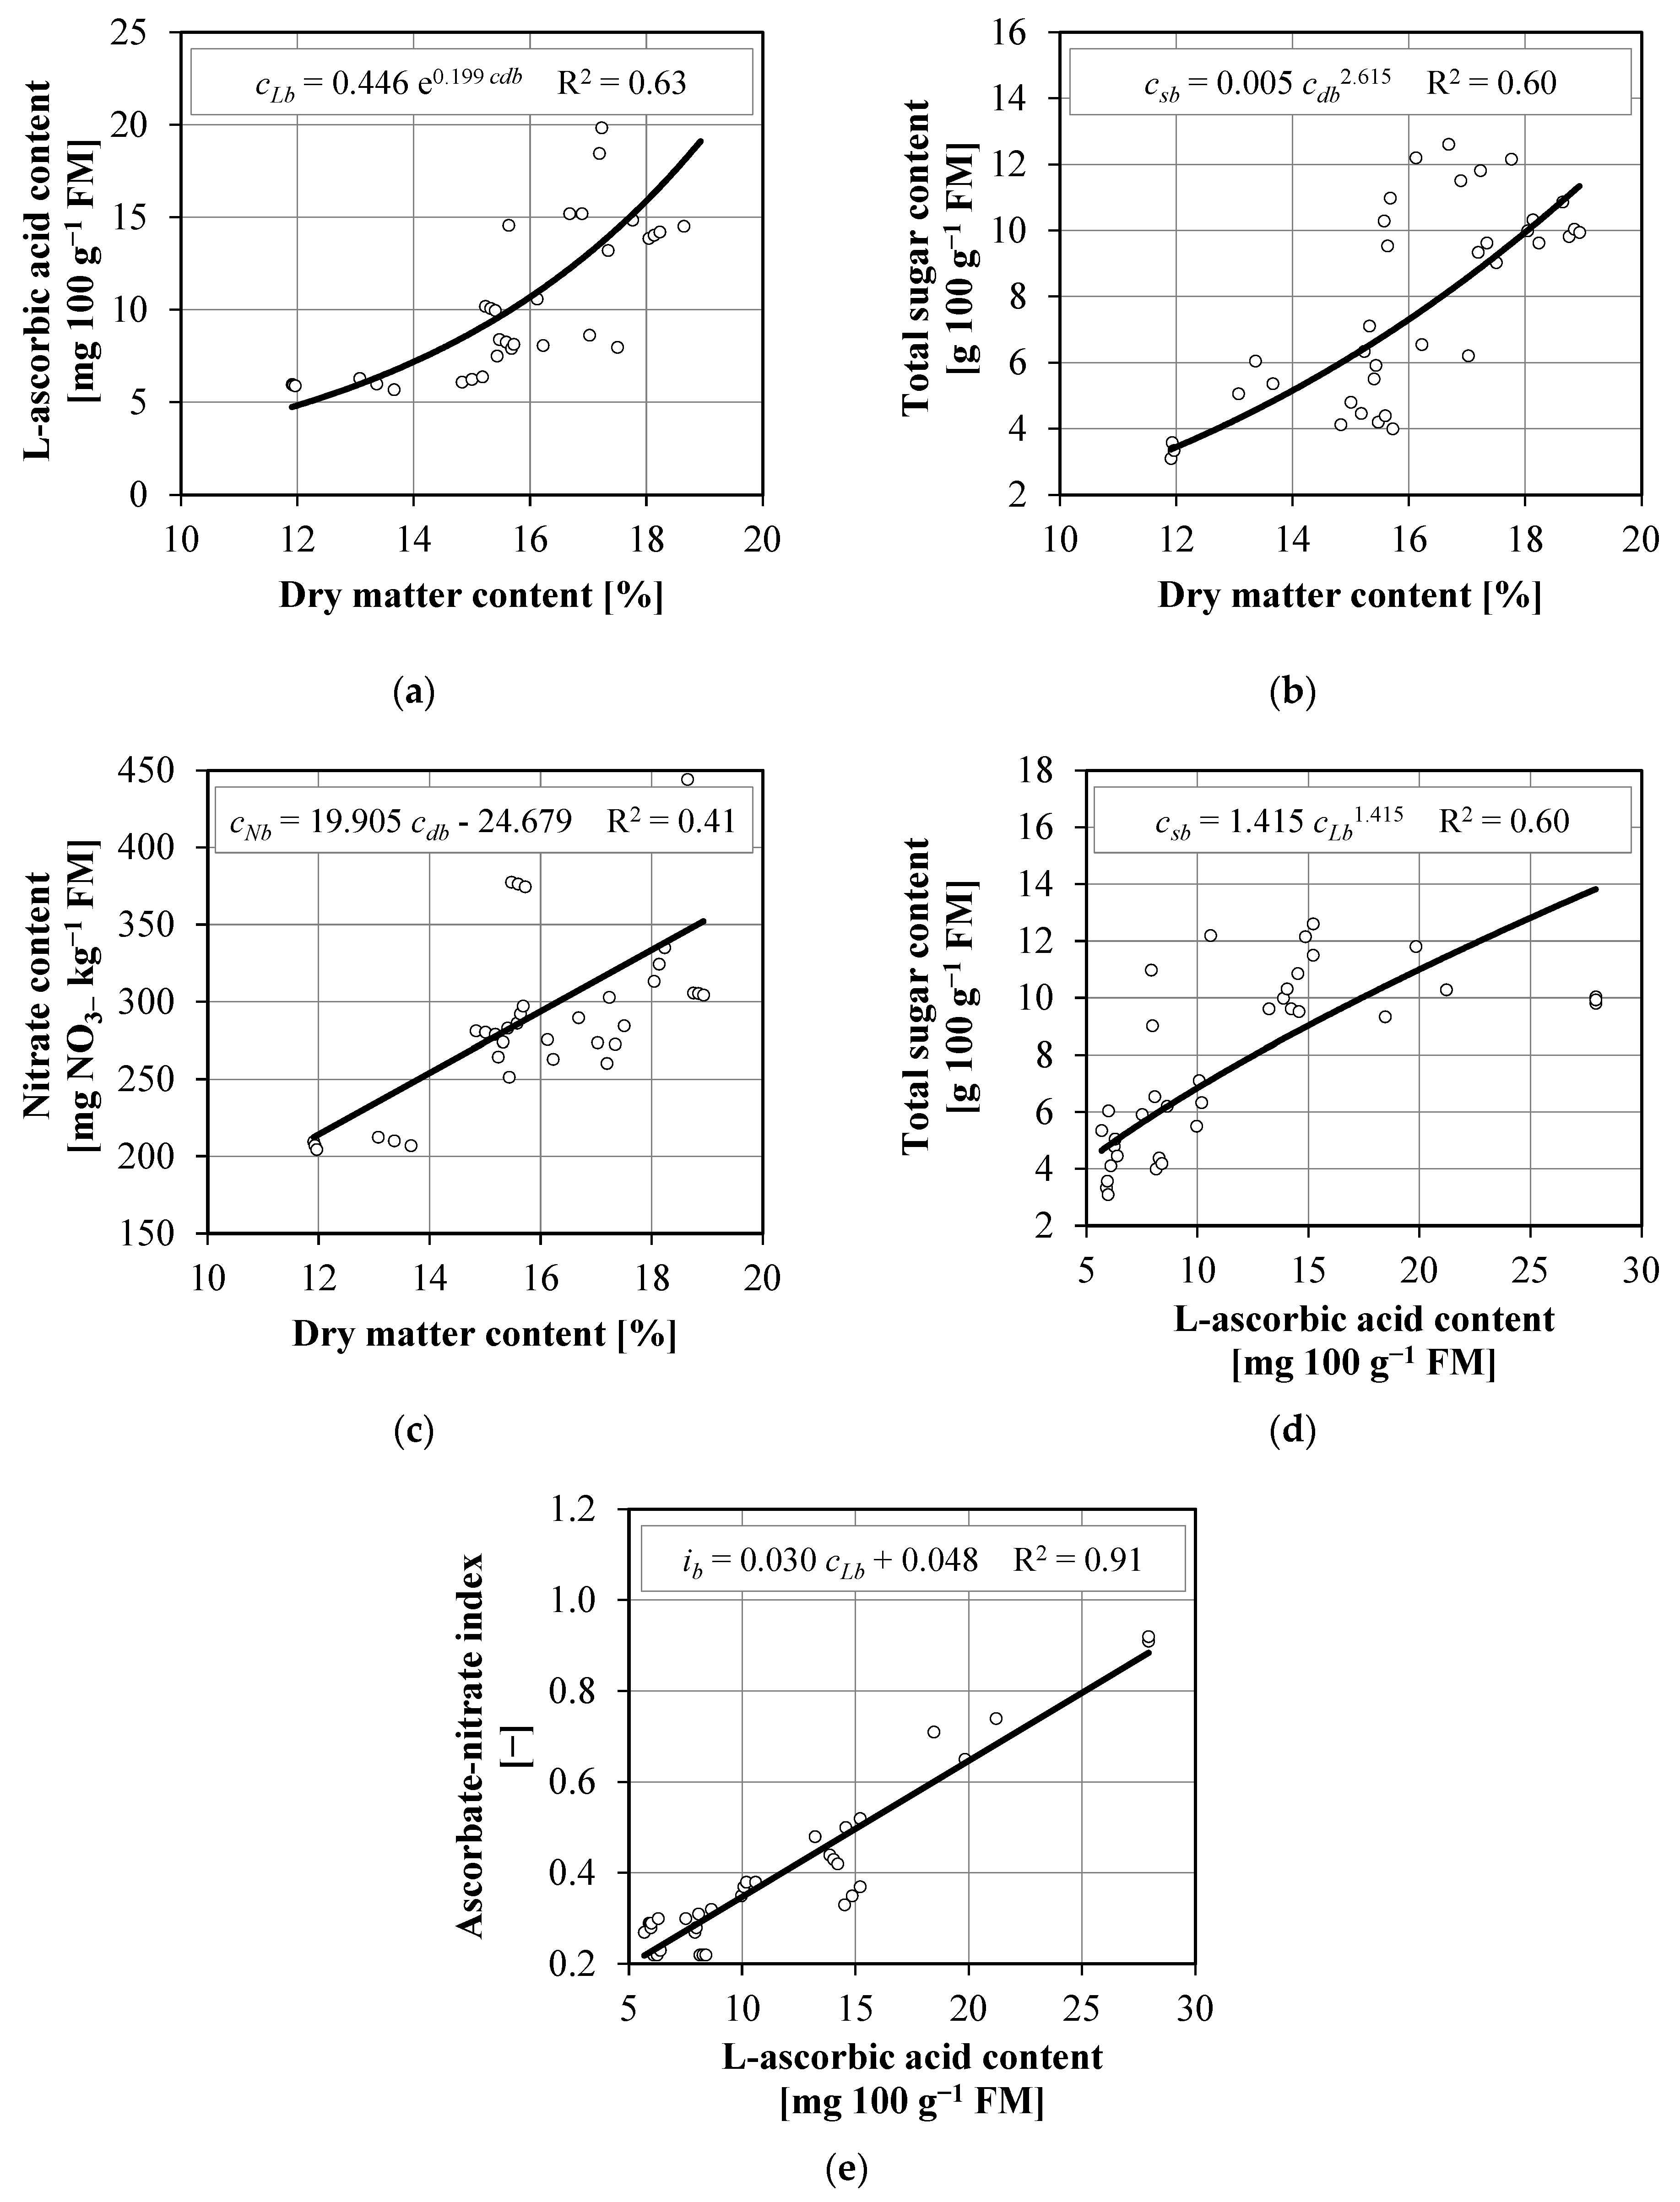
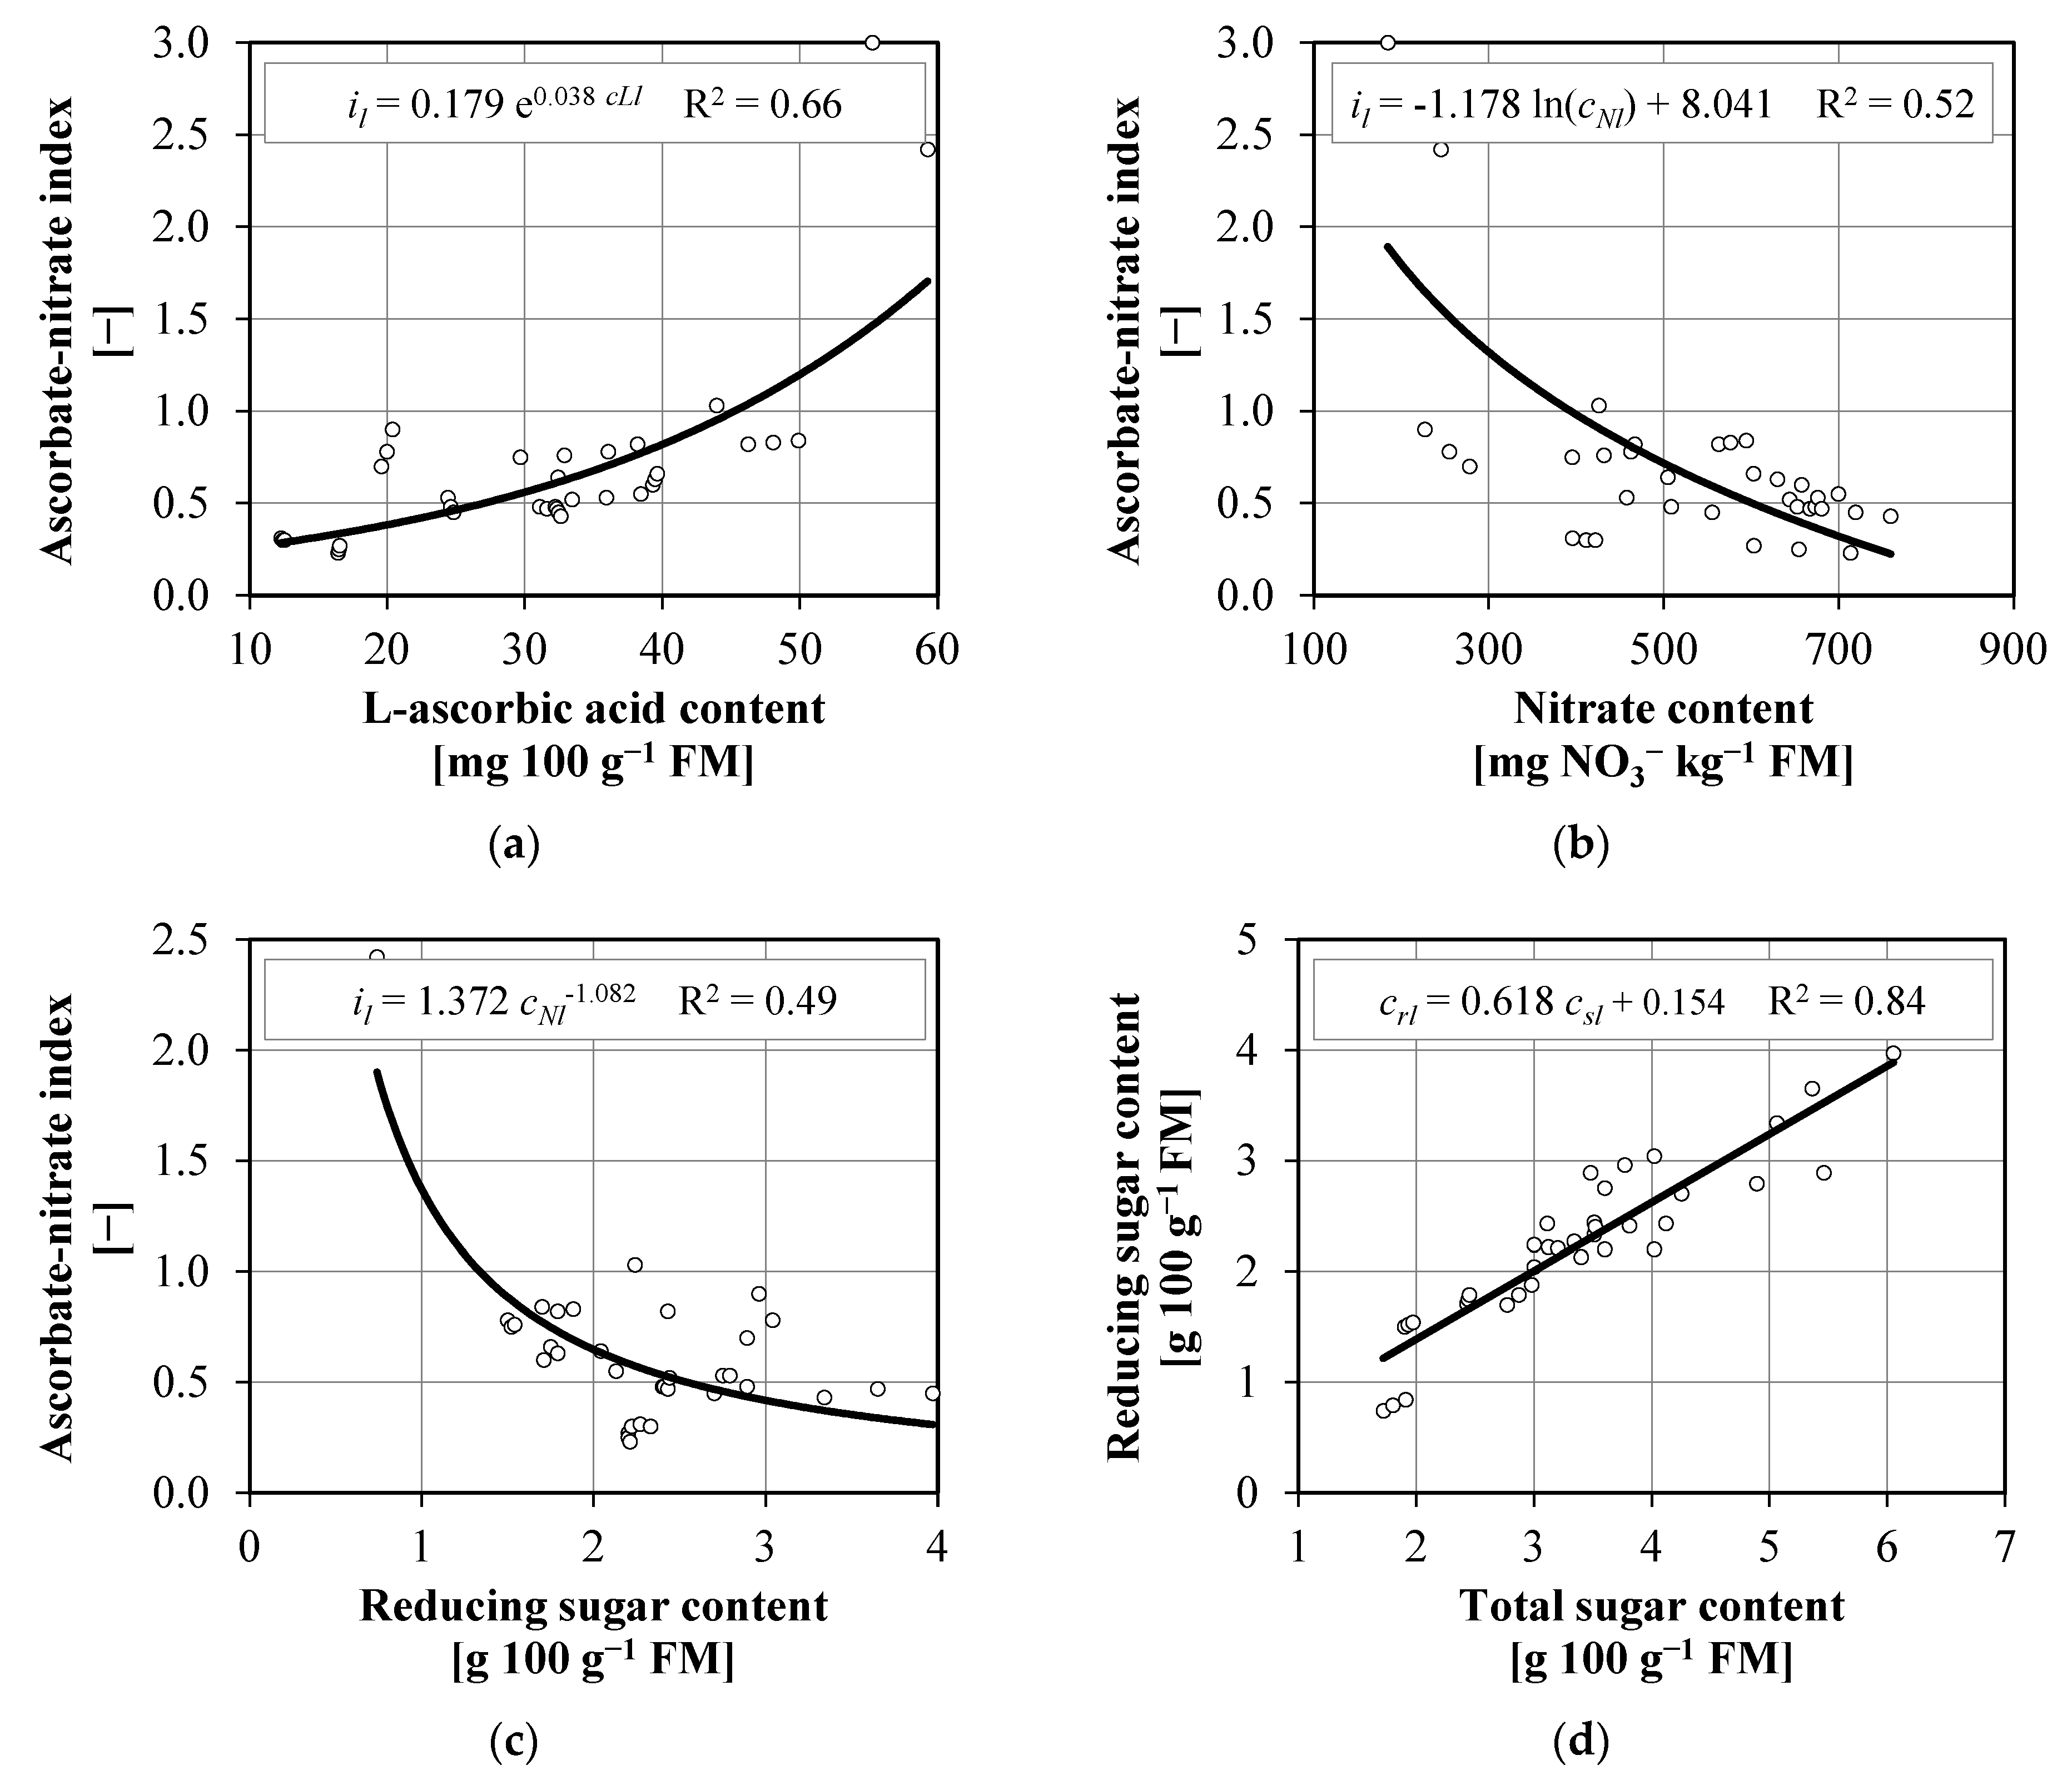
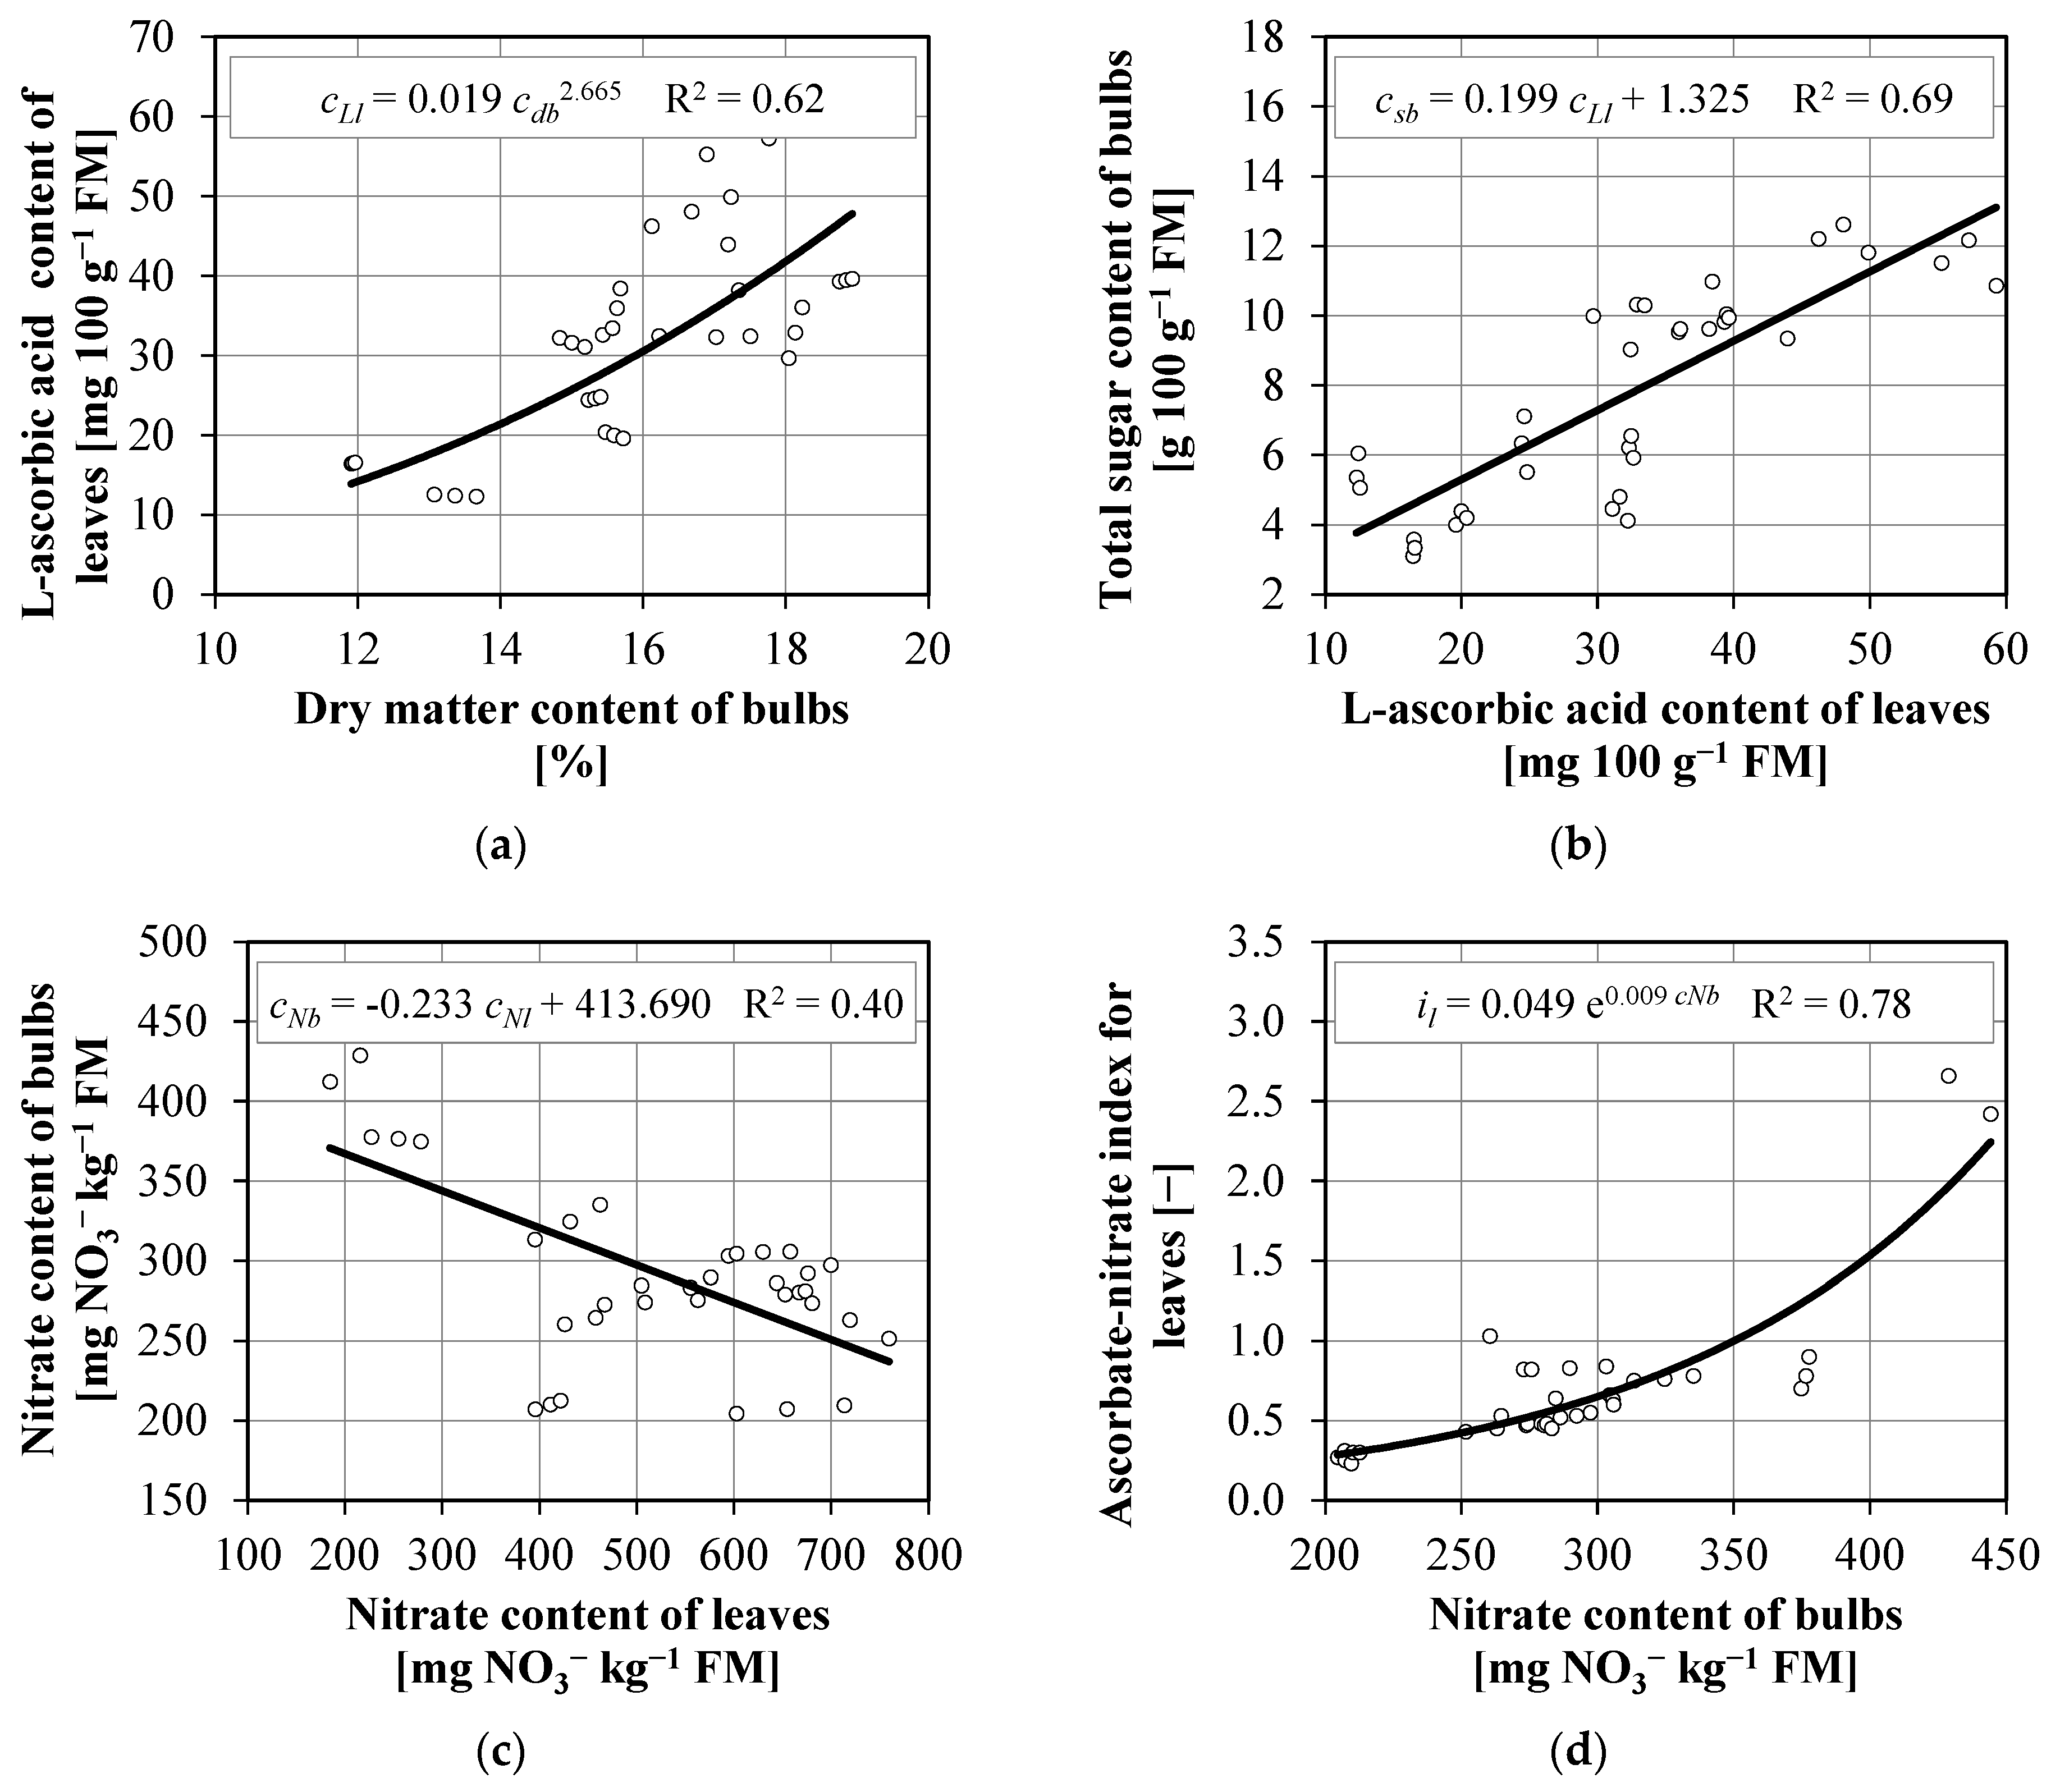
3.4. Correlations between the Analyzed Parameters

The results of a correlation analysis of the morphological parameters of shallot plants across treatments are presented in Table 10.
Significant correlations were noted in 15 cases out of 60 comparisons, and the highest coefficient of correlation (0.90) was found between the number of leaves and cluster mass in control plants. In all groups, the correlation coefficient exceeded the critical value (0.58) only for the relationship between leaf greenness (SPAD) and the proportion of leaves in the yield. The coefficient of correlation between these two parameters was highest (0.66). An increase in leaf greenness (SPAD) from around 62 to around 110 was accompanied by an increase in the proportion of leaves in the yield from around 48% to around 70% on average (Figure 5a). The above confirms that plants grown in fertile soil under favorable weather conditions produce higher yields, in this case a higher number of leaves relative to cluster mass. The minimum value of the determination coefficient in the regression model was also obtained for the relationship between the number of leaves and cluster mass (Figure 5b). This is logical, because the higher the aerial biomass, the higher the total plant mass. The regression equation derived in this study can be used to predict the cluster mass of shallot plants based on the number of leaves before harvest. For instance, shallot plants with 12 and 41 leaves had a cluster mass of around 38 g and 80 g, respectively.
The results of a correlation analysis of the chemical composition of shallot bulbs and leaves across treatments are presented in Table 11. Significant correlations (critical value of 0.58) were noted in 46 cases out of 66 comparisons in the control group, in 28 cases in the EM group, and in 33 cases in the GG group. This indicates that the standard relationships between the chemical properties of shallot bulbs and leaves were somewhat disrupted by the application of biostimulants, in particular 1% EM. The highest coefficients of correlation were found between the L-ascorbic acid content of bulbs and the ascorbate-nitrate index for bulbs (0.99) in groups C and EM, and between the total sugar content and reducing sugar content of leaves (0.98) in group GG. In all groups, the nature of significant relationships between chemical composition parameters was similar in 15 cases; the ascorbate-nitrate index for leaves was most frequently correlated (25 cases), and the nitrate content of leaves was least frequently correlated (7 cases) with the remaining chemical composition parameters of shallot bulbs and leaves.
When all groups were analyzed, significant correlations (critical value of 0.33) were noted in 51 cases out of 66 comparisons, and the highest coefficient of correlation (0.95) was found between the L-ascorbic acid content of bulbs and the ascorbate-nitrate index for bulbs. The minimum value of the determination coefficient was obtained in 13 regression equations.
The correlations between the chemical composition parameters of shallot bulbs are presented in Figure 6. An increase in their dry matter content from around 12% to around 19% was accompanied by an increase in their L-ascorbic acid content—by around 300% (from approx. 4.8 mg 100 g−1 FM to approx. 19.2 mg 100 g−1 FM—Figure 6a), total sugar content—by around 230% (from approx. 3.3 g 100 g−1 FM to approx. 10.9 g 100 g−1 FM—Figure 6b), and nitrate content—by around 66% (from approx. 212 mg NO3 kg−1 FM to approx. 352 mg NO3 kg−1 FM—Figure 6c).
The higher the L-ascorbic acid content of shallot bulbs, the higher their total sugar content and ascorbate-nitrate index. Therefore, an increase in L-ascorbic acid content by around 390% led to an increase in total sugar content—by around 194% (from approx. 4.7 g 100 g−1 FM to approx. 13.8 g 100 g−1 FM—Figure 6d), and the ascorbate-nitrate index—by around 305% (from approx. 0.22 to approx. 0.89—Figure 6e).
The correlations between the chemical composition parameters of shallot leaves are presented in Figure 7. The ascorbate-nitrate index was correlated with the L-ascorbic acid content, nitrate content and reducing sugar content of leaves—a higher value of this index was correlated with higher L-ascorbic acid content, and with lower nitrate content and reducing sugar content. When the ascorbate-nitrate index increased from around 0.3 to 1.9, L-ascorbic acid content increased by around 380% (from approx. 12.3 mg 100 g−1 FM to approx. 59.3 mg 100 g−1 FM—Figure 7a), whereas nitrate content decreased by around 76% (from approx. 760 mg NO3 kg−1 FM to approx. 185 mg NO3 kg−1 FM—Figure 7b) and reducing sugar content decreased by around 83% (from approx. 4.0 g 100 g−1 FM to approx. 0.7 g 100 g−1 FM—Figure 7c). The highest value of the determination coefficient was noted for the relationship between the total sugar content and reducing sugar content of leaves (0.84—Figure 7d). An increase in total sugar content (by around 260%, from approx. 1.7 g 100 g−1 FM to approx. 6.1 g 100 g−1 FM) was accompanied by a proportional increase in reducing sugar content (by around 225%, from approx. 1.2 g 100 g−1 FM to approx. 3.9 g 100 g−1 FM).
The correlations between the chemical composition parameters of shallot bulbs and leaves are presented in Figure 8. An increase in the dry matter content of bulbs (by approx. 60%) was accompanied by an increase in the L-ascorbic acid content of leaves (by approx. 240%) (Figure 8a). When the L-ascorbic acid content of leaves increased from around 12.3 mg 100 g−1 FM to around 59.3 mg 100 g−1 FM (by approx. 380%), the total sugar content of bulbs increased proportionally from around 3.8 g 100 g−1 FM to around 13.1 g 100 g−1 FM (by approx. 245%) (Figure 8b). The nitrate content of bulbs was inversely proportional to the nitrate content of leaves (Figure 8c). Therefore, an increase in the nitrate content of leaves by around 330% led to an approximately 40% decrease in the nitrate content of bulbs. In turn, an increase in the nitrate content of bulbs from around 205 mg NO3 kg−1 FM to around 444 mg NO3 kg−1 FM (by approx. 117%) caused an increase in the ascorbate-nitrate index for leaves from around 0.3 to around 2.3 (by approx. 670%) (Figure 8d).

4. Conclusions

Shallot leaves had a higher content of L-ascorbic acid, reducing sugars and nitrates than bulbs. Young bulbs had a higher content of DM and total sugars than leaves. The leaves and bulbs of shallot plants treated with EM accumulated the highest amounts of minerals. Macronutrient ratios were closer to optimal in shallot leaves than bulbs. The nitrate content of bulbs was inversely proportional to the nitrate content of leaves. Therefore, an increase in the nitrate content of leaves by around 330% led to an approximately 40% decrease in the nitrate content of bulbs. The use of biostimulants in the cultivation of A. cepa L. Aggregatum group contributed to the reduction of L-ascorbic acid content in bulbs and had no positive effect on the leaves. Moreover, no positive effect of biostimulants on the reduction of nitrate content in shallot leaves and bulbs was observed, which is undesirable from a consumer’s perspective. After the use of biopreparations, the yield of shallots was lower than that of the control—by approx. 14% (EM) and approx. 4% (GG). Therefore, the measurable benefits of biostimulants in the cultivation of shallots grown for early bunch harvest do not balance the costs of their purchase and use.

Author Contributions

Conceptualization, A.F.; methodology, A.F., Z.K. and J.M.-G.; software, Z.K.; validation, A.F. and Z.K.; formal analysis, A.F. and Z.K.; investigation, A.F., J.M.-G. and K.J.; resources, A.F. and J.M.-G.; data curation, A.F.; writing—original draft preparation, A.F. and Z.K.; writing—review and editing, A.F. and Z.K.; visualization, Z.K. and A.F.; supervision, A.F.; project administration, A.F.; funding acquisition, A.F. and K.J. All authors have read and agreed to the published version of the manuscript.

Funding

The results presented in this paper were obtained as part of a comprehensive study of the University of Warmia and Mazury in Olsztyn (grant No. 30.610.016-110). The project was financially supported by the Minister of Education and Science under the program entitled “Regional Initiative of Excellence” for the years 2019–2022, Project No. 010/RID/2018/19, amount of funding PLN 12 000 000.

Institutional Review Board Statement

Not applicable.

Informed Consent Statement

Not applicable.

Data Availability Statement

Not applicable.

Conflicts of Interest

The authors declare no conflict of interest.

References

  1. Fritsch, R.M.; Friesen, N. Evolution, domestication and taxonomy. In Allium Crop Science: Recent Advances; Rabinowitch, H.D., Currah, L., Eds.; CABI: New York, NY, USA, 2002; pp. 5–30. [Google Scholar]
  2. Rabinowitch, I.; Kamenetsky, R. Shallot (Allium cepa, Aggregatum group). In Allium Crop Science: Recent Advances; Rabinowitch, H.D., Currah, L., Eds.; CABI: New York, NY, USA, 2002; pp. 409–430. [Google Scholar]
  3. FAO. World Food and Agriculture—Statistical Yearbook 2021. Available online: https://www.fao.org/3/cb4477en/cb4477en.pdf (accessed on 19 March 2022).
  4. Jadczak, D.; Wójcik-Stopczyńska, B. Influence of plant covering on some organic compound content and pungency of shallot grown for bunching harvest. Veget. Crops Res. Bull. 2007, 66, 25–30. [Google Scholar] [CrossRef]
  5. Mysiak, B.; Tendaj, M. Content of phenolic acids in edible parts of some species grown for the green bunching. Acta Sci. Pol. Hortorum Cultus 2008, 7, 57–62. [Google Scholar]
  6. Major, N.; Goreta Ban, S.; Urlić, B.; Ban, D.; Dumičić, G.; Perković, J. Morphological and Biochemical Diversity of Shallot Landraces Preserved Along the Croatian Coast. Front. Plant Sci. 2018, 9, 1749. [Google Scholar] [CrossRef] [PubMed]
  7. Putri, F.; Arifin Aziz, S.; Andarwulan, N.; Melati, M.; Suwarto, S. Leaf Pigment, Phenolic Content, and Production of Green Shallot of Five Different Shallot Varieties. Planta Tropika: Jurnal Agrosains. J. Agro Sci. 2021, 9, 48–57. [Google Scholar] [CrossRef]
  8. Slimestad, R.; Fossen, T.; Vågen, I.M. Onions: A source of unique dietary flavonoids. J. Agric. Food Chem. 2007, 55, 10067–10080. [Google Scholar] [CrossRef]
  9. Selladurai, R.; Purakayastha, T.J. Effect of humic acid multinutrient fertilizers on yield and nutrient use efficiency of potato. J. Plant Nutr. 2016, 39, 949–956. [Google Scholar] [CrossRef]
  10. Rouphael, Y.; Giordano, M.; Cardarelli, M.; Cozzolino, E.; Mori, M.; Kyriacou, M.C.; Bonini, P.; Colla, G. Plant- and Seaweed-Based Extracts Increase Yield but Differentially Modulate Nutritional Quality of Greenhouse Spinach through Biostimulant Action. Agronomy 2018, 8, 126. [Google Scholar] [CrossRef] [Green Version]
  11. Sible, C.N.; Seebauer, J.R.; Below, F.E. Plant Biostimulants: A Categorical Review, Their Implications for Row Crop Production, and Relation to Soil Health Indicators. Agronomy 2021, 11, 1297. [Google Scholar] [CrossRef]
  12. Maciejewski, T.; Szukała, J.; Jarosz, A. Influence of biostimulator Asahi SL i Atonik SL on qualitative tubers of potatoes. J. Res. Appl. Agric. Eng. 2007, 52, 109–112. [Google Scholar]
  13. Matysiak, K.; Kaczmarek, S.; Kierzek, R. Effect of algae Ecklonia maxima (Kelpak SL) on winter oilseed rape. Rośl. Oleiste-Oilseed Crops 2012, 33, 81–88. [Google Scholar] [CrossRef]
  14. Du Jardin, P. Plant biostimulants: Definition, concept, main categories and regulation. Sci. Hortic. 2015, 196, 3–14. [Google Scholar] [CrossRef] [Green Version]
  15. Higa, T. Technology application in agriculture and environment protection. In Proceedings of the 38 International. Microbiological Symposium Effective Microorganisms (EM) in Sustainable Agriculture and Environmental Protection, SGGW, Rogów, Poland, 1–3 June 2003; pp. 17–18. [Google Scholar]
  16. Halpern, M.; Bar-Tal, A.; Ofek, M.; Minz, D.; Muller, T.; Yermiyahu, U. The use of biostimulants for enhancing nutrient uptake. Adv. Agron. 2015, 129, 141–174. [Google Scholar]
  17. Goñi, O.; Quille, P.; O’Connell, S. Seaweed Carbohydrates. In The Chemical Biology of Plant Biostimulants; Geelen, D., Xu, L., Stevens, C.V., Eds.; John Wiley & Sons: Hoboken, NJ, USA, 2020; pp. 57–95. [Google Scholar]
  18. Stirk, W.A.; Rengasamy, K.R.R.; Kulkarni, M.G.; van Staden, J. Plant Biostimulants from Seaweed: An Overview. Chem. Biol. Plant Biostimul. 2020, 2, 31–55. [Google Scholar]
  19. Van Vliet, P.C.J.; Bloem, J.; De Goede, R.G.M. Microbial diversity, nitrogen loss and grass production after addition of effective microorganisms (EM) to slurry manure. Appl. Soil Ecol. 2006, 32, 188–198. [Google Scholar] [CrossRef]
  20. Sabeti, Z.; Armin, M.; Kakhki, M.R.V. Investigation of effective microorganisms application method on alleviation of stress effects on root morphology of sweet corn. Ratar. I Povrt. 2017, 54, 48–55. [Google Scholar] [CrossRef] [Green Version]
  21. Lack, S.; Ghooshchi, F.; Hadi, H. The effect of crop growth enhancer bacteria onyield and yield components of safflower (Carthamus tinctorius L.). Int. J. Farm. Allied Sci. 2013, 2, 809–815. [Google Scholar]
  22. Malik, A.; Mor, V.S.; Tokas, J.; Punia, H.; Malik, S.; Malik, K.; Sangwan, S.; Tomar, S.; Singh, P.; Singh, N.; et al. Biostimulant-Treated Seedlings under Sustainable Agriculture: A Global Perspective Facing Climate Change. Agronomy 2021, 11, 14. [Google Scholar] [CrossRef]
  23. WRB. World Reference Base for Soil Resources; World Soil Resources Reports No. 106; FAO: Rome, Italy, 2014; Available online: http://www.fao.org/3/i3794en/I3794en.pdf (accessed on 20 July 2021).
  24. PN-A-75050:1972; Fruit and Vegetable Products, Wines and Meads—Sampling. Polish Committee for Standardization: Warsaw, Poland, 1972.
  25. EN 12145:1996; Fruit and Vegetable Juices—Determination of Total Dry Matter—Gravimetric Method with Loss of Mass on Drying. European Committee for Standardization: Brussels, Belgium, 1996.
  26. PN-A-75101-07:1990; Fruit and Vegetable Products—Sample Preparation and Methods of Physicochemical Analyses—Determination of Sugar Content and Non-Sugar Extract Content. Polish Committee for Standardization: Warsaw, Poland, 1990.
  27. PN-A-04019:1998; Food Products—Determination of Vitamin C Content. Polish Committee for Standardization: Warsaw, Poland, 1998.
  28. Krauze, A.; Domska, D. Ćwiczenia Specjalistyczne z Chemii Rolnej [Specialist Exercises in Agricultural Chemistry]; ART: Olsztyn, Poland, 1991; pp. 64–65. (In Polish) [Google Scholar]
  29. Lachman, J.; Orsak, M.; Pivec, V. Ascorbate-nitrate index as a factor characterizing the quality of vegetables. Chem. List. 1997, 91, 708–709. [Google Scholar]
  30. TIBCO Software Inc. Statistica (Data Analysis Software System, Palo Alto, USA). Version 13.3. 2017. Available online: https://docs.tibco.com/products/tibco-statistica-13-3-0 (accessed on 15 May 2021).
  31. Gajc-Wolska, K.; Kowalczyk, K.; Nowecka, M.; Mazur, K.; Metera, A. Effect of organic-mineral fertilizers on the yield and quality of endive (Cichorium endivia L.). Acta Sci. Pol. Hortorum Cultus 2012, 11, 189–200. [Google Scholar]
  32. Marcinek, B.; Hetman, J. The effect of foliage feeding on the structure of yield, dry weight content and macroelements in the corms of Sparaxis tricolor Ker-Gawl. Acta Sci. Pol. Hortorum Cultus 2008, 7, 89–99. [Google Scholar]
  33. Grajkowski, J.; Ochmian, I. Influence of three biostymulants on yielding and fruit quality of three primocane raspberry cultivars. Acta Sci. Pol. Hortorum Cultus 2007, 6, 29–36. [Google Scholar]
  34. Hussein, K.A.; Joo, J.H. Effects of several Effective Microorganisms (EM) on the growth of Chinese cabbage (Brassica rapa). Korean Soc. Soil Sci. Fert. 2011, 44, 565–574. [Google Scholar] [CrossRef] [Green Version]
  35. Shaheen, S.; Khan, M.; Khan, M.J.; Jilani, S.; Bibi, Z.; Munir, M.; Kiran, M. Effective Micro-organisms (EM) co-applied with organic wastes and NPK stimulate the growth, yield and quality of spinach (Spinacia oleracea L.). Sarhad J. Agric. 2017, 33, 30–41. [Google Scholar] [CrossRef]
  36. Marschner, P. Plant-microbe interactions in the rhizosphere and nutrient cycling. Soil Biol. 2007, 10, 159–182. [Google Scholar] [CrossRef]
  37. Xu, H.-L.; Wang, R.; Mridha, M.A.U. Effects of organic fertilizers and a microbial inoculant on leaf photosynthesis and fruit yield and quality of tomato plants. J. Crop Prod. 2001, 3, 173–182. [Google Scholar] [CrossRef]
  38. Michalski, P. The effect of TytanitR on the yield structure and the fruit size of strawberry ‘Senga Sengana’ and ‘Elsanta’ cv. Ann. UMCS Agric. 2008, 63, 109–118. [Google Scholar] [CrossRef]
  39. Mikulewicz, E.; Majkowska-Gadomska, J.; Jadwisieńczak, K.; Francke, A. Effect of selected biostimulants on the yield and quality of the common onion (Allium cepa L.). Acta Agroph. 2019, 26, 57–65. [Google Scholar] [CrossRef]
  40. Majkowska-Gadomska, J.; Jadwisieńczak, K.; Francke, A.; Kaliniewicz, Z. Effect of Biostimulants on the Yield and Quality of Selected Herbs. Appl. Sci. 2022, 12, 1500. [Google Scholar] [CrossRef]
  41. Thevanathan, R.A.; Dinamani, D.S.; Bhavani, L.G. Studies on the impact of application of marine algal manure and liquid fertiliser on the linear growth of the seedlings of some pulses. Seaweed Res. Util. 2005, 27, 125–133. [Google Scholar]
  42. Bai, R.N.; Banu, N.R.L.; Prakash, J.W.; Goldi, S.J. Effects of Asparagopsis taxiformis extract on the growth and yield of Phaseolus aureus. J. Basic Appl. Biol. 2007, 1, 6–11. [Google Scholar]
  43. Abbas, M.; Anwar, J.; Zafar-ul-Hye, M.; Iqbal Khan, R.; Saleem, M.; Rahi, A.A.; Danish, S.; Datta, R. Effect of Seaweed Extract on Productivity and Quality Attributes of Four Onion Cultivars. Horticulturae 2020, 6, 28. [Google Scholar] [CrossRef]
  44. Szczepanek, M.; Wszelaczyńska, E.; Pobereżny, J.; Ochmian, I. Response of onion (Allium cepa L.) to the method of sea-weed biostimulant application. Acta Sci. Pol. Hortorum Cultus 2017, 16, 113–122. [Google Scholar]
  45. Hidangmayum, A.; Sharma, R. Effect of different concentrations of commercial seaweed liquid extract of Ascophyllum nodosum as a plant bio stimulant on growth, yield and biochemical constituents of onion (Allium cepa L.). J. Pharmacogn. Phytochem. 2017, 6, 658–663. [Google Scholar]
  46. Sulakhudin, U.; Hatta, M.; Suryadi, U.D. Application of Coastal Sediments and Foliar SeaweedExtract and Its Influence to Soil Properties, Growth and Yield of Shallot in Peatland. AGRIVITA J. Agric. Sci. 2019, 42, 1–2. [Google Scholar] [CrossRef]
  47. Kapczyńska, A.; Kowalska, I.; Prokopiuk, B.; Pawłowska, B. Rooting Media and Biostimulator Goteo Treatment Effect the Adventitious Root Formation of Pennisetum ‘Vertigo’ Cuttings and the Quality of the Final Product. Agriculture 2020, 10, 570. [Google Scholar] [CrossRef]
  48. Rosłon, W.; Osińska, E.; Bączek, K.; Węglarz, Z. The influence of organic-mineral fertilizers on field and raw materials quality of chosen plants of the Lamiaceae family from organic cultivation. Acta Sci. Pol. Hortorum Cultus 2011, 10, 147–158. [Google Scholar]
  49. Frąszczak, B.; Kleiber, T.; Klama, J. Impact of effective microorganisms on yields and nutrition of sweet basil (Ocimum basilicum L.) and microbiological properties of the substrate. Afr. J. Agric. Res. 2012, 7, 5756–5765. [Google Scholar] [CrossRef]
  50. Majkowska-Gadomska, J.; Dobrowolski, A.; Jadwisieńczak, K.K.; Kaliniewicz, Z.; Francke, A. Effect of biostimulants on the growth, yield and nutritional value of Capsicum annuum grown in an unheated plastic tunnel. Sci. Rep. 2021, 11, 22335. [Google Scholar] [CrossRef]
  51. Chen, D.; Zhou, W.; Yang, J.; Ao, J.; Huang, Y.; Shen, D.; Jiang, Y.; Huang, Z.; Shen, H. Effects of Seaweed Extracts on the Growth, Physiological Activity, Cane Yield and Sucrose Content of Sugarcane in China. Front. Plant Sci. 2021, 12, 659130. [Google Scholar] [CrossRef]
  52. Kleiber, T.; Starzyk, J.; Bosiacki, M. Effect of nutrient solution, effective microorganisms (EM-A), and assimilation illumination of plants on the induction of the growth of lettuce (Lactuca sativa L.) in hydroponic cultivation. Acta Agrobot. 2013, 66, 27–38. [Google Scholar] [CrossRef] [Green Version]
  53. Radkowski, A.; Radkowska, I. Influence of effective microorganisms on the dry matter yield and chemical composition of meadow vegetation. J. Elem. 2018, 23, 509–520. [Google Scholar] [CrossRef]
  54. Godlewska, K.; Pacyga, P.; Michalak, I.; Biesiada, A.; Szumny, A.; Pachura, N.; Piszcz, U. Systematic Investigation of the Effects of Seven Plant Extracts on the Physiological Parameters, Yield, and Nutritional Quality of Radish (Raphanus sativus var. sativus). Front. Plant Sci. 2021, 12, 651152. [Google Scholar] [CrossRef] [PubMed]
  55. Majkowska-Gadomska, J.; Mikulewicz, E.; Jadwisieńczak, K.; Francke, A.; Młyńska, K. The influence of amino acid biostimulators on the size and quality of garlic (Allium sativum L.). Acta Agroph 2019, 26, 31–38. [Google Scholar] [CrossRef]
  56. Commission Regulation (EU). No. 1258/2011 of 2 December 2011 amending Regulation (EC) No. 1881/2006 as regards maximum levels for nitrates in foodstuffs. Off. J. Eur. Union 2011, 12, 320. [Google Scholar]
  57. Jurga, B.; Kocoń, A. Czynniki wpływające na zawartość azotanów (V) i azotanów (III) w roślinach [Factors influencing the content of nitrates (V) and nitrates (III) in plant]. Studia I Rap. IUNG-PIB 2013, 34, 47–56. (In Polish) [Google Scholar]
  58. Pokluda, R. An assessment of the nutritional value of vegetables using an ascorbate-nitrate index. Veget. Crops Res. Bull. 2006, 64, 29–37. [Google Scholar]
  59. Muráriková, A.; Neugebauerová, J. Seasonal variation of ascorbic acid and nitrate levels in selected basil (Ocimum basilicum L.) varieties. Hort. Sci. 2018, 45, 47–52. [Google Scholar] [CrossRef] [Green Version]
  60. Wadas, W.; Łęczycka, T.; Borysiak-Marciniak, I. Effect of fertilization with multinutrient complex fertilizers on tuber quality of very early potato cultivars. Acta Sci. Pol. Hortorum Cultus 2012, 11, 27–41. [Google Scholar]
  61. Wadas, W.; Raczuk, J. Assessment of the nutritional safety of new potatoes imported to Poland using an ascorbate-nitrate index. Rocz. Panstw. Zakł Hig. 2018, 69, 243–249. [Google Scholar]
  62. Grusak, M.A. Enhancing mineral content in plant food products. J. Am. Coll. Nutr. 2002, 21, 178S–183S, 330. [Google Scholar] [CrossRef]
  63. Skubij, N.; Dzida, K.; Jarosz, Z.; Pitura, K.; Jaroszuk-Sierocińska, M. Nutritional value of savory herb (Satureja hortensis L.) and 334 plant response to variable mineral nutrition conditions in various phases of development. Plants 2020, 9, 706. [Google Scholar] [CrossRef] [PubMed]
  64. Kleiber, T.; Starzyk, J.; Górski, R.; Sobieralski, K.; Siwulski, M.; Rempulska, A.; Sobiak, A. The studies on applying of effective microorganisms (EM) and CRF on nutrient contents in leaves and yielding of tomato. Acta Sci. Pol. Hort. Cult. 2014, 13, 79–90. [Google Scholar]
  65. Majkowska-Gadomska, J.; Arcichowska-Pisarska, K. The effect of Polimag S fertilizer on the macronutrient content of the edible parts of three welsh onion (Allium fistulosum L.) cultivars. J. Elem. 2014, 19, 709–722. [Google Scholar] [CrossRef]
  66. Krzywy, J.; Baran, S.; Krzywy, E. The influence of fertilizers in shaping relations ion K:Mg. K:(Mg+Ca). Ca:P and N:S in cultivated plants. Zesz. Probl. Post. Nauk Rol. 2002, 484, 317–323. (In Polish) [Google Scholar]
  67. Jarnuszewski, G.; Meller, E. Mineral element ratios in plants grown on post-bog soils fertilised with zinc and copper. Folia Pomer. Univ. Technol. Stetin. Agric. Aliment. Piscaria Zootech. 2013, 304, 25–32, (In Polish with English summary). [Google Scholar]
  68. Rosanoff, A.; Capron, E.; Barak, P.; Mathews, B.; Nielsen, F. Edible plant tissue and soil calcium: Magnesium ratios: Data too sparse to assess implications for human health. Crop Pasture Sci. 2015, 66, 1265–1277. [Google Scholar] [CrossRef]
  69. Pitura, K.; Michałojć, Z. Influence of nitrogen doses on the chemical composition and proportions of nutrients in selected vegetable species. J. Elem. 2015, 20, 667–676. [Google Scholar]
  70. Francke, A.; Młyńska, K.; Majkowska-Gadomska, J. Effect of the type of substrate on concentrations of macronutrients and micronutrients in leaves of mizuna grown in containers. J. Elem. 2021, 26, 939–951. [Google Scholar] [CrossRef]
Figure 1. Shallots cvs. Bonilla F1 and Matador F1 grown for bunch harvest.
Agronomy 12 01156 g001
Figure 2. Marketable yield of shallots. Means followed by different letters are significantly different for each parameter. C—control treatment, EM—1% solution of Effective Microorganisms, GG—0.1% solution of Goëmar Goteo.
Agronomy 12 01156 g002
Figure 3. Chemical composition of shallot bulbs. Means followed by different letters are significantly different for each parameter. C—control treatment, EM—1% solution of Effective Microorganisms, GG—0.1% solution of Goëmar Goteo.
Agronomy 12 01156 g003aAgronomy 12 01156 g003b
Figure 4. Chemical composition of shallot leaves. Means followed by different letters are significantly different for each parameter. C—control treatment, EM—1% solution of Effective Microorganisms, GG—0.1% solution of Goëmar Goteo.
Agronomy 12 01156 g004aAgronomy 12 01156 g004b
Figure 5. Correlations between the morphological parameters of shallot plants: (a) leaf greenness and proportion of leaves in the yield, (b) number of leaves and cluster mass.
Agronomy 12 01156 g005
Figure 6. Correlations between the chemical composition parameters of shallot bulbs: (a) dry matter content and L-ascorbic acid content, (b) dry matter content and total sugar content, (c) dry matter content and nitrate content, (d) L-ascorbic acid content and total sugar content, (e) L-ascorbic acid content and ascorbate-nitrate index.
Agronomy 12 01156 g006
Figure 7. Correlations between the chemical composition parameters of shallot leaves: (a) L-ascorbic acid content and ascorbate-nitrate index, (b) nitrate content and ascorbate-nitrate index, (c) reducing sugar content and ascorbate-nitrate index, (d) total sugar content and reducing sugar content.
Agronomy 12 01156 g007
Figure 8. Correlations between the chemical composition parameters of shallot bulbs and leaves: (a) dry matter content of bulbs and L-ascorbic acid content of leaves, (b) L-ascorbic acid content of leaves and total sugar content of bulbs, (c) nitrate content of leaves and nitrate content of bulbs, (d) nitrate content of bulbs and ascorbate-nitrate index for leaves.
Agronomy 12 01156 g008
Table 1. Chemical properties of soil.
pH H2OSalt Concentration
[g NaCl dm−3]
N-NO3PKCaMgCl
[mg dm−3]
7.810.75359210520751295
Table 2. Mean air temperature and sum of rainfall during the shallot growing period in 2015–2016.
MonthTemperature [°C]Rainfall [mm]
In Days of MonthMean MonthlyDeviation from Mean 1981–2010In Days of MonthSum MonthlyDeviation from Mean 1981–2010
1–1011–2021–End1–1011–2021–End
2015
April3.56.410.16.7–0.619.59.19.638.23.0
May10.812.612.011.8–1.07.016.76.029.7–28.2
June15.915.515.015.50.00.28.820.529.5–47.4
2016
April 8.18.65.57.40.13.816.48.628.8–6.4
May12.610.717.413.70.91.332.123.556.9–1.0
June15.615.520.317.11.622.915.131.369.3–7.6
Table 3. Morphological parameters and marketable yield of shallots.
FactorSource of VariationY
[t ha−1]
m
[g]
sl
[%]
n
[pcs plant−1]
l
[cm]
S
[-]
Treatment (I)C42.7 ± 7.6 a65.0 ± 16.1 a56.5 ± 12.4 a24 ± 6 a31 ± 5 a88 ± 9 a
EM36.8 ± 3.6 a53.3 ± 10.8 a58.7 ± 6.4 a20 ± 4 a37 ± 5 a81 ± 15 a
GG41.1 ± 8.7 a54.7 ± 11.4 a58.2 ± 9.4 a26 ± 6 a35 ± 8 a84 ± 17 a
p-value0.1210.0680.8390.0590.0990.468
Cultivar (II)Bonilla F142.9 ± 8.0 b57.8 ± 12.6 a62.3 ± 7.7 b24 ± 6 a39 ± 5 b85 ± 13 a
Matador F137.5 ± 5.3 a57.5 ± 15.1 a53.3 ± 9.1 a23 ± 5 a30 ± 4 a83 ± 15 a
p-value0.0250.9520.0030.498<0.0010.706
Year (III)201538.6 ± 7.7 a55.8 ± 15.8 a51.5 ± 8.0 a23 ± 7 a34 ± 7 a73 ± 8 a
201641.8 ± 6.6 a59.5 ± 11.3 a64.1 ± 6.0 b23 ± 5 a34 ± 7 a96 ± 7 b
p-value0.2030.422<0.0010.9550.919<0.001
I × IIp-value0.7850.0030.178<0.0010.1140.964
I × IIIp-value0.1900.5120.2200.9600.9950.006
II × IIIp-value0.0570.7150.9000.8690.9220.278
I × II × IIIp-value<0.0010.8960.0030.6640.9950.349
Means followed by different letters are significantly different for each parameter (level of significance, p-value, is shown in the Table); number of observations per treatment—3. Y—marketable yield, m—cluster mass, sl—proportion of leaves in the yield, n—number of leaves, l—leaf length, S—leaf greenness (SPAD). C—control treatment, EM—1% solution of Effective Microorganisms, GG—0.1% solution of Goëmar Goteo.
Table 4. Chemical composition of shallot bulbs.
FactorSource of VariationcLb
[mg 100 g−1 FM]
cdb
[%]
csb
[g 100 g−1 FM]
crb
[g 100 g−1 FM]
cNb
[mg NO3 kg−1 FM]
ib
[-]
Treatment (I)C15.0 ± 8.1 a17.1 ± 1.5 b8.1 ± 2.0 a1.4 ± 0.5 a292 ± 27 a0.51 ± 0.25 a
EM10.5 ± 5.8 a14.8 ± 1.9 a7.6 ± 3.9 a1.3 ± 0.5 a267 ± 37 a0.38 ± 0.18 a
GG10.6 ± 4.4 a16.0 ± 1.9 ab7.6 ± 3.1 a1.3 ± 0.4 a322 ± 90 a0.34 ± 0.14 a
p-value0.1440.0100.8950.8580.0850.107
Cultivar (II)Bonilla F112.7 ± 8.3 a16.1 ± 1.8 a7.6 ± 2.4 a1.6 ± 0.3 b270 ± 32 a0.45 ± 0.26 a
Matador F111.4 ± 4.0 a15.9 ± 2.1 a7.9 ± 3.6 a1.0 ± 0.4 a317 ± 74 b0.36 ± 0.11 a
p-value0.5620.8050.765<0.0010.0210.172
Year (III)201516.6 ± 6.2 b17.4 ± 1.1 b10.5 ± 1.1 b1.0 ± 0.4 a319 ± 54 b0.53 ± 0.22 b
20167.4 ± 1.6 a14.6 ± 1.5 a5.0 ± 1.2 a1.6 ± 0.4 b268 ± 58 a0.28 ± 0.05 a
p-value<0.001<0.001<0.001<0.0010.011<0.001
I × IIp-value0.2840.2090.9880.252<0.0010.280
I × IIIp-value0.3270.866<0.0010.3180.9620.388
II × IIIp-value0.0860.3660.0030.7340.5170.029
I × II × IIIp-value0.002<0.001<0.001<0.001<0.0010.010
Means followed by different letters are significantly different for each parameter (level of significance, p-value, is shown in the Table); number of observations per treatment—3; FM—fresh matter. cLb—L-ascorbic acid content, cdb—dry matter content, csb—total sugar content, crb—reducing sugar content, cNb—nitrate content, ib—ascorbate-nitrate index. C—control treatment, EM—1% solution of Effective Microorganisms, GG—0.1% solution of Goëmar Goteo.
Table 5. Chemical composition of shallot leaves.
FactorSource of VariationcLl
[mg 100 g−1 FM]
cdl
[%]
csl
[g 100 g−1 FM]
crl
[g 100 g−1 FM]
cNl
[mg NO3 kg−1 FM]
il
[-]
Treatment (I)C32.3 ± 5.7 a9.6 ± 0.8 a3.7 ± 1.6 a2.4 ± 0.9 a572 ± 121 b0.58 ± 0.14 a
EM33.0 ± 11.9 a10.3 ± 0.8 ab3.5 ± 0.4 a2.2 ± 0.3 a643 ± 49 b0.52 ± 0.22 a
GG31.9 ± 18.3 a10.5 ± 0.9 b3.0 ± 0.8 a2.1 ± 0.8 a336 ± 112 a1.16 ± 0.97 b
p-value0.9790.0280.2760.480<0.0010.020
Cultivar (II)Bonilla F131.7 ± 9.6 a10.0 ± 0.7 a3.6 ± 1.0 a2.5 ± 0.6 a594 ± 120 b0.54 ± 0.18 a
Matador F133.2 ± 15.4 a10.3 ± 1.0 a3.1 ± 1.1 a2.0 ± 0.8 a440 ± 169 a0.97 ± 0.83 b
p-value0.7220.3450.2050.0610.0030.038
Year (III)201541.9 ± 8.9 b9.8 ± 0.8 a2.6 ± 0.6 a1.8 ± 0.6 a498 ± 159 a1.05 ± 0.78 b
201622.9 ± 7.6 a10.5 ± 0.7 b4.1 ± 0.9 b2.7 ± 0.5 b535 ± 172 a0.46 ± 0.18 a
p-value<0.0010.008<0.001<0.0010.5130.004
I × IIp-value0.1440.2840.9790.959<0.0010.009
I × IIIp-value<0.0010.098<0.0010.0030.5310.021
II × IIIp-value0.0140.0010.1790.0490.5720.056
I × II × IIIp-value<0.001<0.0010.003<0.0010.110<0.001
Means followed by different letters are significantly different for each parameter (the level of significance, the p-value, is shown in the table); number of observations per treatment—3; FM—fresh matter. cLl—L-ascorbic acid content, cdl—dry matter content, csc—total sugar content, crl—reducing sugar content, cNl—nitrate content, il—ascorbate-nitrate index. C—control treatment, EM—1% solution of Effective Microorganisms, GG—0.1% solution of Goëmar Goteo.
Table 6. Macronutrient content of shallot bulbs.
FactorSource of VariationN
[g kg−1 DM]
P
[g kg−1 DM]
K
[g kg−1 DM]
Ca
[g kg−1 DM]
Mg
[g kg−1 DM]
Treatment (I)C0.87 ± 0.03 b0.21 ± 0.01 a1.30 ± 0.02 a0.89 ± 0.08 a0.05 ± 0.01 a
EM0.88 ± 0.07 b0.24 ± 0.01 b1.45 ± 0.02 b0.94 ± 0.02 a0.06 ± 0.01 b
GG0.74 ± 0.04 a0.20 ± 0.02 a1.28 ± 0.10 a0.96 ± 0.11 a0.06 ± 0.01 b
p-value<0.001<0.001<0.0010.3960.007
Cultivar (II)Bonilla F10.85 ± 0.08 a0.22 ± 0.02 a1.37 ± 0.05 a0.99 ± 0.05 b0.06 ± 0.01 a
Matador F10.81 ± 0.08 a0.21 ± 0.02 a1.32 ± 0.13 a0.86 ± 0.05 a0.06 ± 0.01 a
p-value0.2390.4910.246<0.0010.999
I × IIp-value<0.0010.1780.007<0.0010.493
Means followed by different letters are significantly different for each parameter (level of significance, p-value, is shown in the Table); number of observations per treatment—3; DM—dry matter. C—control treatment, EM—1% solution of Effective Microorganisms, GG—0.1% solution of Goëmar Goteo.
Table 7. Macronutrient content of shallot leaves.
FactorSource of VariationN
[g kg−1 DM]
P
[g kg−1 DM]
K
[g kg−1 DM]
Ca
[g kg−1 DM]
Mg
[g kg−1 DM]
Treatment (I)C2.02 ± 0.10 a0.26 ± 0.02 a3.58 ± 0.07 ab1.55 ± 0.07 b0.17 ± 0.01 a
EM1.61 ± 0.53 a0.30 ± 0.03 b3.66 ± 0.07 b1.40 ± 0.07 a0.17 ± 0.01 a
GG1.80 ± 0.03 a0.29 ± 0.02 ab3.25 ± 0.43 a1.40 ± 0.16 a0.16 ± 0.02 a
p-value0.1050.0290.0330.0400.286
Cultivar (II)Bonilla F11.73 ± 0.47 a0.26 ± 0.02 a3.52 ± 0.16 a1.36 ± 0.11 a0.16 ± 0.02 a
Matador F11.89 ± 0.08 a0.30 ± 0.02 b3.47 ± 0.40 a1.54 ± 0.07 b0.17 ± 0.01 a
p-value0.3360.0020.745<0.0010.170
I × IIp-value0.0180.4310.818<0.001<0.001
Means followed by different letters are significantly different for each parameter (level of significance, p-value, is shown in the Table); number of observations per treatment—3; DM—dry matter. C—control treatment, EM—1% solution of Effective Microorganisms, GG—0.1% solution of Goëmar Goteo.
Table 8. Macronutrient ratios in shallot bulbs.
FactorSource of VariationK:Ca
[-]
K:Mg
[-]
Ca:P
[-]
Ca:Mg
[-]
K:(Ca + Mg)
[-]
Treatment (I)C1.47 ± 0.11 ab24.55 ± 2.22 b4.26 ± 0.49 ab16.85 ± 2.22 a1.38 ± 0.10 ab
EM1.55 ± 0.05 b23.56 ± 1.46 ab3.95 ± 0.12 a15.21 ± 0.86 a1.45 ± 0.05 b
GG1.35 ± 0.12 a20.90 ± 2.67 a4.78 ± 0.34 b15.56 ± 2.23 a1.27 ± 0.11 a
p-value0.0130.0290.0040.3120.009
Cultivar (II)Bonilla F11.39 ± 0.10 a23.43 ± 1.92 a4.55 ± 0.48 b16.97 ± 1.88 b1.31 ± 0.09 a
Matador F11.52 ± 0.12 b22.58 ± 3.18 a4.11 ± 0.39 a14.77 ± 1.23 a1.42 ± 0.12 b
p-value0.0190.5020.0450.0100.029
I × IIp-value0.4060.1310.0160.0400.384
Means followed by different letters are significantly different for each parameter (level of significance, p-value, is shown in the Table); number of observations per treatment—3. C—control treatment, EM—1% solution of Effective Microorganisms, GG—0.1% solution of Goëmar Goteo.
Table 9. Macronutrient ratios in shallot leaves.
FactorSource of VariationK:Ca
[-]
K:Mg
[-]
Ca:P
[-]
Ca:Mg
[-]
K:(Ca + Mg)
[-]
Treatment (I)C2.31 ± 0.13 a21.54 ± 1.16 a6.11 ± 0.28 b9.34 ± 0.66 a2.09 ± 0.11 a
EM2.62 ± 0.11 a22.18 ± 1.01 a4.76 ± 0.25 a8.49 ± 0.72 a2.34 ± 0.08 a
GG2.36 ± 0.41 a21.33 ± 4.05 a4.83 ± 0.21 a9.04 ± 0.45 a2.12 ± 0.37 a
p-value0.1140.831<0.0010.0900.146
Cultivar (II)Bonilla F12.60 ± 0.13 b22.46 ± 1.67 a5.27 ± 0.76 a8.66 ± 0.74 a2.33 ± 0.11 b
Matador F12.26 ± 0.29 a20.91 ± 2.81 a5.20 ± 0.63 a9.25 ± 0.50 a2.04 ± 0.26 a
p-value0.0050.1740.8170.0640.007
I × IIp-value0.1210.0060.0130.0210.079
Means followed by different letters are significantly different for each parameter (level of significance, p-value, is shown in the Table); number of observations per treatment—3. C—control treatment, EM—1% solution of Effective Microorganisms, GG—0.1% solution of Goëmar Goteo.
Table 10. Coefficients of Pearson’s correlation between the morphological parameters of shallot plants.
TreatmentParameterYmslnl
Cmns1
sl0.67ns1
nns0.90ns1
lnsnsnsns1
S0.63ns0.83nsns
EMmns1
slnsns1
n0.580.66ns1
lnsnsnsns1
Snsns0.84nsns
GGmns1
slnsns1
nnsnsns1
lnsns0.820.631
Snsns0.72nsns
Totalmns1
sl0.40ns1
nns0.63ns1
lnsns0.52ns1
S0.34ns0.66nsns
Y—marketable yield, m—cluster mass, sl—proportion of leaves in the yield, n—number of leaves, l—leaf length, S—leaf greenness (SPAD). C—control treatment, EM—1% solution of Effective Microorganisms, GG—0.1% solution of Goëmar Goteo. ns—non-significant correlation at α = 0.05.
Table 11. Coefficients of Pearson’s correlation between the chemical composition parameters of shallot plants.
Treatm.ParametercLbcLlcdbcdlcsbcslcrbcrlcNbcNlib
CcLl0.771
cdb0.810.851
cdl−0.72−0.73−0.961
csb0.740.670.91−0.971
csl−0.68ns−0.840.92−0.911
crbnsns−0.700.84−0.790.841
crl−0.68ns−0.750.85−0.890.970.771
cNbnsns0.81−0.910.88−0.93−0.87−0.901
cNlnsnsnsnsnsnsns0.60ns1
ib0.990.750.76−0.640.68−0.59ns−0.60nsns1
ilnsns0.77−0.920.90−0.92−0.93−0.890.93−0.66ns
EMcLl0.631
cdb0.650.971
cdlns−0.68−0.791
csb0.760.890.83ns1
cslns−0.63nsns−0.681
crbnsnsnsnsns0.721
crlnsnsnsnsns0.740.781
cNbns0.870.96−0.840.71nsnsns1
cNlnsnsnsnsnsnsns0.66ns1
ib0.98nsnsns0.69nsnsnsnsns1
il0.630.980.92−0.620.88−0.69nsns0.78−0.65ns
GGcLl0.891
cdb0.780.881
cdlnsnsns1
csb0.800.930.76ns1
csl−0.67−0.88−0.610.65−0.881
crbns−0.62−0.69nsnsns1
crl−0.58−0.82ns0.70−0.860.98ns1
cNbns0.640.66nsnsns−0.97ns1
cNlnsnsnsnsnsns0.79ns−0.851
ib0.77nsnsnsnsnsnsnsnsns1
il0.730.900.68ns0.78−0.87−0.72−0.850.79−0.69ns
TotalcLl0.571
cdb0.720.741
cdl−0.53−0.41−0.551
csb0.670.830.74−0.511
csl−0.49−0.47−0.460.43−0.581
crbns−0.39−0.34ns−0.480.631
crl−0.43−0.56−0.380.45−0.600.920.561
cNb0.330.610.64ns0.43−0.45−0.52−0.431
cNlnsnsnsnsns0.430.360.39−0.631
ib0.950.410.57−0.450.57−0.36nsnsnsns1
ilns0.730.47ns0.54−0.54−0.45−0.640.80−0.65ns
cLb—L-ascorbic acid content of bulbs, cLl—L-ascorbic acid content of leaves, cdb—dry matter content of bulbs, cdl—dry matter content of leaves, csb—total sugar content of bulbs, csl—total sugar content of leaves, crb—reducing sugar content of bulbs, crl—reducing sugar content of leaves, cNb—nitrate content of bulbs, cNl—nitrate content of leaves, ib—ascorbate-nitrate index for bulbs, il—ascorbate-nitrate index for leaves. C—control treatment, EM—1% solution of Effective Microorganisms, GG—0.1% solution of Goëmar Goteo. ns—non-significant correlation at α = 0.05.
Publisher’s Note: MDPI stays neutral with regard to jurisdictional claims in published maps and institutional affiliations.

