Article

Defining Suitable Reference Genes for qRT-PCR in Plagiodera versicolora (Coleoptera: Chrysomelidae) under Different Biotic or Abiotic Conditions

1
State Key Laboratory of Biocatalysis and Enzyme Engineering, School of Life Sciences, Hubei University, Wuhan 430062, China
2
Department of Chemistry, University of Manitoba, Winnipeg, MB R3T 2N2, Canada
*
Author to whom correspondence should be addressed.
Submission received: 19 March 2022 / Revised: 2 May 2022 / Accepted: 13 May 2022 / Published: 15 May 2022
(This article belongs to the Special Issue Biological Interactions of Pests)

Abstract

:
Plagiodera versicolora (Coleoptera: Chrysomelidae) is one of the most destructive pests of the Salicaceae worldwide, which has established complex interactions with surrounding organisms. Uncovering the molecular mechanisms of some antagonistic interactions would facilitate the development of environmentally friendly pest insect management strategies. Suitable reference genes are essential for reliable qPCR and gene expression analysis in molecular studies; however, a comprehensive assessment of reference genes in P. versicolora is still lacking. In this study, the stability of seven housekeeping genes (including Actin, EF1A, α-tubulin, RPL13a, RPS18, RPL8 and UBC) was investigated under both biotic (developmental stages, tissues, sex and pathogen treatment) and abiotic (RNA interference treatment, temperature treatment) conditions. The geNorm, NormFinder, BestKeeper, and ΔCt programs were used to analyze gene expression data. The RefFinder synthesis analysis was applied to suggest a handful of appropriate reference genes for each experimental condition. RPS18 and EF1A were the most reliable reference genes in different development stages; RPS18 and RPL8 were most stable in female and male adults, different tissues, different temperatures, and pathogen treatment; α-tubulin and RPL13a were most stable after dietary RNAi treatment. The research provides a strong basis for future research into the molecular biology of P. versicolora.

1. Introduction

Quantitative reverse transcription polymerase chain reaction (qRT-PCR) is a commonly used method for gene expression quantification owing to its high sensitivity, accuracy, specificity, and rapidity [1,2,3]. This technique has been extensively used in numerous areas, such as clinical diagnosis [4], the detection of pathogens in a plant [5], the evaluation of RNAi efficiency [6], and the quantification of microbial load in an animal [7,8]. Nevertheless, a series of factors including reference gene selection, RNA quantity or quality, the initial sample size, reverse transcription, PCR efficiency, and primer design can affect the gene expression data produced by qRT-PCR [9,10,11,12], among which the reference gene’s selection is one of the most prominent and needs systemic evaluation [13,14]. In theory, ideal reference genes must be stably expressed, not influenced by any endogenous or exogenous factors. Basic metabolism genes are generally involved in processes essential for cell survival, and stably expressed at a non-regulated constant level; thus, these housekeeping genes are frequently chosen as reference genes [15]. For example, Luo et al. (15) used the housekeeping gene ribosomal protein S15 as a reference gene to quantification of microbial load in Adelphocoris suturalis (Hemiptera: Miridae). Tang et al. [15] used β-actin as a reference gene to quantify odorant receptor protein genes expression in Sitophilus zeamais (Coleoptera: Curculionidae) tissues. Ribosomal protein S3 was adopted to normalize the expression of HSP and P450 genes in Tribolium castaneum (Coleoptera: Tenebrionidae) under UV-A exposure [16].
However, a series of investigations have discovered that the expression of housekeeping genes varies among different insect species and experimental treatments. RPS15 was shown to be stably expressed in Spodoptera frugiperda (Lepidoptera: Noctuidae) after UV-A irradiation, which is not the case when it was treated at 36 °C and after pesticide treatment [17]. β-actin was unstably expressed in Rhopalosiphum padi (Homoptera: Aphididae) adult samples from different geographic populations, though it had been found stably expressed among different developmental stages [18]. A similar result was obtained for the housekeeping gene RPS3 in Lymantria dispar (Lepidoptera: Erebidae) [19]. Additionally, the expression stability of a reference gene in the same order insects varied [20,21,22,23]. Since incorrect reference gene(s) could have a significant impact on quantification results and further lead to misinterpretations [24], a valid and reliable determination of reference genes is a prerequisite before performing qRT-PCR tests.
The leaf beetle Plagiodera versicolora (Coleoptera: Chrysomelidae), which mainly feeds on the leaves of willow and poplar, is one of the most notorious herbivorous pest insects of Salicaceae plants [25]. Although chemical pesticides can effectively kill the beetle, a long-term application of pesticides would inevitably lead to increasing resistance and cause negative effects on human and environmental health [26]. In recent years, new strategies have been proposed for the pest’s control, e.g., microbial pest control strategy, RNAi or transgenic plant-based techniques [26,27,28,29]. Additionally, we found several entomopathogens in the beetle’s surroundings (including Aspergillus nomiae used in this study), which holds great potential for development as an agent for microbial-based pest management (unpublished data). The development of an effective pest control strategy, along with other scientific goals [30,31], will expand and deepen molecular studies of P. versicolora, making gene expression analysis an increasingly deployed technique. Consequently, appropriate reference genes will inevitably be required for accurate interpretation of gene expression in molecular studies of P. versicolora, which has yet to be thoroughly examined.
Here, seven commonly used reference genes in other insects were selected, including Actin, Elongation factor 1-α (EF1A), α-tubulin, ribosomal protein L13a (RPL13a), ribosomal protein S18 (RPS18), ribosomal protein L8 (RPL8), and ubiquitin-conjugating enzyme E2 (UBC), as candidate reference genes for P. versicolora. The ΔCt method [32], geNorm [33], NormFinder [34], and BestKeeper [35] were used to assess the accuracy and stability of the seven genes under different developmental stages, sexes, tissues, different temperature treatments, pathogenic treatments, and RNAi treatments. We also used online software (RefFinder) to further assay the suitability of reference genes. Finally, the expression patterns of two genes in P. versicolora (heat shock cognate protein 70 (HSP70) and odorant blinding protein (OBP7)) were profiled to verify the stability of reference genes.

2. Materials and Methods

2.1. Insect Rearing

P. versicolora adults and larvae were captured from Sha Lake Park in Hubei Province (Wuhan, China). The insects were fed with fresh detached willow leaves, which were collected from Sha Lake Park and reared at 26 ± 1 °C, with 70% ± 5% relative humidity and a 16 h light/8 h dark photoperiod.

2.2. Experimental Treatments

The effects of development stages, sexes, tissues, temperature, pathogen treatment and dsRNA treatment on reference gene expression were measured.

2.3. Development Stage and Sex

The different development stages and sexes of P. versicolora included eggs, larvae of different instars, pupae, and male and female adults. Specifically, 45 eggs, 30 first instar larvae, 15 s instar larvae, 12 third instar larvae, 12 pupae, 12 male adults, and 12 female adults were collected. All samples were randomly chosen and equally distributed in three biological replicates. Each sample was then frozen in liquid nitrogen immediately and kept at −80 °C until further use.

2.3.1. Tissue

Three body regions, including head, thorax and abdomen, were dissected from adults of P. versicolora. Each tissue sample was collected from a minimum of 15 insects (n = 3). All the samples were stored at −80 °C after freezing in liquid nitrogen.

2.3.2. Thermal Exposure

After 4 h incubation at 4 °C, 26 °C or 36 °C, 10 first instar larvae of P. versicolora were collected and pooled as one sample for RNA extraction (n = 3), respectively.

2.3.3. Pathogen Treatment

The pathogenic fungus Aspergillus nomiae, which was isolated from the carcass of P. versicolora [36,37], was chosen. The fungus was maintained at 25 °C on Potato dextrose agar (PDA). Conidia were obtained from 1-week-old sporulating cultures. Conidia suspension (0.05% Tween 80 solution at a final concentration of 1 × 10⁷ conidia/mL) was sprayed on first instar larvae, with sterile 0.05% Tween 80 solution used as a control. Fungal infected larvae were collected at 12 h (the time when larvae begin to die) and 24 h (semi-lethal time) after the infection.

2.3.4. dsRNA Treatment

For RNAi treatment, first instar larvae of P. versicolora were fed daily with 8 ng/cm2 of dsRNA soluble N-ethylmaleimide-sensitive fusion attachment protein (SNAP) [28] coated willow leaves. The larvae fed with dsGFP (dsRNA of green fluorescent protein gene) were set as a control. The dsRNA was synthetized in vitro using the T7 RiboMAX™ Express RNAi System (Promega, Madison, WI, USA). After four days’ feeding, three individuals from each treatment were collected (n = 3).

2.4. RNA Extraction and cDNA Preparation

Total RNA was extracted from the above samples using RNAiso Plus reagent (TaKaRa, Maebashi, Japan) by following the manufacturer’s instructions. The RNA integrity was further assessed by electrophoresis in a 1.5% agarose gel and quantified on a Nano-Drop 2000 (Thermo Scientific, Waltham, MA, USA). cDNA was synthesized from 1 μg total RNA using the Hifair®II 1st Strand cDNA Synthesis SuperMix (Yeasen, Wuhan, China) according to the manufacturer’s instructions, which was then stored at –20 °C until further use. The cDNA from each sample was diluted 20 times using nuclease-free water for qPCR.

2.5. Candidate Reference Genes and Primer Design

Using P. versicolora transcriptome data [30], sequences matching the seven potential reference genes were identified (Actin, EF1A, α-tubulin, RPL13a, RPS18, RPL8 and UBC). The genes were PCR-amplified from P. versicolora cDNA using the corresponding primers. The obtained sequences were then sub-cloned using the pEASY®-T1 Simple Cloning Kit (TransGen Biotech, Beijing, China) and confirmed by Sanger sequencing. The valid gene sequences were deposited in GenBank with accession numbers (see Table 1). After that, an online tool (http://0-www-ncbi-nlm-nih-gov.brum.beds.ac.uk/tools/primer-blast/ (accessed on 25 September 2021)) was used for designing the primers of the genes for the subsequent qRT-PCR analyses. Finally, the primer specificity and the efficiency of PCR amplification were assessed using standard curves, melt curve analyses, and electrophoresis in a 2% agarose gel.

2.6. qRT-PCR Assay

Each amplification reaction (10 μL) contained 5 μL MonAmp™ SYBR® Green qPCR Mix (Monad Biotech, Suzhou, China), 2 μL cDNA, 0.4 μL of each primer (10 ng/µL), and 2.2 μL ddH2O. The PCR program was as follows: 95 °C for 3 min, 40 cycles of 95 °C for 10 s, 60 °C for 30 s. In each independent sample (n = 3), the detection of each gene was performed with three technical replicates. All qPCRs were conducted using the CFX Connect Real-Time System (Bio-Rad, Hercules, CA, USA). Continuous fluorescence measurements were taken when the temperature was ramped up from 55 to 95 °C in 0.5 °C increments every 6 s for melt curve analysis. A standard curve was generated using a serial 5-fold of cDNA template for each gene. Additionally, the gene specific PCR efficiency (E) was calculated using the following formula: E (%) = (10(−1/slope) − 1) × 100 [38].

2.7. Stability Analysis of Candidate Reference Genes

Each of the six experimental groups’ data was examined separately. The average cycle threshold (Ct) values were calculated using three biological replicates. The stability of a candidate reference gene was evaluated by the ΔCt method (Silver et al., 2006), geNorm [33], NormFinder [34], and BestKeeper [35]. To assay the suitability of reference genes, we also applied an online software RefFinder to analyze the results of the four algorithms [39].

2.8. Validation of Reference Genes

The P. versicolora heat shock cognate protein 70 (HSP70) gene and odorant binding protein 7 (OBP7) [31] gene were selected to validate the stability of reference genes in different tissues. HSP70 is a component of folding and signal transduction pathways that have housekeeping roles in cells and is usually expressed under normal settings [40,41]. OBPs are small soluble proteins released in the sensillar lymph of insect chemosensory sensillae [42,43], many of which serve as important components in insects’ chemosensory systems and are highly expressed in the antenna, leg, wing, head, and thorax of insects [44]. We used the best reference gene pair RPL8/RPS18 (ranked by geNorm), the single best reference gene RPS18 (identified by RefFinder), and the least stable reference gene UBC (evaluated by all five algorithms) to normalize the relative expression level of HSP70 and OBP7, respectively. The qRT-PCR reactions were carried out as described above, and qRT-PCR data were analyzed via the 2−∆∆CT method (Schmittgen and Livak 2008). One-way analysis of variance (ANOVA) followed by Tukey’s HSD test were used to test gene expression.

3. Results

3.1. Evaluation of Primer Specificity and Amplification Efficiency

All amplicons have 99–100% homology with the corresponding sequences obtained from the transcriptome. The specificity of gene amplification of all candidate reference genes was confirmed as only one single band with expected length using 2% agarose (Figure 1A). Melting curve analysis showed a single peak for each primer pair, indicating the high specificity of the primers (Figure 1B). The PCR efficiency (E) and correlation coefficient (R2) of the standard curve are calculated (Table 1). The PCR efficiencies of primers ranged from 96.6–105% with high R2 values (0.997–0.999).

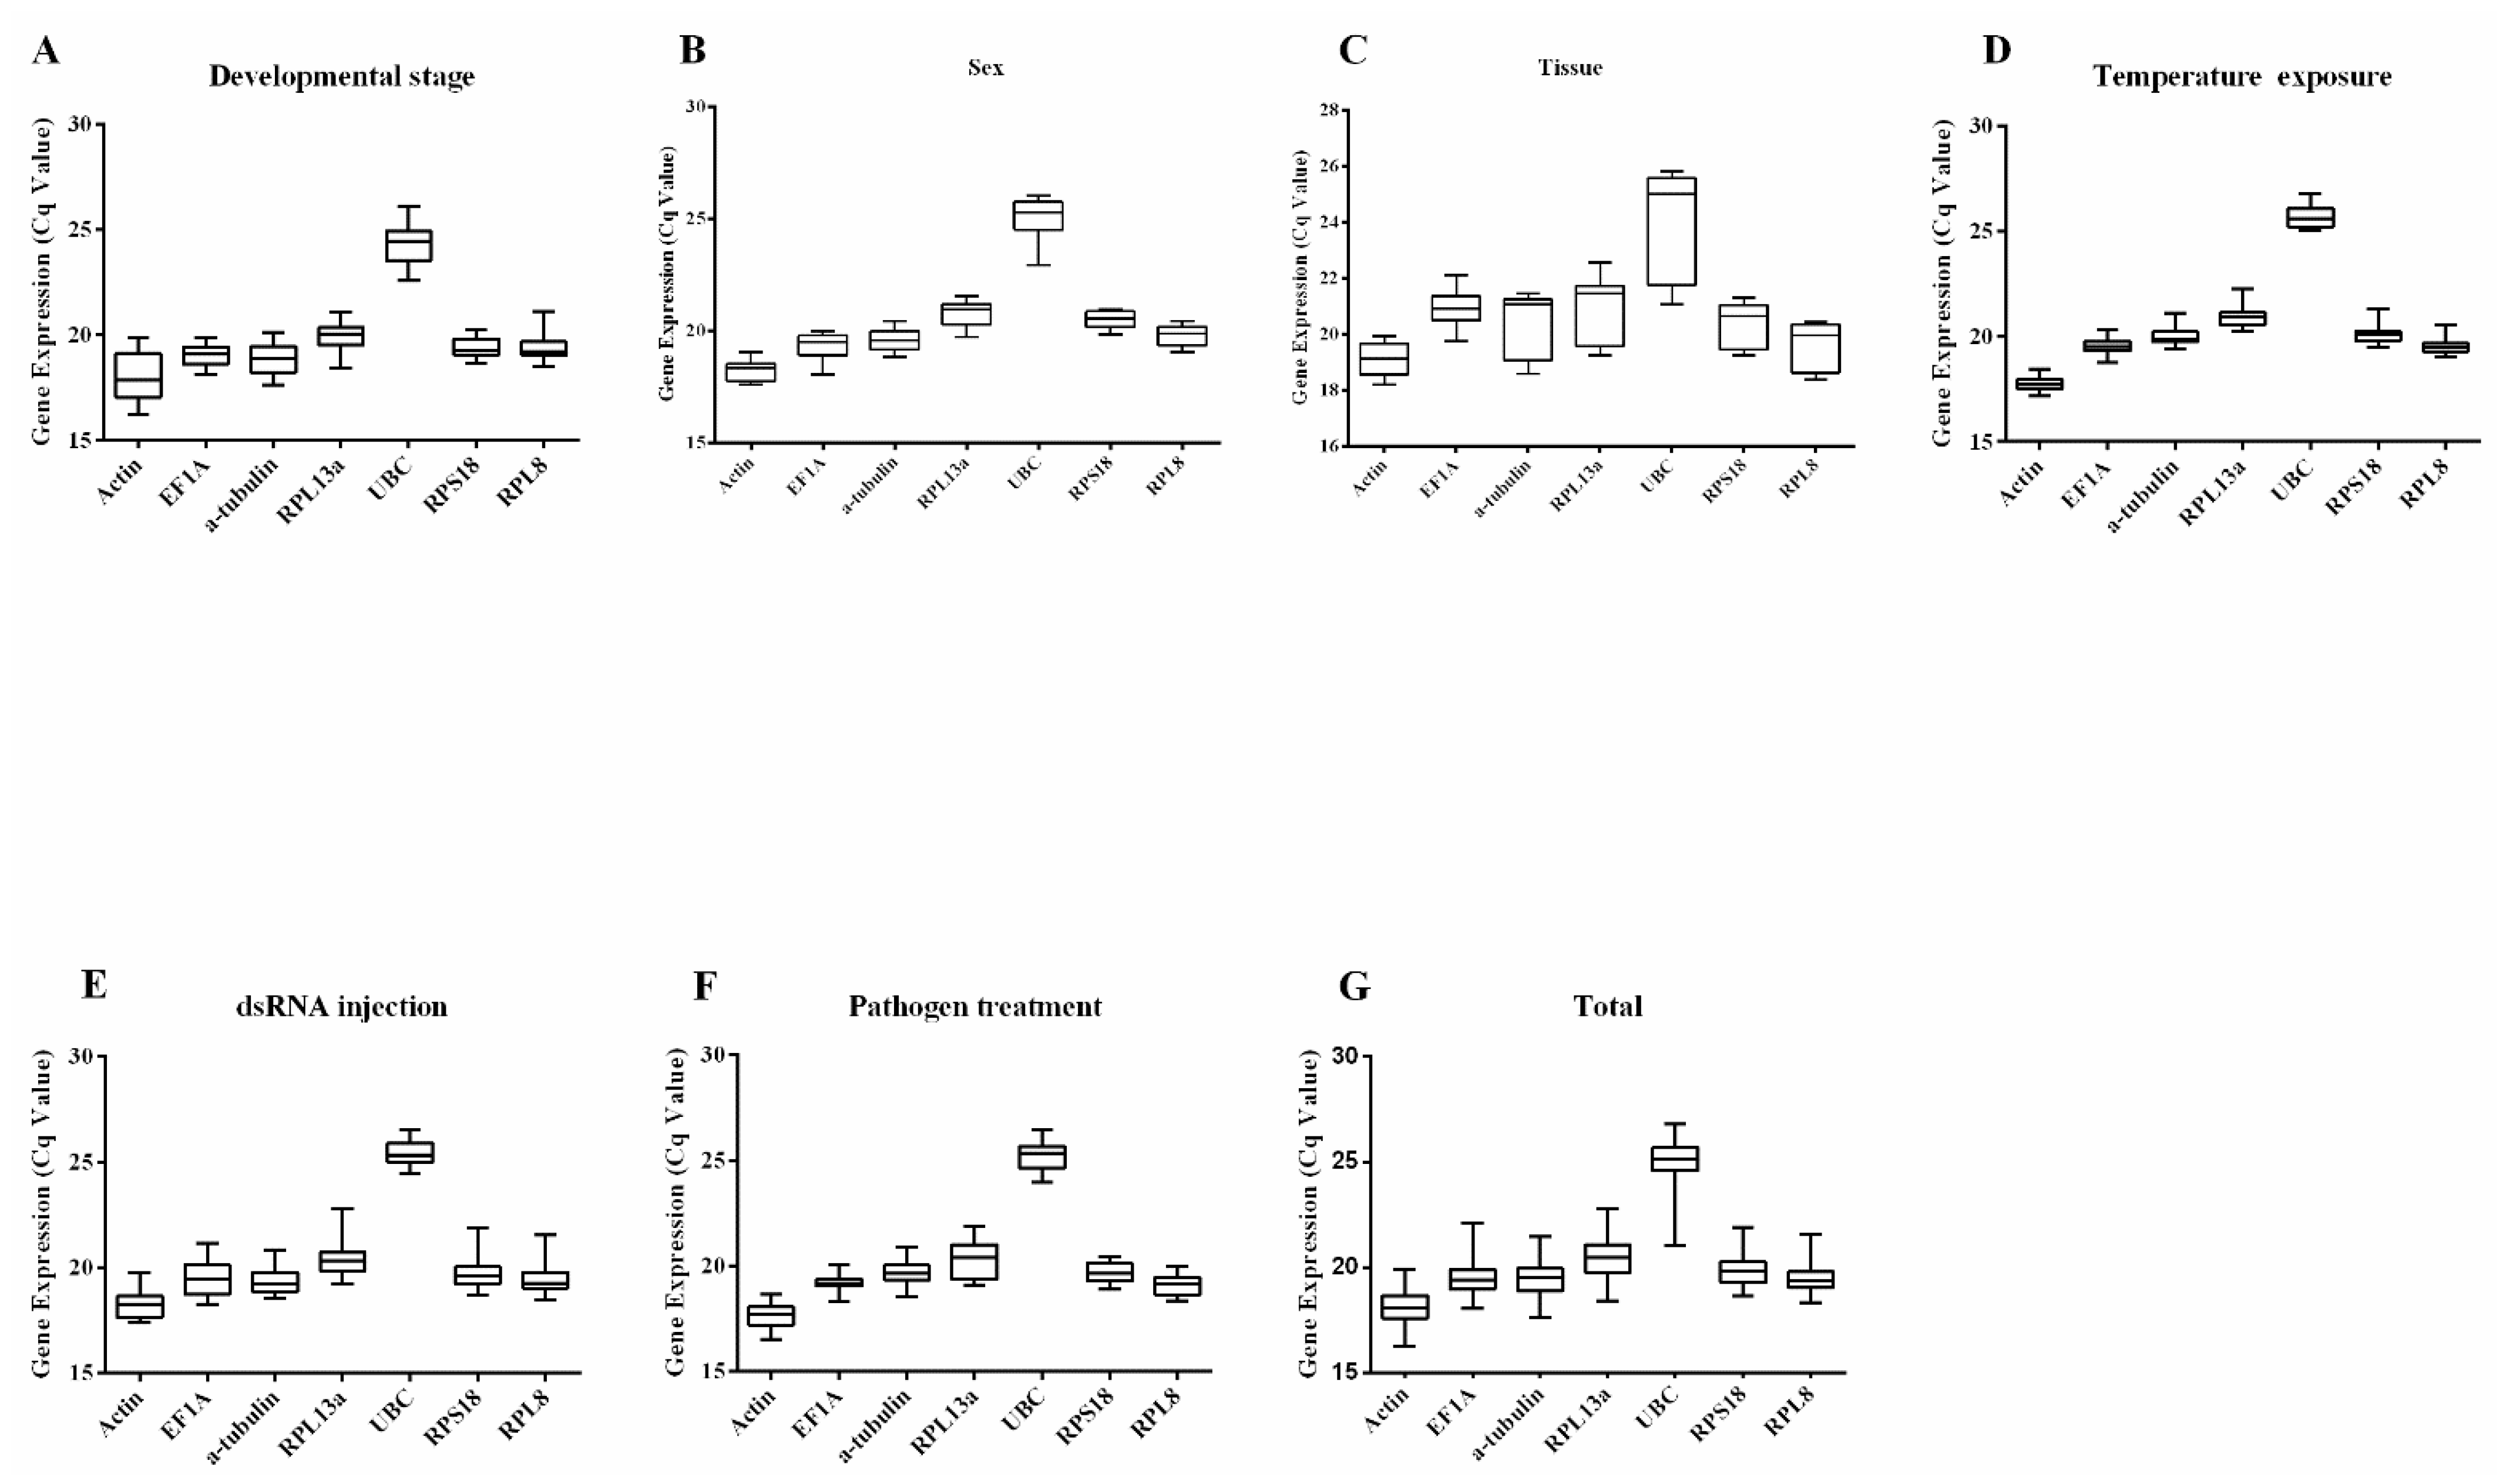
3.2. Expression Patterns of Candidate Reference Genes

The expression patterns of the candidate reference genes were investigated to offer an overall representation of primer variability under various experimental settings (Figure 2). Under the six experimental conditions, the mean Ct values of the seven potential reference genes ranged from 18.12 to 24.96 cycles. Analysis of the overall sample data showed that ACT had the highest expression level (lowest mean Ct value), followed by RPL8, EF1A, α-tubulin, RPS18, RPL13a, and UBC. Additionally, the extent of expression changes of certain reference genes varied with experimental settings. For example, UBC varied more (~5 cycle) between samples across tissue types than before and after RNAi treatment (~2 cycles) (Figure 2C,E).

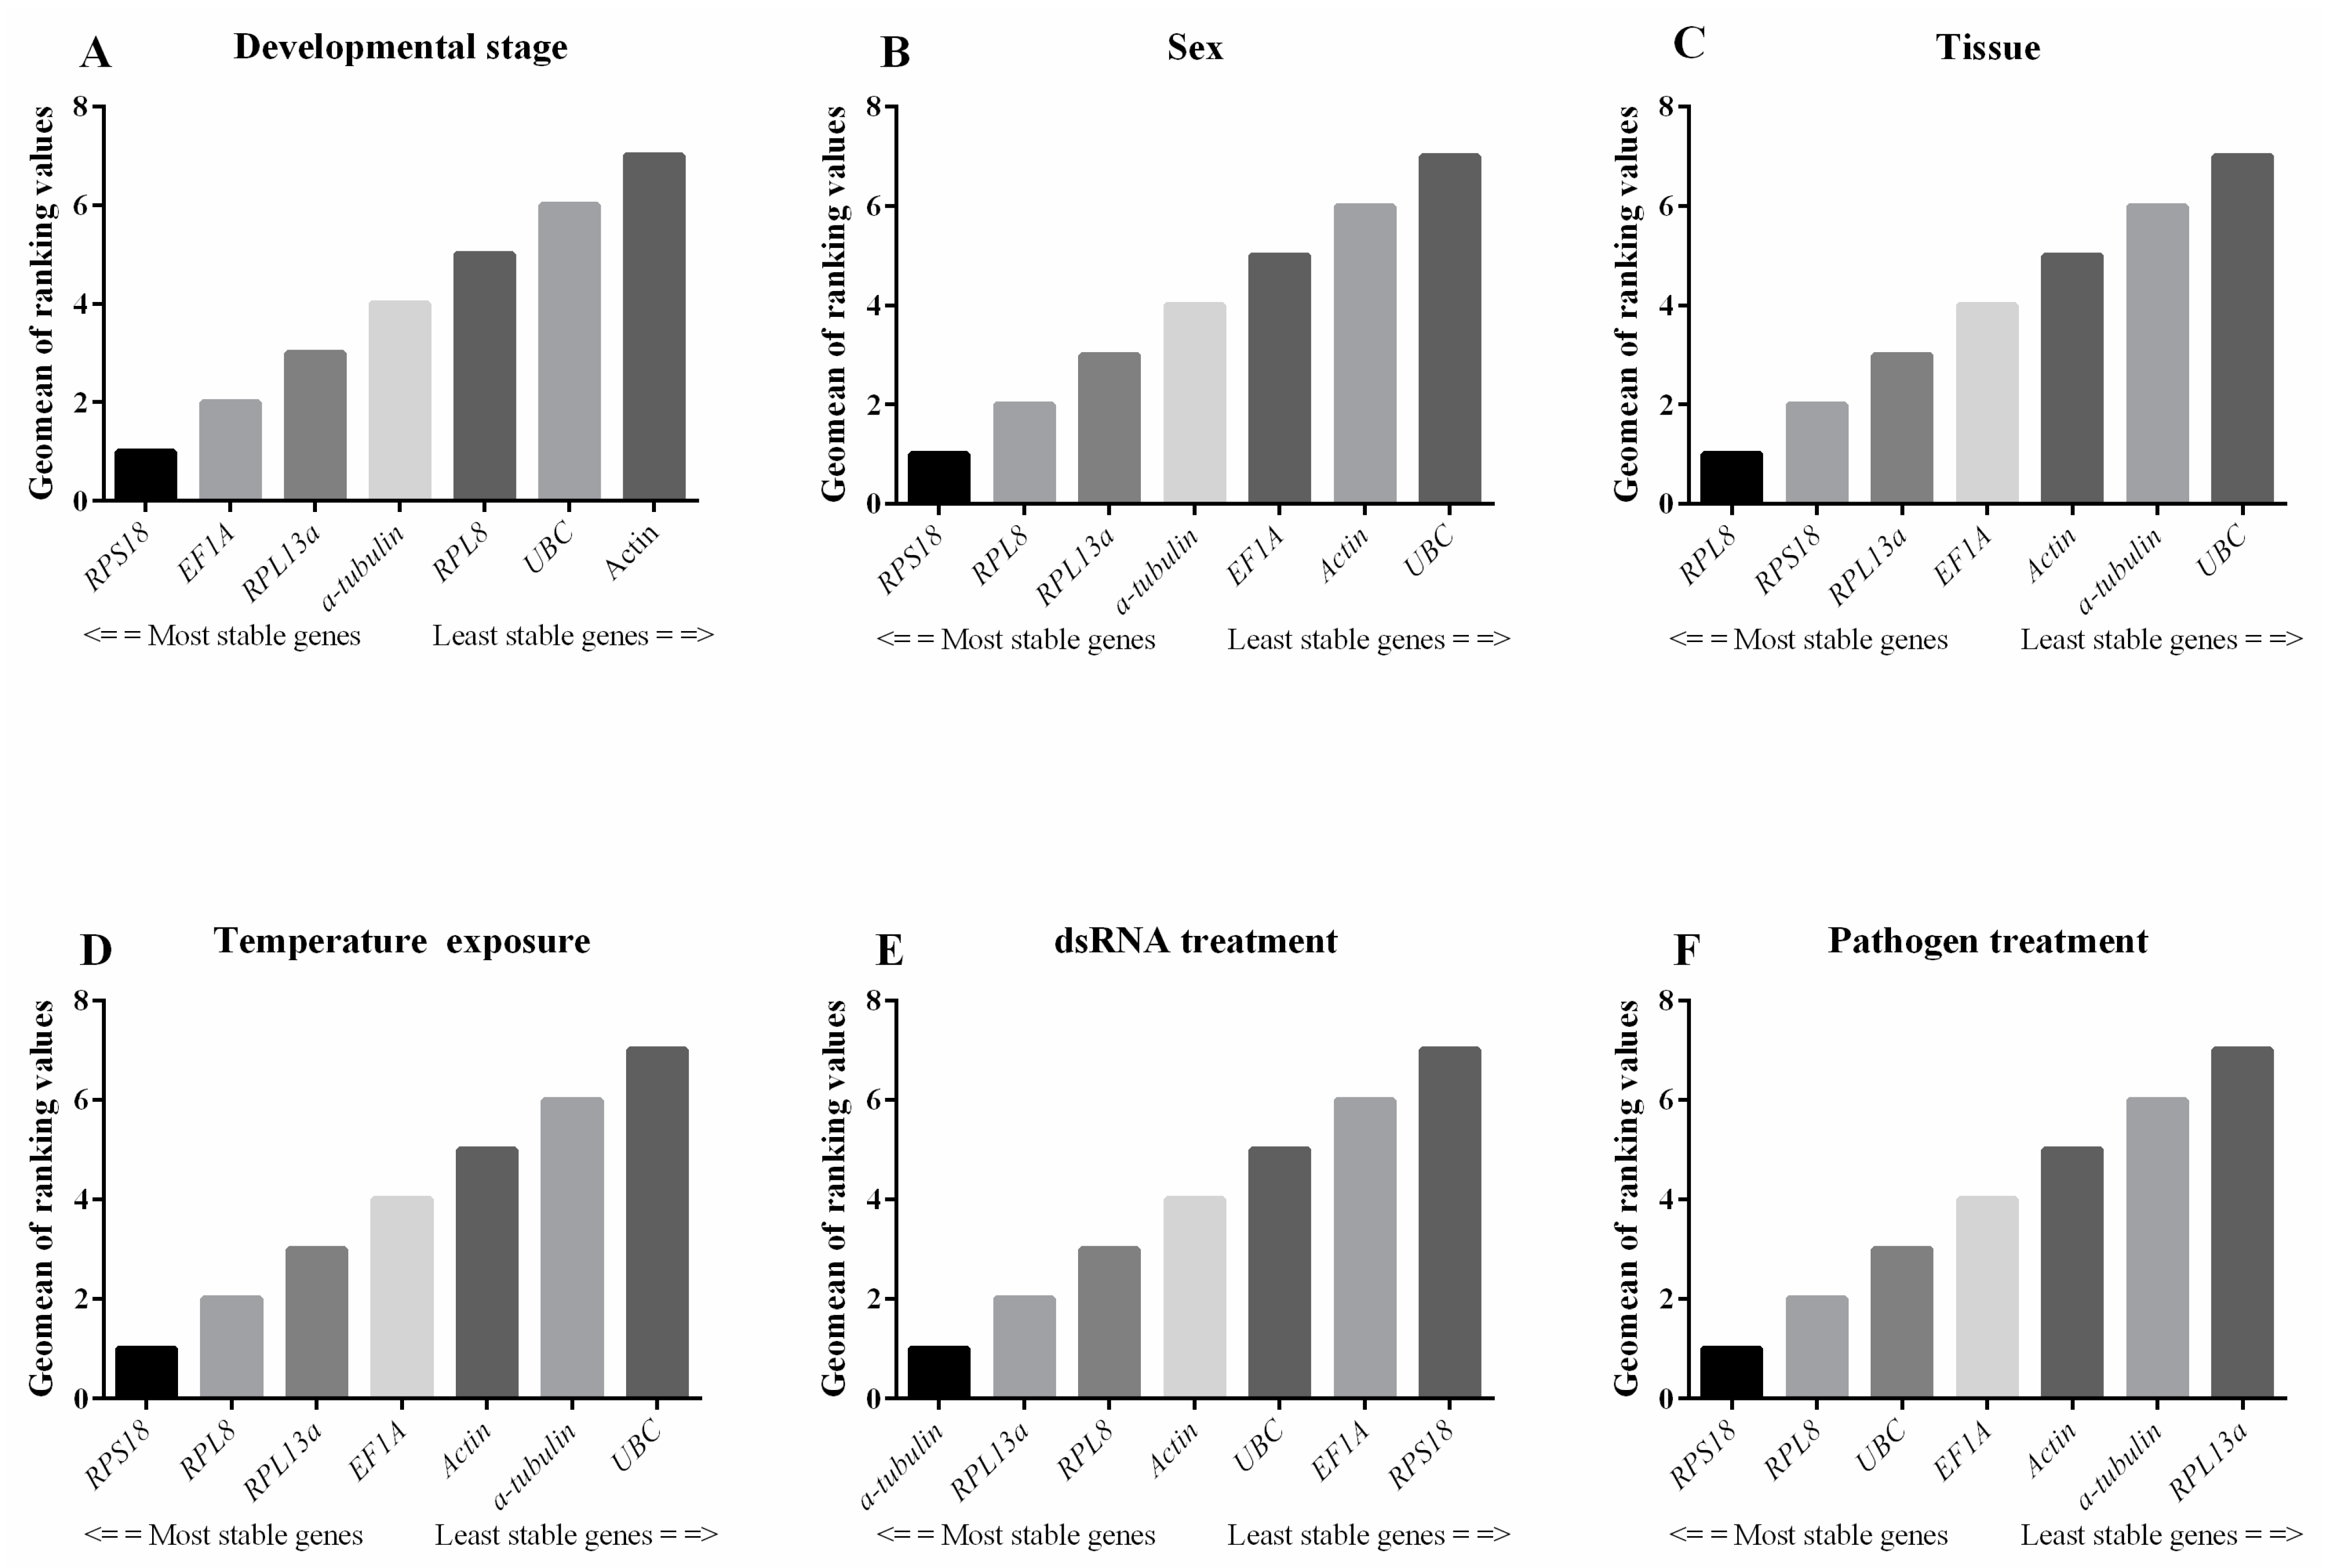
3.3. Stability of Candidate Reference Genes

The expression stabilities of the seven candidate genes in the distinct experimental settings were analyzed using the ΔCt method, BestKeeper, NormFinder, and geNorm to select the most stable reference gene(s). RefFinder was used to determine the overall stability ranking.
Developmental stages: For different developmental stages, the ΔCt method and NormFinder indicated that RPL13a, RPS18 and EF1A were the most stable genes, while UBC and Actin presented the greatest variation (Table 2). RPS18 was the most stable reference gene based on BestKeeper. The RPL13a/EF1A pair had the lowest M value (0.368) in GeNorm, indicating that they are the most stable transcripts. From most stable to least stable, RefFinder ranked the genes as follows: RPS18, EF1A, RPL13a, α-tubulin, RPL8, UBC and Actin (Figure 3A).
Sexes: RPS18 was identified as the least stable reference gene when calculated by all four algorithms (Table 2). Based on geNorm data, the pair-wise value of V2/3 was 0.128, and RPL8/RPS18 were considered the most stable reference genes across sexes (Table 2). The sex-based ranking of reference gene stability, according to RefFinder (from most to least stable) was RPS18, RPL8, RPL13a, α-tubulin, EF1A, Actin and UBC (Figure 3B).
Tissues: In our analysis of multiple tissue types, ΔCt, GeNorm, and NormFinder all suggested RPS18 and RPL8 as the most appropriate reference genes. BestKeeper, on the other hand, deemed Actin and EF1A to be the most stable genes (Table 2). For different tissues, the overall RefFinder stability ranking was: RPL8, RPS18, RPL13a, EF1A, Actin, α-tubulin, and UBC (in order of most to least stable) (Figure 3C).
Temperature exposure: For different temperatures, RPS18, RPL13a, and RPL8, were the most stable reference genes (analyzed by Normfinder and the ΔCt method); RPL13a, and RPS18 were the most stable (suggested by geNorm); and Actin and RPL8 were the most stable (determined by BestKeeper) (Table 2). The ranking of reference genes based on RefFinder across photoperiod treatments was: RPS18, RPL8, RPL13a, EF1A, Actin, α-tubulin, and UBC (in order of most to least stable) (Figure 3D). The geNorm analysis found a value of less than 0.15 for V2/3 (Figure 4). Consequently, we suggested RPS18 and RPL8 as the most stable reference genes at various temperatures (Table 2).
dsRNA treatment: In an experiment to assess the effect of RNAi on reference gene stability, α-tubulin was identified as one of the most stable genes by all four analyses (Table 2). Furthermore, RPL13a (ΔCt method and GeNorm), RPL8 (NormFinder), and UBC (BestKepper) were also identified as having a similar stability value to that of α-tubulin (Table 2). For the dsRNA treatment study, the RefFinder ranking was: α-tubulin, RPL13a, RPL8, Actin, UBC, EF1A, and RPS18 (Figure 3E).
Pathogen treatment: In this set of experiments, RPS18 was ranked first according to NormFinder and ΔCt, whereas EF1A was the best gene in BestKeeper. GeNorm identified that RPS18 and RPL8 were the most appropriate reference genes (Table 2). The most unstable reference gene calculated by the four different algorithms was RPL13a. According to RefFinder analysis, the ranking order was RPS18, RPL8, UBC, EF1A, Actin, α-tubulin, and RPL13a. We chose RPS18 and RPL8 as the most credible reference genes by combining the findings of pairwise values by GeNorm (Figure 3F and Figure 4).

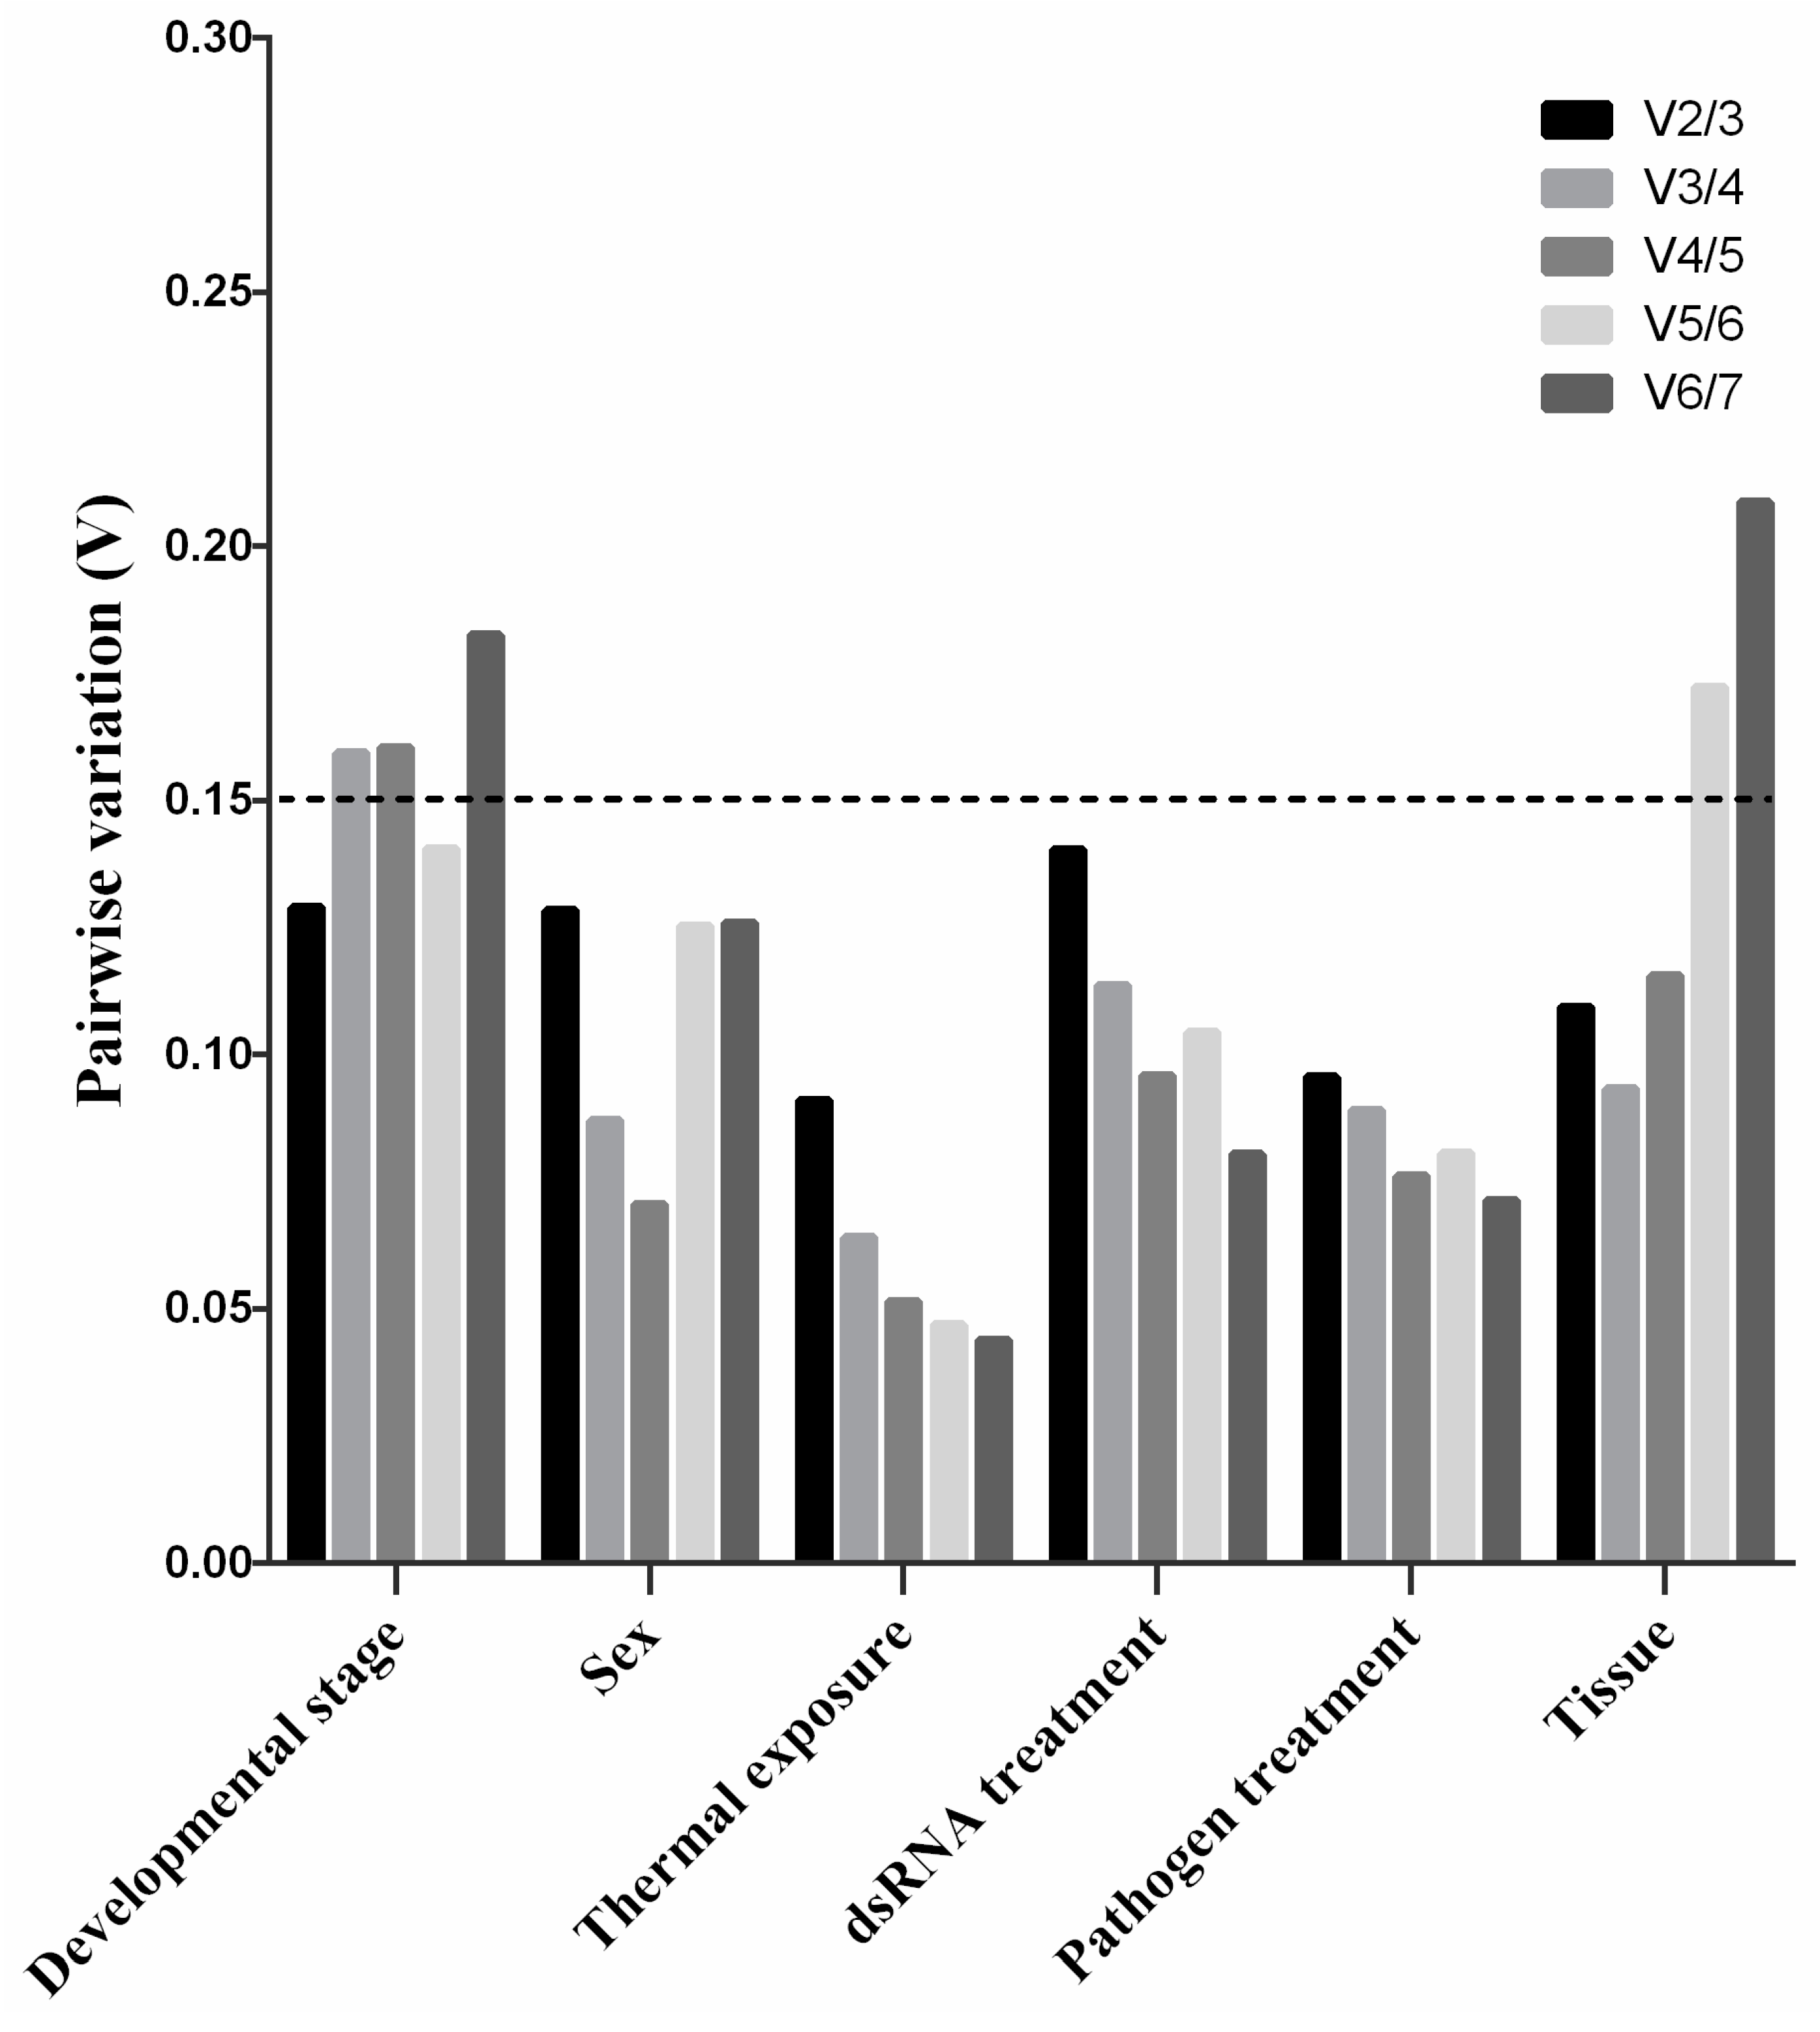
3.4. The Optimal Number of Reference Genes for Normalization in P. versicolora

The conventional use of a single gene for data of qRT-PCR normalization leads to relatively large errors, and the application of more than one reference gene can strengthen the analysis [33]. Therefore, geNorm was applied to calculate the pairwise variation (Vn/Vn+1) to further determine the optimal number of reference genes. Generally, a number of n reference genes is sufficient to normalize the target gene once the value of (Vn/Vn+1) is below 0.15 [24]. The V2/3 value was first lower than 0.15 in all pairwise variants in development stages, sexes, tissues, temperature, pathogen treatment and dsRNA treatment (Figure 4), indicating that the optimal number of reference genes for normalization was two for each experimental set.

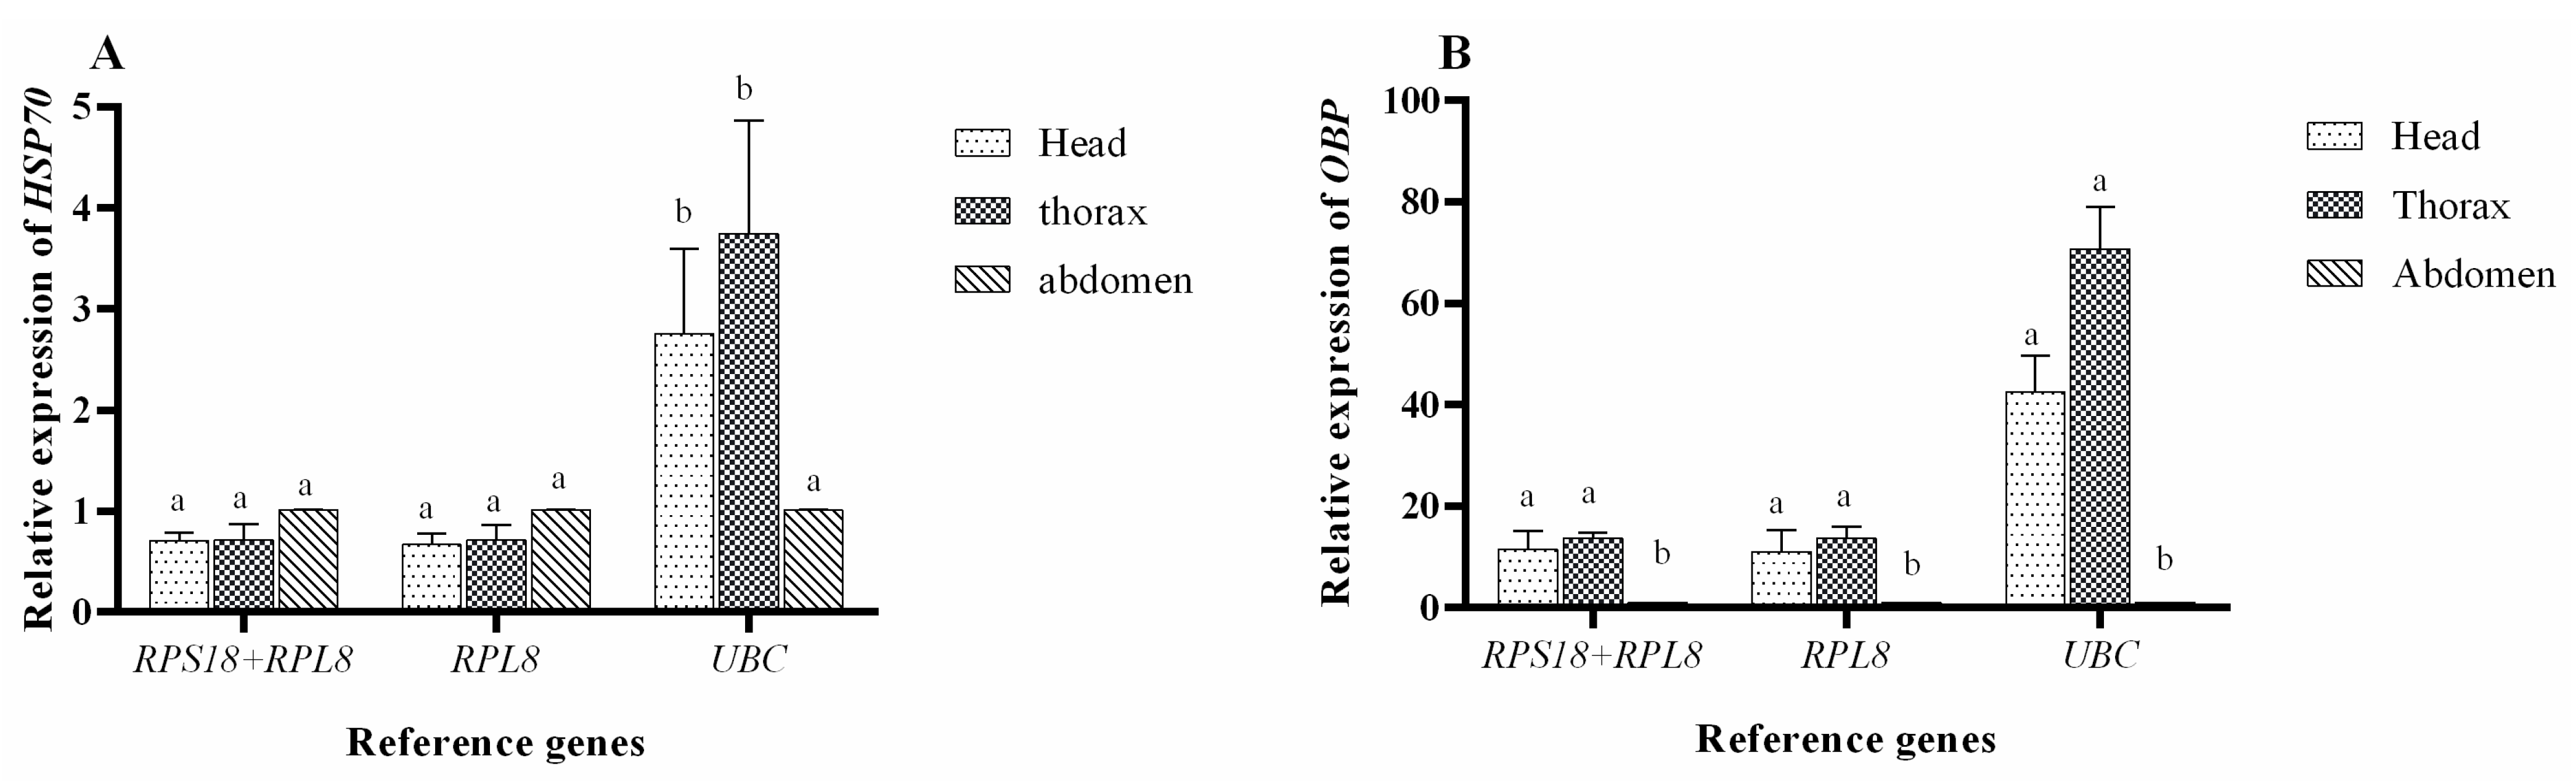
3.5. Validation of Reference Genes in P. versicolora

The relative expression of P. versicolora HSP70 and OBP7 in diverse tissues was examined to validate the reference genes. Here, reference genes RPL8/RPS18 (determined by geNorm), RPS8 (suggested by RefFinder), and UBC (determined by all algorithms) were chosen and used to normalize the expression levels of the two above genes.
The normalization of transcripts using RPL8/RPS18 and RPL8 alone revealed there were no differences in expression of HSP70 in the three groups. In contrast, normalization with UBC suggested there was a significant difference in HSP70 gene expression between the groups, with the highest expression in the thorax (Figure 5A). This indicates that using the inappropriate reference genes may lead to incorrect conclusions that are completely different from the facts. When the most stable reference gene, RPL8, was used, the relative expression of OBP7 in the head and thorax was significantly higher than that in the abdomen (Figure 5B). Similar results were obtained using RPS18 and RPL8. Notably, normalization with an unsuitable reference gene such as UBC leaded to raised expression levels though the trend of gene expression was similar (Figure 5B). As a result, our findings emphasize the need for choosing and confirming accurate RT-qPCR reference genes in order to avoid misinterpretation of expression data.

4. Discussion

Although P. versicolora is one of the most destructive pests of the Salicaceae [45], its molecular physiology has not been rigorously explored due to incomplete background genetic information. Fortunately, recent developments in transcriptomics research have paved the way for functional genomics and associated gene expression studies [28,31,46]. However, a previous study demonstrated that incorrect reference gene(s) could have a significant impact on quantification results and further lead to incorrect inferences and misinterpretations [24]. In line with the conclusion, our experimental results revealed that α-tubulin could be expressed stably after dsRNA treatment, but its expression varied among different developmental stages, tissues, sexes, and other treatments (Table 2). It is therefore essential to assess suitable reference genes in the P. versicolora under various biotic and abiotic settings.
Ribosomal protein genes were consistently expressed in several insect species: for instance, RPS8, RPL13, and RPL28 showed high stability across tissues, sexes and developmental stages in Harmonia axyridis [47]; RPL13a, RPS3 and RPL18 in Holotrichia oblita (Coleoptera: Scarabaeidae), RPL13a in Anomala corpulenta (Coleoptera: Scarabaeidae) have a similar patten [20,48]. Moreover, similar results were obtained in several Coleoptera insects including Agasicles hygrophila (Coleoptera: Chrysomelidae), Anthonomus eugenii (Coleoptera; Curculionidae), Propylea japonica (Coleoptera: Coccinellidae), and Harmonia axyridis (Coleoptera: Coccinellidae), among others [21,22,23,47]. In line with these conclusions, we found that ribosomal protein genes are relative suitable reference genes for gene expression studies of P. versicolora in the experimental situation described above.
Our overall analysis revealed that α-tubulin and EF1A ranked high in only one experimental setting (dsRNA treatment and development stage, respectively) (Figure 3A,E). Similarly, α-tubulin was identified as a stable reference gene only when it was used to normalize target gene expression in RNAi treatment of Coccinella septempunctata (Coleoptera: Coccinellidae) [49]. EF1A is not stably expressed under some occasions and could not be set as a suitable reference gene in many insect species, such as Sesamia inferens (Lepidoptera: Noctuidae) [50], Phaedon brassicae (Coleoptera: Chrysomelidae) [51], Bradysia odoriphaga (Diptera: Sciaridae) [52], and Harmonia axyridis (Coleoptera: Coccinellidae) [47]. Thus, the reliability of the above two reference genes may be context dependent. Actin is another common reference gene in many insects, encoding a major structural protein which is involved in the maintenance of the cytoskeleton and basic nuclear processes from gene expression to DNA repair [53]. Nevertheless, we found that the expression of Actin was very unstable compared to other studies, especially in P. versicolora samples of different developmental stages (Figure 3A). Several other investigations have found that Actin expression varies depending on the sample type, which is consistent with our findings [21,54]. Collectively, these results indicate that the stability of reference genes varies and is easily influenced by a handful of biotic and abiotic factors. Thus, no one universal reference gene exists that is suitable for all insects and under all situations; even the most used housekeeping genes respond differentially to diverse experimental settings. As a result, it is critical to select the most accurate normalization approach in order to obtain the best gene expression data and exclude non-biological variance from the biological results [55].
The ΔCt method, GeNorm, NormFinder and BestKeeper are often used in selection of reference genes [56,57,58]. Although some reference genes were ranked in the same position by the four algorithms under certain conditions, in general, there was some variation in the stability rankings produced by these algorithms. For example, the ranking of Actin varied among the four algorithms under different tissues in our experiments (Table 2). In many studies, the variations in ranking order of reference genes can be linked to the algorithm’s various statistical methodologies [59,60]. To solve this problem, RefFinder can construct a composite rating of reference genes based on the ranking values provided by the four methods described above [61]. Furthermore, a great number of experimental results suggest that selecting two or more reference genes is more accurate and reliable than using a single reference gene for rectification. As a result, we propose that the findings of the pairwise variation (Vn/Vn+1) of the geNorm can be used to calculate the number of reference genes that normalize the target genes. Then, the results of the comprehensive RefFinder ranking are combined to determine the best combination of reference genes that can accurately analyze the expression of the target genes.
In general, HSP70 is stably expressed across a variety of experimental conditions. For example, HSP70, which served as a reference gene in Coleomegilla maculate (Coleoptera: Coccinellidae) [62], is stably expressed in different developmental stages and in different sexes of Chilo partellus (Lepidoptera: Crambidae) [63]. Thus, the gene was often chosen as a target to assay the stability of candidate reference genes [59]. Here, the gene, together with OBP7, was applied to assay the stability of the seven candidate reference genes in P. versicolora. We showed that the HSP70 gene expression was stable in different tissues when normalized with RPL8/RPS18 or RPL8 alone. In contrast, normalization with UBC suggested there was a significant difference in HSP70 gene expression between the groups, with the highest expression in the thorax (Figure 5A). These findings suggest that using the wrong reference gene can result in radically different experimental results, highlighting the necessity of screening for reference genes.
The independent normalization of qRT-PCR data using either a stable reference combination (RPS18/RPL8) or the most stable reference gene (RPL8) indicated that OBP7 was expressed 11 and 13-fold higher in the head and thorax, respectively, than in the abdomen. Overall, the OBP7 is highly expressed in the head and thorax in P. versicolora, which is consistent with the result in Bactrocera dorsalis (Diptera: Tephritidae) and Bemisia tabaci (Hemiptera: Aleyrodidae) [64,65]. However, we have to mention that P. versicolora adults were dissected and separated into three segments to represent head, thorax, and abdomen, respectively, and the thorax contains thoracic legs and wings. In previous research, OBPs have been found to be expressed in a variety of insect tissues, including antennae [66], legs [67], and wings [68]. Thus, more specific expression profiles about OBP7 need to be explored further on the basis of this experiment.

Author Contributions

Conceptualization, C.T. and L.X.; methodology, C.T., P.X. and R.H.; software, C.T.; validation, C.T., P.X. and R.H.; formal analysis, C.T., P.X., R.H. and J.L.; investigation, C.T. and P.X.; resources, L.X.; data curation, C.T.; writing—original draft preparation, C.T.; writing—review and editing, L.X. and R.H.; visualization, C.T.; supervision, L.X.; project administration, L.X.; funding acquisition, L.X. All authors have read and agreed to the published version of the manuscript.

Funding

This work was funded by the National Natural Science Foundation of China (31971663) and the Young Elite Scientists Sponsorship Program by CAST (2020QNRC001).

Institutional Review Board Statement

Not applicable.

Informed Consent Statement

Not applicable.

Data Availability Statement

Not applicable.

Conflicts of Interest

The authors declare no conflict of interest.

References

  1. Shakeel, M.; Rodriguez, A.; Tahir, U.B.; Jin, F. Gene expression studies of reference genes for quantitative real-time PCR: An overview in insects. Biotechnol. Lett. 2018, 40, 227–236. [Google Scholar] [CrossRef]
  2. Bustin, S.A.; Mueller, R. Real-time reverse transcription PCR (qRT-PCR) and its potential use in clinical diagnosis. Clin. Sci. 2005, 109, 365–379. [Google Scholar] [CrossRef] [Green Version]
  3. Murphy, J.; Bustin, S.A. Reliability of real-time reverse-transcription PCR in clinical diagnostics: Gold standard or substandard? Expert Rev. Mol. Diagn. 2009, 9, 187–197. [Google Scholar] [CrossRef]
  4. Vogels, C.B.F.; Brito, A.F.; Wyllie, A.L.; Fauver, J.R.; Ott, I.M.; Kalinich, C.C.; Petrone, M.E.; Casanovas-Massana, A.; Catherine Muenker, M.; Moore, A.J.; et al. Analytical sensitivity and efficiency comparisons of SARS-CoV-2 RT-qPCR primer-probe sets. Nat. Microbiol. 2020, 5, 1299–1305. [Google Scholar] [CrossRef]
  5. He, S.; Chen, H.; Wei, Y.; An, T.; Liu, S. Development of a DNA-based real-time PCR assay for the quantification of Colletotrichum camelliae growth in tea (Camellia sinensis). Plant Methods 2020, 16, 17. [Google Scholar] [CrossRef] [Green Version]
  6. Milstein, S.; Nguyen, M.; Meyers, R.; de Fougerolles, A. Measuring RNAi knockdown using qPCR. Methods Enzym. 2013, 533, 57–77. [Google Scholar] [CrossRef]
  7. Zhang, B.; Leonard, S.P.; Li, Y.; Moran, N.A. Obligate bacterial endosymbionts limit thermal tolerance of insect host species. Proc. Natl. Acad. Sci. USA 2019, 116, 24712–24718. [Google Scholar] [CrossRef]
  8. Raza, M.F.; Wang, Y.; Cai, Z.; Bai, S.; Yao, Z.; Awan, U.A.; Zhang, Z.; Zheng, W.; Zhang, H. Gut microbiota promotes host resistance to low-temperature stress by stimulating its arginine and proline metabolism pathway in adult Bactrocera dorsalis. PLoS Pathog. 2020, 16, e1008441. [Google Scholar] [CrossRef] [Green Version]
  9. Fleige, S.; Pfaffl, M.W. RNA integrity and the effect on the real-time qRT-PCR performance. Mol. Asp. Med. 2006, 27, 126–139. [Google Scholar] [CrossRef]
  10. Ruijter, J.M.; Barnewall, R.J.; Marsh, I.B.; Szentirmay, A.N.; Quinn, J.C.; van Houdt, R.; Gunst, Q.D.; van den Hoff, M.J.B. Efficiency Correction Is Required for Accurate Quantitative PCR Analysis and Reporting. Clin. Chem. 2021, 67, 829–842. [Google Scholar] [CrossRef]
  11. Bustin, S.A.; Benes, V.; Nolan, T.; Pfaffl, M.W. Quantitative real-time RT-PCR—A perspective. J. Mol. Endocrinol. 2005, 34, 597–601. [Google Scholar] [CrossRef] [Green Version]
  12. Bustin, S.A.; Benes, V.; Garson, J.A.; Hellemans, J.; Huggett, J.; Kubista, M.; Mueller, R.; Nolan, T.; Pfaffl, M.W.; Shipley, G.L.; et al. The MIQE guidelines: Minimum information for publication of quantitative real-time PCR experiments. Clin. Chem. 2009, 55, 611–622. [Google Scholar] [CrossRef] [Green Version]
  13. Guenin, S.; Mauriat, M.; Pelloux, J.; Van Wuytswinkel, O.; Bellini, C.; Gutierrez, L. Normalization of qRT-PCR data: The necessity of adopting a systematic, experimental conditions-specific, validation of references. J. Exp. Bot. 2009, 60, 487–493. [Google Scholar] [CrossRef] [Green Version]
  14. Sang, J.; Wang, Z.; Li, M.; Cao, J.; Niu, G.; Xia, L.; Zou, D.; Wang, F.; Xu, X.; Han, X.; et al. ICG: A wiki-driven knowledgebase of internal control genes for RT-qPCR normalization. Nucleic Acids Res. 2018, 46, D121–D126. [Google Scholar] [CrossRef] [Green Version]
  15. Kozera, B.; Rapacz, M. Reference genes in real-time PCR. J. Appl. Genet. 2013, 54, 391–406. [Google Scholar] [CrossRef] [Green Version]
  16. Sang, W.; Ma, W.H.; Qiu, L.; Zhu, Z.H.; Lei, C.L. The involvement of heat shock protein and cytochrome P450 genes in response to UV-A exposure in the beetle Tribolium castaneum. J. Insect Physiol. 2012, 58, 830–836. [Google Scholar] [CrossRef]
  17. Zhou, L.; Meng, J.Y.; Ruan, H.Y.; Yang, C.L.; Zhang, C.Y. Expression stability of candidate RT-qPCR housekeeping genes in Spodoptera frugiperda (Lepidoptera: Noctuidae). Arch. Insect Biochem. Physiol. 2021, 108, e21831. [Google Scholar] [CrossRef]
  18. Li, M.; Li, X.; Wang, C.; Li, Q.; Zhu, S.; Zhang, Y.; Li, X.; Yang, F.; Zhu, X. Selection and Validation of Reference Genes For qRT-PCR Analysis of Rhopalosiphum padi (Hemiptera: Aphididae). Front. Physiol. 2021, 12, 663338. [Google Scholar] [CrossRef]
  19. Yin, J.; Sun, L.; Zhang, Q.; Cao, C. Screening and evaluation of the stability of expression of reference genes in Lymantria dispar (Lepidoptera: Erebidae) using qRT-PCR. Gene 2020, 749, 144712. [Google Scholar] [CrossRef]
  20. Xie, M.; Zhong, Y.; Lin, L.; Zhang, G.; Su, W.; Ni, W.; Qu, M.; Chen, H. Evaluation of reference genes for quantitative real-time PCR normalization in the scarab beetle Holotrichia oblita. PLoS ONE 2020, 15, e0240972. [Google Scholar] [CrossRef]
  21. Guo, Y.Q.; Yang, Y.; Chai, Y.; Gao, L.L.; Ma, R. Identification and Evaluation of Reference Genes for Quantitative PCR Normalization in Alligator Weed Flea Beetle (Coleoptera: Chrysomelidae). J. Insect Sci. 2021, 21, 9. [Google Scholar] [CrossRef] [PubMed]
  22. Pinheiro, D.H.; Siegfried, B.D. Selection of reference genes for normalization of RT-qPCR data in gene expression studies in Anthonomus eugenii Cano (Coleoptera: Curculionidae). Sci. Rep. 2020, 10, 5070. [Google Scholar] [CrossRef] [PubMed] [Green Version]
  23. Lu, J.; Chen, S.; Guo, M.; Ye, C.; Qiu, B.; Yang, C.; Pan, H. Selection of appropriate reference genes for RT-qPCR analysis in Propylea japonica (Coleoptera: Coccinellidae). PLoS ONE 2018, 13, e0208027. [Google Scholar] [CrossRef] [PubMed] [Green Version]
  24. Luo, J.; Ma, C.; Li, Z.; Zhu, B.-q.; Zhang, J.; Lei, C.-l.; Jin, S.-x.; Hull, J.J.; Chen, L.-z. Assessment of suitable reference genes for qRT-PCR analysis in Adelphocoris suturalis. J. Integr. Agric. 2018, 17, 2745–2757. [Google Scholar] [CrossRef]
  25. Ling, J.; Li, X.; Yang, G.; Yin, T. Volatile metabolites of willows determining host discrimination by adult Plagiodera versicolora. J. For. Res. 2021, 33, 679–687. [Google Scholar] [CrossRef]
  26. Demirci, M.; Sevim, E.; Demir, İ.; Sevim, A. Culturable bacterial microbiota of Plagiodera versicolora (L.) (Coleoptera: Chrysomelidae) and virulence of the isolated strains. Folia Microbiol. 2013, 58, 201–210. [Google Scholar] [CrossRef] [PubMed]
  27. Zhang, Y.; Xu, L.; Li, S.; Zhang, J. Bacteria-Mediated RNA Interference for Management of Plagiodera versicolora (Coleoptera: Chrysomelidae). Insects 2019, 10, 415. [Google Scholar] [CrossRef] [PubMed] [Green Version]
  28. Xu, L.; Xu, S.; Sun, L.; Zhang, Y.; Luo, J.; Bock, R.; Zhang, J. Synergistic action of the gut microbiota in environmental RNA interference in a leaf beetle. Microbiome 2021, 9, 98. [Google Scholar] [CrossRef]
  29. Xu, S.; Zhang, Y.; Li, S.; Chang, L.; Wu, Y.; Zhang, J. Plastid-expressed Bacillus thuringiensis (Bt) cry3Bb confers high mortality to a leaf eating beetle in poplar. Plant Cell Rep. 2020, 39, 317–323. [Google Scholar] [CrossRef]
  30. Ma, M.; Tu, C.; Luo, J.; Lu, M.; Zhang, S.; Xu, L. Metabolic and immunological effects of gut microbiota in leaf beetles at the local and systemic levels. Integr. Zool. 2021, 16, 313–323. [Google Scholar] [CrossRef]
  31. Liu, X.; Tong, N.; Wu, Z.; Li, Y.; Ma, M.; Liu, P.; Lu, M. Identification of Chemosensory Genes Based on the Antennal Transcriptomic Analysis of Plagiodera versicolora. Insects 2021, 13, 36. [Google Scholar] [CrossRef] [PubMed]
  32. Silver, N.; Best, S.; Jiang, J.; Thein, S.L. Selection of housekeeping genes for gene expression studies in human reticulocytes using real-time PCR. BMC Mol. Biol. 2006, 7, 33. [Google Scholar] [CrossRef] [PubMed] [Green Version]
  33. Vandesompele, J.; De Preter, K.; Pattyn, F.; Poppe, B.; Van Roy, N.; De Paepe, A.; Speleman, F. Accurate normalization of real-time quantitative RT-PCR data by geometric averaging of multiple internal control genes. Genome Biol. 2002, 3, Research0034. [Google Scholar] [CrossRef] [PubMed] [Green Version]
  34. Andersen, C.L.; Jensen, J.L.; Ørntoft, T.F. Normalization of real-time quantitative reverse transcription-PCR data: A model-based variance estimation approach to identify genes suited for normalization, applied to bladder and colon cancer data sets. Cancer Res. 2004, 64, 5245–5250. [Google Scholar] [CrossRef] [Green Version]
  35. Pfaffl, M.W.; Tichopad, A.; Prgomet, C.; Neuvians, T.P. Determination of stable housekeeping genes, differentially regulated target genes and sample integrity: BestKeeper--Excel-based tool using pair-wise correlations. Biotechnol. Lett. 2004, 26, 509–515. [Google Scholar] [CrossRef]
  36. Yun, J.S. Studies on Entomopathogenic Fungi Isolated from Dead Pine Caterpillars, Dendrolimus spectabilis. Entomol. Res. 2003, 33, 247–252. [Google Scholar] [CrossRef]
  37. Jaber, S.; Mercier, A.; Knio, K.; Brun, S.; Kambris, Z. Isolation of fungi from dead arthropods and identification of a new mosquito natural pathogen. Parasit Vectors 2016, 9, 491. [Google Scholar] [CrossRef] [Green Version]
  38. Radonic, A.; Thulke, S.; Mackay, I.M.; Landt, O.; Siegert, W.; Nitsche, A. Guideline to reference gene selection for quantitative real-time PCR. Biochem. Biophys. Res. Commun. 2004, 313, 856–862. [Google Scholar] [CrossRef]
  39. De Spiegelaere, W.; Dern-Wieloch, J.; Weigel, R.; Schumacher, V.; Schorle, H.; Nettersheim, D.; Bergmann, M.; Brehm, R.; Kliesch, S.; Vandekerckhove, L.; et al. Reference gene validation for RT-qPCR, a note on different available software packages. PLoS ONE 2015, 10, e0122515. [Google Scholar] [CrossRef] [Green Version]
  40. Behnke, J.; Mann, M.J.; Scruggs, F.L.; Feige, M.J.; Hendershot, L.M. Members of the Hsp70 Family Recognize Distinct Types of Sequences to Execute ER Quality Control. Mol. Cell 2016, 63, 739–752. [Google Scholar] [CrossRef] [Green Version]
  41. Shiota, M.; Kusakabe, H.; Izumi, Y.; Hikita, Y.; Nakao, T.; Funae, Y.; Miura, K.; Iwao, H. Heat shock cognate protein 70 is essential for Akt signaling in endothelial function. Arter. Thromb. Vasc. Biol. 2010, 30, 491–497. [Google Scholar] [CrossRef] [PubMed]
  42. Guo, W.; Ren, D.; Zhao, L.; Jiang, F.; Song, J.; Wang, X.; Kang, L. Identification of Odorant-Binding Proteins (OBPs) and Functional Analysis of Phase-Related OBPs in the Migratory Locust. Front. Physiol. 2018, 9, 984. [Google Scholar] [CrossRef] [PubMed] [Green Version]
  43. Deng, S.; Yin, J.; Zhong, T.; Cao, Y.; Li, K. Function and immunocytochemical localization of two novel odorant-binding proteins in olfactory sensilla of the scarab beetle Holotrichia oblita Faldermann (Coleoptera: Scarabaeidae). Chem. Senses 2012, 37, 141–150. [Google Scholar] [CrossRef]
  44. Wang, L.; Yin, H.; Zhu, Z.; Yang, S.; Fan, J. A Detailed Spatial Expression Analysis of Wing Phenotypes Reveals Novel Patterns of Odorant Binding Proteins in the Soybean Aphid, Aphis glycines. Front. Physiol. 2021, 12, 702973. [Google Scholar] [CrossRef]
  45. Urban, J. Contribution to the knowledge of development and harmfulness of imported willow leaf beetle (Plagiodera versicolora) (Coleoptera, Chrysomelidae). J. For. Sci. 2005, 51, 481–507. [Google Scholar] [CrossRef] [Green Version]
  46. Xie, W.W.; Sheng, L.J.; Wan, Y.; Weng, X.Q.; Liang, G.H.; Zhang, F.P.; Chen, H. The complete mitochondrial genome of Plagiodera versicolora (Laicharting)(Coleoptera: Chrysomelidae). Mitochondrial DNA B Resour. 2020, 5, 3600–3601. [Google Scholar] [CrossRef] [PubMed]
  47. Qu, C.; Wang, R.; Che, W.; Zhu, X.; Li, F.; Luo, C. Selection and evaluation of reference genes for expression analysis using quantitative real-time PCR in the Asian Ladybird Harmonia axyridis (Coleoptera: Coccinellidae). PLoS ONE 2018, 13, e0192521. [Google Scholar] [CrossRef]
  48. Chen, H.; Qu, M.; Ali, F.; Lin, L.; Xie, M.; Zhang, G.; Su, W. Expression Analysis of Odorant-Binding Protein Genes and Chemosensory Protein Genes in Anomala corpulenta Motschulsky (Coleoptera: Scarabaeidae). J. Kans. Entomol. Soc. 2019, 92, 376. [Google Scholar] [CrossRef]
  49. Yang, C.; Preisser, E.L.; Zhang, H.; Liu, Y.; Dai, L.; Pan, H.; Zhou, X. Selection of Reference Genes for RT-qPCR Analysis in Coccinella septempunctata to Assess Un-intended Effects of RNAi Transgenic Plants. Front. Plant Sci. 2016, 7, 1672. [Google Scholar] [CrossRef] [Green Version]
  50. Zhang, Y.; Sun, M.; Lu, M.-X.; Tang, X.-T.; Du, Y.-Z. Exploring Valid Reference Genes for Quantitative Real-Time PCR Analysis in Sesamia inferens (Lepidoptera: Noctuidae). PLoS ONE 2015, 10, e0115979. [Google Scholar] [CrossRef]
  51. Long, M.; Ting, J.; Xiangya, L.; Haijun, X.; Yingchuan, P.; Wanna, Z. Evaluation of candidate reference genes for gene expression analysis in the brassica leaf beetle, Phaedon brassicae (Coleoptera: Chrysomelidae). PLoS ONE 2021, 16, e0251920. [Google Scholar] [CrossRef]
  52. Fu, H.; Huang, T.; Yin, C.; Xu, Z.; Li, C.; Liu, C.; Wu, T.; Song, F.; Feng, F.; Yang, F. Selection and Validation of Reference Genes for RT-qPCR Normalization in Bradysia odoriphaga (Diptera: Sciaridae) Under Insecticides Stress. Front. Physiol. 2021, 12, 818210. [Google Scholar] [CrossRef] [PubMed]
  53. Ulferts, S.; Prajapati, B.; Grosse, R.; Vartiainen, M.K. Emerging Properties and Functions of Actin and Actin Filaments Inside the Nucleus. Cold Spring Harb. Perspect. Biol. 2021, 13, a040121. [Google Scholar] [CrossRef] [PubMed]
  54. Pan, H.; Yang, X.; Siegfried, B.D.; Zhou, X. A Comprehensive Selection of Reference Genes for RT-qPCR Analysis in a Predatory Lady Beetle, Hippodamia convergens (Coleoptera: Coccinellidae). PLoS ONE 2015, 10, e0125868. [Google Scholar] [CrossRef] [PubMed]
  55. Pabinger, S.; Rodiger, S.; Kriegner, A.; Vierlinger, K.; Weinhausel, A. A survey of tools for the analysis of quantitative PCR (qPCR) data. Biomol. Detect. Quantif. 2014, 1, 23–33. [Google Scholar] [CrossRef] [Green Version]
  56. Elin, V.; Frank, P.; An, M. Reference gene screening of Batrachochytrium dendrobatidis and Batrachochytrium salamandrivorans for quantitative real-time PCR studies. Sci. Rep. 2019, 9, 18534. [Google Scholar] [CrossRef] [Green Version]
  57. Wang, H.; Wen, H.; Li, Y.; Zhang, K.; Liu, Y. Evaluation of potential reference genes for quantitative RT-PCR analysis in spotted sea bass (Lateolabrax maculatus) under normal and salinity stress conditions. PeerJ 2018, 6, e5631. [Google Scholar] [CrossRef] [Green Version]
  58. Kai, F.; Jie-xia, L.; Guo-Ming, X.; Sheng, S.; Sen, L.; Ao-Qi, D.; Feng, W.; Meng-Yao, L.; Zhi-Sheng, X.; Ai-Sheng, X. Selection of appropriate reference genes for RT-qPCR analysis under abiotic stress and hormone treatment in celery. PeerJ 2019, 7, e7925. [Google Scholar] [CrossRef]
  59. Gothandapani, S.; Shan, A.; Jan, B.; Jirí, S.; Roman, M.; Madhab Kumar, S.; Amrita, C.; Amit, R. Reference Gene Selection for Normalizing Gene Expression in Ips Sexdentatus (Coleoptera: Curculionidae: Scolytinae) Under Different Experimental Conditions. Front. Physiol. 2021, 12, 752768. [Google Scholar] [CrossRef]
  60. Xie, J.; Liu, T.; Adel, K.; Yi, C.; Liu, X.; Zhang, Y. Identification and Evaluation of Suitable Reference Genes for RT-qPCR Analysis in Hippodamia variegata (Coleoptera: Coccinellidae) Under Different Biotic and Abiotic Conditions. Front. Physiol. 2021, 12, 669510. [Google Scholar] [CrossRef]
  61. Zhu, S.; Liu, Y.; Liao, M.; Yang, Y.; Bai, Y.; Li, N.; Li, S.; Luan, Y.; Chen, N. Evaluation of Reference Genes for Transcriptional Profiling in Two Cockroach Models. Genes 2021, 12, 1880. [Google Scholar] [CrossRef] [PubMed]
  62. Yang, C.; Pan, H.; Noland, J.E.; Zhang, D.; Zhang, Z.; Liu, Y.; Zhou, X. Selection of reference genes for RT-qPCR analysis in a predatory biological control agent, Coleomegilla maculata (Coleoptera: Coccinellidae). Sci. Rep. 2015, 5, 18201. [Google Scholar] [CrossRef] [PubMed]
  63. Adeyinka, O.S.; Tabassum, B.; Nasir, I.A.; Yousaf, I.; Sajid, I.A.; Shehzad, K.; Batcho, A.; Husnain, T. Identification and validation of potential reference gene for effective dsRNA knockdown analysis in Chilo partellus. Sci. Rep. 2019, 9, 13629. [Google Scholar] [CrossRef] [PubMed]
  64. Wang, R.; Li, F.; Zhang, W.; Zhang, X.; Qu, C.; Tetreau, G.; Sun, L.; Luo, C.; Zhou, J. Identification and expression profile analysis of odorant binding protein and chemosensory protein genes in Bemisia tabaci MED by head transcriptome. PLoS ONE 2017, 12, e0171739. [Google Scholar] [CrossRef] [PubMed]
  65. Zhang, J.; Luo, D.; Wu, P.; Li, H.; Zhang, H.; Zheng, W. Identification and expression profiles of novel odorant binding proteins and functional analysis of OBP99a in Bactrocera dorsalis. Arch. Insect Biochem. Physiol. 2018, 98, e21452. [Google Scholar] [CrossRef]
  66. Wei, H.S.; Qin, J.H.; Cao, Y.Z.; Li, K.B.; Yin, J. Two classic OBPs modulate the responses of female Holotrichia oblita to three major ester host plant volatiles. Insect Mol. Biol. 2021, 30, 390–399. [Google Scholar] [CrossRef]
  67. Chen, X.F.; Xu, L.; Zhang, Y.X.; Wei, D.; Wang, J.J.; Jiang, H.B. Genome-wide identification and expression profiling of odorant-binding proteins in the oriental fruit fly, Bactrocera dorsalis. Comp. Biochem. Physiol. Part D Genom. Proteom. 2019, 31, 100605. [Google Scholar] [CrossRef]
  68. Li, J.; Wang, X.; Zhang, L. Identification of putative odorant binding proteins in the peach fruit borer Carposina sasakii Matsumura (Lepidoptera: Carposinidae) by transcriptome analysis and their expression profile. Biochem. Biophys. Res. Commun. 2019, 508, 1024–1030. [Google Scholar] [CrossRef]
Figure 1. Amplification specificity of primers. (A) Single amplicon with an expected length for each gene was visualized in a 2% agarose gel. 1, Actin, 2, EF1A, 3, α-tubulin, 4, RPL13a, 5, UBC, 6, RPS18, 7, RPL8; M, marker. (B) Melt curve analysis identifies a single peak for each gene.
Agronomy 12 01192 g001
Figure 2. Candidate reference genes expression profiles in P. versicolora. (A), different developmen-tal stages. (B), sexes. (C), different tissues. (D), temperature exposure. (E), dsRNA treatment. (F), pathogen treatment. (G), total samples. The expression levels of candidate reference genes are shown as Ct values. The line in the box represents the median. The upper and lower edges of the interquartile range indicate the 75th and 25th percentiles, respectively. The minimum and maximum values are shown by the whisker caps.
Agronomy 12 01192 g002
Figure 3. Stability of candidate reference genes in P. versicolora under various experimental conditions. The expression stability and relative ranking of candidate reference genes were determined by RefFinder. (A) Different developmental stages; (B) sexes; (C) different tissues; (D) temperature exposure; (E) dsRNA treatment; (F) pathogen treatment.
Agronomy 12 01192 g003
Figure 4. Determination of optimal number of reference genes for different P. versicolora samples. Pairwise variation (V) value below 0.15 suggests that an additional reference gene will not improve normalization.
Agronomy 12 01192 g004
Figure 5. Validation of reference genes. The relative expression level of HSP70 (A) and OBP7 (B) in different tissues of P. versicolora were normalized using RPL8/RPS18, RPL8, or UBC, respectively. Data represent mean values ± SE (n = 3). Different letters indicate statistical differences (p < 0.05, one-way ANOVA).
Agronomy 12 01192 g005
Table 1. Oligonucleotide primers for candidate qRT-PCR reference genes in Plagiodera versicolora (1).
GeneAccession NumberPrimer Sequence (5′→3′)Product Length (bp)R2E
ActinOM885970F:CGTGACTTGACCGACTACCT1180.999103.3%
R:CGAGAGCGACATAGCAGAGT
EF1αOM885971F:TGACTCCAAGGGTGAAGGCG1710.998100.1%
R:TCATCGATGCTCCCGGACAC
α-tubulinOM885972F:TGGTGTCCCACCGGTTTCAA1460.999101.6%
R:TTGTGATCCAGACGTGCCCA
RPL13aOM885973F:AAGTGGAATGGTCCTCGGGC1670.99999.7%
R:CGTCTTGCGGCAATCGTAGC
UBCOM885974F:TGGCTACGTTCTCGTGGGTG1500.998105%
R:ACTTTTGGCGCTGCGAACTG
RPL18SOM885975F:CTTCCTCGTCGGAGCATTCT1100.999102.2%
R:GTTCGCCTTAACTGCCATCAA
RPL8OM885976F:CGACCACCACCAGCTACGAT1570.99796.6%
R:ACCGTGGTCGATTGGCTAGG
This “(1)” is an explanation of the abbreviated portion of the table. E, qRT-PCR efficiency; R2, regression coefficient of the qPCR reaction; F, forward primers; R, reverse primers.
Table 2. Rank order of the candidate Plagiodera versicolora reference genes under different experimental conditions.
RankGeNormNormFinderBestKeeperΔCtRefFinder
GeneStabilityGeneStabilityGeneStabilityGeneStabilityGeneStability
Developmental stage1RPL13a0.368 RPS180.065 RPS180.370 RPS180.714 RPS181.000
RPS180.368
2--EF1A0.131EF1A0.380 EF1A0.718 EF1A2.213
3EF1A0.407 RPL13a0.258RPL80.415 RPL13a0.785 RPL13a2.449
4α-tubulin0.542 α-tubulin0.403RPL13a0.498 α-tubulin0.878 α-tubulin4.229
5RPL80.673 RPL80.511α-tubulin0.616 RPL80.977 RPL84.401
6UBC0.764 UBC0.647UBC0.748 UBC1.092 UBC6.000
7Actin0.930 Actin0.872Actin0.954 Actin1.343 Actin7.000
Sex1RPS180.277 RPS180.096RPS180.287 RPS180.508 RPS181.000
RPL80.277
2--RPL80.125RPL80.341 RPL13a0.514 RPL81.861
3RPL13a0.365 RPL13a0.148Actin0.364 RPL80.525 RPL13a3.080
4EF1A0.381 α-tubulin0.243α-tubulin0.407 EF1A0.570 α-tubulin4.472
5α-tubulin0.398 EF1A0.243RPL13a0.469 α-tubulin0.580 EF1A4.681
6UBC0.530 UBC0.553EF1A0.527 UBC0.880 Actin5.664
7Actin0.644 Actin0.600UBC0.836 Actin0.931 UBC6.236
Thermal exposure1RPL13a0.255 RPS180.114Actin0.218 RPS180.294 RPS181.414
RPS180.255
2--RPL80.146RPL80.247 RPL80.318 RPL82.515
3UBC0.286 RPL13a0.153EF1A0.267 RPL13a0.321 RPL13a2.711
4α-tubulin0.296 EF1A0.16418S0.278 EF1A0.332 EF1A4.120
5RPL80.303 α-tubulin0.167α-tubulin0.321 α-tubulin0.334 Actin4.304
6EF1A0.315 UBC0.180RPL13a0.401 UBC0.343 α-tubulin4.729
7Actin0.329 Actin0.203UBC0.422 Actin0.364 UBC5.244
dsRNA treatment1RPL13a0.454 α-tubulin0.146α-tubulin0.457 α-tubulin0.510 α-tubulin1.000
α-tubulin0.454
2--RPL80.269UBC0.464 RPL13a0.580 RPL13a2.449
3RPL80.470 RPL13a0.275Actin0.477 RPL80.586 RPL83.080
4EF1A0.497 Actin0.299RPS180.501 Actin0.610 Actin3.936
5Actin0.524 EF1A0.352RPL80.557 EF1A0.642 UBC5.118
6RPS180.584 RPS180.360RPL13a0.603 RPS180.655 EF1A5.144
7UBC0.607 UBC0.372 EF1A0.661 UBC0.665 RPS185.422
Pathogen treatment1RPS180.234 RPS180.116 EF1A0.232 RPS180.384 RPS181.316
RPL80.234
2--UBC0.153 α-tubulin0.410 RPL80.412 RPL82.213
3UBC0.284 RPL80.161 RPS180.420 UBC0.412 UBC3.224
4Actin0.338 Actin0.207 RPL80.446 Actin0.453 EF1A3.344
5EF1A0.376 EF1A0.265 Actin0.484 EF1A0.496 Actin4.229
6α-tubulin0.431 α-tubulin0.326 UBC0.536 α-tubulin0.563 α-tubulin4.559
7RPL13a0.469 RPL13a0.335 RPL13a0.752 RPL13a0.566 RPL13a7.000
Tissue1RPL80.099 RPS180.034 Actin0.465 RPL80.609 RPL81.189
RPS180.099
2--RPL80.034 EF1A0.554 RPS180.622 RPS181.565
3RPL13a0.254 RPL13a0.140 18S0.676 RPL13a0.687 RPL13a3.409
4α-tubulin0.330 α-tubulin0.188 RPL80.720 α-tubulin0.714 EF1A3.976
5EF1A0.441 EF1A0.297 RPL13a0.998 EF1A0.816 Actin4.304
6UBC0.646 UBC0.842 α-tubulin1.001 UBC1.262 α-tubulin4.427
7Actin0.885 Actin1.002 UBC1.696 Actin1.482 UBC6.236
Publisher’s Note: MDPI stays neutral with regard to jurisdictional claims in published maps and institutional affiliations.

