Article

Unraveling the Genetic Architecture for Low Temperature Germinability-Related Traits in Rice Using Genome-Wide Association Study

1
Key Laboratory of Crop Physiology, Ecology and Genetic Breeding, Ministry of Education, Nanchang 330045, China
2
BGI Genomics, BGI-Shenzhen, Shenzhen 518083, China
3
Nanchang Agricultural Technology Extension Center, Nanchang 330045, China
*
Author to whom correspondence should be addressed.
Submission received: 21 February 2022 / Revised: 21 April 2022 / Accepted: 28 April 2022 / Published: 16 May 2022
(This article belongs to the Special Issue Genetics Research and Molecular Breeding of Crops)

Abstract

:
Rice is frequently affected by cold weather at high altitudes in temperate and subtropical regions. With the popularity of direct seeding, a better understanding of the genetic mechanisms regulating cold tolerance will enable breeders to develop varieties with strong low temperature germinability (LTG). In this study, six indices including low temperature germination percentage (LTGP), relative germination percentage (RGP), relative plumule length (RPL), plumule length after 6-day recovery (PLR), plumule length recovery rate (PLRR) and recovery ability of plumule length after cold stress (RAPL) were measured to assess LTG, and carried out a genome-wide association study (GWAS) to identify QTL and candidate genes related to LTG by using a natural population comprising 211 rice accessions. A total of 18 QTL including two for LTGP, three for RGP, five for PLR, four for PLRR, two for RPL and two for RAPL were uncovered on 12 chromosome regions located in chromosome 1, 2, 4, 5, 6, 9, 10 and 12. On chromosome 2, qLTGP2 and qRGP2 were co-localized at 3.3 Mb, and qPLR2 and qPLRR2 were co-localized at 5.5 Mb; qLTGP5, qPLR5 and qPLR5 were co-localized at 27.8 Mb on chromosome 5; qPLR6 and qPLRR6 were co-localized at 5.7 Mb on chromosome 6; and qPLR12 and qPLRR12 were co-localized at 23.5 Mb on chromosome 12. These results indicated that some LTG-related traits may share the same genetic pathway. For the 18 LTG-related QTL, seven QTL (qLTGP2, qRGP2, qPLR2, qPLRR2, qLTGP5, qPLR5 and qPLR5) were reported for the first time. According to candidate gene analysis, fourteen genes from five QTL (qLTGP2, qPLR2, qLTGP5, qRAPL10 and qPLR12) were considered as candidate genes and will be further functionally validated in subsequent experiments. QTL with superior candidate genes identified in this study will be useful in improving cold tolerance in rice cultivars. The rice varieties with strong LTG identified in this study will enrich the resources of rice cultivation project.

1. Introduction

Rice (Oryza sativa L.) is a monocotyledon model plant, which is the food source for more than half of the world’s population [1]. Due to the long growing season and frequent low temperatures in high latitudes such as northern China, Korea and Japan, the growing time of low-temperature intolerant rice cultivars must be shortened, which usually results in low yields [2]. In many rice growing countries in Asia, direct seeding has become an alternative to traditional rice transplanting, because it reduces labor demand and production cost, and its importance and popularity are becoming stronger [3]. However, since the temperature of sowing in these areas is often below 15 °C, direct sowing usually results in seedling poor establishment due to low germination rates at low temperatures. Therefore, the LTG of rice has become a crucial factor to determine whether direct seeding rice can thrive. Improvement of LTG allows for high germination vigor and stable seedling establishment under low-temperature production environments, which leads to yield stability, because improved cold tolerance during germination will allow direct seeding rice to be planted earlier in the season, allowing rice crops to take advantage of the usually abundant rainfall early in the growing season [4,5].
The LTG of rice is a very complex trait. Bi-parental mapping studies have identified more than 100 QTL distributed on all 12 chromosomes associated with LTG [6]. Among these QTL, some of them have been fine mapped. For example, qLTG-9 was fine mapped to a 72.3 kb physical region on chromosome 9 [7], qSV-5c was located in a genomic region of approximately 400 kb on chromosome 1 [8] and qLTG6 was delimited to a 45.8 kb physical region on chromosome 6 [9]. qLTG3-1 was the first gene identified to associate with LTG, codes for a secreted hybrid glycine-rich protein, and a single nucleotide substitution differentiates between strong and weak alleles and strongly expressed in the embryo during seed germination [10,11]. However, most of the favorable alleles of the QTL associated with LTG that have been published all derived from japonica rice in bi-parental populations, the major drawback of bi-parental mapping is the limitation of genetic diversity. Moreover, all of these LTG-related QTL were identified using traditional markers, making it difficult to obtain complete, precise positional information about these LTG related QTL [12].
Single nucleotide polymorphisms (SNPs) have been widely used in GWAS instead of traditional SSR markers; therefore, GWAS has become a new strategy to detect QTL and genes related to target traits. In recent years, researchers have made some progress in using GWAS to mine QTL associated with LTG, e.g., 17 LTG-related QTL were identified by using a collection of 63 rice varieties from Japan, and nine QTL were newly discovered [13]; 48 LTG-related QTL were detected by using 202 O. sativa accessions from the Rice Mini-Core (RMC) collection [4]; 42 QTLs were discovered from 421 accessions by GWA mapping, twenty-two of these QTL co-localized with a previous study [14]; 31 markers were detected for low temperature germination using 200 japonica rice varieties by GWAS [15]; two main QTL were identified related to LTG using a natural population comprising 137 rice cultivars and inbred lines [1]; a GWAS was conducted using 257 rice accessions from around the world and a total of 51 QTLs were identified during germination in rice [16]; and 11 QTLs for LTG were identified using 375 rice accessions selected from the Rice Diversity Panel 2 through GWAS, while 4 QTL were firstly reported [17]. A total of 53 QTL were found to be associated with LTG, of which 20 were located in previously reported QTL using 187 rice natural accessions, OsSAP16 was identified by GWAS and it encodes a stress-associated protein containing two AN1-C2H2 zinc finger domains and acts as an essential LTG regulator [18]. To date, however, except for OsSAP16, few genes were found to be associated with LTG cloned by GWAS. Therefore, more germplasm resources must be used to mine more candidate genes to understand the genetic mechanism of LTG.
In our study, 211 rice accessions combine with 36,727 SNPs were used to perform a GWAS to evaluate LTG, 6 cold tolerance indices reflecting LTG were developed and assessed, a total of 18 QTL and 14 candidate genes were identified and will be useful to breeding more cold tolerance varieties.

2. Materials and Methods

2.1. Plant Material and Population Structure Analysis

All materials in this study were derived from Li. et al. [19]. A natural population of 211 rice accessions selected from International Rice Research Institute (https://www.irri.org/, accessed on 1 February 2022) was used to evaluate the six LTG-related indices (Table S1). These varieties were mainly collected from 15 different provinces in China as well as from the Philippines and Japan. Their geographical range spans from 15° to 48° north latitude, including temperate, tropical and subtropical regions. Population structure analysis by Structure software shows that when K = 2, CV error value is the lowest, suggesting that the 211 rice accessions could be divided into two subgroups, representing Indica (130 accessions) and Japonica (81 accessions) (Figure S1A). The PCA analysis by Tassel 5.2.73 software demonstrated that the 211 rice accessions mainly formed two subgroups with different distributions along the three eigenvectors (Figure S1B). Phylogenetic analysis based on their genotypes determined by the 36,727 SNPs (https://snp-seek.irri.org/, accessed on 1 February 2022) demonstrated that the 211 rice accessions could be clustered into two subgroups (Figure S1C). Pairwise relative kinship analysis by Tassel 5.2.73 software of 211 rice landrace, the result clearly indicated that there was no strong relatedness among our population (Figure S1D). The rice materials were collected in accordance with local laws without any conflict of interest. The population was developed in the experimental field at Jiangxi Agricultural University in Nanchang, Jiangxi Province and Linwang, Hainan Province, for more than four generations.

2.2. Indices for Evaluating LTG

The seeds were placed in an oven at 45 °C for 48 h to break seed dormancy and were disinfected with sodium hypochlorite solution, then washed three times with sterile water. Each accession was represented by up to 30 seeds per Petri dish with two sheets of filter paper in a triplicate randomized block design for up to 90 seeds (3 Petri dishes) per experiment. The Petri dishes were placed in a growth incubator at 15 °C and treated in darkness for 15 days, followed by 6 days of room temperature recovery. Meanwhile, the germination experiment was carried out at room temperature as a control group. Germinated seeds were counted in each Petri dish obtained after 6 days in a room temperature growth chamber (control) and after 15 days in a 15 °C growth chamber (cold treatment), as well as the plumule lengths were recorded after 6 days in a room temperature growth chamber. Germination was defined as visible coleoptile emergence through the lemma and palea (hull). The low temperature germination percent (LTGP) was calculated as the percent of seed germination at 15 °C after 15 days. The mean LTGP index were recorded from three Petri dishes and normalized with the mean percent germinability of seeds at room temperature (NTG) which was used to calculate the relative germination percentage (RGP), RGP was determined as LTGP divided by NTG times 100. After 15 days of cold treatment, 10 germinated seeds were randomly selected from each Petri dish for coleoptile length measurement, and the average value was taken to represent coleoptile lengths after cold stress (CLC). After the recovery period of 6 days, plumule lengths of 10 germinated seedlings were randomly selected were measured and namely plumule length after 6-day recovery (PLR), the plumule length recovery rate (PLRR) index was calculated as (PLR minus CLC) divided by 6; in the control group, plumule lengths of 10 germinated seedlings were randomly selected were measured after 6 days, the relative plumule length (RPL) index was calculated as CLC divided by plumule lengths at control group, the recovery ability of plumule length after cold stress (RAPL) index was calculated as (PLR minus CLC) divided by plumule lengths at control group. All the length indexes in the experiment were manually measured by a ruler. All experiments were repeated three times.

2.3. Statistical Analysis, GWAS Mapping and Candidate Gene Analysis

The phenotypic data were sorted out by EXCEL 2010, and the correlation coefficients were calculated by SPSS 26.0 software. The GWAS analysis was performed with a line mixed model to determine the association between genotype and evaluated phenotype using Tassel 5.2.73 software. LD Block was performed to identified candidate gene regions by Haploview 4.2, the information of candidate genes was collected and classified by NCBI (https://0-www-ncbi-nlm-nih-gov.brum.beds.ac.uk/, accessed on 1 February 2022), China Rice Data Center (https://www.ricedata.cn/, accessed on 1 February 2022) and Rice Genome Annotation Project (http://rice.uga.edu/index.shtml, accessed on 1 February 2022).

2.4. Gene Expression Analysis

For analysis of the expression pattern of candidate genes, total RNA was extracted from embryos collected from the seeds of cultivars (two high-LTG value accessions and two low-LTG value accessions) using an RNA extraction kit (Promega Biotech, Shanghai, http://www.promega.com.cn, accessed on 1 February 2022). First-strand cDNA synthesis was performed using HiScript II QRT SuperMix (Vazyme, http://www.vazyme.com, accessed on 1 February 2022). Gene expression levels were calculated based on the analysis of variance (ANOVA) of three technical replicates. Te OsActin was included as an internal control.

3. Results

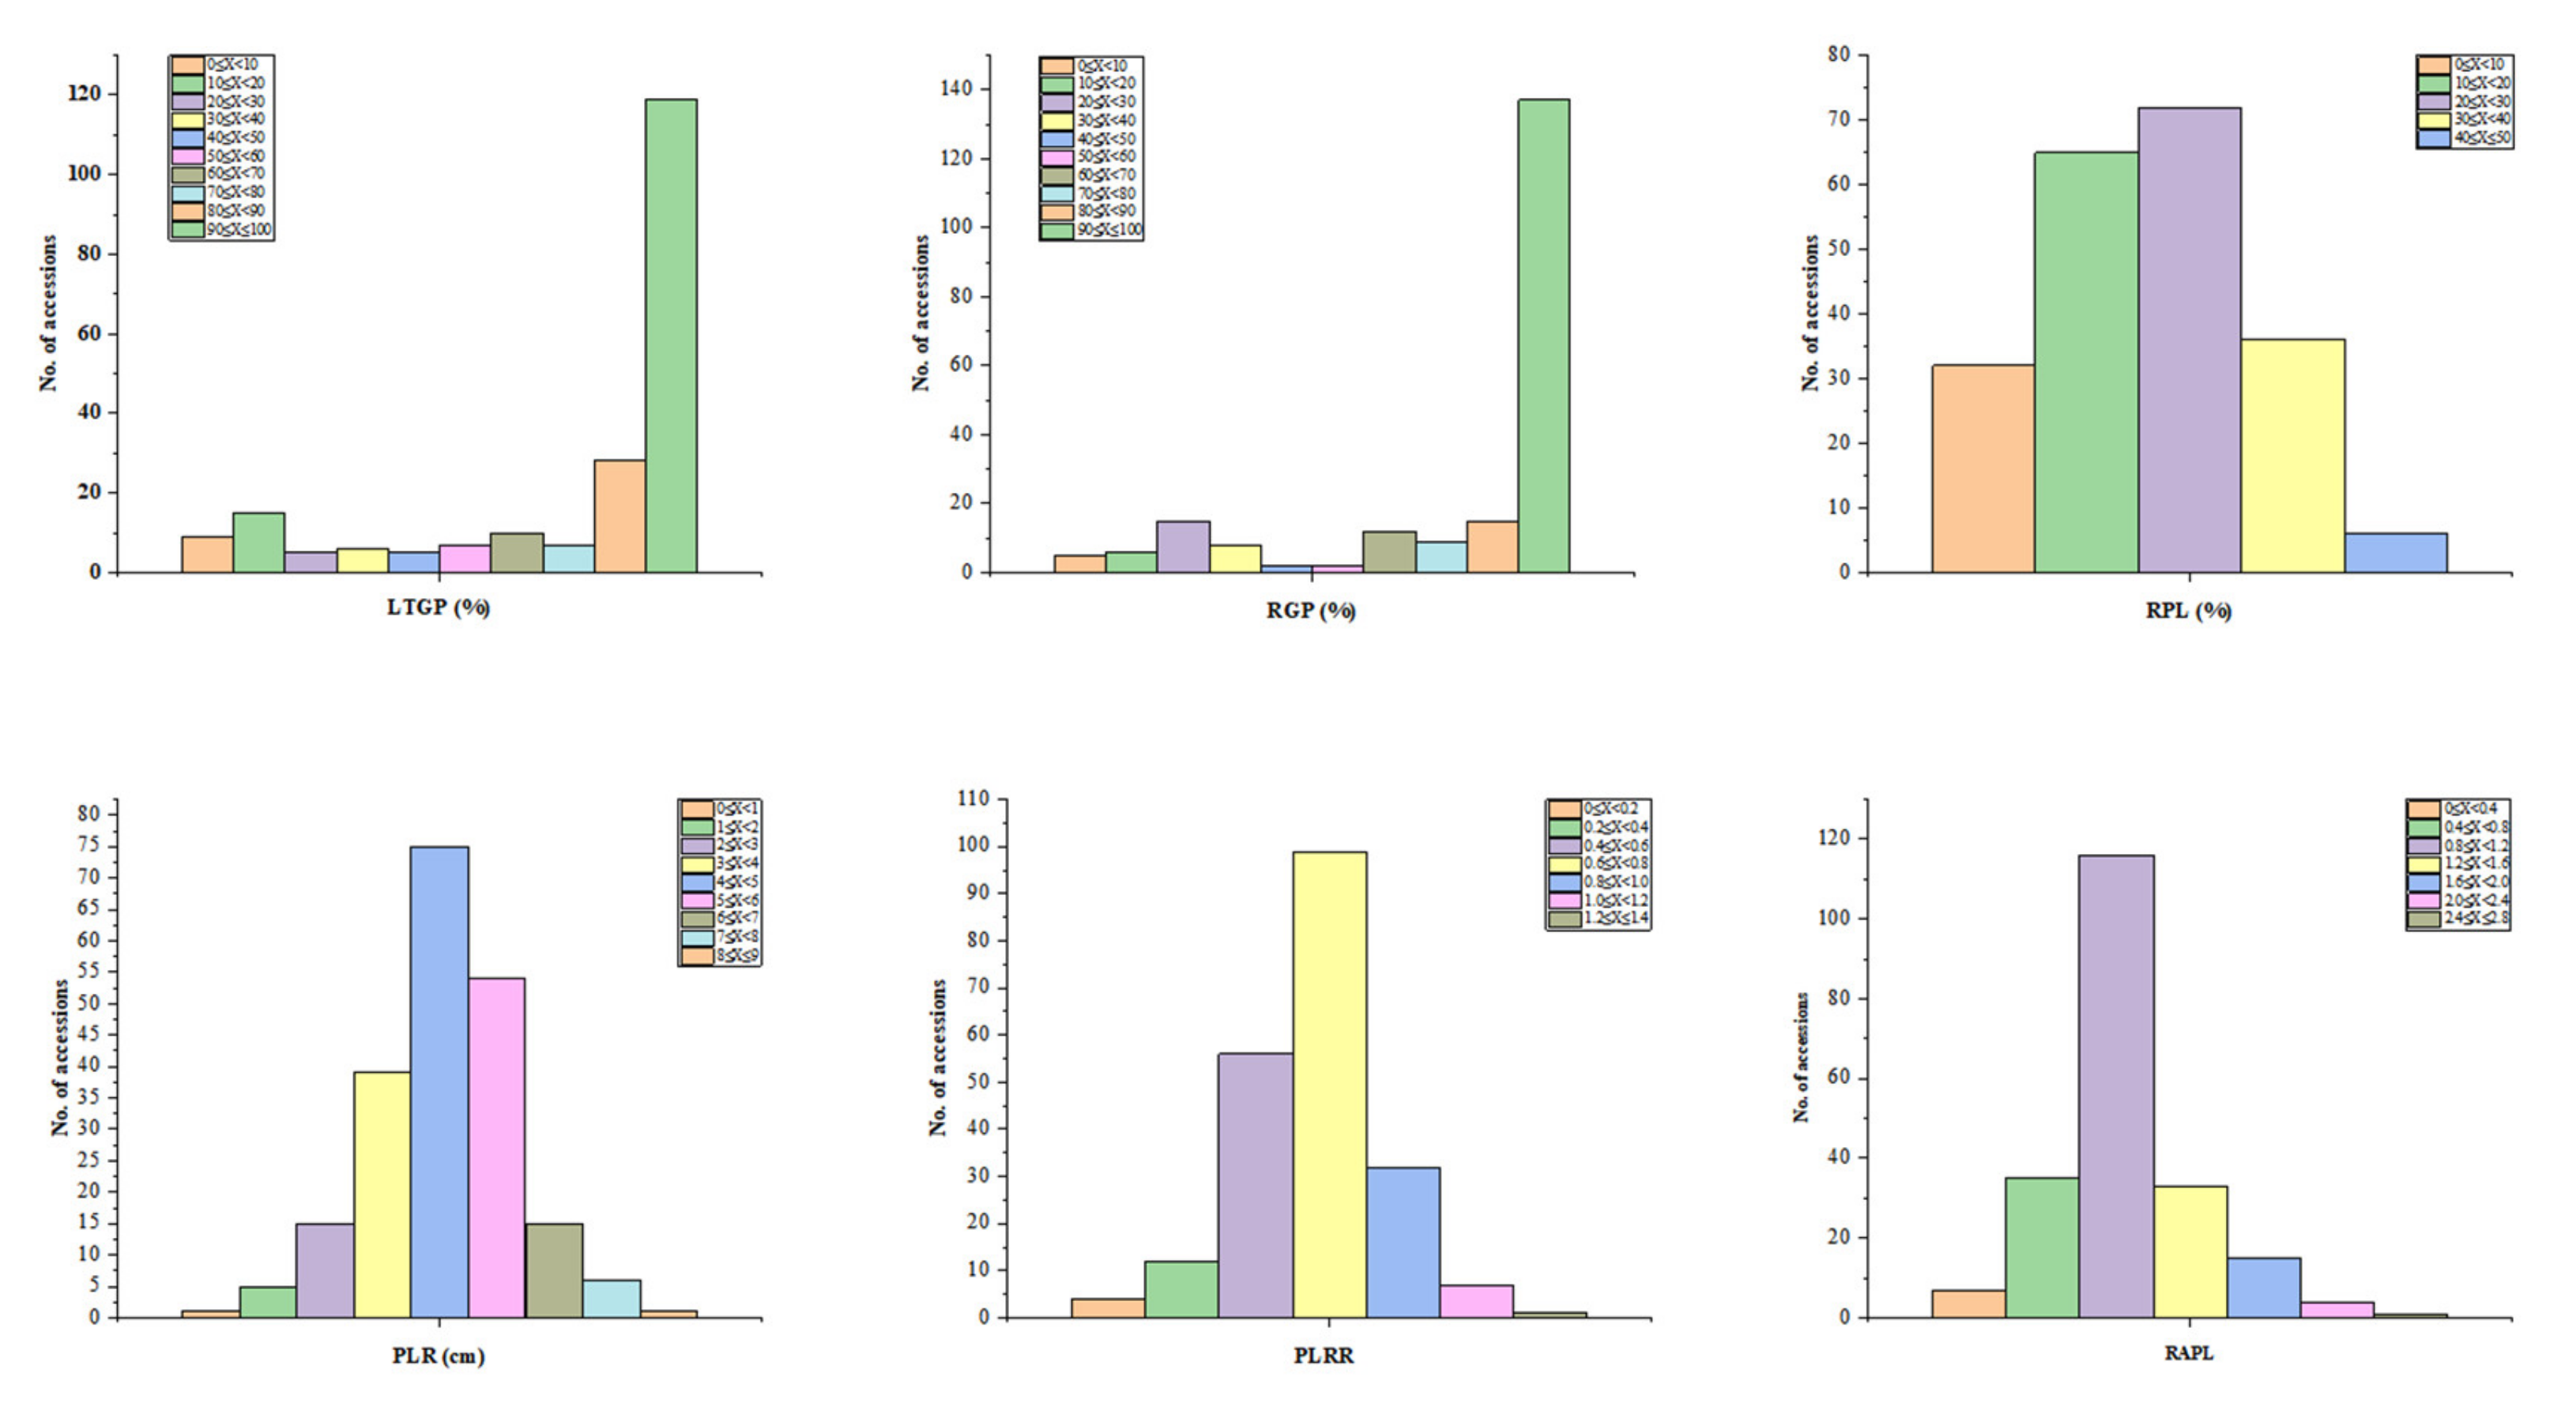
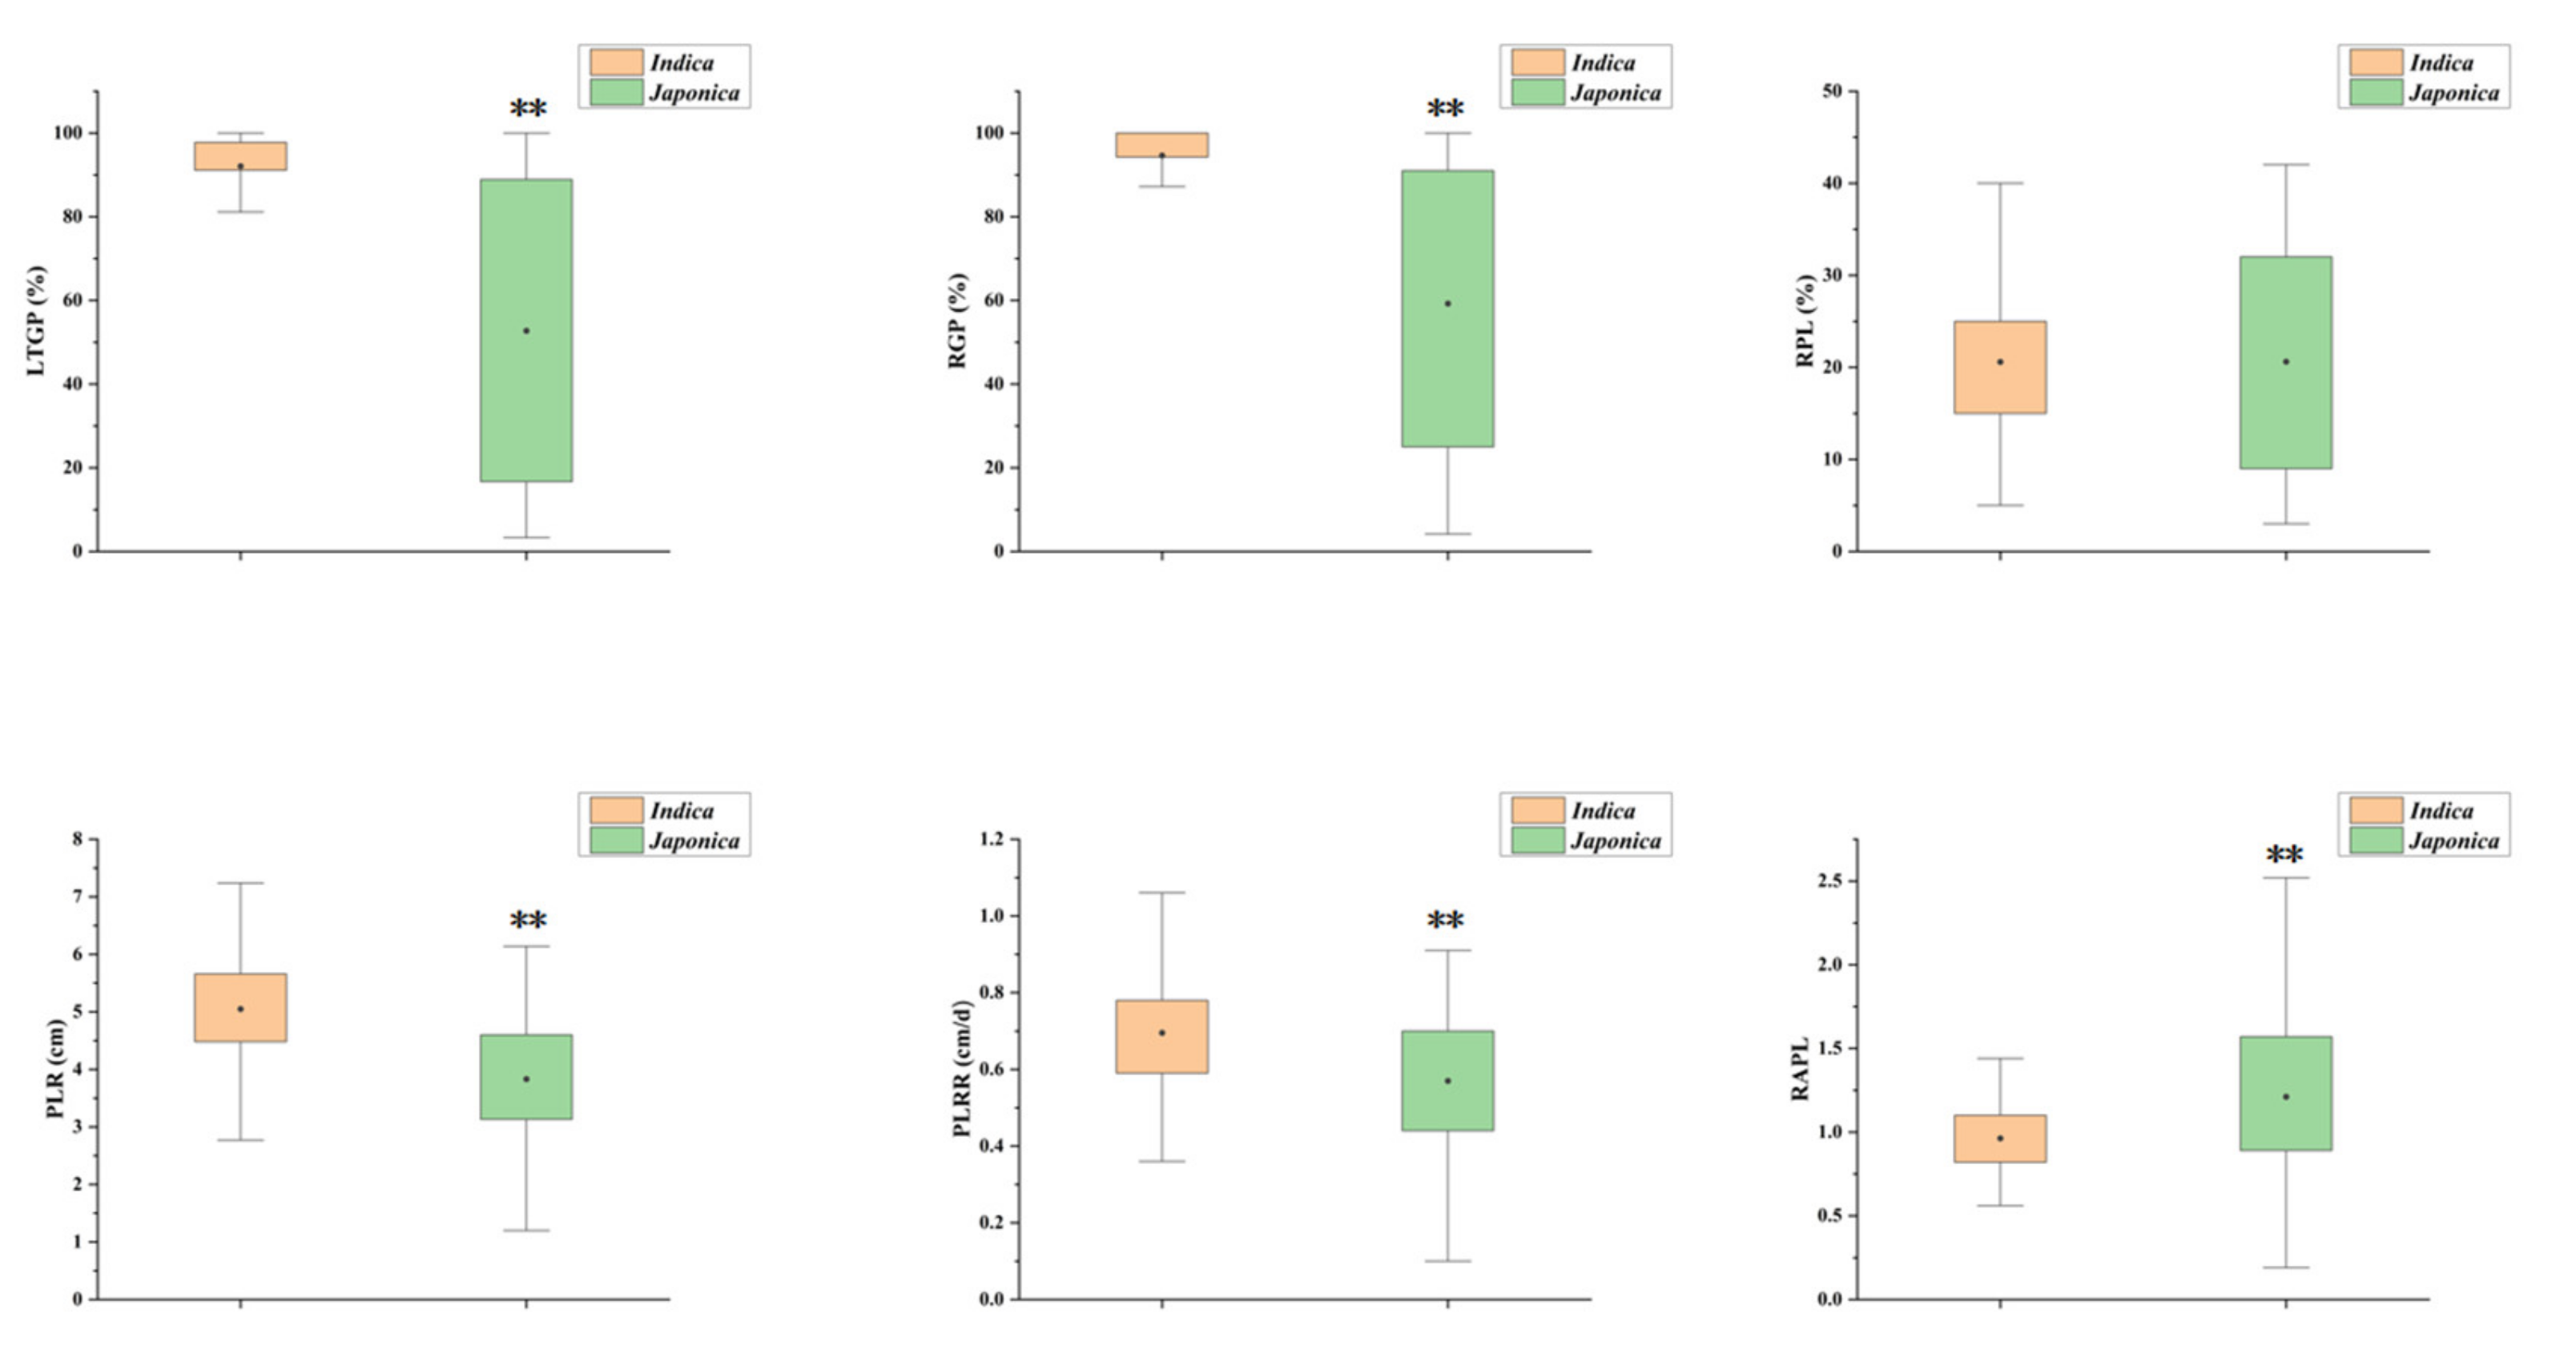
3.1. Assessment of Six LTG Indices in 211 Rice Accessions

In this study, six phenotypic assays (LTGP, RGP, RPL, PLR, PLRR and RAPL) were assessed as potential QTL mapping indices reflecting LTG of rice. Large variations in LTG were observed in 211 rice accessions under 15 °C low temperature (Table S1). LTGP values ranging from 3.3 to 100.0%, with an average of 76.8%, RGP values ranging from 4.1 to 100.0%, with an average of 80.9%, the LTGP and RGP distribution in 211 rice accessions was continuous, with more in the high LTGP and high RGP side; RPL values ranging from 3.0 to 42.0%, with an average of 20.6%, PLR values ranging from 0.8 to 8.1, with an average of 4.6, PLRR values ranging from 0.1 to 1.2, with an average of 0.6 and RAPL values ranging from 0.2 to 2.5, with an average of 1.1. The values of these four indices confirm normal distribution approximately (Figure 1).
The LTG indices’ comparisons among different subgroups revealed that the values of LTGP, RGP, PLR and PLRR of the indica group was significantly higher than that of the japonica groups (p < 0.01), while the RAPL of the japonica group was significantly higher than that of the indica group; in addition, there was no significant difference in the RPL index between indica and japonica rice (p < 0.01) (Figure 2).
To determine how the means of different LTG indices for each accession were compared to each other, pairwise Pearson’s correlation analysis was conducted (Table 1; Figure 3). This showed LTGP was significantly correlated with the other five indices, and the correlation coefficient with RGP was the largest, which was negatively correlated with RAPL, and RGP has a similar situation to LTGP; PLR and PLRR were positively correlated significantly, and both were positively correlated with RAPL; and RPL was negatively correlated with PLRR and RAPL but did not reach a significant degree. This suggests that the RPL and RAPL indices have a relatively unique genetic program while LTGP and RGP, PLR and PLRR might share genetic pathways, respectively.

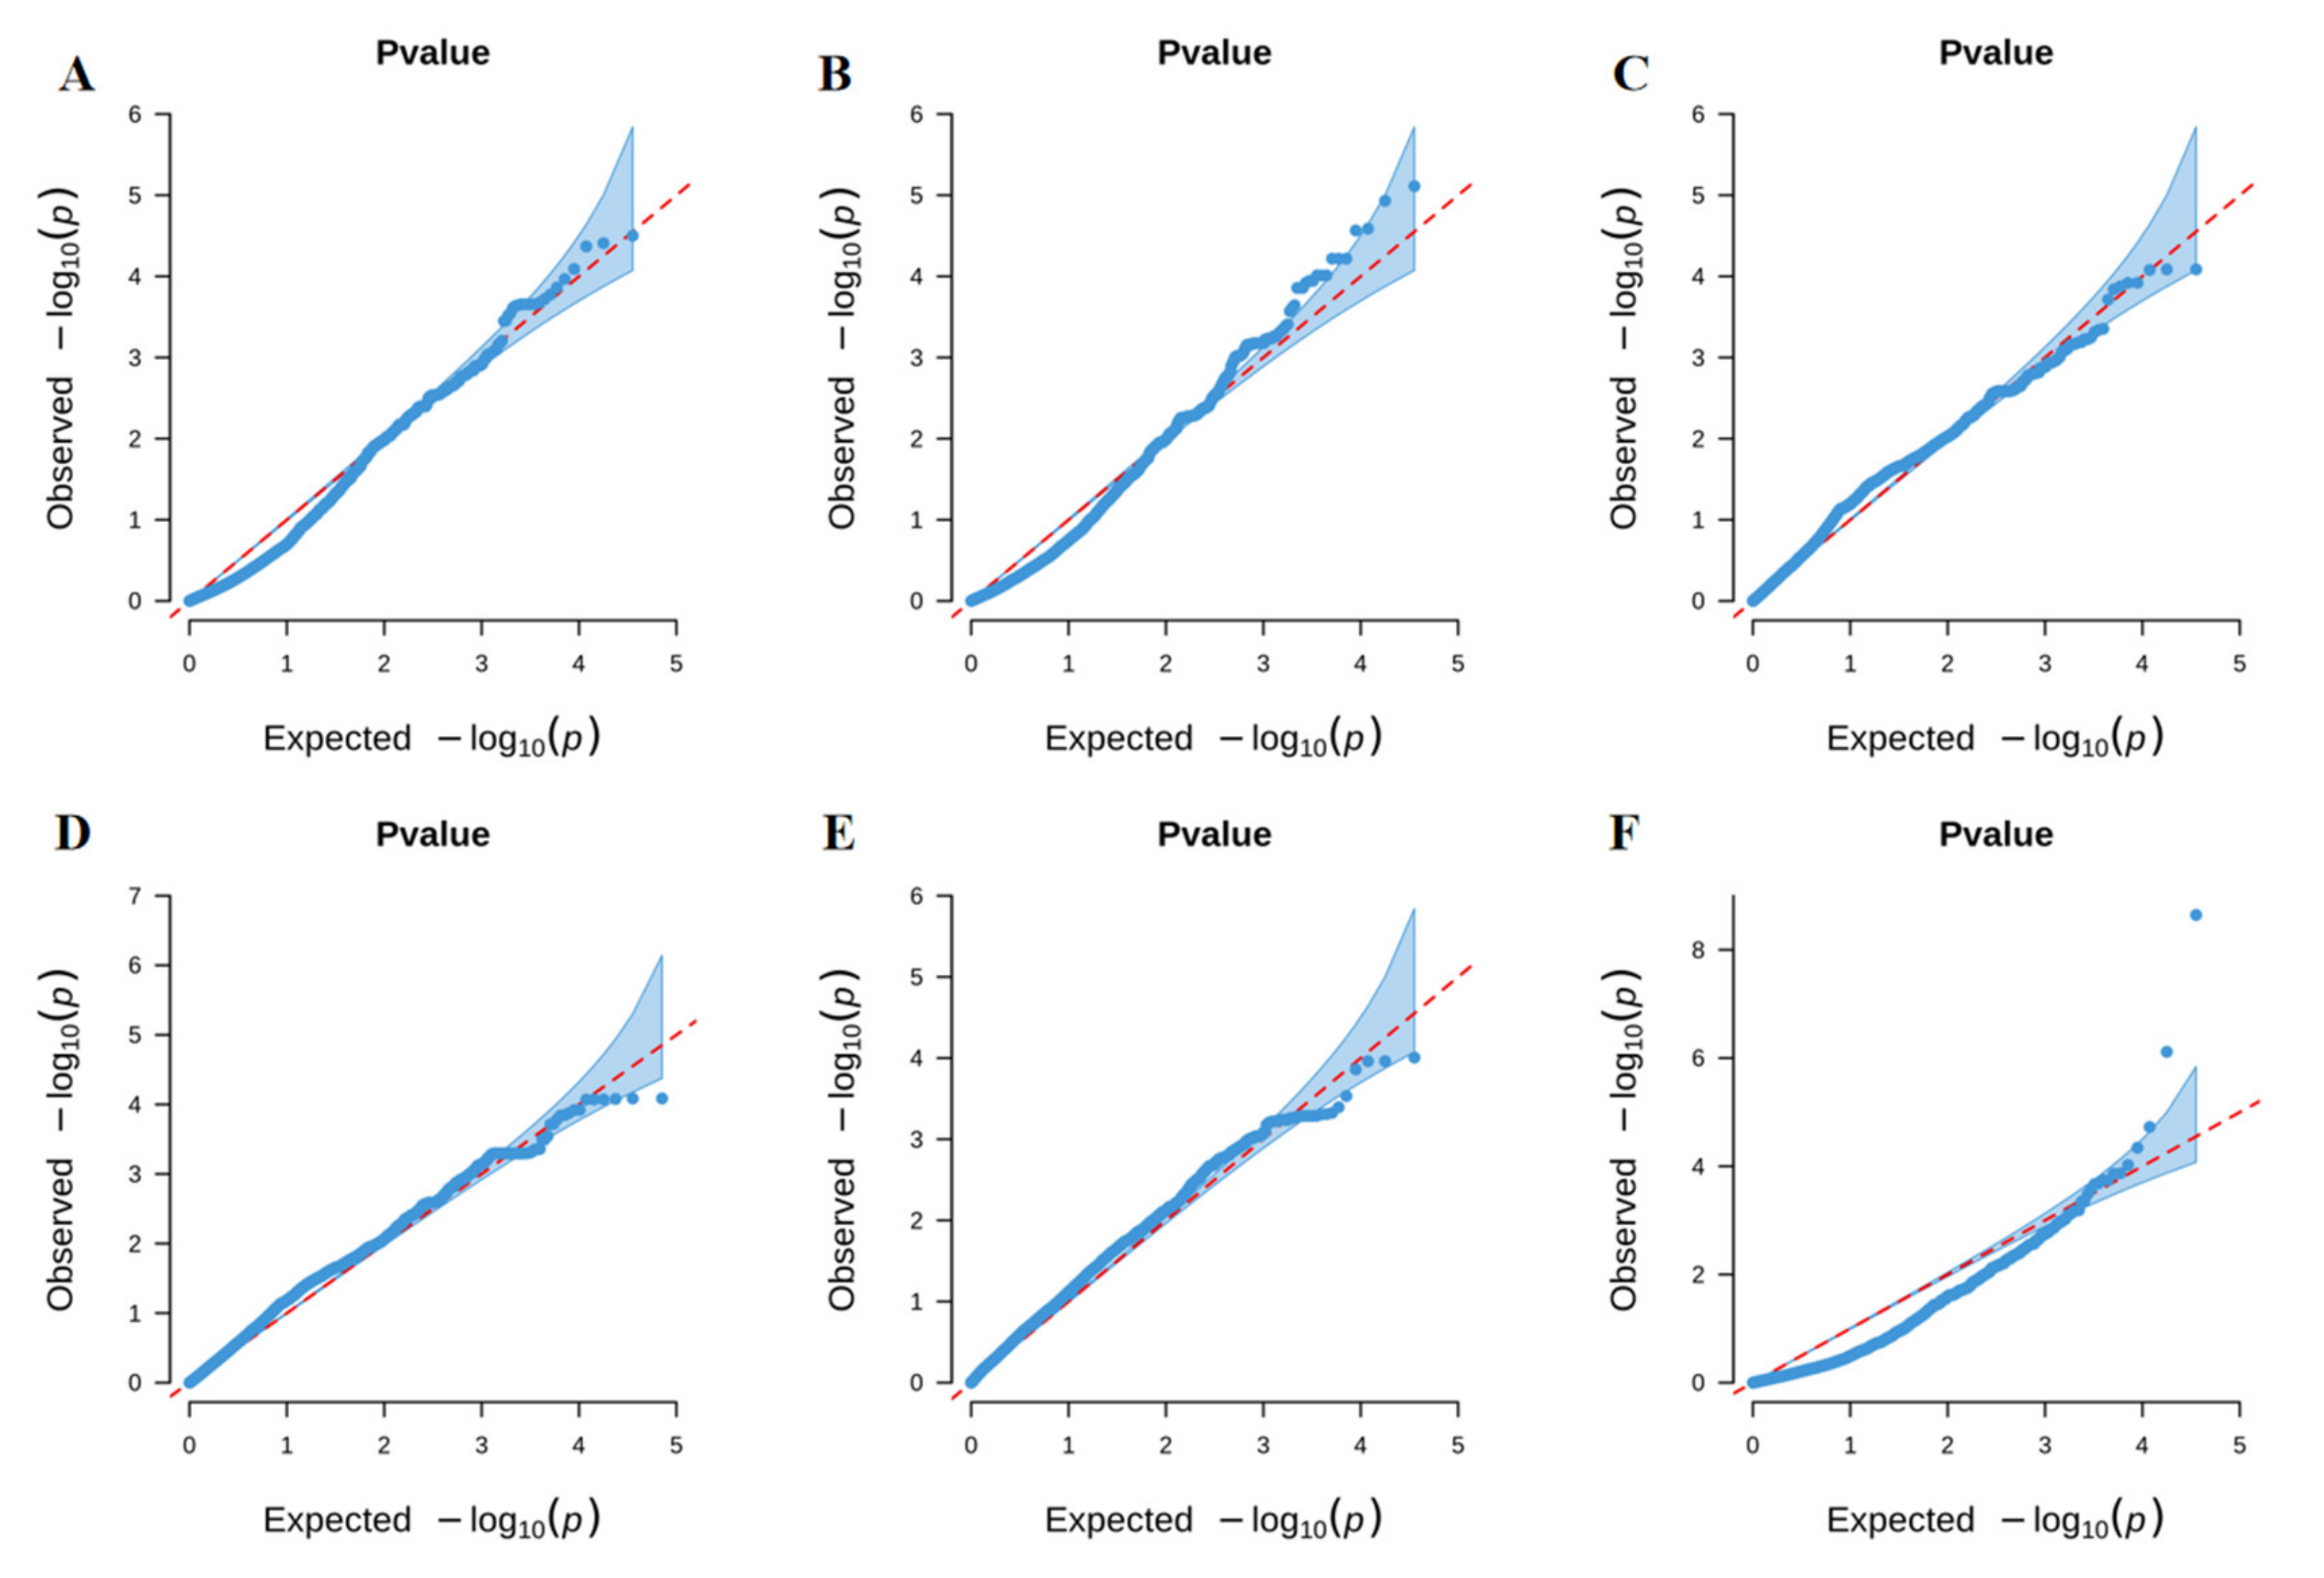
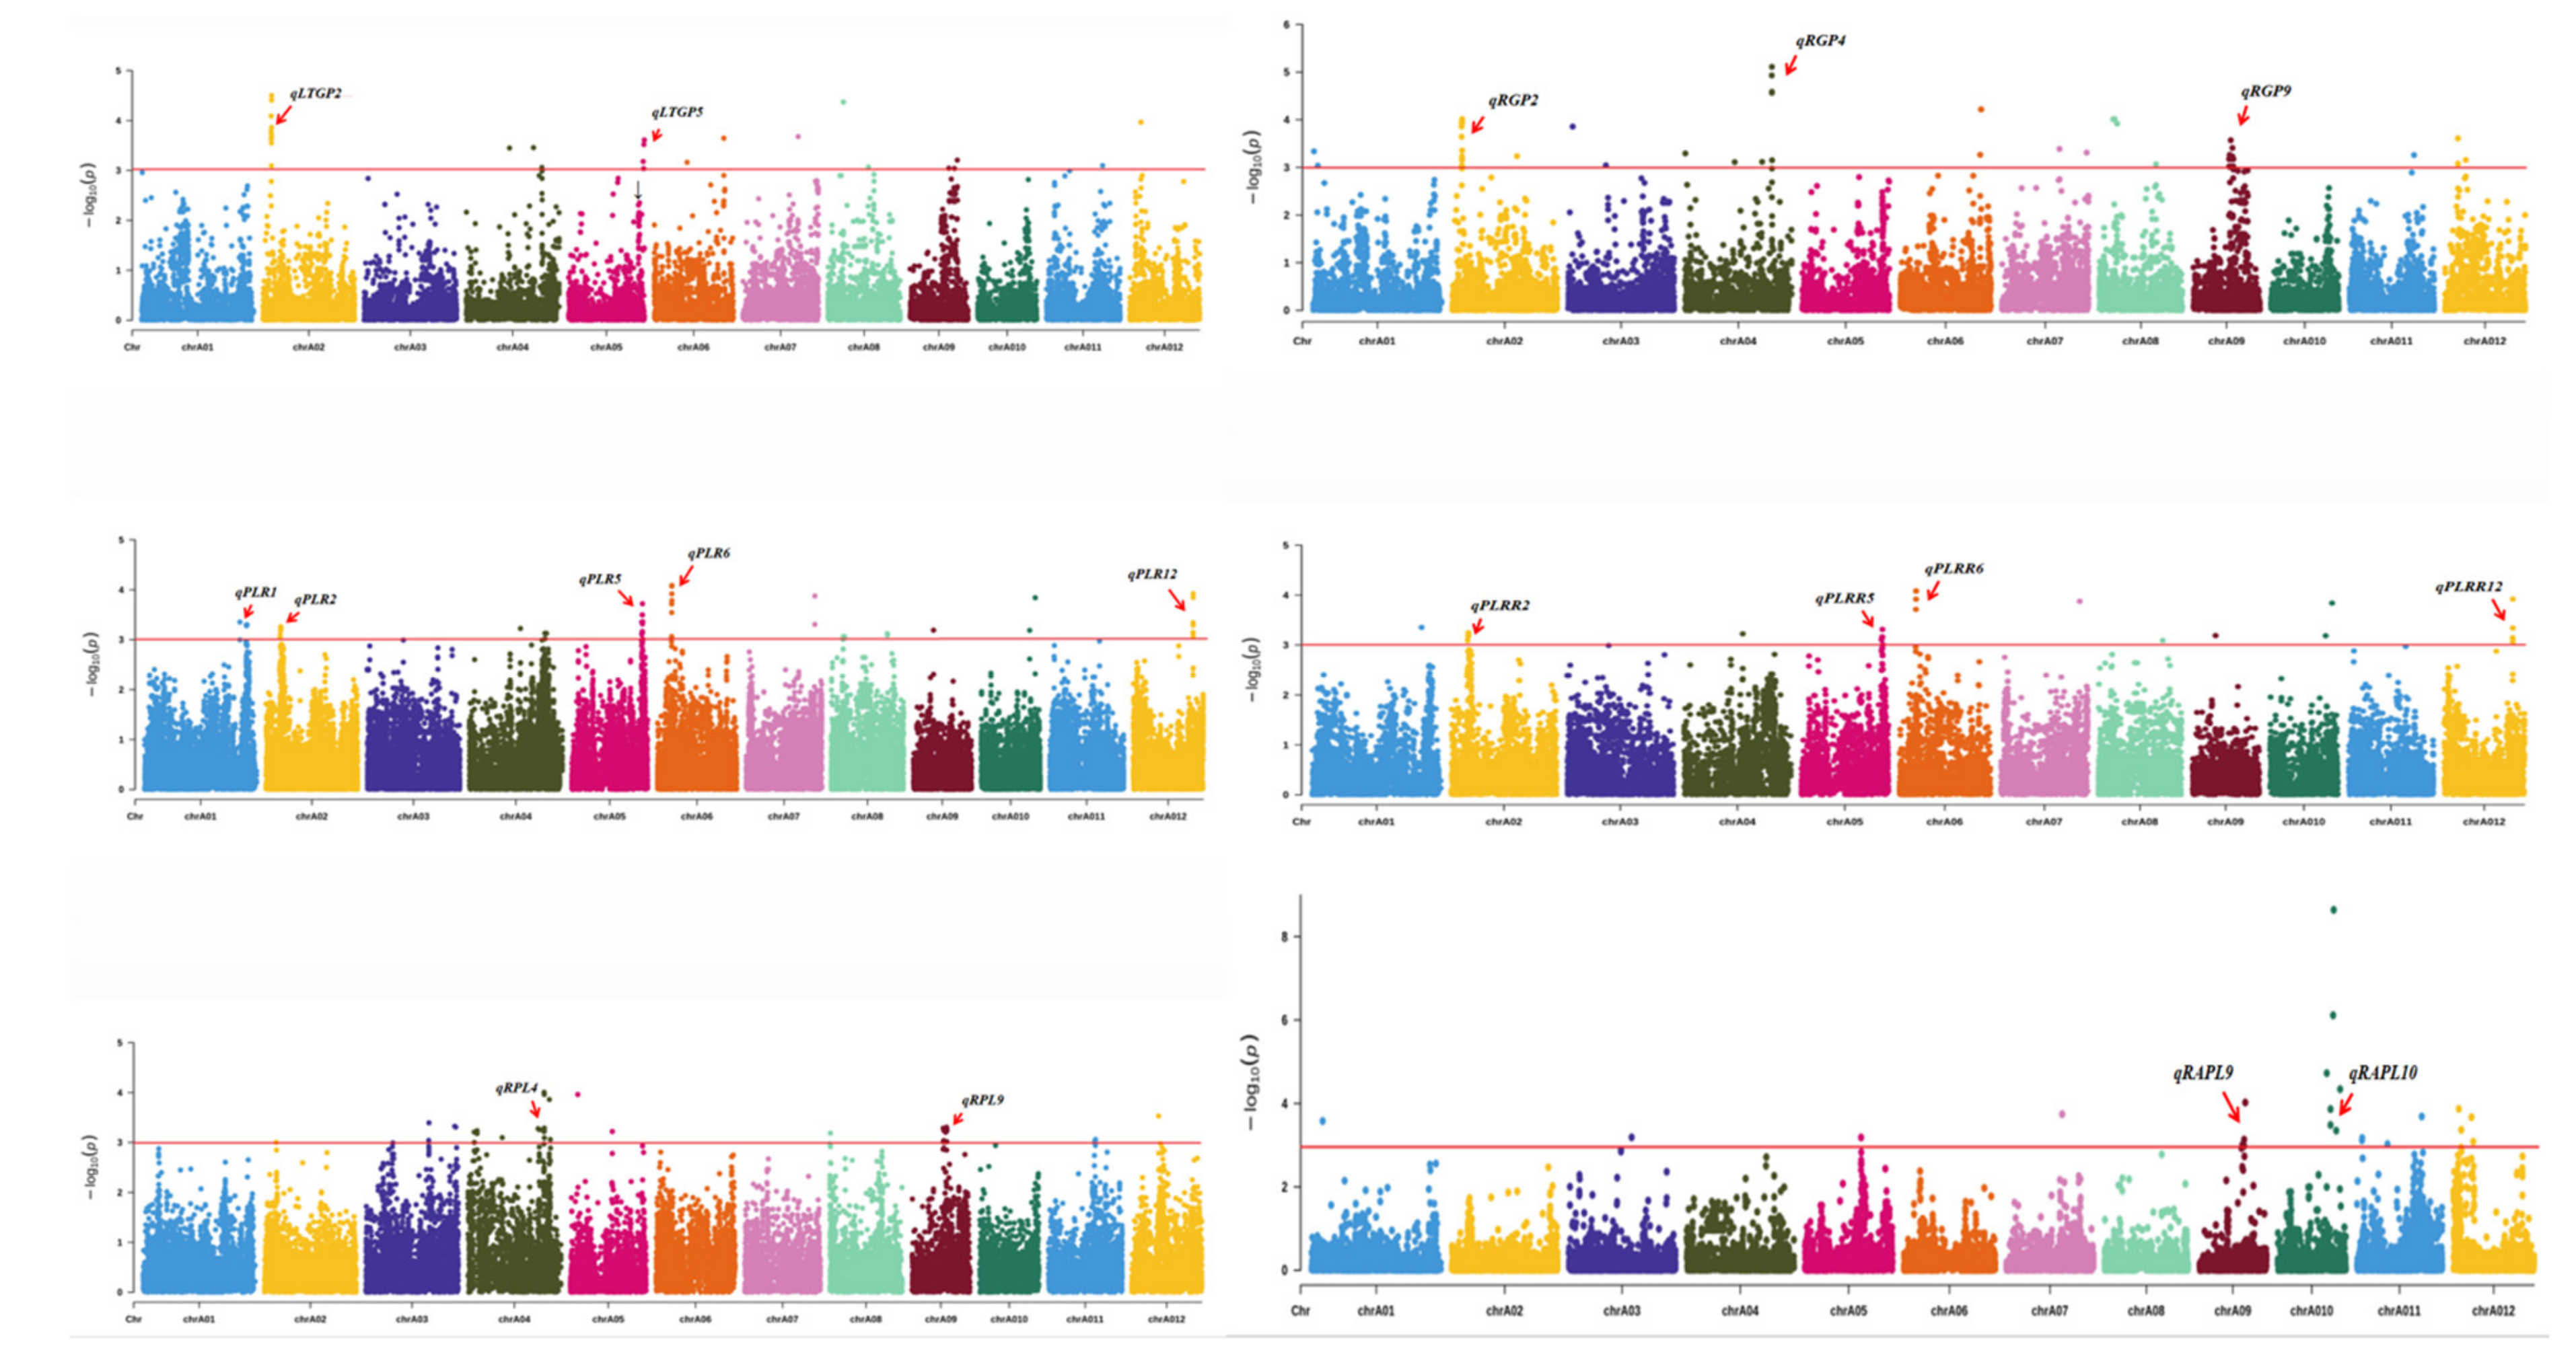
3.2. GWAS for Identification of QTLs

Based on the six indices’ phenotype data and 36,727 K SNP database, PCA and KINSHIP were used as covariates for GWAS in a mixed linear model. A total of 18 QTL were identified at p < 0.001, with two, three, five, four, two and two QTL were discovered to be significantly associated with LTGP, RGP, PLR, PLRR, RPL and RAPL, respectively (Table 2; Figure 4 and Figure 5). The amount of phenotypic variance explained (R2) ranged from 6.27% to 7.08% for LTGP, 3.98% to 7.52% for RGP, 7.29% to 8.59% for RPL, 6.02% to 10.31% for PLR, 6.51% to 8.79% for PLRR and 8.79% to 11.88% for RAPL. Among these QTL, seven were discovered for the first time, qLTGP2 and qRGP2 were co-localized at 3.3 Mb, and qPLR2 and qPLRR2 were co-localized at 5.5 Mb on chromosome 2; three QTL from the three indices (qLTGP5, qPLR5 and qPLRR5) share the same SNP peak at 27.8 Mb on chromosome 5. In addition, eleven QTL were co-localized with those from previous studies, qPLR1 was located at 39.9 Mb on chromosome 1 overlapped with SNAC2 [20]; qRGP4 and qRPL4 located at 29.7 Mb and 29.9 Mb on chromosome 4, respectively, were located at the same interval as OsAOX1a [21]; and qPLR6 and qPLRR6 were co-localized at 5.7 Mb on chromosome 6 overlapped with OsABF2 [22]. On chromosome 9, the three QTL (qRGP9, qRPL9 and qRAPL9) with different peak SNPs were all located in a QTL, clr9, with a large interval (2.6~16.3 Mb) [23], and it was further found that qRGP9 was co-located with OsDREB6 and qRAPL9 was co-located with OsWRKY76 [24,25]. qRAPL10 overlapped with qLTG10-1, which harbored the highest-peak SNP, chr19057293, which explain 11.88% of the total phenotypic variation [4]. The remaining two QTL on chromosomes 12 (qPLR12 and qPLRR12) were co-located with each other and overlapped with qLTSS12-1 [4]. This further suggests LTGP-QTL and RGP-QTL, PLR-QTL and PLRR-QTL share overlapping or converging genetic mechanisms, respectively.

3.3. Candidate Gene Analysis

As shown in Table 2, five QTL were detected in at least two indices, namely qLTGP2 (qRGP2), qPLR2 (qPLRR2), qLTGP5 (qPLR5 and qPLRR5), qPLR6 (qPLRR6) and qPLR12 (qPLRR12). Considering that a cold tolerance gene had been characterized from qPLR6 region, qPLR6 was excluded from candidate gene analysis. In addition, qRAPL10 explained the largest phenotypic variation and was also considered within the scope of candidate gene analysis. According to the LD decay analysis, a total 61 kb region was identified as the candidate region for qLTGP2, 487 kb for qPLR2, 440 kb for qLTGP5, 353 kb for qRAPL10 and 217 kb for qPLR12 (Figure S2). To narrow down the candidate gene numbers, genes annotated as retrotransposons, transposons, hypothetical proteins and unknown proteins were excluded from the analysis; thus, 161 genes were obtained from the five QTL (Table S2). Furthermore, based on NCBI (https://0-www-ncbi-nlm-nih-gov.brum.beds.ac.uk/, accessed on 1 February 2022), China Rice Data Center (https://www.ricedata.cn/, accessed on 1 February 2022) and Rice Genome Annotation Project (http://rice.uga.edu/index.shtml, accessed on 1 February 2022), 14 genes were screened out of 161 genes in these 5 QTL regions that may be involved in cold stress, oxidative stress or seed germination in previous studies (Table 3).

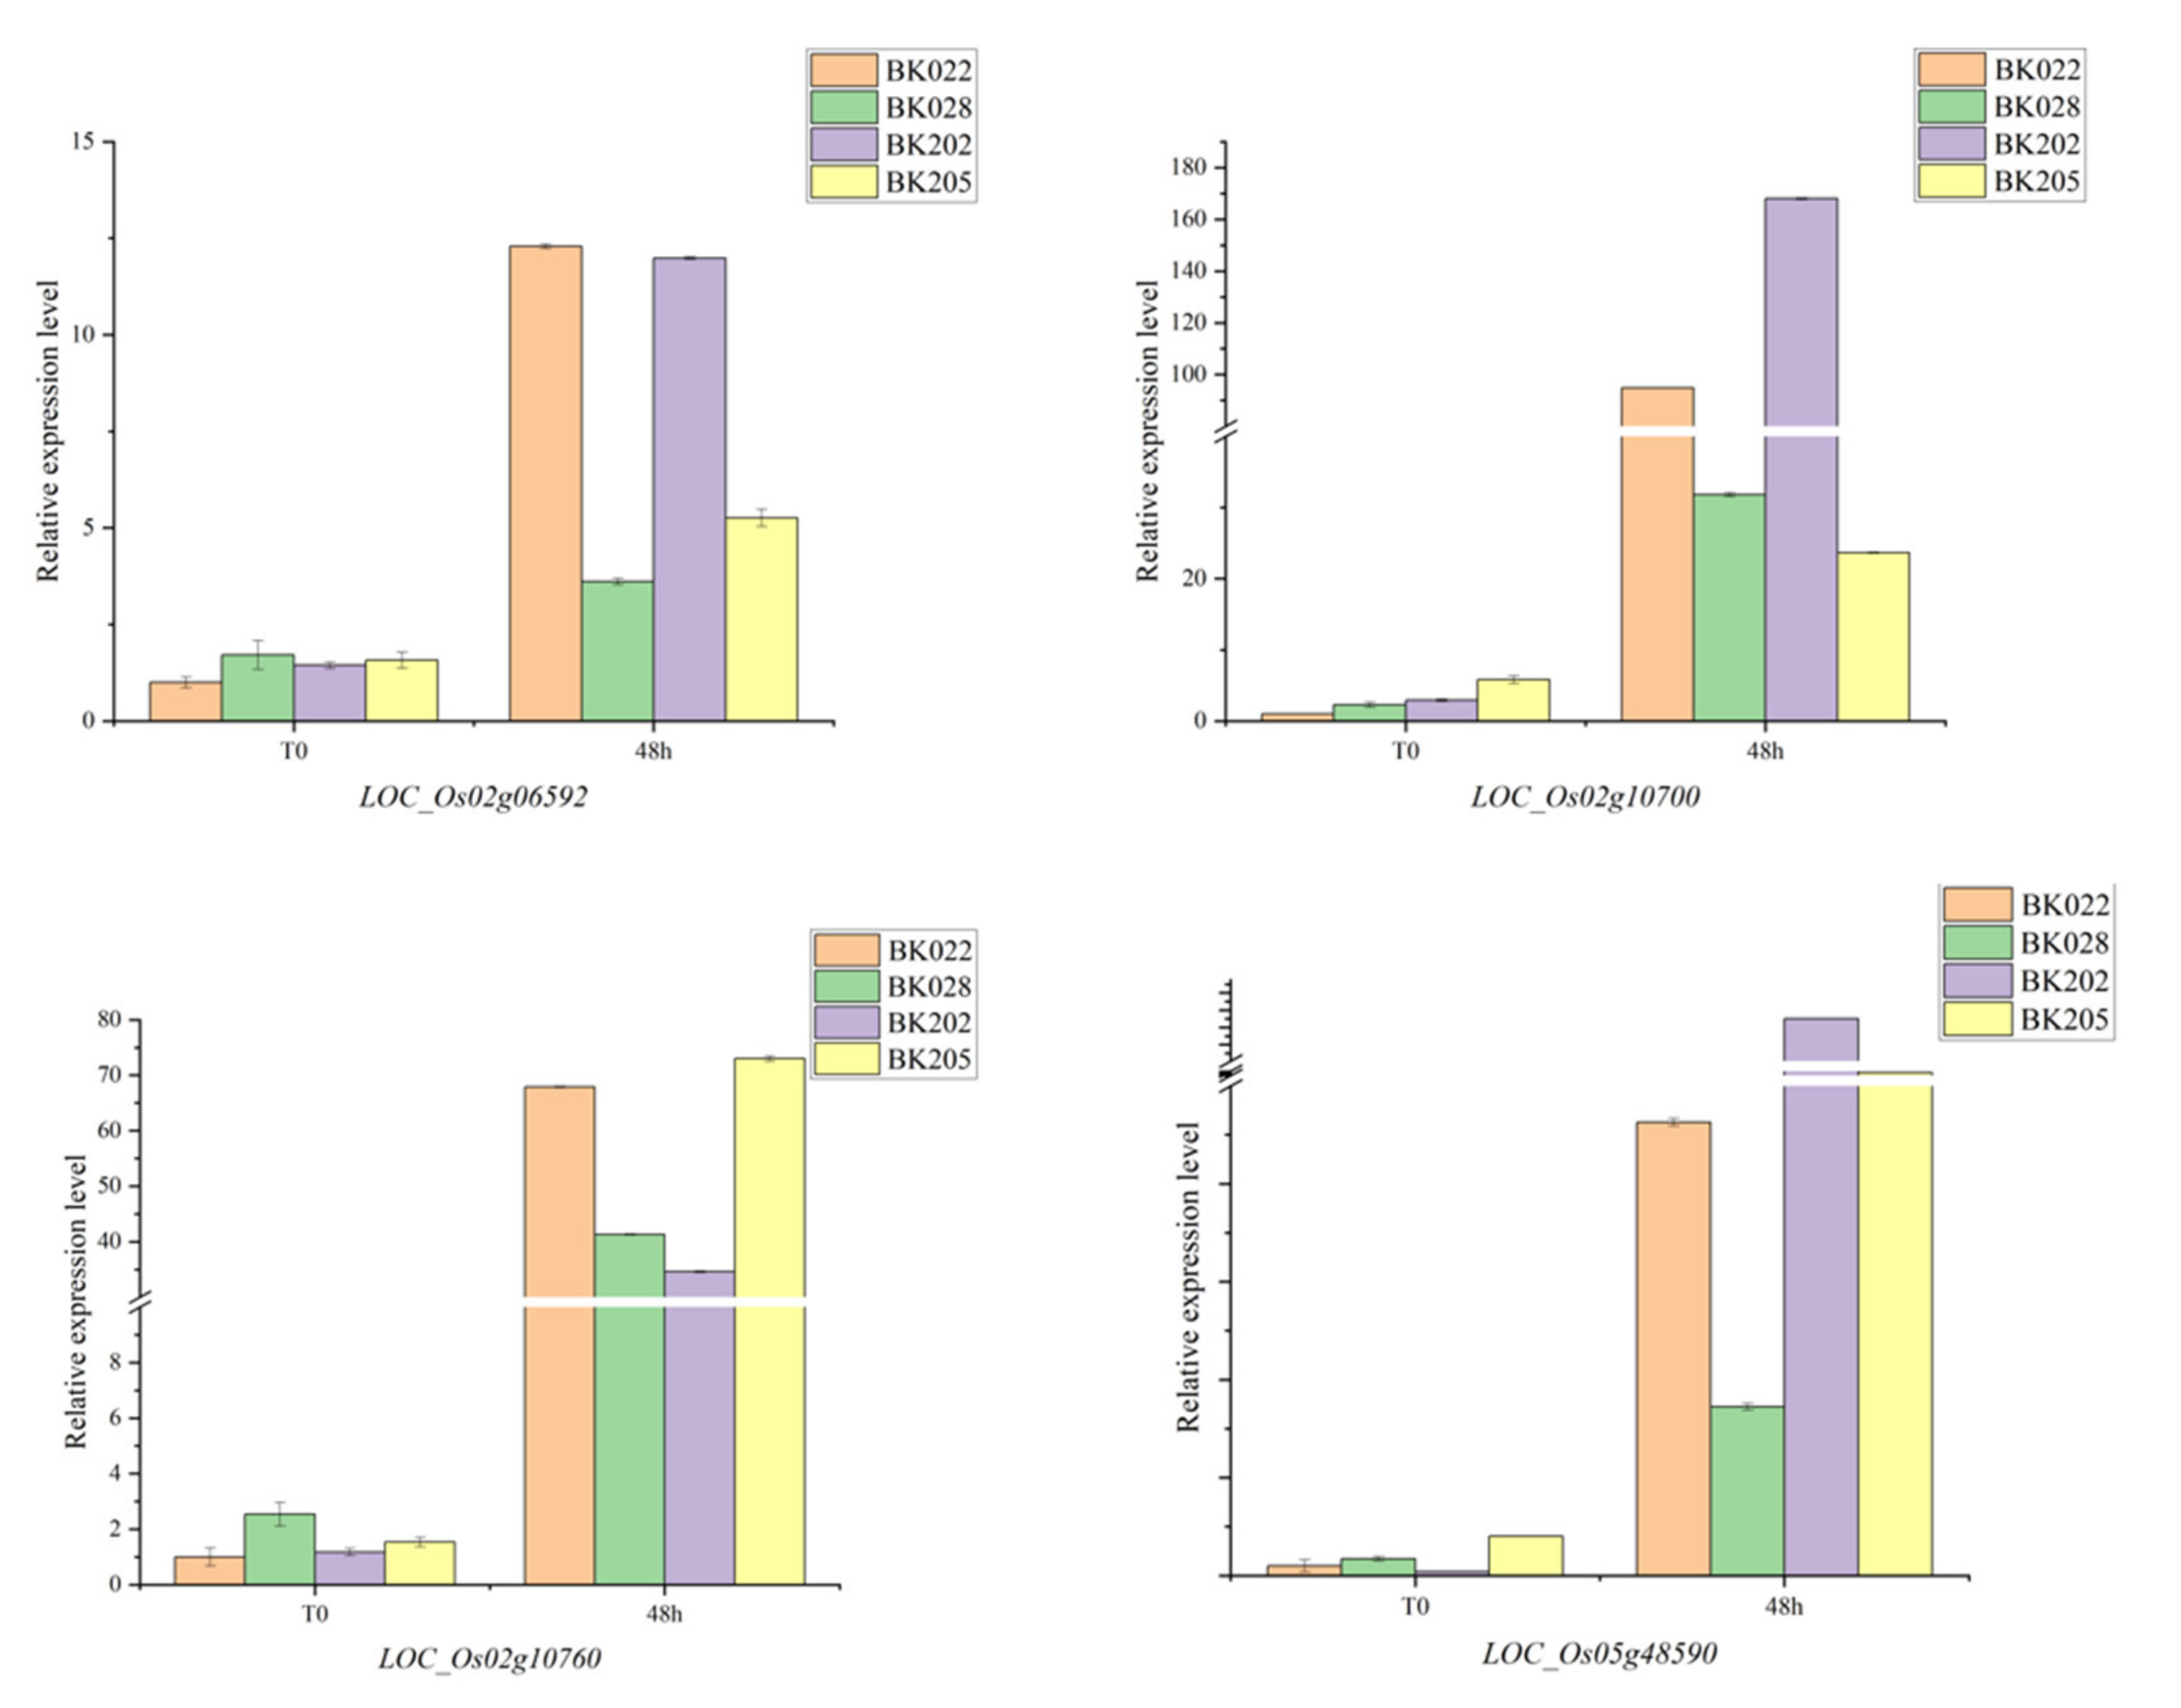
3.4. Gene Expression Analyses of Candidate Genes

Fourteen candidate genes were selected to compare expression levels between high-LTG value (BK022 and BK028) and low-LTG value accessions (BK202 and BK205) by qRT-PCR analysis. In these analyses, four genes (LOC_Os02g06592, LOC_Os02g10700, LOC_Os02g10760 and LOC_Os05g48590) were differentially expressed between cold treatment and normal growth conditions (Figure 6). These genes showed higher transcript levels in cold treatment than in normal growth conditions. Particularly, the expression level of LOC_Os05g48590 in two varieties with low-LTG values increased more significantly than that in two varieties with high-LTG values after cold treatment. Further experiments including genetic complementation analyses should be conducted to verify the gene controlling cold tolerance at the germination stage.

4. Discussion

In our study, six indices from two stages were used to evaluate LTG, namely LTGP, RGP and RPL in the cold treatment stage and PLR, PLRR and RAPL in the recovery stage. Overall, indica rice had a higher germination rate than japonica rice at room temperature [38], so separate GWAS analyses of LTGP and RGP helped us to discover whether cold tolerance was due to inherent cold tolerance or high seedling vigor. Interestingly, in this study, we found that LTGP and RGP values of indica rice were higher than those of japonica rice, it appears that the germination percent of indica rice under cold stress is higher than that of japonica rice, which was consistent with the results of Yang et al. [16], but also opposite to the results of Cui et al. [39], Morsy et al. [40] and Lv et al. [41]. Moreover, some studies showed that there was no significant difference in LTG between indica and japonica, and it was speculated that indica might gradually adapt to low temperatures during the germination process [4,15], the RPL index in this study showed that there were no significant differences between indica and japonica.
In the recovery stage, the PLR and PLRR values of indica rice were both larger than those of japonica rice, but the RAPL values were opposite, indicating that japonica rice showed a stronger recovery ability than indica rice in the recovery stage (Figure 7), this is similar to the results of previous studies [4], that is, higher LTGP values do not represent stronger recovery ability, and the cold treatment stage and recovery stage may be controlled by different genetic mechanisms. LTGP was observed to be strongly correlated with RGP, and the same situation same was observed between PLR and PLRR (Table 1; Figure 3), suggesting that LTGP and RGP might share genetic pathways, and PLR and PLRR are in the same way. On the other hand, RAPL was negatively correlated with LTGP and RGP, and positively correlated with PLR and PLRR, but the correlation coefficients were not large, suggesting that RAPL may be controlled by an independent genetic mechanism, this was confirmed in our GWAS analysis.
In our study, several identified QTLs were found to overlap with QTLs/genes previously studied. The candidate region for qPLR1 was found to contain a cloned cold-tolerant gene, SNAC2. SNAC2 encodes a plant-specific NAC transcription factor that is induced by drought, salinity, cold, mechanical damage and ABA treatment. Transgenic rice with the overexpression of SNAC2 had higher tolerance to cold stress, salt stress and PEG treatment [20]. The two QTLs, qRGP4 and qRPL4, were co-located with a cloned cold-tolerant gene, OsAOX1a. In SDS gel hybridization of rice callus protein, the varieties without low temperature tolerance QTL showed 32 kDa AOX band, while the varieties with QTL showed 34 kDa AOX band. This variation is attributed to single nucleotide polymorphisms between OsAOX1a alleles, causing Lys71 to replace Asn71 [21]. On chromosome 6, two QTLs (qPLR6 and qPLRR6) were found to share the same peak SNP, and a cloned gene OsABF2 was found in their candidate regions. OsABF2 is expressed in many tissues of rice and is induced by several abiotic stresses such as drought, saline-alkali, low temperature, oxygen stress and ABA stress [22]. On chromosome 9, three identified QTLs (qRGP9, qRPL and qRAPL9) with different peak SNPs were found to be contained in clr9, which is a QTL associated with the culm length growth rate under cold stress [23]. A QTL on chromosome 10 and a co-locus on chromosome 12 were found to overlap with the results of a previous study on LTG [4], that is, qRAPL10 overlapped with qLTG10-1 and qPLR12 (qPLRR12) overlapped with qLTSS12-1. In a conclusion, there is a lot of overlap between our QTL mapping results and previous studies, which reveals the reliability of our research results. In addition, several new QTLs were excavated in this study, and it is necessary for these new QTLs to be further screened for candidate genes to obtain more casual cold tolerance genes.
GWAS analysis and LD Block analysis showed that five QTL were simultaneously detected in at least two indices (Table 2; Figure S2). The QTL, qLTGP2 for LTGP, was observed co-localized with qRGP2 for RGP. This is a new QTL, and according to LD Block analysis, nine genes were found in this QTL (unknown proteins have been excluded), and LOC_Os02g06592 was considered as a possible candidate gene, which belongs to the SWI2/SNF2 family and could be induced by various abiotic stresses [26]. LOC_Os02g10200 (ZFP185) [27], LOC_Os02g10510 (OsDDI1) [28], LOC_Os02g10700 (OsEBF2) [29], LOC_Os02g10760 (OsWR1) [29] and LOC_Os02g10800 (OsBT1) [30] were considered as possible candidate genes for qPLR2 (qPLRR2). LOC_Os02g10200 is constitutively expressed in multiple tissues, including roots, stems, leaves and panicles. Under salt stress, the expression of LOC_Os02g10200 increased slightly first and then decreased. After osmotic treatment, the expression of LOC_Os02g10200 was firstly increased and then decreased. Cold stress induced the expression of LOC_Os02g10200, while the expression of LOC_Os02g10200 changed little after ABA treatment. LOC_Os02g10510 is a homologous gene of CsDDI1 in rice, and CsDDI1 is involved in the physiological and molecular mechanisms of cold acclimation-induced postharvest cold tolerance in cucumber. The gene LOC_Os02g10700 involved in ethylene signaling in anthers is upregulated after cold stress in rice, and it is also a gene associated with ethylene metabolism in anthers, which is slightly downregulated after cold stress. LOC_Os02g10800 is involved in seed germination and regulates seed dormancy through glucose metabolism, independent of GA and ABA pathways. LOC_Os05g47840 (IPT7) [31], LOC_Os05g47890 (OsRACK1B) [32], LOC_Os05g48020 (OsSYP71) [33], LOC_Os05g48390 (OsPHO2) [34] and LOC_Os05g48590 (IAA19) [31] were considered as possible candidate genes for qLTGP5 (qPLR5 and qPLRR5). LOC_Os05g47840, the gene encoding rate-limiting enzyme of cytokine biosynthesis, was upregulated in the roots of TNG67 (cold tolerant), but not in the roots of TCN1 (cold sensitive) during the recovery stage; LOC_Os05g48590 (IAA19) is an auxin-related gene that is induced by cold stress in both TNG67 and TCN1. LOC_Os05g47890 may be involved in rice seed germination by regulating G protein to control hormone signaling response. The expression of LOC_Os05g48020 was significantly upregulated under oxidative stress or inoculation, and overexpression of LOC_Os05g48020 enhanced the tolerance of rice to oxidative stress and rice blast. The expression of LOC_Os05g48390 was downregulated with the downregulation of OsSPX1. The mutant of LOC_Os05g48390 showed major leaf tip necrosis and increased Pi uptake and transport. After cold acclimation, arabidopsis pho2 mutants, with increased stem Pi, were more sensitive to freezing than the wild type. LOC_Os10g35810 was considered as a possible candidate gene for qRAPL10 and induced during the chilling and recovery treatment periods of 9311 and DC90. LOC_Os12g38200 (OsDof29) and LOC_Os12g38400 (OsMYB91) were considered as possible candidate genes for qPLR12 (qPLRR12). LOC_Os12g38200 belongs to the C2C2-Dof family and was upregulated in the DN under control (CKDN) vs. DN under low-T w (D15DN) group. LOC_Os12g38400 participates in the coordination of abiotic stress resistance by regulating the expression of SLR1. Overexpression of LOC_Os12g38400 decreased plant growth and seed germination and growth sensitivity to ABA. Otherwise, qRT-PCR was performed to evaluated expression level of 14 candidate genes. The result showed that four genes were differentially expressed between cold treatment and normal growth conditions, the mining of these genes will help to cultivate low-temperature-tolerant rice.

5. Conclusions

In the present study, we performed GWAS analysis and identified QTL for LTG in the natural population. Among the 18 QTL for LTG, five QTL were detected in at least two indices. From these five QTL, 14 genes were candidates, and four of them were differentially expressed between cold treatment and normal growth conditions. The highlight of this study is the combination of previously unstudied rice accessions with the GWAS strategy and the discovery of a number of new QTL related to LTG in rice that will assist in the breeding of new rice varieties with cold tolerance.

Supplementary Materials

The following supporting information can be downloaded at: https://0-www-mdpi-com.brum.beds.ac.uk/article/10.3390/agronomy12051194/s1, Table S1. Phenotypic data and information of the 211 rice accessions; Table S2. Genes annotation from the five QTLs; Figure S1. Population structure analysis 211 rice accessions. (A) K values plotted as the number of subgroups; (B) Principal component analysis of 211 rice accessions, each black dots represents an accession; (C) Neighbor-joining tree based on Nei’s genetic distances; (D) Pairwise relative kinship analysis of 211 rice accessions; Figure S2. LD Block for the five QTLs. (A) LD Block for qLTGP2; (B) LD Block for qLTGP2; (C) LD Block for qLTGP5; (D) LD Block for qRAPL10; (E) LD Block for qRLR12.

Author Contributions

C.L. (Caijing Liand), the first author of this article, designed and performed experiments, analyzed data and wrote the manuscript. Q.G. participated in analysis data. B.Z., C.L. (Changsheng Lu), G.S., P.W., G.W., W.J., H.Y., Q.C., Y.W., Q.Z., S.H., M.Y., T.H. and H.H. participated in performing experiments. J.B. conceived and supervised the experiments. All authors have read and agreed to the published version of the manuscript.

Funding

This research was supported by a grant (32160485) from the National Natural Science Foundation of China and a grant (YC2021-S341) from the Innovation Fund Designated for Graduate Students of Jiangxi Province. These funding institutions provided financial support for material collection, high-throughput sequencing and data analysis in this study.

Institutional Review Board Statement

Not applicable.

Informed Consent Statement

Not applicable.

Data Availability Statement

The data presented in this study are available within the article.

Acknowledgments

We thank the anonymous referees for their critical comments on this manuscript.

Conflicts of Interest

The authors declare that the research was conducted in the absence of any commercial or financial relationships that could be construed as a potential conflict of interest.

References

  1. Wang, H.; Lee, A.R.; Park, S.Y.; Jin, S.H.; Lee, J.; Ham, T.H.; Park, Y.; Zhao, W.G.; Kwon, S.W. Genome-wide association study reveals candidate genes related to low temperature tolerance in rice (Oryza sativa) during germination. 3 Biotech 2018, 8, 235. [Google Scholar] [CrossRef] [PubMed]
  2. Pan, Y.; Zhang, H.; Zhang, D.; Li, J.; Xiong, H.; Yu, J.; Li, J.; Rashid, M.A.R.; Li, G.; Ma, X.; et al. Genetic Analysis of Cold Tolerance at the Germination and Booting Stages in Rice by Association Mapping. PLoS ONE. 2015, 10, e0120590. [Google Scholar] [CrossRef] [PubMed] [Green Version]
  3. Fujino, K. A major gene for low temperature germinability in rice (Oryza sativa L.). Euphytica 2004, 136, 63–68. [Google Scholar] [CrossRef]
  4. Schläppi, M.R.; Jackson, A.K.; Eizenga, G.C.; Wang, A.; Chu, C.; Shi, Y.; Shimoyama, N.; Boykin, D.L. Assessment of Five Chilling Tolerance Traits and GWAS Mapping in Rice Using the USDA Mini-Core Collection. Front. Plant Sci. 2017, 8, 957. [Google Scholar] [CrossRef] [Green Version]
  5. Shim, K.C.; Kim, S.H.; Lee, H.S.; Adeva, C.; Jeon, Y.A.; Luong, N.H.; Kim, W.J.; Akhtamov, M.; Park, Y.J.; Ahn, S.N. Characterization of a New qLTG3–1 Allele for Low-temperature Germinability in Rice from the Wild Species Oryza rufipogon. Rice 2020, 13, 10. [Google Scholar] [CrossRef]
  6. Jiang, N.; Shi, S.; Shi, H.; Khanzada, H.; Wassan, G.M.; Zhu, C.; Peng, X.; Yu, Q.; Chen, X.; He, X.; et al. Mapping QTL for seed germinability under low temperature using a new high-density genetic map of rice. Front. Plant Sci. 2017, 8, 1223. [Google Scholar] [CrossRef] [Green Version]
  7. Li, L.; Liu, X.; Xie, K.; Wang, Y.; Liu, F.; Lin, Q.; Wang, W.; Yang, C.; Lu, B.; Liu, S.; et al. qLTG-9, a stable quantitative trait locus for low-temperature germination in rice (Oryza sativa L.). Theor. Appl. Genet. 2013, 126, 2313–2322. [Google Scholar] [CrossRef]
  8. Xie, L.; Tan, Z.; Zhou, Y.; Xu, R.; Feng, L. Identification and fine mapping of quantitative trait loci for seed vigor in germination and seedling establishment in rice. J. Integr. Plant Biol. 2014, 56, 749–759. [Google Scholar] [CrossRef]
  9. Jiang, S.; Yang, C.; Xu, Q.; Wang, L.; Yang, X.; Song, X.; Wang, J.; Zhang, X.; Li, B.; Li, H.; et al. Genetic dissection of germinability under low temperature by building a resequencing linkage map in japonica rice. Int. J. Mol. Sci. 2020, 21, 1284. [Google Scholar] [CrossRef] [Green Version]
  10. Fujino, K.; Sekiguchi, H.; Matsuda, Y.; Sugimoto, K.; Ono, K.; Yano, M. Molecular identification of a major quantitative trait locus, qLTG3-1, controlling low-temperature germinability in rice. Proc. Natl. Acad. Sci. USA 2008, 105, 12623–12628. [Google Scholar] [CrossRef] [Green Version]
  11. Fujino, K.; Matsuda, Y. Genome-wide analysis of genes targeted by qLTG3-1 controlling low-temperature germinability in rice. Plant Mol. Biol. 2010, 72, 137–152. [Google Scholar] [CrossRef]
  12. Mao, D.; Yu, L.; Chen, D.; Li, L.; Zhu, Y.; Xiao, Y.; Zhang, D.; Chen, C. Multiple cold resistance loci confer the high cold tolerance adaptation of Dongxiang wild rice (Oryza rufipogon) to its high-latitude habitat. Theor. Appl. Genet. 2015, 128, 1359–1371. [Google Scholar] [CrossRef]
  13. Fujino, K.; Obara, M.; Shimizu, T.; Koyanagi, K.O.; Ikegaya, T. Genome-wide association mapping focusing on a rice population derived from rice breeding programs in a region. Breed. Sci. 2015, 65, 403–410. [Google Scholar] [CrossRef] [Green Version]
  14. Shakiba, E.; Edwards, J.D.; Jodari, F. Genetic architecture of cold tolerance in rice (Oryza sativa) determined through high resolution genome-wide analysis. PLoS ONE. 2017, 12, e0172133. [Google Scholar] [CrossRef]
  15. Sales, E.; Viruel, J.; Domingo, C.; Marqués, L. Genome wide association analysis of cold tolerance at germination in temperate japonica rice (Oryza sativa L.) varieties. PLoS ONE. 2017, 12, e0183416. [Google Scholar] [CrossRef] [Green Version]
  16. Thapa, R.; Tabien, R.E.; Thomson, M.J.; Septiningsih, E.M. Genome-Wide Association Mapping to Identify Genetic Loci for Cold Tolerance and Cold Recovery During Germination in Rice. Front. Genet. 2020, 11, 22. [Google Scholar] [CrossRef] [Green Version]
  17. Yang, T.; Zhou, L.; Zhao, J.; Dong, J.; Liu, Q.; Fu, H.; Mao, X.; Yang, W.; Ma, Y.; Chen, L.; et al. The Candidate Genes Underlying a Stably Expressed QTL for Low Temperature Germinability in Rice (Oryza sativa L.). Rice 2020, 13, 74. [Google Scholar] [CrossRef]
  18. Wang, X.; Zou, B.; Shao, Q.; Cui, Y.; Lu, S.; Zhang, Y.; Huang, Q.; Huang, J.; Hua, J. Natural variation reveals that OsSAP16 controls low-temperature germination in rice. J. Exp. Bot. 2018, 69, 413–421. [Google Scholar] [CrossRef]
  19. Li, C.; Liu, J.; Bian, J.; Jin, T.; Zou, B.; Liu, S.; Zhang, X.; Wang, P.; Tan, J.; Wu, G.; et al. Identification of cold tolerance QTLs at the bud burst stage in 211 rice accessions by GWAS. BMC Plant Biol. 2021, 21, 542. [Google Scholar] [CrossRef]
  20. Hu, H.; You, J.; Fang, Y.; Zhu, X.; Qi, Z.; Xiong, L. Characterization of transcription factor gene SNAC2 conferring cold and salt tolerance in rice. Plant Mol. Biol. 2008, 67, 169–181. [Google Scholar] [CrossRef]
  21. Abe, F.; Saito, K.; Miura, K.; Toriyama, K. A single nucleotide polymorphism in the alternative oxidase gene among rice varieties differing in low temperature tolerance. FEBS Lett. 2002, 527, 181–185. [Google Scholar] [CrossRef] [Green Version]
  22. Hossain, M.A.; Cho, J.I.; Han, M.; Ahn, C.H.; Jeon, J.S.; An, G.; Park, P.B. The ABRE-binding bZIP transcription factor OsABF2 is a positive regulator of abiotic stress and ABA signaling in rice. J. Plant Physiol. 2010, 167, 1512–1520. [Google Scholar] [CrossRef]
  23. Oh, C.S.; Choi, Y.H.; Lee, S.J.; Yoon, D.B.; Moon, H.P.; Ahn, S.N. Mapping of Quantitative Trait Loci for Cold Tolerance in Weedy Rice. Breed. Sci. 2004, 54, 373–380. [Google Scholar] [CrossRef] [Green Version]
  24. Ke, Y.G.; Yang, Z.J.; Yu, S.W.; Li, T.F.; Wu, J.H.; Gao, H.; Fu, Y.P.; Luo, L.J. Characterization of OsDREB6 responsive to osmotic and cold stresses in rice. Ceram. Int. 2016, 42, 9264–9269. [Google Scholar] [CrossRef]
  25. Yokotani, N.; Sato, Y.; Tanabe, S.; Chujo, T.; Shimizu, T.; Okada, K.; Yamane, H.; Shimono, M.; Sugano, S.; Takatsuji, H.; et al. WRKY76 is a rice transcriptional repressor playing opposite roles in blast disease resistance and cold stress tolerance. J. Exp. Bot. 2013, 64, 5085–5097. [Google Scholar] [CrossRef]
  26. Gao, Z.R.; Zhang, H.W.; Huang, R.F. Expressive Characteristics Analysis of OsDDMla and OsDDMlb in Response to Abiotic Stresses of Rice. J. Agric. Sci. Technol. 2011, 13, 41–46. [Google Scholar]
  27. Zhang, Y.; Lan, H.; Shao, Q.; Wang, R.; Chen, H.; Tang, H.; Zhang, H.; Huang, J. An A20/AN1-type zinc finger protein modulates gibberellins and abscisic acid contents and increases sensitivity to abiotic stress in rice (Oryza sativa L.). J. Exp. Bot. 2015, 67, 315–326. [Google Scholar] [CrossRef] [Green Version]
  28. Wang, B.; Wang, G.; Zhu, S. DNA Damage Inducible Protein 1 is Involved in Cold Adaption of Harvested Cucumber Fruit. Front. Plant Sci. 2020, 10, 1723. [Google Scholar] [CrossRef]
  29. González-Schain, N.; Roig-Villanova, I.; Kater, M.M. Early cold stress responses in post-meiotic anthers from tolerant and sensitive rice cultivars. Rice 2019, 12, 94. [Google Scholar] [CrossRef]
  30. Song, W.; Hao, Q.; Cai, M.; Wang, Y.; Zhu, X.; Liu, X.; Huang, Y.; Nguyen, T.; Yang, C.; Yu, J.; et al. Rice OsBT1 regulates seed dormancy through the glycometabolism pathway. Plant Physiol. Biochem. 2020, 151, 469–476. [Google Scholar] [CrossRef]
  31. Yang, Y.W.; Chen, H.C.; Jen, W.F.; Liu, L.Y.; Chang, M.C. Comparative Transcriptome Analysis of Shoots and Roots of TNG67 and TCN1 Rice Seedlings under Cold Stress and Following Subsequent Recovery: Insights into Metabolic Pathways, Phytohormones, and Transcription Factors. PLoS ONE. 2015, 10, e0131391. [Google Scholar] [CrossRef] [PubMed]
  32. Zhang, D.; Chen, L.; Li, D.; Lv, B.; Chen, Y.; Chen, J.; Liang, J. OsRACK1 is involved in abscisic acid- and H2O2-mediated signaling to regulate seed germination in rice (Oryza sativa L.). PLoS ONE. 2014, 9, e97120. [Google Scholar] [CrossRef] [PubMed] [Green Version]
  33. Bao, Y.; Sun, S.; Li, M.; Li, L.; Cao, W.; Luo, J.; Tang, H.; Huang, J.; Wang, Z.; Wang, J.; et al. Overexpression of the Qc-SNARE gene OsSYP71 enhances tolerance to oxidative stress and resistance to rice blast in rice (Oryza sativa L.). Gene 2012, 504, 238–244. [Google Scholar] [CrossRef] [PubMed]
  34. Wang, C.; Wei, Q.; Zhang, K.; Wang, L.; Liu, F.; Zhao, L.; Tan, Y.; Di, C.; Yan, H.; Yu, J.; et al. Down-Regulation of OsSPX1 Causes High Sensitivity to Cold and Oxidative Stresses in Rice Seedlings. PLoS ONE 2013, 8, e81849. [Google Scholar] [CrossRef] [PubMed] [Green Version]
  35. Cen, W.; Liu, J.; Lu, S.; Jia, P.; Yu, K.; Han, Y.; Li, R.; Luo, J. Comparative proteomic analysis of QTL CTS-12 derived from wild rice (Oryza rufipogon Griff.), in the regulation of cold acclimation and de-acclimation of rice (Oryza sativa L.) in response to severe chilling stress. BMC Plant Biol. 2018, 18, 163. [Google Scholar] [CrossRef] [PubMed]
  36. Jia, Y.; Liu, H.; Qu, Z.; Wang, J.; Wang, X.; Wang, Z.; Yang, L.; Zhang, D.; Zou, D.; Zhao, H. Transcriptome Sequencing and iTRAQ of Different Rice Cultivars Provide Insight into Molecular Mechanisms of Cold-Tolerance Response in Japonica Rice. Rice 2020, 13, 43. [Google Scholar] [CrossRef]
  37. Zhu, N.; Cheng, S.; Liu, X.; Du, H.; Dai, M.; Zhou, D.X. The R2R3-type MYB gene OsMYB91 has a function in coordinating plant growth and salt stress tolerance in rice. Plant Sci. 2015, 236, 146–156. [Google Scholar] [CrossRef]
  38. Li, W.; Yang, B.; Xu, J.; Peng, L.; Sun, S.; Huang, Z.; Jiang, X.; He, Y.; Wang, Z. A genome-wide association study reveals that the 2-oxoglutarate/malate translocator mediates seed vigor in rice. Plant J. 2021, 108, 478–491. [Google Scholar] [CrossRef]
  39. Cui, K.; Peng, S.; Xing, Y.; Xu, C.; Yu, S.; Zhang, Q. Molecular dissection of seedling-vigor and associated physiological traits in rice. Theor. Appl. Genet. 2002, 105, 745–753. [Google Scholar] [CrossRef]
  40. Morsy, M.R.; Almutairi, A.M.; Gibbons, J.; Yun, S.J.; Benildo, G. The OsLti6 genes encoding low-molecular-weight membrane proteins are differentially expressed in rice cultivars with contrasting sensitivity to low temperature. Gene 2005, 344, 171–180. [Google Scholar] [CrossRef]
  41. Lv, Y.; Guo, Z.; Li, X.; Ye, H.; Li, X.; Xiong, L. New insights into the genetic basis of natural chilling and cold shock tolerance in rice by genome-wide association analysis. Plant Cell Environ. 2016, 39, 556–570. [Google Scholar] [CrossRef] [Green Version]
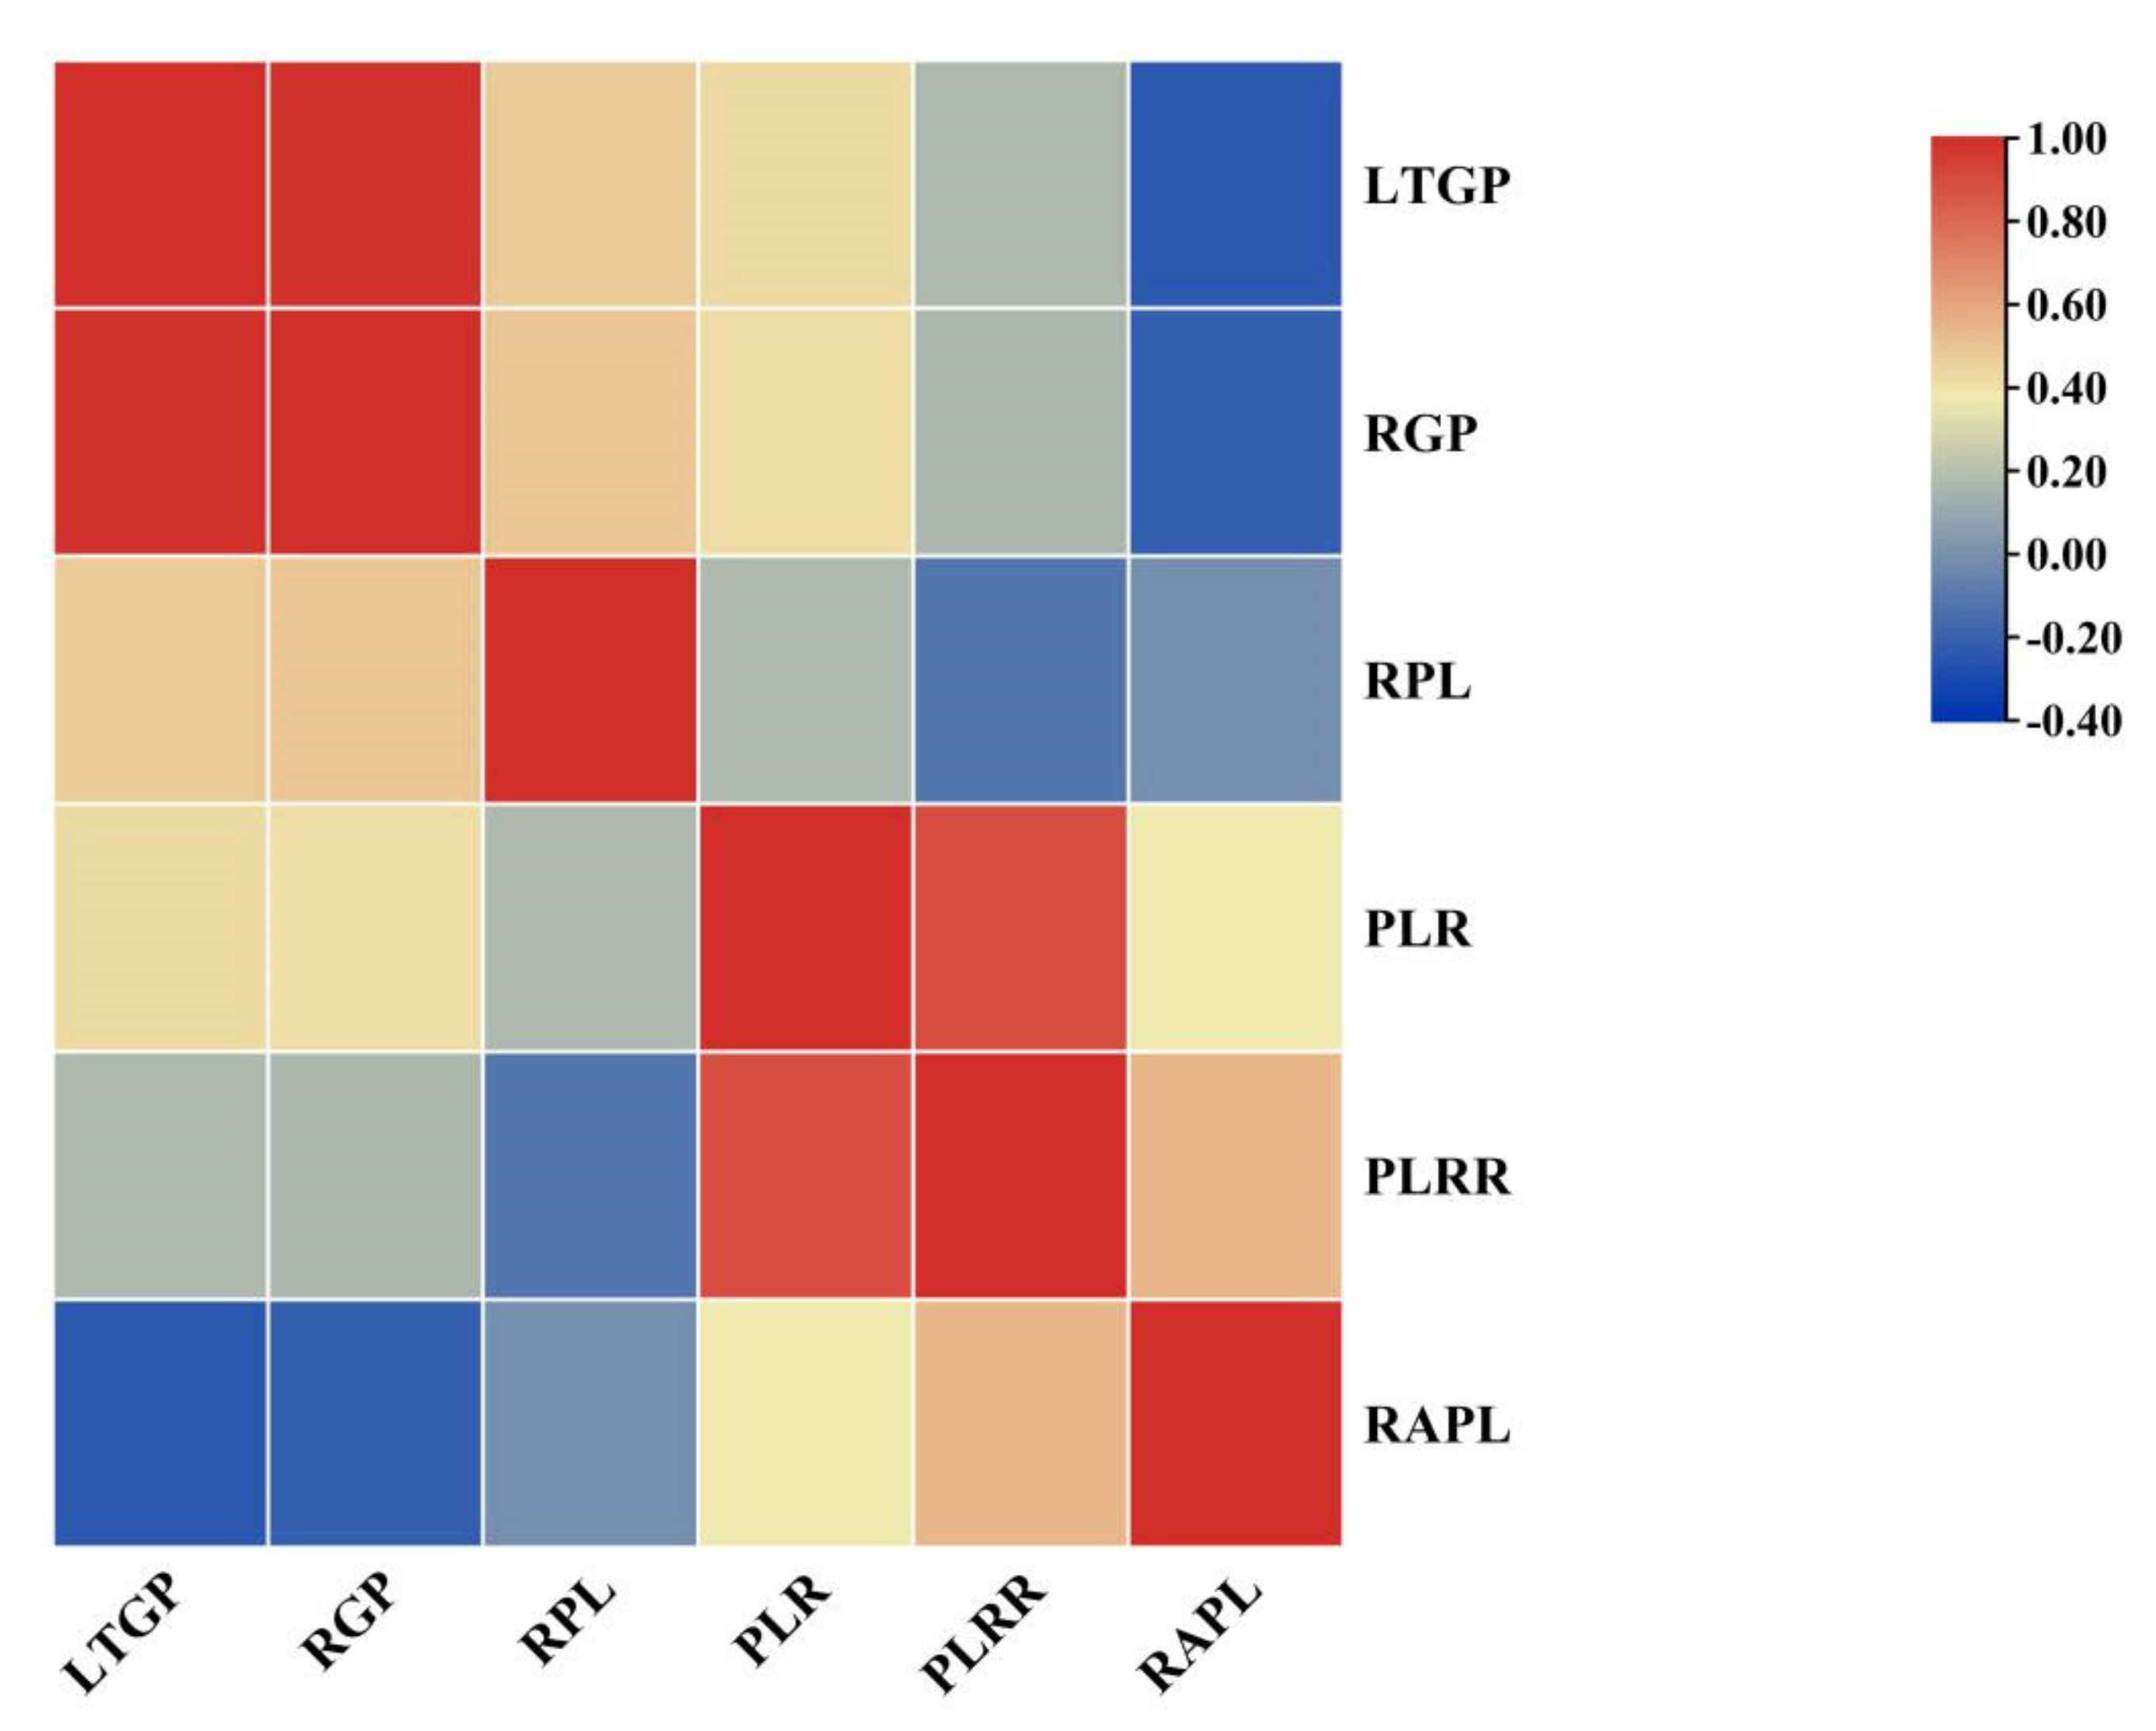
Figure 1. Distribution of six LTG indices (LTGP, RGP, RPL, PLR, PLRR and RAPL) in 211 rice accessions. The vertical axis in each subfigures represents the number of accessions, and each column on the horizontal axis represents the range of values. The LTGP and RGP distribution in 211 rice accessions was continuous while the remaining four indices are normally distributed.
Agronomy 12 01194 g001
Figure 2. Comparison of LTG indices among different subgroups. The vertical axis in each subfigures represents the range of LTG index values, yellow boxes represent indica, green boxes represent japonica, and black dots in the boxes represent average values. ** Indicates significance at the 1% level.
Agronomy 12 01194 g002
Figure 3. Heat maps of correlations between six LTG indices. Blocks that tend to be red or blue indicate greater absolute values of the correlation coefficients.
Agronomy 12 01194 g003
Figure 4. Quantile–quantile (Q–Q) plot of GWAS for six LTG indices (LTGP (A), RGP (B), RPL (C), PLR (D), PLRR (E), RAPL (F)).
Agronomy 12 01194 g004
Figure 5. Manhattan plots of GWAS for six LTG indices. The vertical axis in each subfigures represents the value of -log10(P), and the horizontal axis represents 12 chromosomes in rice, the solid red line represents when P value equals 0.001. The red arrow indicates QTLs detected from six indices.
Agronomy 12 01194 g005
Figure 6. Expression patterns of four candidate genes. The vertical axis in each subfigures represents the relative expression level of gene, and the horizontal axis represents different treatments i.e., T0 is the control treatment and 48h is the 48h after cold treatment. Different colored columns represent different accessions of rice.
Agronomy 12 01194 g006
Figure 7. Comparison of PLRR and CLCR (CLC divided by 15) indices among different subgroups. Yellow boxes represent indica, green boxes represent japonica.
Agronomy 12 01194 g007
Table 1. Pearson’s correlation coefficients between the six different indices evaluated in this study.
TraitLTGPRGPRPLPLRPLRR
RGP0.986 **
RPL0.483 **0.497 **
PLR0.429 **0.417 **0.167 *
PLRR0.168 *0.162 *−0.1150.895 **
RAPL−0.243 **−0.217 **−0.0080.381 **0.543 **
* Indicates significance at the 5% level; ** Indicates significance at the 1% level.
Table 2. Summary of the QTL identified by GWAS mapping for six LTG indices and co-localized genes and QTLs.
QTL IDChr.Peak SNPsp ValueR2Previous QTLs/Genes
qPLR11399938550.0005046300.060240000 SNAC2 [20]
qLTGP2233392890.0005332070.062685322
qRGP2 33392890.0001119340.075171265
qPLR2 55054570.0008161110.069550000
qPLRR2 55054570.0008133300.068310000
qRGP44297811970.0000077520.057870000 OsAOX1a [21]
qRPL4 299212850.0000987080.085890000 OsAOX1a
qLTGP55278650390.0002063540.070831922
qPLR5 278650390.0000399490.096883103
qPLRR5 278650390.0009912300.074340000
qPLR6657453950.0000215430.103143691 OsABF2 [22]
qPLRR6 57453950.0004962990.065075903 OsABF2
qRGP99129126970.0002689900.039760000 clr9 [23]; OsDREB6 [24]
qRPL9 136416930.0004945000.072930000 clr9
qRAPL9 156842090.0000948690.087940000 clr9; OsWRKY76 [25]
qRAPL1010190572930.0000013190.118803366 qLTG10-1 [4]
qPLR1212235774810.0001421600.089220000 qLTSS12-1 [4]
qPLRR12 235774810.0001202200.087880000 qLTSS12-1 [4]
Table 3. Candidate genes of the five QTLs.
QTLs IDCandidate Genes
LocusGeneProteinDescription
qLTGP2LOC_Os02g06592CHR701SNF2 family N-terminal domain containing proteinSnf2 family proteins can be induced by various abiotic stresses [26].
qPLR2LOC_Os02g10200ZFP185A20/AN1-type zinc finger proteinThe expression level of ZFP185 was susceptible to salt stress, osmotic stress and cold stress [27].
LOC_Os02g10510OsDDI1Ubiquitin family domain-containing proteinCsDDI1 is involved in the physiological and molecular mechanisms of cold acclimation [28].
LOC_Os02g10700OsEBF2OsFBL7—F-box domain- and LRR-containing proteinOsEBF2 involved in ethylene signaling in anthers is upregulated after cold stress in rice [29].
LOC_Os02g10760OsWR1AP2 domain-containing proteinOsWR1 is also a gene associated with ethylene metabolism in anthers, which is slightly downregulated after cold stress [29].
LOC_Os02g10800OsBT1mitochondrial carrier proteinOsBT1 is involved in seed germination and regulates seed dormancy through glucose metabolism [30].
qLTGP5LOC_Os05g47840IPT7tRNA isopentenyltransferase family proteinIt was upregulated during the recovery stage after cold stress in cold-tolerant cultivars [31].
LOC_Os05g47890OsRACK1BWD domain, G-beta repeat domain-containing proteinIt may be involved in rice seed germination by regulating G protein to control hormone signaling response [32].
LOC_Os05g48020OsSYP71SNARE domain-containing proteinIt was significantly upregulated under oxidative stress [33].
LOC_Os05g48390OsPHO2Ubiquitin-conjugating enzyme proteinAfter cold acclimation, arabidopsis pho2 mutants, with increased stem Pi, were more sensitive to freezing than the wild type [34].
LOC_Os05g48590IAA19OsIAA19—Auxin-responsive Aux/IAA gene family memberIAA19 is an auxin-related gene that is induced by cold stress [31].
qRAPL10LOC_Os10g35810 thylakoid lumenal proteinIt induced during the chilling and recovery treatment periods of 9311 and DC90 [35].
qPLR12LOC_Os12g38200OsDof29dof zinc finger domain-containing proteinIt is upregulated after cold stress [36].
LOC_Os12g38400OsMYB91MYB family transcription factorIt is a stress responsive gene that participates in the coordination of abiotic stress resistance [37].
Publisher’s Note: MDPI stays neutral with regard to jurisdictional claims in published maps and institutional affiliations.

