Article

The Production of Dual-Purpose Triticale in Arid Regions: Application of Organic and Inorganic Treatments under Water Deficit Conditions

by
Sara A. A. Abd-Elatty
1,
Ali I. Nawar
2,
Heba S. A. Salama
2,*,
Ibrahim M. Khattab
3 and
Ahmed M. Shaalan
1
1
Plant Production Department, Faculty of Desert and Environmental Agriculture, Matrouh University, Matrouh 51744, Egypt
2
Crop Science Department, Faculty of Agriculture, Alexandria University, Aflaton Street, El-Shatby, Alexandria 21545, Egypt
3
Animal Production Department, Faculty of Desert and Environmental Agriculture, Matrouh University, Matrouh 51744, Egypt
*
Author to whom correspondence should be addressed.
Submission received: 3 April 2022 / Revised: 20 May 2022 / Accepted: 20 May 2022 / Published: 24 May 2022
(This article belongs to the Special Issue Forage and Grain Crops Productivity in Their Coupling Systems)

Abstract

:
Most of the arid and semi-arid regions, particularly in the Mediterranean area, suffer from the lack of a sufficient quantity of high-quality feed, as well as a low amount of rainfall that is unevenly distributed, resulting in the region being highly vulnerable to drought. A field experiment was carried out at the experimental station of the Faculty of Desert and Environmental Agriculture, Fuka, Matrouh University, Egypt during the winter seasons of 2018/19 and 2019/20 to study the performance of triticale (X Triticosecale Wittmack), grown under water deficit conditions, in terms of productivity and quality. The study investigated the influence of five levels of potassium fertilization (PF; 0, 43.2, 86.4, 129.6, and 172.8 kg ha−1) and ascorbic acid (AA; 0, 25, 50, 75, and 100 mg L−1) that was applied to the triticale grains before sowing and humic acid (HA; 0, 2.4, 4.8, 7.2, and 9.6 kg ha−1) that was applied as powder to the soil 21 days after sowing followed by sprinkler irrigation on triticale forage and grain production when forage was removed at variable ages at cutting (AC), determined as days after sowing (AC; 40, 65, 90, 115, and 140 DAS) on forage yield and nutritive value, in addition to the final grain yield of triticale. The experimental design was a central composite design with one replicate. Results indicated that the PF*AC interaction was significant, and it gave values of 84.78 and 238.00 g kg−1 for crude protein (CP) and degraded neutral detergent fiber (DNDF). In addition, the interaction between AA and AC was significant for CP, acid detergent fiber (ADF), 100-grain weight (100 GW), number of spikes m−2 (NSM−2), and plant height (PH). Moreover, the AC*HA interaction was significant with values of 175.17 and 247.00 g kg−1 for CP and DNDF, respectively, and 0.55 t ha−1 for grain yield (GY). Age at cutting exerted the strongest effect on the studied characteristics. It was observed that the contents of neutral detergent fiber (NDF), ADF, acid detergent lignin (ADL), and non-fiber carbohydrates (NFC) in the triticale forage significantly increased when the crop was cut at an advanced age, unlike CP, DNDF, GY, NSM−2, 100 GW, and PH that decreased with advanced AC. The highest values of 271.00, 256.00, and 268.00 g kg−1 for DNDF were obtained with higher levels of either PF, AA, or HA, respectively. However, the highest value of GY (0.97 t ha−1) was obtained with higher levels of PF*HA averaged over the two seasons. The interaction between AA*HA resulted in 393.39, 311.00, 27.13 g kg−1, and 0.94 t ha−1, for NDF, DNDF, ADL, and GY, respectively. The highest significant NDF (413.11 g kg−1) and DNDF (307.50 g ka−1) values were obtained with the application of high levels of either AA or HA. In the dual-purpose production system, it is recommended to cut the triticale crop at 65 DAS to achieve the optimum balance between forage yield and quality on the one hand, and final grain yield on the other hand. In the arid regions, application of PF, AA, and HA could help in reducing the damage caused by water deficit.

1. Introduction

The reductions in the quantity and quality of fodder available to feed livestock are causing serious problems for farmers. Year-round pasture maintenance and forage crop production are challenging to manage in rain-fed areas. The semi-arid and arid regions are characterized by low and variable rainfall, as well as poor soil fertility [1,2]. Dual-purpose cereals are cut or grazed at a young developmental stage (tillering) and then allowed to re-grow for grain production, which is one of the options usually used by small and local farmers to provide forage throughout the winter, lowering demand for other feeds and allowing farmers to obtain grain and straw at the end of the growing season [3].
Triticale (X Triticosecale Wittmack) is a winter cereal resulting from crossing wheat (Triticum spp.) and rye (Secale cereale L.). Triticale can produce a large quantity of biomass and recover after cutting/grazing to produce grain for an autumn harvest, making it especially fit for dual-purpose usage [4]. The global area of triticale was 4 million ha in 2018, with a total grain yield of 13.5 million tons [5]. Worldwide, triticale is considered a multi-purpose crop that is utilized for forage and grain production. It is characterized by its higher energy and protein content than barley [6,7,8,9]. It is also used as a supplement for wheat flour in the production of bread, noodles, cakes, and breakfast kernels, as well as ethanol production, silage, and hay under a variety of production conditions [7]. It has potential in Egypt as feed for livestock, poultry, as well as for human consumption [8]. It grows well under dry conditions in arid and semi-arid regions; it is suitable for all types of soils, and it is tolerant to flooding and alkaline soils; and it has high water use efficiency, thus it is known for its distinguished performance in the Mediterranean climate [9]. The best approach to achieve a proper forage–grain balance is through proper grazing or cutting management. Under stress conditions, plants develop a variety of adaptive mechanisms to help them survive under unfavorable conditions [9]. Fertilization, foliar spray, and seed priming are among the various strategies used to increase the crop’s adaptability to stressful conditions [10,11,12].
Potassium is crucial for plant growth, and it is required in high amounts by plants. It can improve drought tolerance in plants by reducing their negative impacts and preserving water balance as a result of increased translocation of photo-assimilates, which eventually increase the crop yield and improve the forage quality [11,12]. Adequate potassium fertilization improved the absorption of nitrogen, phosphorus and calcium and resulted in higher yield attributes (number of spike m−2 and 100-grain weight) and increased grain yield in barley [13]. It is important for osmoregulation, photosynthesis for carbohydrate formation, transpiration, stomatal opening and closure, protein synthesis, and, thus, it is reported to increase dry forage yield and protein content in maize [14]. Moreover, the addition of potassium showed beneficial effects on plant height [15]. It increased crop yield and improved its quality [16].
Ascorbic acid (AA) is a natural compound with antioxidant properties [17]. It plays a role in plant growth and development, cell wall metabolism, cell division and expansion, root progress, photosynthesis, shoot apical meristem formation, florescence regulation, and regulation of leaf senescence, which are reflected in increasing the 100-grain weight and the number of spikes m−2 and, thus, grain and forage yields [17]. Water deficit may be mitigated by AA, resulting in a considerable increase in growth and in yield [18]. Priming with AA promotes plant growth by promoting root growth, which helps in water and nutrient uptake, and the synthesis of growth-promoting hormones such as auxin, gibberellin, and cytokinin, which increase plant height [19]. In addition, it acts as a co-factor of many enzymes that enhances chlorophyll a and b, total soluble proteins, carbohydrates under drought stress, which increased carbohydrates and protein content.
The stage of maturity at which the forage is cut is a limiting determinant to the quantity and the quality of the forage; in addition, it affects the regrowth ability of the crop and the final grain production [20]. Cutting at a late stage of maturity would result in the production of a high amount of forage with a high dry matter content [21,22]. However, it is expected to negatively affect the final grain yield. In dual-purpose crops, it is always crucial to determine the appropriate age at which the crop should be cut in order to achieve a high amount of good quality forage, with the least reduction in the final grain yield [20]. Early cut crop is characterized by high nutritive value in terms of a high CP content and low fiber fractions, which will be reflected in its high digestibility [23]. Each delay in forage cutting was found to decrease the CP content and to increase the fiber fractions (NDF, ADF, and ADL). It is proposed that dual-purpose triticale can fulfill the green forage demand, without sacrificing the grain yield in the arid and semi-arid regions [24].
Humic acid (HA) is a key source of humic compounds, which make up the majority of soil’s organic matter [25]. It has numerous advantages, including phytohormone-like activities that influence plant physiological processes, such as improving photosynthesis, increasing root growth, and enhancing seed germination and seedling growth, which increases plant height, the number of spikes m−2, and the grain yield [26]. It plays a vital role in the acceleration of plant cell division and promoting development, increasing seed germination and root respiration and arrangement [27]. In addition, increasing stimulation of plant development, cell porosity, and expansion of regulatory components in plants, and alleviating the inhibitory effects of water stress [27] are positive effects reported for the humic compounds. The increase in forage yield, protein content, and neutral detergent fiber due to adding humic acid may be attributed to the ability of humic acid in improving a crop’s nutrient uptake [28].
The objective of the current study was to investigate the effect of some treatments like humic (HA), ascorbic acids (AA), and potassium fertilization (PF) on forage and grain yields and the forage quality of dual-purpose triticale that was cut at variable ages. It was hypothesized that the addition of AA, HA, and PF would alter the negative effects associated with cutting at an advanced age on forage quality and regrowth ability of the crop and its final grain yield, moreover, they were expected to reduce the negative effects of the water deficit on the crop, improving its performance.

2. Materials and Methods

2.1. Experimental Location and Treatments

A two-year field trial was carried out during the winter seasons of 2018/19 and 2019/20 at the experimental station of the Faculty of Desert and Environmental Agriculture, Fuka, Matrouh University (N = 31° 04, E = 27° 54). Data of the soil physical and chemical properties of the experimental site, for both growing seasons are presented in Table 1. Soil samples were taken at a 30 cm depth. Average monthly temperature, total precipitation, and wind speed of the experimental site are presented in Figure 1. Four factors, each factor with five levels, were investigated: the first factor was potassium fertilization (PF; 0, 43.2, 86.4, 129.6, and 172.8 kg K2O ha−1) in the form of potassium sulphate (48% K2O); the second factor was ascorbic acid (AA; 0, 25, 50, 75, and 100 mg L−1); the third factor was age at cutting (AC; 40, 65, 90, 115, and 140 DAS); and the fourth factor was humic acid (HA; as powder) used from the El-Shafie company for agricultural investment, Egypt in the form of potassium humate 85%, with the amounts of 0, 2.4, 4.8, 7.2, and 9.6 kg ha−1. The investigated levels of potassium fertilizer were added via broadcasting 21 days after sowing and then humic acid levels were added in the same way one week later. Triticale grains were soaked in the different concentrations of ascorbic acid for 10 h directly before sowing.
Experimental plots were 4 m2, and seeds were hand-drilled in rows 20 cm apart. Sowing was done on the 15th and on the 20th of November in the two successive winter seasons. Irrigation was applied for 1 h every 10 days, supplying an amount of 2784 m3 water ha−1, accounting for approximately 43% of sprinkler irrigation requirements per season. This schedule was applied to impose water deficit conditions. Based on the fertilization recommendations of the crop in the region, phosphorous was added once with seedbed preparation at the rate of 100 kg P2O5 ha−1, in the form of calcium mono phosphate (15.5% P2O5). Nitrogen, in the form of ammonium nitrate (33.5% N) was applied at the rate of 144 kg N ha−1 for all treatments. All plots received a preliminary dose of 48 kg N ha−1 15 DAS. The remaining amount (96 kg N ha−1) was split into two doses according to age at cutting as follows: (1) for 40, 65, and 90 days, 48 kg N ha−1 was applied 10 days after cutting and 48 kg N ha−1 was applied 30 days later; (2) for the 115 days, 48 kg N ha−1 was applied 30 days after the preliminary dose and 48 kg N ha−1 was applied 10 days after cutting; and (3) for the 140 days, all nitrogen amount was applied before cutting 30 and 60 days after preliminary dose.

2.2. Forage Yield and Quality Characteristics

A single cut was taken from each plot at a certain plant age by cutting the plants with a sickle 10 cm above ground level and fresh forage yield (FFY) was immediately weighed in the field. A representative sample of 1 kg from each plot was dried at 60 °C until a constant weight was reached to determine the dry forage yield (DFY) per plot. The dried samples of the whole plants were uniformly ground over a 1-mm screen. Samples were analyzed by the Kjeldahl procedure [29] in duplicate for crude protein (CP = N × 6.25). Using the semiautomatic ANKOM200 fiber analyzer (ANKOM, model A200, New York, NY, USA) and two filter bags (F57-ANKOM Technology Corporation, Macedon, New York, NY, USA) for each sample, fiber fractions such as neutral detergent fiber (NDF), acid detergent fiber (ADF) and acid detergent lignin (ADL) were sequentially determined according to [30].
The crude ash (CA) content was determined by incinerating the samples in a muffle oven at 550–600 ℃ for 3 h, while crude fat (CF) content was determined using the Soxhlet procedure [29]. Non-fiber carbohydrates (NFC) content (g kg−1) was then calculated as follows:
NFC = 1000 − (CP + Fat + NDF + CA)
For the preparation of ruminal inoculum to perform the in vitro degraded assay, samples of ruminal content (50% liquid, 50% solid fractions) were collected from three cannulated Barki sheep (55.2 ± 2.54 kg body weight). Animals were fed berseem clover hay and concentrate mixture (60% ground corn, 25% wheat bran, and 15% soybean meal), with ad libitum access to water. The ruminal content of each animal was squeezed through four layers of cheesecloth, and maintained in a water bath (39 °C) under CO2 to prepare the ruminal inocula for incubation. The rumen fluid was then diluted 1:2 with a nutritive buffer incubation medium [31]. Samples of 500 mg of each forage sample were weighed in three glass bottles (120 mL volume) and incubated with 45 mL of buffered ruminal inoculum and incubated at 39 °C in a forced air oven for 24 h. The same procedure was followed for blank bottles (containing buffered ruminal inoculum without substrate) and for internal standard bottles containing the buffered ruminal inoculum with standard (berseem clover hay) to detect the sensitivity changes induced by the inocula.
After the incubation period, the fermentation process was interrupted by opening the bottles and immediately placing it in cold water. Truly degraded organic matter (DOM) was analyzed as described by [32]. The contents of the bottles were filtered into dried free crucibles, washed with hot distilled water, dried, and burned to ash. The difference between the amounts of incubated and non-DOM after 24 h is truly DOM. The difference between the amount of incubated NDF and the non-degraded is truly degraded neutral detergent fiber (DNDF).

2.3. Agronomic Characteristics and Grain Yield

Before harvesting, plant height (cm) was measured as the average of five randomly chosen plants per plot. The number of spikes per m2 was counted as the average of two samples per plot, each of one m2. The inner guarded area of each plot (2.56 m2) was harvested by cutting all plants with a sickle directly above ground level, then threshing was done with a stable threshing machine, and the grain yield per plot was recorded. The 100-grain weight (g) was determined as an average of three random grain samples taken from each plot.

2.4. Experimental Design

A five-levels-four-factor central composite design [33] was adopted in the present study. That design included 16 factorial points (24), 8 central points (2*number of factors), and 8 star points (2*number of factors). The total number of experimental units used was 32 units. The minimum and the maximum ranges of investigated factors, with respect to their values in coded and actual forms, are listed in (Table 2). The full experimental plan is listed in Table 3. Upon completion of the experiment, the studied characteristics were taken as dependent or response variables (Y).

2.5. Statistical Procedures

Statistical analysis was carried out according to [34], using the statistical software package “STATISTICA 7.0”, [35].
The mathematical relationship of the independent factors and the responses were calculated by the second-order polynomial equation as follows:
Y = ®0 + ®1X1 + ®2X2 + ®3X3 + ®4X4 + ®11X12 + ®22X22 + ®33X32 + ®44X42 + ®12X1X2 + ®13X1X3 + ®14X1X4 + ®23X2X3 + ®24X2X4 + ®34X3X4
where
Y = predicted response, 0 = intercept, ®1, ®2, ®3, ®4 = linear coefficients, ®11, ®22, ®33, ®44 = quadratic coefficients and ®12, ®13, ……, ®34 = linear interaction coefficients.
Response surface diagrams for the significant Linear × Linear interactions were plotted by STATISTICA 7.0 [35], while the linear and quadratic responses of the main effects were plotted by Curve Expert, ver. 1.34 [36].

3. Results

3.1. Forage Yield and Quality

The regression equations presented in Table 4, revealed that the DFY was significantly and positively affected by the linear components of AC (age at cutting) with r2 = 0.95 and 0.97 in 2018/19 and 2019/20 growing seasons, respectively. However, DFY did not reveal any significant response to PF, AA, and HA and their interactions. As illustrated in Table 5, the value of DFY peaked to 4.86 t ha−1, as an average of both seasons, when AC was delayed to 140 DAS (S6). The lowest DFY value reached 2.62 t ha−1, as an average of both seasons, and was detected at early AC at 40 DAS (S5).
Results in Table 4 indicated that the CP was significantly and positively affected by the linear components of PF, AA, and HA in 2018/19 season with r2 = 0.93, however, CP significantly responded only to AA and HA levels in 2019/20 season with r2 = 0.95. The optimal level of the quadratic components of PF, AA and HA was 110 kg ha−1, 75 mg L−1 and 6.7 kg ha−1 in 2019/20 and AC at 74 DAS in the two respective seasons. Crude protein was significantly and negatively influenced by the linear effect of AC in both seasons. Moreover, it was negatively affected by the linear interaction between PF*AC, AA*AC, and AC*HA in 2018/19. The highest CP (Table 5) value reached 175.17 g kg−1 as an average of both seasons, which was detected at the earliest AC at 40 DAS (S5) and the lowest CP value reached 72.3 g kg−1 with delayed AC to 140 DAS (S6). The interaction between PF*AC (Figure 2), AA*AC (Figure 3), and AC*HA (Figure 4) were significant and of negative relationship. The response surface showed that the CP increased with cutting at early age and high levels of PF and AA and under all levels of HA in 2018/19.
In Table 4, the regression equations indicated that NDF, ADF, ADL, and NFC were significantly and positively affected by the linear components of PF, AA, AC, and HA in such a way that, PF significantly affected NDF and ADF in 2019/20, HA showed significant impact on NDF in 2019/20 and ADL in 2018/19, AA significantly affected NDF in 2018/19 and ADF in the two seasons and AC showed significant impact on NDF, ADF, ADL, and NFC in both seasons. The optimal level of the quadratic component of PF was 103.30 kg ha−1 for NDF in average of both seasons and 111.20 kg ha−1 for ADF and 130.00 kg ha−1 for ADL, respectively, in 2018/19 only. The optimal AA levels reached 62.60 and 61 mg L−1 for NDF and NFC, respectively, in 2019/20, and 68.30 mg L−1 for ADL in 2018/19. The optimal levels of AC were 126 and 138 DAS for NDF and ADF, respectively, in 2018/19, and 98 and 97 DAS for NFC in the two respective seasons. The mean of HA was 5.60 kg ha−1 for NDF in 2019/20. The ADF was significantly and negatively influenced by the quadratic effect of AA with 63.00 mg L−1 and AC at 132 DAS in 2019/20. However, the linear interaction was positively affected by AA*AC for NDF, and ADF in 2018/19 and AA*HA for NDF, and ADL in 2018/19. The highest values of NDF, ADF, ADL, and NFC reached 543.76 g kg−1, 278.50 g kg−1, 64.98 g kg−1, 310.92 g kg−1, respectively, as average of both seasons (Table 6), and they were associated with cutting at 140 DAS (S6). On the other hand, the lowest values of these characteristics were achieved at early cutting at 40 DAS (S5) in both seasons. The AA*AC interaction was positive and significant for NDF and ADF in 2018/19, and the response surface (Figure 3) revealed that NDF and ADF were highest at delayed cutting, when the highest concentration of AA was applied. The response surface (Figure 5) showed that NDF and ADL were significantly and positively related with the AA*HA linear interaction in 2018/19. Moreover, the increase in NDF and ADL was detected with higher levels of AA*HA.
The regression equations (Table 4) indicated that the DNDF was significantly and positively affected by the linear components of PF, AA, and HA in 2019/20 with r2 = 0.93 and 0.89 for DOM, 0.89 and 0.80 for DNDF in 2018/19 and 2019/20, respectively. The optimal level of the quadratic effect of PF was 110.00 kg ha−1 for DNDF and that of HA was 6.04 kg ha−1 for DNDF, while, that of AA was 60.70 mg L−1 for DOM in 2019/20. Both DOM and DNDF were significantly and negatively influenced by the linear effect of AC in 2018/19 and 2019/20, respectively. The optimal level of the quadratic effect of AC was 76 DAS for DOM in 2018/19 and 77 DAS for DNDF in 2019/20. Nonetheless, DNDF was negatively affected by the linear interactions of PF*AA, PF*AC, and AC*HA in 2019/20 and of AA*HA in 2018/19. The highest DOM and DNDF (Table 7) values reached 662.5 g kg−1, 377.50 g kg−1 as an average of both seasons, and they were detected at the earliest levels of AC at 40 DAS (S5), Meanwhile, the lowest values for both characteristics were associated with delayed AC till 140 DAS (S6). The PF*AC (Figure 2), AC*HA (Figure 4) and PF*AA (Figure 6), interactions were significant and of negative relationship in 2019/20. The response surface revealed that the DNDF increased with increasing PF or AA in 2019/20. The response surface (Figure 2) showed that DNDF increased with cutting at early age and the highest level of PF in 2019/20. The response surface (Figure 4) showed that DNDF was significantly and negatively related with the AC*HA linear interaction, and the figure indicated an increase in DNDF with cutting at early age and high levels of HA. In addition, the AA*HA interaction was negative and significant in 2018/19, and the response surface (Figure 5) revealed that DNDF was highest at the highest levels of AA or HA.

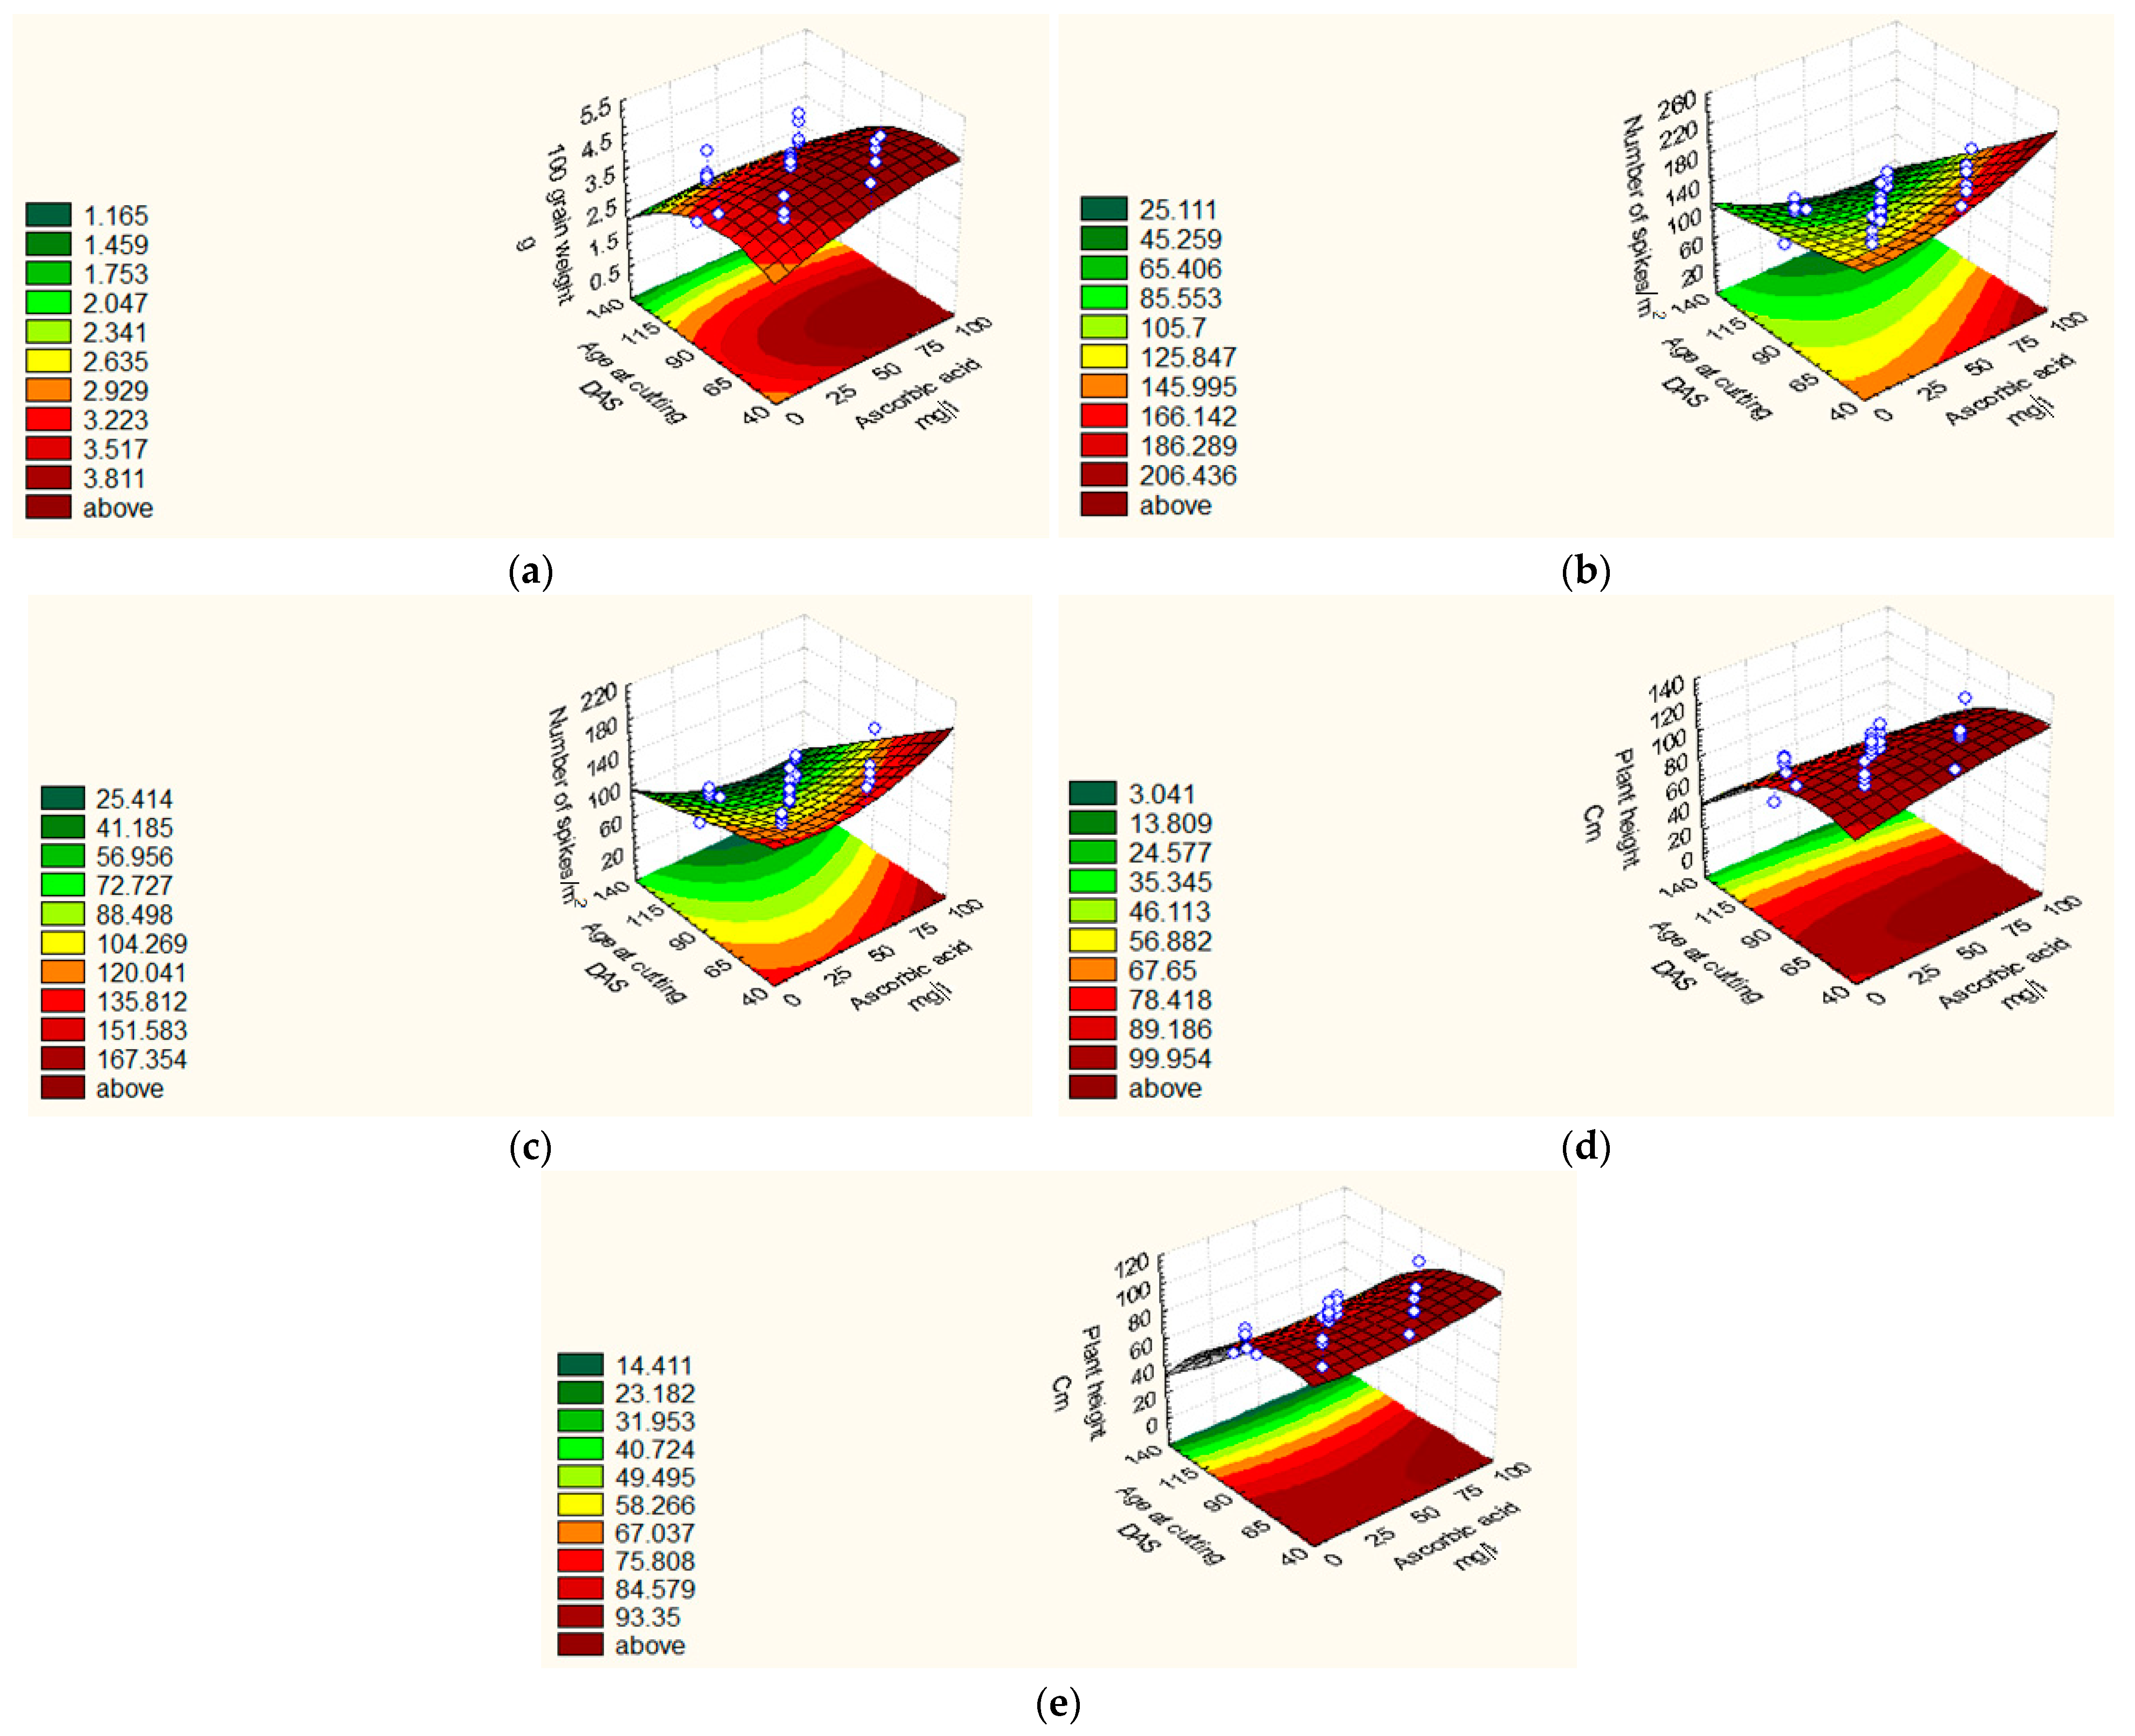
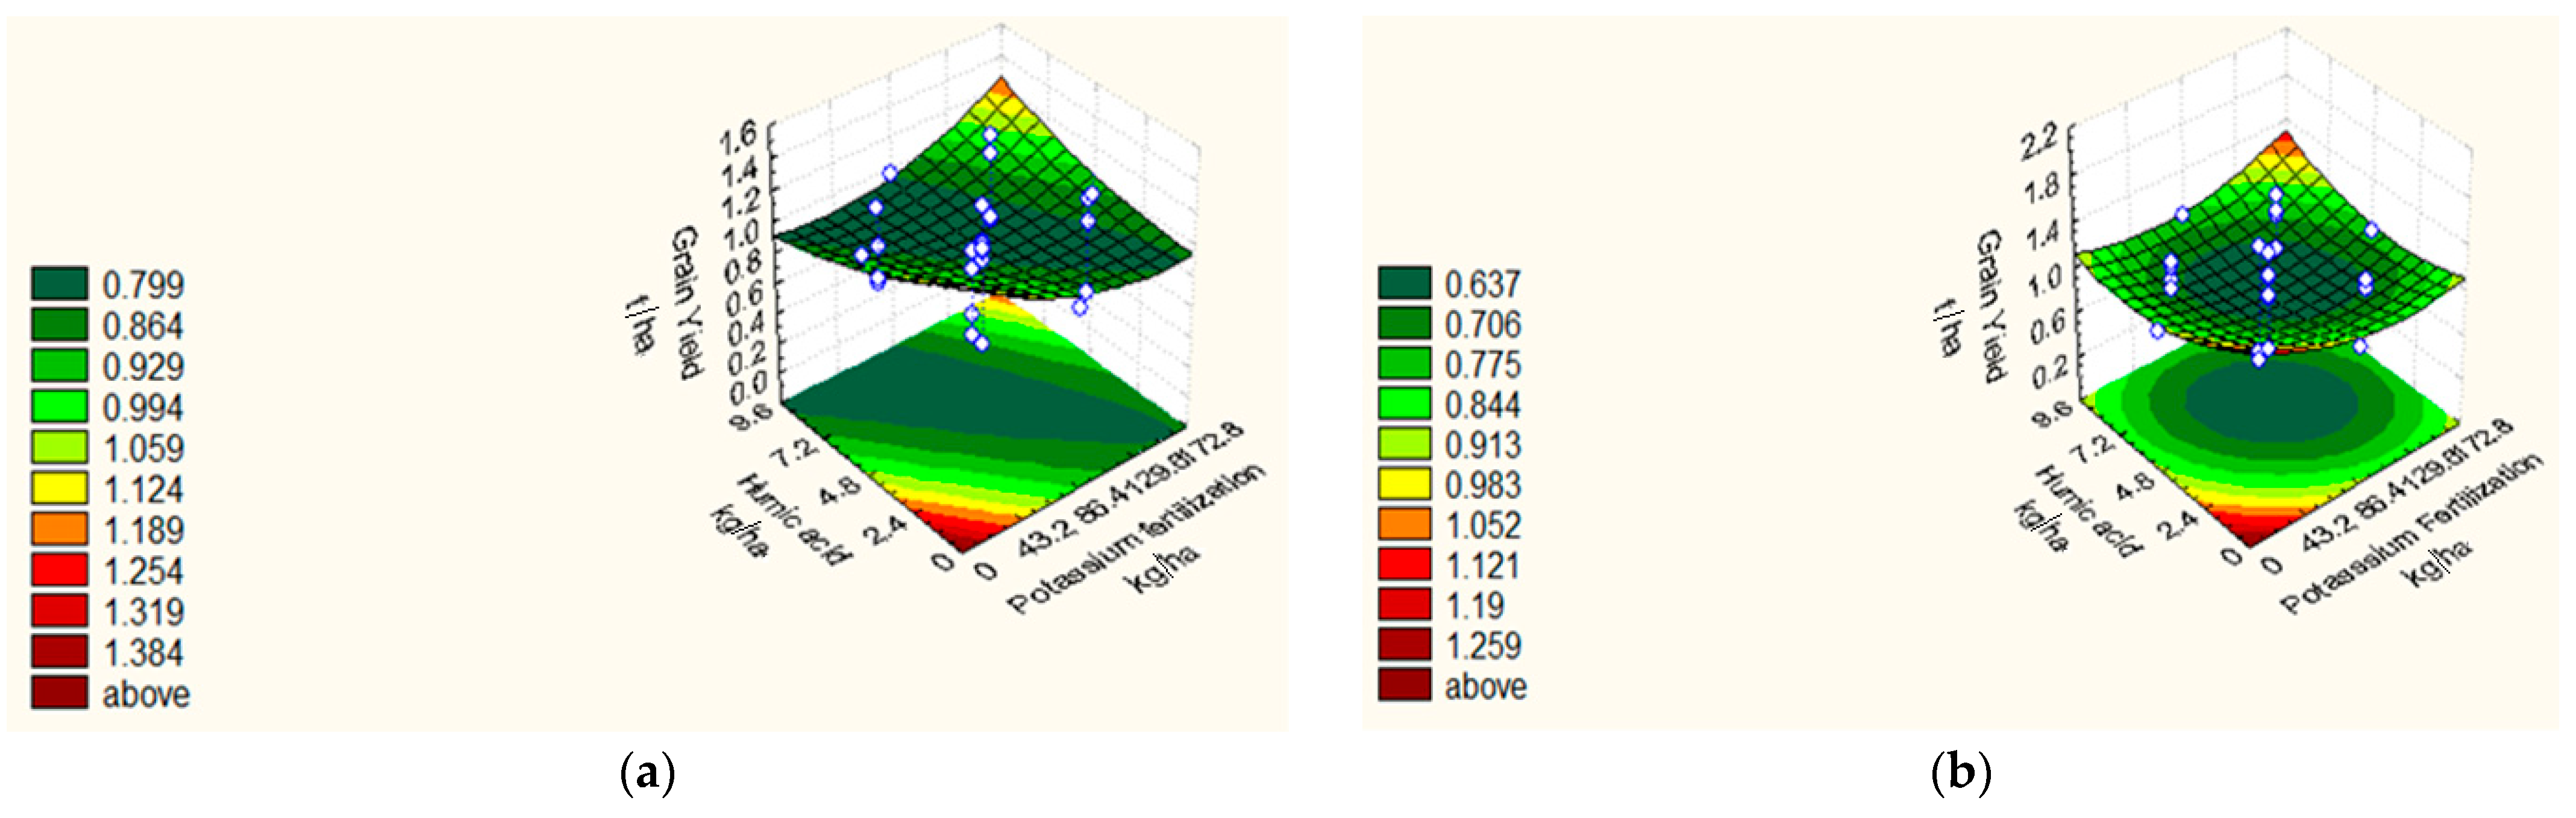
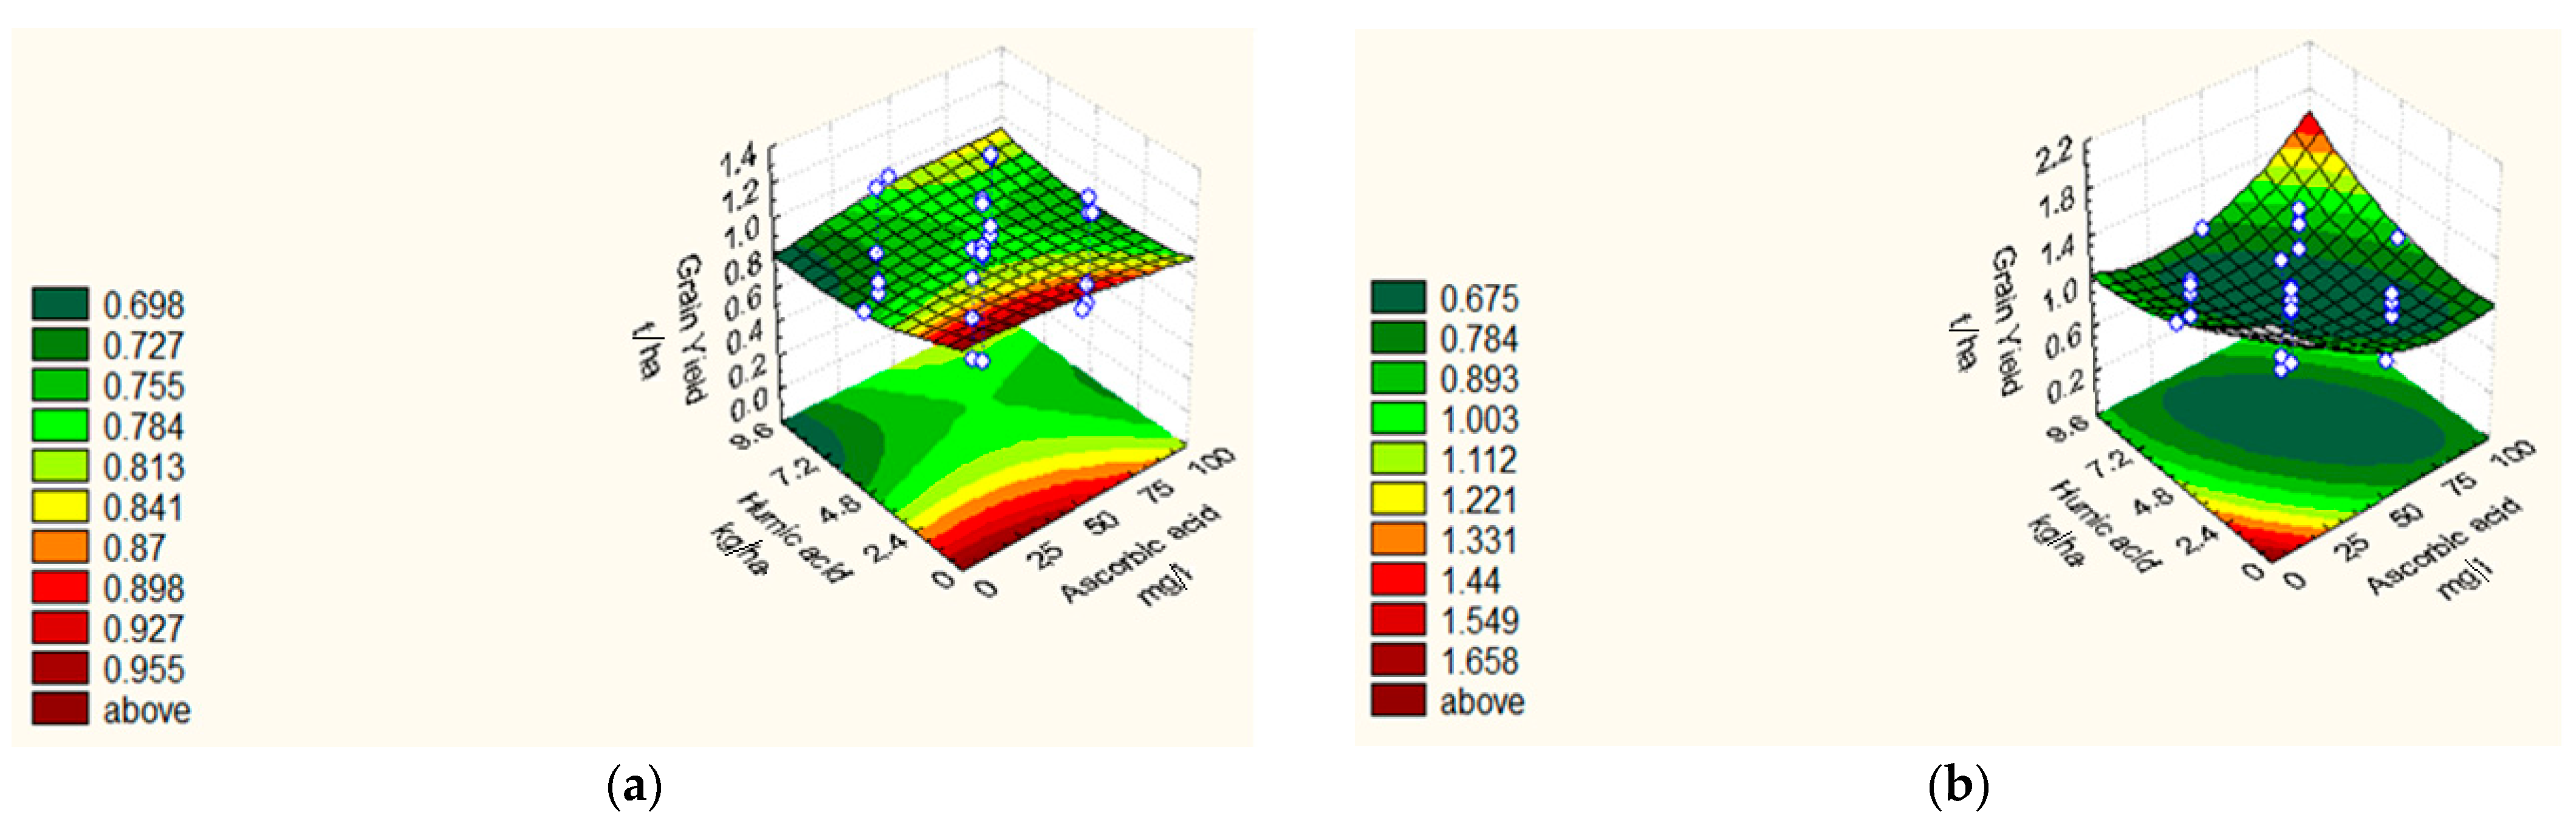
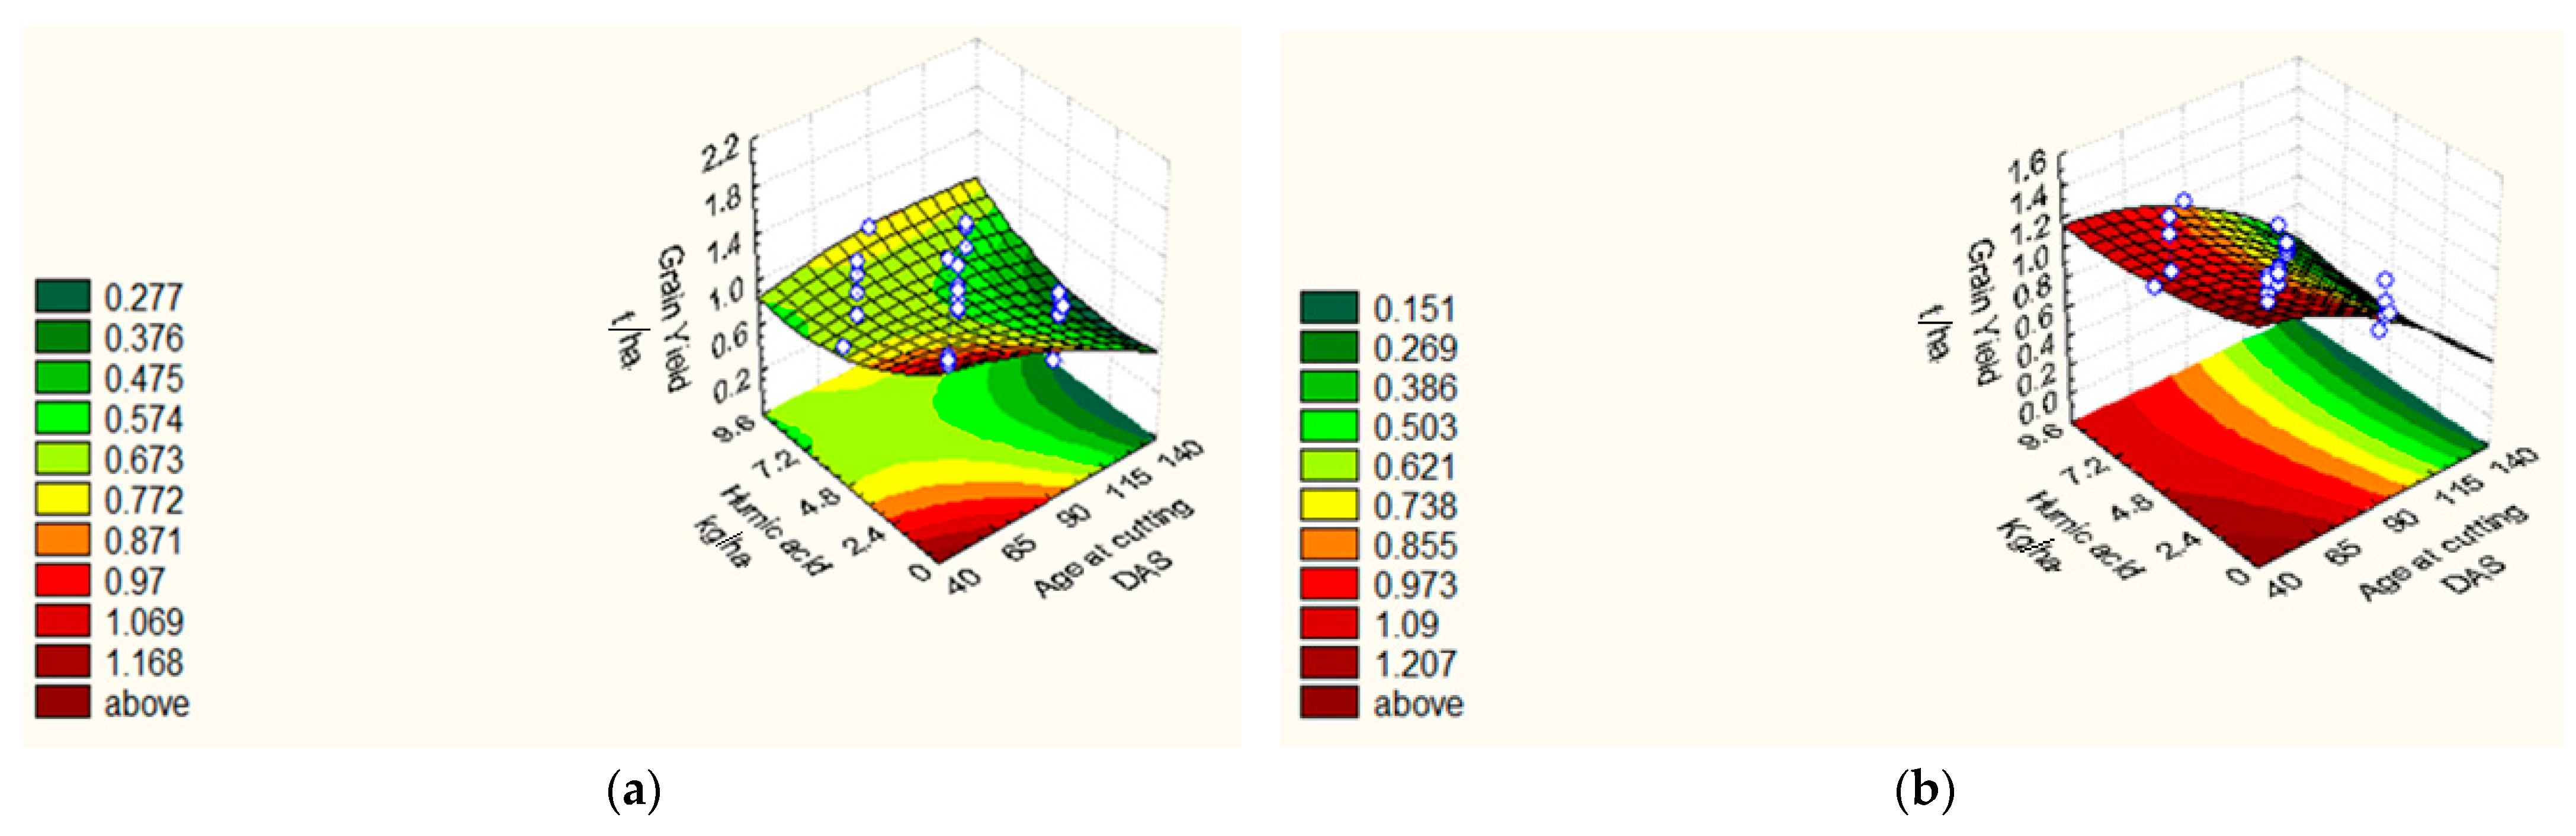
3.2. Grain yield and Agronomic Characteristics

Results presented in Table 8 showed that the 100 GW, NSM−2, PH, and GY were significantly and positively affected by the linear components of PF for NSM−2 in 2019/20, AA and HA levels for 100 GW in 2019/20, HA only for NSM−2 in 2019/20 and for PH in 2018/19 and 2019/20 with r2 = 0.83 and 0.68 for 100 GW, 0.89 and 0.89 for NSM−2, 0.92 and 0.94 for PH, 0.93 and 0.75 for GY. The optimal level from quadratic components of PF was 107.14 and 102.43 kg ha−1 for 100 GW and GY, respectively, as an average of both seasons. The optimal level of AA was 51.70 and 50 mg L−1 for 100 GW and GY in 2019/20 and HA with 7.50 kg ha−1 for PH in 2019/20. Four characteristics (100 GW, NSM−2, PH, and GY) were significantly and negatively influenced by the linear effect of PF for 100 GW in 2019/20 and for GY in the both seasons. Meanwhile, AA significantly and negatively influenced GY in 2019/20, while AC exerted a significant and negative influence on 100 GW, NSM−2, PH, and GY in both seasons, and HA affected only GY in the both seasons. The optimal level from quadratic effect of AA was 61.30 mg L−1 for 100 GW in 2019/20 and that of AC was 69, 60, and 49 DAS for 100 GW, PH, and GY as an average of both seasons, respectively. However, the linear interaction was negatively affected by AA*AC for 100 GW in 2019/20, for NSM−2 and PH in both seasons. In addition, the interactions PF*HA, AA*HA and AC*HA were significant for GY in the both seasons. The highest 100 GW, NSM−2, PH and GY (Table 9), values reached 4.79 g and 164 for 100 GW and NSM−2, respectively, in an average of both seasons, and they were associated with early cutting (S5); the highest GY and PH were 112.00 cm and 1.73 t ha−1 at the highest level of HA and lowest levels of PF, AA and AC (F2), as average of both seasons. The AA*AC was significant and of negative relationship. The response surface (Figure 7) showed that the 100 GW, NSM−2, PH increased with increasing AA at early AC (40 and 65 DAS). However, it was positively affected by the linear interaction of PF*HA, AA*HA and AC*HA in 2018/19 and 2019/20, respectively. The response surface of PF*HA (Figure 8) showed that GY increased with increasing PF and HA in 2018/19 and 2019/20, respectively. The response surface of AA*HA (Figure 9) revealed that GY decreased with increasing levels of both nutrients. The response surface (Figure 10) showed that GY increased with early AC under all levels of HA in 2018/19 and 2019/20.

4. Discussion

The central composite design, as proposed by [33], is utilized to quantitatively elucidate the importance of the studied factors and their linear interaction for the various studied characteristics. Hence, the factor that reveals significant main and interaction effects on the studied characteristics should be considered more important than the other factors that show relatively fewer significant effects. Seasonal variations should be taken in consideration, where the factors that show significant effects in both seasons are considered more important than those showing significance in only one season. Concerning forage yield and quality characteristics, the results indicated that delaying cutting beyond 98 DAS led to an increase in NDF (25%), ADF (43%), and ADL (64%), in addition to an increase in dry forage yield (DFY) by 64% and non-fiber carbohydrates (NFC) by 12%. On the other hand, a pronounced decrease of 59% in crude protein (CP) was observed with delayed cutting. These findings were in agreement with those reported by [23,37,38], who reported that cutting the crop at an advanced age increased the DFY. The increase in DFY may be attributed to the increase in the stem component of the forage and the reduction in the leaf component, where stems are higher in dry matter content than leaves, thus contributing to the DFY of the produced herbage [22]. In addition, as the plant grows the photosynthetic activity increases leading to higher biomass production [39]. Similarly, fiber fractions (NDF, ADF, and ADL) increased with delayed cutting, which may be as well attributed to the increase in the stem component of the older plants than the leaf component [23]. Furthermore, while the plant matures the contents of water-soluble carbohydrates in the leaves and stems decrease, which is associated with an increase in their content from the different fiber fractions [40]. Non fiber carbohydrate content is another important criterion for forage quality, which followed the same trend as fiber fractions but with lesser magnitude, which may be explained by the translocation of carbohydrates to the grains, in addition to those present in green leaves before harvesting. Ref. [22] reported similar findings. On the other hand, delaying cutting decreased protein content. That reduction in protein content of triticale plants at later stages of cutting may be attributed to the dilution of photosynthates accompanying the higher amount of produced forage yield [41], the increase in the stem component with herbage maturity [37] and organs’ differentiation (leaves, stems and spikes) in the course of plant life [42]. In late cuttings, all other studied factors (potassium fertilization, ascorbic acid, and humic acid) had minor effects on NDF, ADF, ADL, CP, and DFY. However, both AA and PF increased NFC in late cuttings, which could be due to the role played by AA in carbohydrate formation [43] and the role of potassium in the translocation of photosynthates to the grains [44]. In early cutting ages, both AA and HA enhanced protein formation in plants, which may be attributed to the essential role of AA in protein synthesis [45] and the action of HA in facilitating the nitrogen uptake, in addition to other nutrients by plants which result in higher protein synthesis [46]. That was reflected on the ruminal degradability of nutrients (DOM and DNDF), which were higher in early cuttings and decreased by 63 and 65%, respectively, in late cuttings. The optimal cutting age for both characteristics was approximately 75 DAS, which coincides with that of optimal CP (74 DAS). Refs. [47,48] reported that ruminal degradability of nutrients was positively correlated with CP content but negatively correlated with the contents of NDF, ADF, and lignin. Degraded organic matter and degraded NDF decreased with advancing forage maturity, which may be attributed to the lignification of the fodder’s fiber content that resulted in lower DNDF as the plant matures. Clearly, the nutritive value of winter cereals that are cut at an early age for animals is superior [49]. The poor degradability is associated with a relatively high lignin content which increases with age and causes a decrease in the nutritive value [39]. Ref. [21] found that with maturation, the nutritional value of forage grasses declines, owing to a reduction in crude protein content and an increase in fiber content (NDF, ADF, and ADL).
Regarding the plant height, grain yield, and yield components, i.e., 100-grain weight (100 GW) and number of spikes m−2(NSM−2), results indicated a reduction in all characteristics with delayed cutting. A stage of poor regrowth was reached after cutting at 140 DAS. Delaying cutting to later growth stages resulted in removing plant biomass and leaving a short period for regrowth, resulting in a more sensitive crop to any induced stress condition that may decrease the final grain yield and the yield components [50]. Moreover, delaying cutting leads to a decrease in the content of carbohydrates between age at cutting and anthesis, which will decrease the yield components [51]. Cutting at an early age will allow the regrowth of triticale plants to fulfill their vegetative growth compared to cutting at late stages. Ref. [22] reported similar findings, where they emphasized that the regrowth had higher plant heights at an earlier cutting age. The optimal values were 63, 68, and 50 DAS for plant height, 100-grain weight, and grain yield, respectively. With regard to NSM−2, application of potassium, AA and HA at higher levels increased the values compared to lower levels. The optimal levels obtained from this study were 86–107 kg ha−1, 46–56 mg L−1, and 7.5 kg ha−1 for the three growth resources, respectively. These growth resources play an important role in balancing plant nutrition and the availability of essential nutrients to triticale plants that led to an increase in NSM−2. Ref. [52] reported that the application of PF resulted in higher photosynthetic activity during the initial growth stage leading to more availability of assimilates, which plays an important role in increasing the number of spikes m−2. Moreover, PF has a collective role in increasing root growth, and it facilitates the translocation of the nutrients and photo-assimilates, thus, increasing PF levels will enhance the number of spikes m−2 [15]. In addition, PF application increased 100-grain weight, and that could be due to the role played by PF in the translocation of photosynthates from source (leaves) to the grains (sink) as previously reported by [53,54]. The increase in the vegetative characteristics and the yield attributes, as a result of increasing PF application to the optimal level, led to an increase in the grain yield of small cereals [15,55,56]. Ascorbic acid ameliorates the adverse effects of water deficit due to promoting root growth, which helps in water and nutrient uptake, and the synthesis of growth-promoting hormones such as auxin, gibberellin, and cytokinin, resulting in an increase in the plant height of forage crops [57,58]. The positive effects of AA on the yield components (number of spikes and 100-grain weight) may be attributed to its role in the translocation of metabolites from the leaves to the reproductive organs [58], increasing the 100-grain weight [17,59], hence grain yield increased [60]. With regard to the role of HA in promoting plant growth, HA is known to improve the permeability of a cell membrane, which results in increasing the absorption and the uptake capacity of roots for both water and nutrients thus enhancing plant growth [61]. Several research sources reported that increasing HA level increased plant height [62,63]. Humic acid was found to increase yield components (number of spikes and 100-grain weight), which may be attributed to the role of HA in increasing root vitality, improving nutrient uptake, increasing chlorophyll synthesis [64]. Moreover, increasing fertilizer retention and stimulating beneficial microbial activity thus increases NSM−2 [64]. Humic acid increased the 100-grain weight—explained by the role of HA in increasing crop growth rate— and it increased the accumulation of dry matter in the plant, which is transferred to the grains later by increasing the net assimilates stored in the stem and leaves and finally increased 100-grain weight in cereals crops [65,66]. The grain yield of triticale was reduced due to a reduction in the yield components with late cutting because delaying cutting leads to a decrease in the content of carbohydrates between age at cutting and anthesis, which will decrease yield components and, thus, grain yield. However, in early cuttings, the presence of the three growth additives in higher levels gave higher values for grain yield compared to low levels of those additives indicating their involvement in better regrowth of triticale plants after cutting and resilience of plants to water deficit conditions. Humic acid application improved the grain yield of cereals, including triticale for its role in water retention and the photosynthetic and antioxidant metabolism under water deficit conditions [27,67].

5. Conclusions

Under the arid Mediterranean conditions of the current study, variations in the response of dual-purpose triticale to the applied treatments (PF, AA, and HA) were clearly detected under the different ages at cutting. A strong effect for age at cutting was observed on the yield and the quality of the produced forage as well as the plant’s regrowth ability, which was reflected in the final grain yield. Early cutting resulted in forage with high CP, DOM, and DNDF content. On the other hand, delayed cutting significantly increased DFY, fiber fractions (NDF, ADF, and ADL), and NFC content in the produced forage. Better regrowth attributes and a higher grain yield were obtained when the crop was cut for forage production at an early age. The addition of PF, AA, and HA at higher levels mitigated the water deficit conditions, resulting in higher DFY, GY, and PH, especially when the crop was cut at 65 DAS for forage production.

Author Contributions

Conceptualization, A.I.N., H.S.A.S. and A.M.S.; methodology and investigation, A.I.N., H.S.A.S., I.M.K. and A.M.S.; field experiments and agronomic evaluation, S.A.A.A.-E. and A.M.S.; laboratory analysis of forage quality, S.A.A.A.-E., H.S.A.S. and I.M.K.; statistical analysis, S.A.A.A.-E., A.I.N. and A.M.S.; writing—original draft preparation, S.A.A.A.-E. and A.M.S.; writing—review and editing, A.I.N. and H.S.A.S.; supervision, A.I.N., H.S.A.S., I.M.K. and A.M.S.; funding acquisition, A.I.N., H.S.A.S., I.M.K. and A.M.S. All authors have read and agreed to the published version of the manuscript.

Funding

This research received no external funding.

Informed Consent Statement

Not applicable.

Data Availability Statement

Not applicable.

Conflicts of Interest

The authors declare no conflict of interest.

Abbreviations

AAAscorbic acid
ADFAcid detergent fiber
ADLAcid detergent lignin
BYBiological yield
ACAge at cutting
CACrude ash
CPCrude protein
DASDays after sowing
DOMDegraded Organic matter
DNDFDegraded neutral detergent fiber
DFYDry forage yield
100 GW100-grain weight
GYGrain yield
HAHumic acid
NDFNeutral detergent fiber
NSM−2Number of spikes m−2
NFCNon-fiber carbohydrates
PHPlant height
PFPotassium fertilization

References

  1. Lamega, S.A.; Komainda, M.; Hoffmann, M.P.; Ayisi, K.K.; Odhiambo, J.J.O.; Isselstein, J. It depends on the rain: Smallholder farmers’ perceptions on the seasonality of feed gaps and how it affects livestock in semi-arid and arid regions in Southern Africa. Clim. Risk Manag. 2021, 34, 100362. [Google Scholar] [CrossRef]
  2. Shaalan, A.M.; Attia, M.A.; Salama, H.S.A. Grain yield and growth parameters of pearl millet genotypes grown in an arid environment under variable plant densities. Asian J. Plant Sci. 2021, 20, 52–60. [Google Scholar] [CrossRef]
  3. Beji, S. Yield and quality of dual-purpose barley and triticale in a semi-arid environment in Tunisia. Afr. J. Agric. Res. 2016, 11, 2730–2735. [Google Scholar] [CrossRef]
  4. Küçüközdemir, Ü.; Dumlu, B.; Yalçın, Z.; Karagöz, H. Determination of yield, quality and winter hardiness characteristics of some triticale (xTriticosecale Wittmack) genotypes in Pasinler and Erzincan locations. Ekin J. Crop Breed. Genet. 2019, 5, 74–83. [Google Scholar]
  5. FAOSTAT. Statistical Yearbook; Food and Agriculture Organization of the United Nations: Rome, Italy, 2018. [Google Scholar]
  6. Oba, M.; Penner, G.B.; Whyte, T.D.; Wierenga, K. Effects of feeding triticale dried distillers grains plus soluble as a nitrogen source on productivity of lactating dairy cows. J Dairy Sci. 2010, 93, 2044–2052. [Google Scholar] [CrossRef]
  7. Bilgili, U.; Cifci, E.A.; Hanoglu, H.; Yagdi, K.; Acikgoz, E. Yield and quality of triticale forage. J. Food Agric. Environ. 2009, 7, 556–560. [Google Scholar]
  8. Salama, H.S.A.; Badry, H.H. Forage and grain yields of dual-purpose triticale as influenced by the integrated use of Azotobacter chroococcum and mineral nitrogen fertilizer. Ital. J. Agron. 2020, 16, 1719. [Google Scholar] [CrossRef]
  9. Arseniuk, E. Triticale Abiotic Stresses—An Overview; Springer International Publishing: Cham, Switzerland, 2015; pp. 69–81. [Google Scholar]
  10. Akram, N.A.; Shafiq, F.; Ashraf, M. Ascorbic Acid-A Potential Oxidant Scavenger and Its Role in Plant Development and Abiotic Stress Tolerance. Front. Plant Sci. 2017, 8, 613. [Google Scholar] [CrossRef]
  11. Godoy, F.; Olivos-Hernández, K.; Stange, C.; Handford, M. Abiotic Stress in Crop Species: Improving Tolerance by Applying Plant Metabolites. Plants 2021, 10, 186. [Google Scholar] [CrossRef]
  12. Hasanuzzaman, M.; Bhuyan, M.H.M.; Nahar, K.; Hossain, M.D.; Mahmud, J.A.; Hossen, M.; Fujita, M. Potassium: A Vital Regulator of Plant Responses and Tolerance to Abiotic Stresses. Agronomy 2018, 8, 31. [Google Scholar] [CrossRef] [Green Version]
  13. Singh, G.; Manuja, S.; Parmar, D.K.; Singh, D. Response of rainfed barley (Hordeum vulgare L.) to phosphorus and potassium application. J. Pharmacogn. Phytochem. 2021, 10, 468–471. [Google Scholar] [CrossRef]
  14. Ahmad, M.; Waheed, A.; Niaz, A.; Hannan, A.; Ranjha, A.M. Maize fodder quality characteristics and yield as affected by potassium application on calcareous sandy clay loam soil. Soil Environ. 2009, 28, 169–173. [Google Scholar]
  15. Kubar, G.M.; Talpur, K.H.; Kandhro, M.N.; Khashkhali, S.; Nizamani, M.M.; Kubar, M.S.; Kubar, K.A.; Kubar, A.A. Effect of potassium (K+) on growth, yield components and macronutrient accumulation in Wheat crop. Pure Appl. Biol. 2019, 8, 248–255. [Google Scholar] [CrossRef]
  16. Prajapati, K.; Modi, H.A. The Importance of Potassium in Plant Growth—A Review. Indian J. Plant Sci. 2012, 1, 177–186. [Google Scholar]
  17. Osman, E.A.M.; Nor Eldein, G.A. Response of Three Bread Wheat to Nitrogen Fertilizer with or without Ascorbic Acid Grown on a Clay Soil. J. Soil Sci. Agric. Eng. Mansoura Univ. 2017, 8, 267–274. [Google Scholar] [CrossRef]
  18. Salama, K.H.A. Amelioration of NaCl-induced alterations on the plasma membrane of Allium cepa L. by ascorbic acid. Aust. J Basic Appl. Sci. 2009, 3, 990–994. [Google Scholar]
  19. Shah, T.; Latif, S.; Khan, H.; Munsif, F.; Nie, L. Ascorbic Acid Priming Enhances Seed Germination and Seedling Growth of Winter Wheat under Low Temperature Due to Late Sowing in Pakistan. Agronomy 2019, 9, 757. [Google Scholar] [CrossRef] [Green Version]
  20. Singh, M.; Chauhan, A.; Kumar, R.; Joshi, D.; Soni, P.G.; Meena, V.K. Dual purpose barley as affected by date of sowing, varieties and stage of harvesting-A review. Agric. Rev. 2017, 38, 159–164. [Google Scholar] [CrossRef] [Green Version]
  21. Ronga, D.; Dal Prà, A.; Immovilli, A.; Ruozzi, F.; Davolio, R.; Pacchioli, M.T. Effects of Harvest Time on the Yield and Quality of Winter Wheat Hay Produced in Northern Italy. Agronomy 2020, 10, 917. [Google Scholar] [CrossRef]
  22. Salama, H.S.A.; Safwat, A.M.; Elghalid, O.H.; Abd El-Hady, A.M. Agronomic and In Vitro Quality Evaluation of Dual-Purpose Cereals Clipped at Variable Ages and Their Utilization in Rabbit Feeding. Agronomy 2021, 11, 1147. [Google Scholar] [CrossRef]
  23. Salama, H.S.A. Dual Purpose Barley Production in the Mediterranean Climate: Effect of Seeding Rate and Age at Forage Cutting. Int. J. Plant Prod. 2019, 13, 285–295. [Google Scholar] [CrossRef]
  24. Coblentz, W.K.; Akins, M.S.; Kalscheur, K.F.; Brink, G.E.; Cavadini, J.S. Effects of growth stage and growing degree day accumulations on triticale forages: 1. Dry matter yield, nutritive value, and in vitro dry matter disappearance. J. Dairy Sci. 2018, 101, 1–21. [Google Scholar] [CrossRef] [PubMed]
  25. Gerke, J. Concepts and Misconceptions of Humic Substances as the Stable Part of Soil Organic Matter: A Review. Agronomy 2018, 8, 76. [Google Scholar] [CrossRef] [Green Version]
  26. Fahmi, A.H.; Sallume, M.O.; Aswad, A.H.; Abdulrahman, A.L.; Hamdi, G.J.; Abood, M.A. Interaction effect of potassium fertilizer, humic acid and irrigation intervals on growth and yield of wheat. Res. Crops 2020, 21, 31–35. [Google Scholar] [CrossRef]
  27. Bijanzadeh, E.; Emam, Y.; Perssarakli, M. Biochemical responses of water-stressed triticale (X Triticosecale wittmack) to humic acid and jasmonic acid. J. Plant Nutr. 2020, 44, 252–269. [Google Scholar] [CrossRef]
  28. Daur, I.; Bakhashwain, A.A. Effect of humic acid on growth and quality of maize fodder production. Pak. J. Bot. 2013, 45, 21–25. [Google Scholar]
  29. AOAC. International Official Methods of Analysis, 19th ed.; Association of Official Analytical Chemists: Gaithersburg, MD, USA, 2012. [Google Scholar]
  30. Van Soest, P.V.; Robertson, J.B.; Lewis, B.A. Methods for dietary fiber, neutral detergent fiber, and nonstarch polysaccharides in relation to animal nutrition. J. Dairy Sci. 1991, 74, 3583–3597. [Google Scholar] [CrossRef]
  31. Onodera, R.; Henderson, C. Growth factors of bacterial origin for the culture of the rumen oligotrich protozoon, Entodinium caudatum. J. Appl. Bacteriol. 1980, 48, 125–134. [Google Scholar] [CrossRef]
  32. Blümmel, M.; Steingaβ, H.; Becker, K. The relationship between in vitro gas production, in vitro microbial biomass yield and 15N incorporation and its implications for the prediction of voluntary feed intake of roughages. Br. J. Nutr. 1997, 77, 911–921. [Google Scholar] [CrossRef] [Green Version]
  33. Box, G.E.P.; Wilson, K.B. On the experimental attainment of optimum conditions. J. R. Stat. Soc. 1951, 13, 1–45. [Google Scholar] [CrossRef]
  34. Peterson, G.R. Design and Analysis of Experiments; Marcel Dekker, Inc.: New York, NY, USA, 1985; pp. 253–301. [Google Scholar]
  35. StatSoft, I. STATISTICA (Data Analysis Software System), Version 7; StatSoft Inc.: Tulsa, OK, USA, 2012; p. 150. [Google Scholar]
  36. Hyams, D. Curve Expert Version 1.37. A Comprehensive Curve Fitting Package for Windows. 2005. [Google Scholar]
  37. Kaur, G.; Singh, A.; Aulakh, C.S.; Gill, J.S. Variation in Forage Yield and Quality Traits of Dual Purpose Barley under Different Agronomic Practices. Forage Res. 2013, 39, 42–44. [Google Scholar]
  38. Geren, H. Dry matter yield and silage quality of some winter cereals harvested at different stages under Mediterranean climate condition. Turk. J. Field Crops 2014, 19, 197–202. [Google Scholar] [CrossRef] [Green Version]
  39. Azim, A.; Naseer, Z.; Ali, A. Nutritional evaluation of maize fodder at two different vegetative stages. Asian-Australas. J. Anim. Sci. 1989, 2, 27–34. [Google Scholar] [CrossRef]
  40. Buxton, D.R.; Fales, S.L. Plant-environment and quality. In Forage Quality, Evaluation, and Utilization; Fahey, G., Ed.; CSSA: Madison, WI, USA, 1994; pp. 155–199. [Google Scholar]
  41. Midha, L.K.; Panwar, K.S.; Sharma, N.K. Effect of cutting frequency and time of Nitrogen Application on yield & Quality of Oat. Forage Res. 1994, 25, 99–102. [Google Scholar]
  42. Rodrigo, S.; Poblaciones, M.J.; Pinheiro, N.; Maças, B.; Olea, L.; Santamaría, O.; García-White, T.; Coutinho, J. Dry matter yield and quality evaluation at different growth stages of triticale forage in south-west of the Iberian Peninsula. In The Contributions of Grasslands to the Conservation of Mediterranean Biodiversity; Porqu Eddu, C., Ríos, S., Eds.; CIHEAM/CIBIO/FAO/SEEP: Zaragoza, Spain, 2010; pp. i–iv. [Google Scholar]
  43. Chattha, M.U.; Sana, M.A.; Munir, H.; Ashraf, U.; Ul-Haq, I.; Zamir, S.I. Exogenous application of plant growth promoting substances enhances the growth, yield and quality of maize (Zea mays L.). Plant Knowl. J. 2015, 4, 1–6. [Google Scholar]
  44. Waraich, E.A.; Ahmad, R.; Halim, A.; Aziz, T. Alleviation of temperature stress by nutrient management 615 in crop plants: A review. J. Soil Sci. Plant Nutr. 2012, 12, 221–244. [Google Scholar] [CrossRef] [Green Version]
  45. Arrigoni, O.; De Tullio, M.C. Ascorbic acid: Much more than just an antioxidant. Biochim. Et Biophys. Acta 2002, 1569, 1–9. [Google Scholar] [CrossRef]
  46. Morad, K.A.; El-shafey, A.; ElMantany, R. Effect of Humic Acid Application on Growth and Productivity of Sunflower Under Saline Soil Conditions. J. Plant Prod. 2021, 11, 1193–1200. [Google Scholar] [CrossRef]
  47. Du, S.; Xu, M.; Yao, J. Relationship between fiber degradation kinetics and chemical composition of forages and by-products in ruminants. J. Appl. Anim. Res. 2016, 44, 189–193. [Google Scholar] [CrossRef] [Green Version]
  48. Salama, H.S.A.; Shaalan, A.M.; Nasser, M.E.A. Forage performance of pearl millet (Pennisetum glaucum [L.] R. Br.) in arid regions: Yield and quality assessment of new genotypes on different sowing dates. Chil. J. Agric. Res. 2020, 80, 572–584. [Google Scholar] [CrossRef]
  49. Collar, C.; Aksland, G. Harvest Stage Effects on Yield and Quality of Winter Forage. Available online: https://alfalfa.ucdavis.edu/+symposium/proceedings/2001,01-133 (accessed on 10 March 2022).
  50. Hadjichristodoulou, A. Dual purpose barley. Rachis 1991, 10, 13–14. [Google Scholar]
  51. Winter, S.R.; Thompson, E.K. Grazing winter wheat: Response of semi dwarf cultivars to grain and grazed production systems. Agron. J. 1990, 82, 33–37. [Google Scholar] [CrossRef]
  52. Brennan, R.F.; Jayasena, K.W. Increasing applications of potassium fertilizer to barley crops grown on deficient sandy soils increased grain yields while decreasing some foliar diseases. Aust. J. Agric. Res. 2007, 58, 680–689. [Google Scholar] [CrossRef]
  53. Adnan, M.; Shah, Z.; Ullah, H.; Khan, B.; Arshad, M.; Mian, I.A.; Khan, G.A.; Alam, M.; Basir, A.; Rahman, I.; et al. Yield response of wheat to nitrogen and potassium fertilization. Pure Appl. Biol. 2016, 5, 868–875. [Google Scholar] [CrossRef]
  54. Wulgo, U.K.; Al-Solaimani, S.G.M.; Alghabari, F.M. Grain Sorghum Yield and Yield Components Influenced by the Effect of Potassium Fertilizer and Saline Irrigation Water under Arid Land Conditions. Int. J. Eng. Res. Technol. 2019, 8, 649–654. [Google Scholar]
  55. Ali, I.; Khan, A.A.; Munsif, F.; He, L.; Khan, A.; Ullah, S.; Saeed, W.; Iqbal, A.; Adnan, M.; Ligeng, J. Optimizing rates and application time of potassium fertilizer for improving growth, grain nutrients content and yield of wheat crop. Open Agric. 2019, 4, 500–508. [Google Scholar] [CrossRef]
  56. Wang, Y.; Zhang, Z.; Liang, Y.; Han, Y.; Han, Y.; Tan, J. High Potassium Application Rate Increased Grain Yield of Shading-Stressed Winter Wheat by Improving Photosynthesis and Photosynthate Translocation. Front. Plant Sci. 2020, 11, 134. [Google Scholar] [CrossRef]
  57. Tóth, S.Z.; Puthur, J.T.; Nagy, V.; Garab, G. Experimental evidence for ascorbate dependent electron transport in leaves with inactive oxygen-evolving complexes. Plant Physiol. 2009, 149, 1568–1578. [Google Scholar] [CrossRef]
  58. Xu, Y.; Xu, Q.; Huang, B. Ascorbic acid mitigation of water stress-inhibition of root growth in association with oxidative defense in tall fescue (Festuca arundinacea Schreb.). Front. Plant Sci. 2015, 6, 807. [Google Scholar] [CrossRef] [Green Version]
  59. Noreen, S.; Sultan, M.; Akhter, M.S.; Shah, K.H.; Ummara, U.; Manzoor, H.; Ulfat, M.; Alyemeni, M.N.; Ahmad, P. Foliar fertigation of ascorbic acid and zinc improves growth, antioxidant enzyme activity and harvest index in barley (Hordeum vulgare L.) grown under salt stress. Plant Physiol. Biochem. 2021, 158, 244–254. [Google Scholar] [CrossRef]
  60. Bakry, A.B.; Abdelraouf, R.E.; Ahmad, M.A. Effect of drought stress and ascorbic acid foliar application on productivity and irrigation water use efficiency of wheat under newly reclaimed sandy soil. Elixir Agric. 2013, 57A, 14394–14403. [Google Scholar]
  61. Ali, A.Y.A.; Ibrahim, M.H.; Zhoua, G.; Zhua, G.; Elsiddiga, A.M.I.; Suliman, M.S.E.; Elradi, S.B.M.; Salah, E.G.I. Interactive Impacts of Soil Salinity and Jasmonic Acid and Humic Acid on Growth Parameters, Forage Yield and Photosynthesis Parameters of Sorghum Plants. S. Afr. J. Bot. 2022, 146, 293–303. [Google Scholar] [CrossRef]
  62. Anwar, S.; Iqbal, F.; Khattak, W.A.; Islam, M.; Iqbal, B.; Khan, S. Response of Wheat Crop to Humic Acid and Nitrogen Levels. EC Agric. 2016, 3, 558–565. [Google Scholar]
  63. Anwar, S.; Khan, I.; Hussain, S.; Anjum, M.M.; Iqbal, B.; Hussain, A.; Iqbal, M.O.; Ali, N. Wheat response to different levels of humic acid and brassinolide. Pure Appl. Biol. 2016, 5, 782–787. [Google Scholar] [CrossRef]
  64. Inamullah; Ali, N. Assessment of various humic acid and sulfur levels for higher yields in wheat (Triticum aestivum L.). Sarhad J. Agric. 2014, 30, 47–52. [Google Scholar]
  65. Shahryari, R.; Mollasadeghi, V. Increasing of Wheat Grain Yield by Use of a Humic Fertilizer. Adv. Environ. Biol. 2011, 5, 516–518. Available online: https://www.researchgate.net/publication/288392719 (accessed on 10 March 2022).
  66. Wali, A.M.; Shamseldin, A.; Radwan, F.I.; Abd El Lateef, E.M.; Zaki, N.M. Response of Barley (Hordeum vulgare) Cultivars to Humic Acid, Mineral and Biofertilization under Calcareous Soil Conditions. Middle East J. Agric. Res. 2018, 7, 71–82. [Google Scholar]
  67. Dulaimy, J.A.M.A.; El-Fahdawi, W.A.T. Effect of Humic Acid on Growth and Yield of Barley Humic Acid as Interacted with Row Spacing. Indian J. Ecol. 2020, 47, 62–65. [Google Scholar]
Figure 1. (a). Average monthly temperature (°C), (b). total monthly precipitation (mm) and (c). average monthly wind speed (m/sec) for the two winter seasons.
Agronomy 12 01251 g001
Figure 2. Response surface for crude protein (a) in 2018/19 and degraded neutral detergent fiber (b) in 2019/20 as affected by PF and AC at the central levels of AA and HA.
Agronomy 12 01251 g002
Figure 3. Response surface for crude protein (a), neutral detergent fiber (b) and acid detergent fiber (c) as affected by AA and AC at the central levels of PF and HA in 2018/19.
Agronomy 12 01251 g003
Figure 4. Response surface for crude protein (a) in 2018/19 and degraded neutral detergent fiber (b) in 2019/20 as affected by AC and HA at the central levels of PF and AA.
Agronomy 12 01251 g004
Figure 5. Response surface for neutral detergent fiber (a), acid detergent lignin (b) and degraded neutral detergent fiber (c) as affected by AA and HA at the central levels of PF and AC in 2018/19.
Agronomy 12 01251 g005
Figure 6. Response surface for degraded neutral detergent fiber as affected by PF and AA at the central levels of AC and HA in 2019/20.
Agronomy 12 01251 g006
Figure 7. Response surface for 100-grain weight (a), number of spikes m−2 (b,c) and plant height (d,e) in the two respective seasons as affected by AA and AC at the central levels of AA and HA.
Agronomy 12 01251 g007
Figure 8. Response surface for grain yield as affected by PF and HA at the central levels of AA, and AC in (a) 2018/19 and (b) 2019/20.
Agronomy 12 01251 g008
Figure 9. Response surface for grain yield in two seasons (a) in 2018/19 and (b) 2019/20, as affected by AA and HA at the central levels AA and HA.
Agronomy 12 01251 g009
Figure 10. Response surface for grain yield as affected by AC and HA at the central levels of AC and HA in (a) 2018/19 and (b) 2019/20.
Agronomy 12 01251 g010
Table 1. Physical and chemical soil properties at the experimental site, for the two experimental seasons.
Soil PropertiesValues
1st Season (2018/19 Season)2nd Season
(2019/20 Season)
A-Physical Analysis:
Soil TypeSand 79.4%Clay 15.4%Silt 5.2%
Sand Loamy
B-Chemical Analysis:
pH7.968.18
E.C. (ds/m)0.802.24
Organic matter (%)1.010.533
Total N (%)3.053.07
HCO3 (ppm)4.05.6
Cl (ppm)4.014.3
SO4 (meq/L)3.64.7
Ca++ (meq/L)7.03.9
Mg++ (meq/L)1.03.6
Na+ (meq/L)5.416.6
K+ (meq/L)0.80.5
Table 2. Coded and actual levels of the studied factors in central composite design.
Coded Level FactorsUnit−S
α (−2)
−F
(−1)
Central Point
(0)
+F
(+1)
+S
+α (2)
Potassium fertilization (PF)(X1)kg ha−1043.286.4129.6172.8
Ascorbic acid (AA)(X2)mg L−10255075100
Age at cutting (AC)(X3)DAS406590115140
Humic acid (HA)(X4)kg ha−102.44.87.29.6
S: Star points, F: Factorial points, and , +: minimum and maximum factorial and star levels.
Table 3. Points of central composite design of experiments in coded values and actual levels.
Coded ValuesActual Levels
Exp. No.X1X2X3X4PFAAACHA
Central points = 2 × 4 = 81000086.450904.8
2000086.450904.8
3000086.450904.8
4000086.450904.8
5000086.450904.8
6000086.450904.8
7000086.450904.8
8000086.450904.8
Star points = 2 × 4 = 81−2000050904.8
2+2000172.850904.8
30−20086.40904.8
40+20086.4100904.8
500−2086.450404.8
600+2086.4501404.8
7000−286.450900
8000+286.450909.6
Factorial points = 24 (one replicate) = 161−1−1−1−134.225652.4
2−1−1−1143.225657.2
3−1−11−143.2251152.4
4−1−11143.2251157.2
5−11−1−143.275652.4
6−11−1143.275657.2
7−111−143.2751152.4
8−111143.2751157.2
91−1−1−1129.625652.4
101−1−11129.625657.2
111−11−1129.6251152.4
121−111129.6251157.2
1311−1−1129.675652.4
1411−11129.675657.2
15111−1129.6751152.4
161111129.6751157.2
Table 4. Regression equations describing the relationship between dry forage yield (DFY), crude protein (CP), neutral detergent fiber (NDF), acid detergent fiber (ADF), acid detergent lignin (ADL), non-fiber carbohydrates (NFC) degraded organic matter (DOM), and degraded neutral detergent fiber (DNDF), and the investigated factors in 2018/19 and 2019/20.
Charact.SeasonsEquationR2C.V %
DFY
(t ha−1)
2018/19Y = 4.35 + 0.78 X3.0.953.48
2019/20Y = 3.29 + 0.51 X3.0.973.07
CP
(g kg−1)
2018/19Y = 105.76 + 3.89 X1 +3.89 X2 − 29.84 X3 + 4.83 X32 + 1.75 X4 − 3.66 X1X3 − 3.67 X2X3 − 1.39 X3X4.0.931.42
2019/20Y = 107.01 + 3.44 X12 +2.91 X2 + 4.57 X22 − 24.91X3 + 8.36 X32 + 1.80 X4 + 5.30 X42.0.951.91
NDF
(g kg−1)
2018/19Y = 413.91 + 3.13 X12 + 6.11 X2 + 37.98 X3 + 12.65 X32 + 12.52 X2X3 + 3.22 X2X4.0.971.21
2019/20Y = 485.21 + 2.83 X1 + 5.79X12 − 5.21X22 + 40.89X3 + 4.99X4.0.941.05
ADF
(g kg−1)
2018/19Y = 183.68 + 5.43X12 + 5.94 X2 +29.17 X3 + 11.55 X32 + 10.61 X2X3.0.944.42
2019/20Y = 228.73 + 4.28X1 + 2.40 X2 − 3.08X22 + 32.02X3 − 2.23 X32.0.952.04
ADL
(g kg−1)
2018/19Y = 27.29 + 2.47 X12 + 0.80 X22 + 11.84 X3 + 5.55 X32 + 0.92 X4 + 2.22 X2X4.0.957.41
2019/20Y = 45.65 + 10.32 X3.0.925.33
NFC
(g kg−1)
2018/19Y = 303.52 − 4.58 X1 − 5.25 X2 + 4.62 X3 + 1.58 X32 − 4.28X4.0.641.18
2019/20Y = 272.52 + 3.01X22 + 5.02X3 + 6.94X32.0.531.97
DOM
(g kg−1)
2018/19Y = 553.87 − 77.50 X3 − 23.53 X32.0.931.83
2019/20Y = 455.12 + 6.82X22 − 74.08X3.0.893.14
DNDF
(g kg−1)
2018/19Y = 286.25 − 40.79 X3 − 6.43 X2X4.0.893.53
2019/20Y = 265.00 + 2.74 X1 + 2.510 X12 + 2.04X2 − 39.62 X3 − 5.11 X32 + 5.87 X4 + 2.76 X42 − 3.93 X1X2 − 3.18 X1X3 − 2.31 X3X4.0.801.42
Y = predicted response, X1: Potassium fertilization, X2: Ascorbic acid, X3: Age at cutting, X4: Humic acid.
Table 5. Values of dry forage yield (DFY), crude protein (CP) and Non-fiber carbohydrates (NFC), as affected by the levels of PF, AA, AC and HA and their interactions in 2018/19 and 2019/20.
TreatmentsDFY (t ha−1)CP (g kg−1)NFC (g kg−1)
2018/192019/202018/192019/202018/192019/20
Central points
C1–C84.353.28105.75107.01303.52272.15
Star points
S14.573.0192.10112.00305.79277.45
S24.453.2294.24114.50308.12272.56
S34.573.1990.50115.00309.37269.11
S44.453.2496.42120.50304.96274.32
S52.942.30173.15177.20293.23257.68
S65.504.2255.9688.64329.76292.09
S74.133.1596.50117.62301.45273.82
S84.203.2398.00123.70306.80267.03
Factorial points
F113.632.54132.23152.24301.21258.20
F2HA3.302.65132.30159.10308.31258.95
F3AC5.003.8880.7194.17317.58281.74
F4HA*AC5.053.9083.59102.31325.28275.98
F5AA3.382.72143.23160.90309.95259.32
F6AA*HA3.472.84146.50166.00300.11261.83
F7AA*AC5.313.7084.55107.37321.62278.91
F8AA*AC*HA5.183.7584.81107.60313.06280.01
F9PF3.392.76142.75150.10302.99265.37
F10PF*HA3.702.83148.78154.70298.70258.18
F11PF*AC5.183.6384.78107.82323.57277.38
F12PF*AC*HA5.433.9486.50109.90320.82280.04
F13PF*AA3.442.78157.60161.60305.40266.92
F14PF*AA*HA3.692.80169.97165.60294.12258.32
F15PF*AA*AC5.433.7887.03110.10314.19285.10
F16PF*AA*AC*HA5.183.8590.60110.14326.61285.69
C1–C8: average of 8 central points. S1–S8: star points.
Table 6. Values of neutral detergent fiber (NDF), acid detergent fiber (ADF) and acid detergent lignin (ADL) as affected by levels of PF, AA, AC and HA and their interactions in 2018/19 and 2019/20.
TreatmentsNDF (g kg−1)ADF (g kg−1)ADL (g kg−1)
2018/192019/202018/192019/202018/192019/20
Central points
C1–C8413.65485.21183.68228.7327.2945.65
Star points
S1422.11445.55200.70220.9134.9841.91
S2422.64456.27201.20223.6633.5440.34
S3404.08451.24182.21210.0026.0544.17
S4407.28455.18180.29209.2629.1640.01
S5388.62410.12162.86157.0024.1722.43
S6532.28555.25288.00269.0069.0060.97
S7417.88497.23187.73230.9729.9546.32
S8412.70490.94189.16226.9924.4541.01
Factorial points
F11400.56435.89180.95183.0327.8332.01
F2HA393.39443.95176.85185.7924.4731.76
F3AC450.71516.09213.79251.1653.5054.59
F4HA*AC451.13534.71217.12260.7651.3155.38
F5AA391.82445.45177.30194.3926.5431.89
F6AA*HA393.39432.84178.82183.8727.1334.41
F7AA*AC481.83542.72243.10264.5449.8757.77
F8AA*AC*HA497.13520.39245.52256.9354.4556.66
F9PF397.13446.53179.10195.6626.4132.43
F10PF*HA396.19437.12179.45197.1425.6737.50
F11PF*AC456.65538.8224.68270.9457.2955.86
F12PF*AC*HA440.68532.06200.74255.1052.1154.34
F13PF*AA382.00458.18175.83207.9225.4138.15
F14PF*AA*HA390.00449.78172.72209.0925.5039.34
F15PF*AA*AC493.78523.20262.47270.4555.1156.49
F16PF*AA*AC*HA496.79532.87263.45271.5852.0357.17
C1–C8: average of 8 central points, S1–S8: from 1 to 8 star points.
Table 7. Values of degraded organic matter (DOM) and degraded neutral detergent fiber (DNDF), as affected by PF, AA, AC and HA levels and their interactions in 2018/19 and 2019/20.
TreatmentsDOM
(g kg−1)
DNDF
(g kg−1)
2018/192019/202018/192019/20
Central points
C1–C8553.87455.12286.25265.00
Star points
S1545.00467.00273.00260.00
S2563.00455.00278.00271.00
S3558.00470.00297.00254.00
S4549.00483.00288.00256.00
S5675.00650.00390.00365.00
S6267.00228.00165.00105.00
S7574.00464.00286.00265.00
S8542.00445.00283.00268.00
Factorial points
F11583.00536.00300.00280.00
F2HA562.00525.00311.00284.00
F3AC430.00405.00211.00230.00
F4HA*AC450.00419.00254.00247.00
F5AA584.00508.00310.00288.00
F6AA*HA591.00531.00304.00311.00
F7AA*AC465.00395.00253.00239.00
F8AA*AC*HA474.00417.00230.00257.00
F9PF587.00528.00301.00294.00
F10PF*HA594.00519.00312.00320.00
F11PF*AC430.00392.00236.00238.00
F12PF*AC*HA451.00419.00257.00243.00
F13PF*AA577.00522.00311.00282.00
F14PF*AA*HA582.00531.00316.00315.00
F15PF*AA*AC454.00416.00244.00240.00
F16PF*AA*AC*HA462.00403.00251.00249.00
C1–C8: average of 8 central points. S1–S8: star points.
Table 8. The regression equation describing the relationship between 100-grain weight (100 GW), number of spikes m−2(NSM−2), plant height (PH) and grain yield (GY) and the investigated factors in 2018/19 and 2019/20.
CharacteristicSeasonsEquationR2C.V%
100 GW
(g)
18/19Y = 3.37 + 0.22 X21 + 0.14 X22 − 0.81 X3 − 0.18 X23 + 0.13 X24.0.836.42
19/20Y = 3.62 − 0.08 X1 + 0.09 X21 + 0.12 X2 − 0.08 X22 − 0.56 X3 − 0.27 X23 + 0.08 X4 − 0.11 X2X3.0.684.18
NSM−218/19Y = 84.75 + 6.27 X22 − 34.50 X3 + 8.27 X24 − 10.25 X2X3,0.8911.25
19/20Y = 72.37 +3.50 X1+ 6.78 X22 − 28.25 X3 +3.75 X4 + 6.78 X24 − 6.75 X2X3,0.897.97
PH
(cm)
18/19Y = 86.87 − 22.86 X3 − 7.77 X23 + 2.59 X4 − 3.38 X2X3.0.921.41
19/20Y = 76.42 − 20.97 X3 − 7.05 X23 + 4.71 X4 + 1.57 X24 − 1.14 X2X3.0.942.27
GY
(t ha−1)
18/19Y = 0.76 − 0.02 X1 + 0.04 X21 − 0.01 X22 − 0.26 X3 − 0.05 X23 − 0.03 X4 + 0.02 X24 + 0.06 X1X4 + 0.02 X2X4 + 0.01 X3X4.0.932.59
19/20Y = 0.57 − 0.02 X1 + 0.05 X21 − 0.03 X2 + 0.09 X22 − 0.15 X3 − 0.03 X23 − 0.04 X4 + 0.06 X24 + 0.03X1X4 + 0.09 X2X4 + 0.02 X3X40.751.40
X1: Potassium fertilization, X2: Ascorbic acid, X3: Age at cutting, X4: Humic acid.
Table 9. Values of 100-grain weight, number of spikes m−2, grain yield and plant height, as affected by the levels of PF, AA, AC and HA and their interactions in 2018/19 and 2019/20.
Treatments100 GW (g)NSM−2GY (t ha−1)PH (cm)
2018/192019/202018/192019/202018/192019/202018/192019/20
Central points
C1–C83.373.6284.7572.3750.760.5783.4976.42
Star points
S14.443.9472.0080.001.120.8176.6669.30
S23.843.62100.0088.000.750.6897.0074.40
S33.652.9896.0092.000.740.8271.0076.50
S43.943.17120.00116.000.670.7693.3390.20
S55.004.59172.00155.001.090.78109.3398.70
S60.000.000.000.000.000.000.000.00
S73.633.54104.0096.000.830.7581.3380.50
S83.923.70128.00112.000.840.7692.3387.30
Factorial points
F113.923.42112.0096.001.211.3189.3368.50
F2HA4.064.00124.00103.001.721.73113.00110.00
F3AC3.013.1072.0067.000.740.6165.3354.20
F4HA*AC3.943.8796.0073.000.440.6771.0060.40
F5AA4.504.23132.00112.001.441.5296.3380.60
F6AA*HA4.774.49164.00124.001.020.86100.3081.90
F7AA*AC3.032.8148.0036.000.570.5740.3040.00
F8AA*AC*HA2.842.9464.0040.000.470.5855.0057.00
F9PF4.204.23148.00110.001.501.3396.0088.00
F10PF*HA4.683.45104.00112.001.160.78101.0091.30
F11PF*AC2.982.8680.0071.000.460.7556.0043.40
F12PF*AC*HA3.112.9880.0080.000.510.4369.0056.00
F13PF*AA4.443.76120.00100.001.170.83100.6693.00
F14PF*AA*HA4.443.79152.00112.001.021.01102.66102.60
F15PF*AA*AC3.173.5860.0064.000.450.8148.2045.50
F16PF*AA*AC*HA3.273.8972.0070.000.530.7164.4453.30
C1–C8: average of 8 central points. S1–S8: star points.
Publisher’s Note: MDPI stays neutral with regard to jurisdictional claims in published maps and institutional affiliations.

