
Sustainability Assessment of Greenhouse Pepper Production Scenarios in Southeastern Spain


Department of Bioeconomy, Water and Environment, Murcian Institute for Agricultural and Environmental Research and Development (IMIDA), 30150 Murcia, Spain
*
Author to whom correspondence should be addressed.
Agronomy 2022, 12(6), 1254; https://0-doi-org.brum.beds.ac.uk/10.3390/agronomy12061254
Submission received: 28 April 2022
/
Revised: 23 May 2022
/
Accepted: 23 May 2022
/
Published: 24 May 2022
Abstract
:Life cycle costing (LCC), combined with life cycle assessment (LCA), is a useful tool not only to assess the sustainability of a specific production system, but also to assess possible scenarios. Greenhouse pepper cultivation in Campo de Cartagena (Murcia, Spain) has evolved over the last three decades towards a production system that is increasingly respectful of the environment and in line with the demands of European markets. However, it has to deal with changing circumstances that affect production and environmental costs: specifically, the substitution of chemical disinfection of the soil by plants resistant to nematodes, and a significant increase in the use of desalinated seawater for irrigation. The results of this work, combining LCC and LCA, show that it is a sustainable system with high productivity, the costs associated with the inputs are relatively low, it has great socioeconomic importance, and the environmental impacts are low in relation to the greenhouse production of peppers or tomatoes in other areas, particularly if seeds of resistant varieties are available. In addition, it is a robust system capable of adapting to the changes it faces in the short and medium term, while maintaining its sustainability.
1. Introduction
The most important pepper-producing area in Europe is located in the southeast of Spain, in the provinces of Almeria, Murcia, and Alicante. The peppers are exported mainly to Europe; in order of importance, Germany, France, the United Kingdom, the Netherlands, and Italy account for 75% of the exports. In the 2020–2021 campaign, 891,600 t of peppers were exported with a value of 1340 million euros [1], this being a historical record in both volume and value. Among the Spanish regions, Murcia is the second-largest producer after Almeria, and here, cultivation is concentrated in the Campo de Cartagena zone, where around 94% of the cultivated area in Murcia (1248 ha) is found; the output is marketed mainly through fruit and vegetable companies and auctions within the organization Proexport [2].
Campo de Cartagena, like the rest of southeast Spain, has a semi-arid climate with low rainfall (generally less than 300 mm per year), moderate temperatures in winter, and hot, dry summers. It is located in the Segura River basin, which is naturally deficient in water, but since 1979, it has been supplied by, among other sources, water from the Tagus-Segura transfer, which is one of the largest inter-basin infrastructures in the south of Europe (292 km) [3]. This supply of water for irrigation led to a spectacular development of high-yield agriculture, producing high-value fruits and vegetables, most of which are exported to the EU. Therefore, it plays an important role in the economy of the basin in terms of production and employment [3].
One of the most significant crops in Campo de Cartagena is the greenhouse pepper. It is a highly technical and productive crop, with high yields [2]. Over the years it has evolved towards more environmentally friendly production according to the demand of European markets. As winter temperatures here are moderate, the system does not consume energy for heating as in other areas, with the associated economic and environmental costs that this entails [4,5,6,7,8,9]. High-frequency fertigation allows the efficient and productive use of water, with a consumption of around 8750 m3 ha−1 and productivities of around 13.7 kg m−3 [2]. Since the beginning of the 21st century, biological pest control has been incorporated [10], which together with good agricultural practices has allowed the minimization of the use of pesticides, and also higher economic returns [11]. Moreover, soil disinfection through biosolarization, to eliminate pathogens, has led to a decrease in aggressive chemical treatments [12].
Currently, pest control in pepper greenhouses in Campo de Cartagena is mainly carried out with biological agents [11]. The main problem of the crop has always been the high incidence of diseases transmitted by insects, especially Franklinella occidentalis-TSWV (tomato spotted wilt virus) [10], whose incidence was minimized with the use of native Orius spp., first in an experimental greenhouse of the IMIDA [13] and later in commercial greenhouses [14,15]. In addition, the insertion of mesh in the lateral ventilation openings of greenhouses and the elimination of diseased plants when the first symptoms are barely visible proved to be very useful practices to reduce the incidence of TSWV [16,17,18]. This led to a very significant reduction in the incidence of TSWV in greenhouses, such that the incidence in 2002 and 2003 was 1.20% and 0.87%, respectively [10]. Other biological agents were also developed for the control of other crop pests; for example, Amblyseius swirskii provides control of the white fly (Bemisia tabaci), as well as supporting the control of F. occidentalis [19]. In short, the implementation of biological control at the beginning of the 2000s, together with good agricultural practices [20], has contributed to the minimization of the use of phytosanitary treatments, which has led to cleaner production in accordance with market demand, while also bringing economic benefits to the sector [11].
Another important aspect in the evolution of greenhouse pepper cultivation in Campo de Cartagena has been the disinfection of the soil. Repeated cultivation in the same soil, and especially in the greenhouse, produces a significant growth of fungi (Phytophtora spp., mainly P. capsici and P. parasitica) and nematodes (Meloidogyne incognita), which are the main soil pathogens in greenhouse crops in SE Spain [21], causing significant yield losses [22]. In addition, fatigue phenomena linked to pepper monoculture occur that necessitate soil disinfection [23]. From 1985 to 2005, soils were disinfected with methyl bromide, sealing the soil with polyethylene plastic, but its use was banned due to its dangerous effects on the environment and human health, being completely discontinued in 2007.
As a non-chemical alternative, the biosolarization technique began to be applied [24]. This technique basically consists of the application of organic amendments followed by a hydrothermal disinfestation process that takes place when the moist soil is covered with a transparent plastic film. Different studies have shown that the application of biosolarization in pepper cultivation provides adequate control of soil pathogens in regions with hot climates [12,25,26,27,28]. However, biosolarization by itself does not completely solve the problem; it is highly effective and long lasting for Phytophtora spp. [26], but not so much for M. incognita [29,30]. For this reason, the technique used in recent years, in most pepper greenhouses, is the alternation of biosolarization one year, with a chemical treatment, specifically 1,3-dichloropropene + chloropicrin, the following year [25,28,29,31,32]. However, to obtain a definitive solution, and to eliminate chemical treatments, research is being conducted on the use of genetic resistance to control M. incognita by grafting pepper on resistant rootstocks, together with the breeding of commercial varieties with resistance. However, the introduction of resistance into commercial varieties is laborious and complex, although the results that are being obtained are very promising [33] and may even lead to an increase in the productive yields of the plants.
The practice of incorporating the crushed remains of the crop into the soil, once the cycle has finished, has been included in the environmental actions within the scope of the Common Agricultural Policy of the European Union for a number of years. Specifically, Action 7.5, regarding the use of remains generated on the farm as green manure in greenhouse horticultural crops, is applied through the National Rural Development Plan for this crop [34]. The advantages (increase in organic matter, improvement of soil structure, microbial activity for humidification) of the incorporation of crop remains have been described in some crops including greenhouse pepper [35,36].
However, the sustainability of greenhouse pepper cultivation in Campo de Cartagena is subject to the availability of water, despite the high efficiency and productivity of fertigation. The Segura River basin is one of the areas with the highest water stress in the Mediterranean basin [3]; the average annual water deficit amounts to about 400 Mm3 [37]. In addition, currently, the Tagus-Segura transfer can barely transfer 60% of the water flow approved by the Segura Hydrographic Confederation [37] due to the decrease in the amount of water stored in the reservoirs at the head of the Tagus River basin. This decrease in the water supply to Campo de Cartagena is expected to be more pronounced in the future as the effects of climate change increase in the Tagus River basin [3,38]. To counteract the limitations of the water supply from the Tagus-Segura transfer, the Spanish government has promoted the desalination of seawater to supply water for urban uses and irrigated agriculture [39]. The intention is to reduce the water transfer for irrigation and increase the use of desalinated water. However, desalination has high energy costs that obviously affect agricultural production costs and have environmental implications [3]. Thus, in the current situation, it is necessary to evaluate the sustainability of greenhouse pepper production in Campo de Cartagena, identifying the “hot spots” and how these may evolve and what alternatives may be economically and environmentally viable. In this sense, the combined use of life cycle assessment (LCA) and life cycle costing (LCC) has been shown to be a very useful tool, both in agricultural production [40,41,42,43] and in aquaculture [44]. However, the results of LCA can be variable in terms of their quality due to numerous factors [45], which are ultimately related to the interpretation of how to apply it in each case as well as the rigor of the data that are used. However, different scientific works have analyzed the weaknesses and strengths of LCA, based on the review of numerous published studies, in order to provide recommendations that improve the quality and efficacy of the procedure so that robust results and conclusions can be obtained. These studies may be aimed at very specific activities [8] or may have a more general nature [45].
The objectives of this study were, firstly, to establish a greenhouse pepper cultivation model in Campo de Cartagena; secondly, to analyze the model economically and environmentally through LCC and LCA, identifying the “hot spots” of the production system; and thirdly, to evaluate the repercussions of the foreseeable future increase in desalinated seawater use in the irrigation mix, as well as the possible control of M. incognita in pepper by means of grafts on resistant rootstocks and by means of resistant commercial seed.
2. Materials and Methods
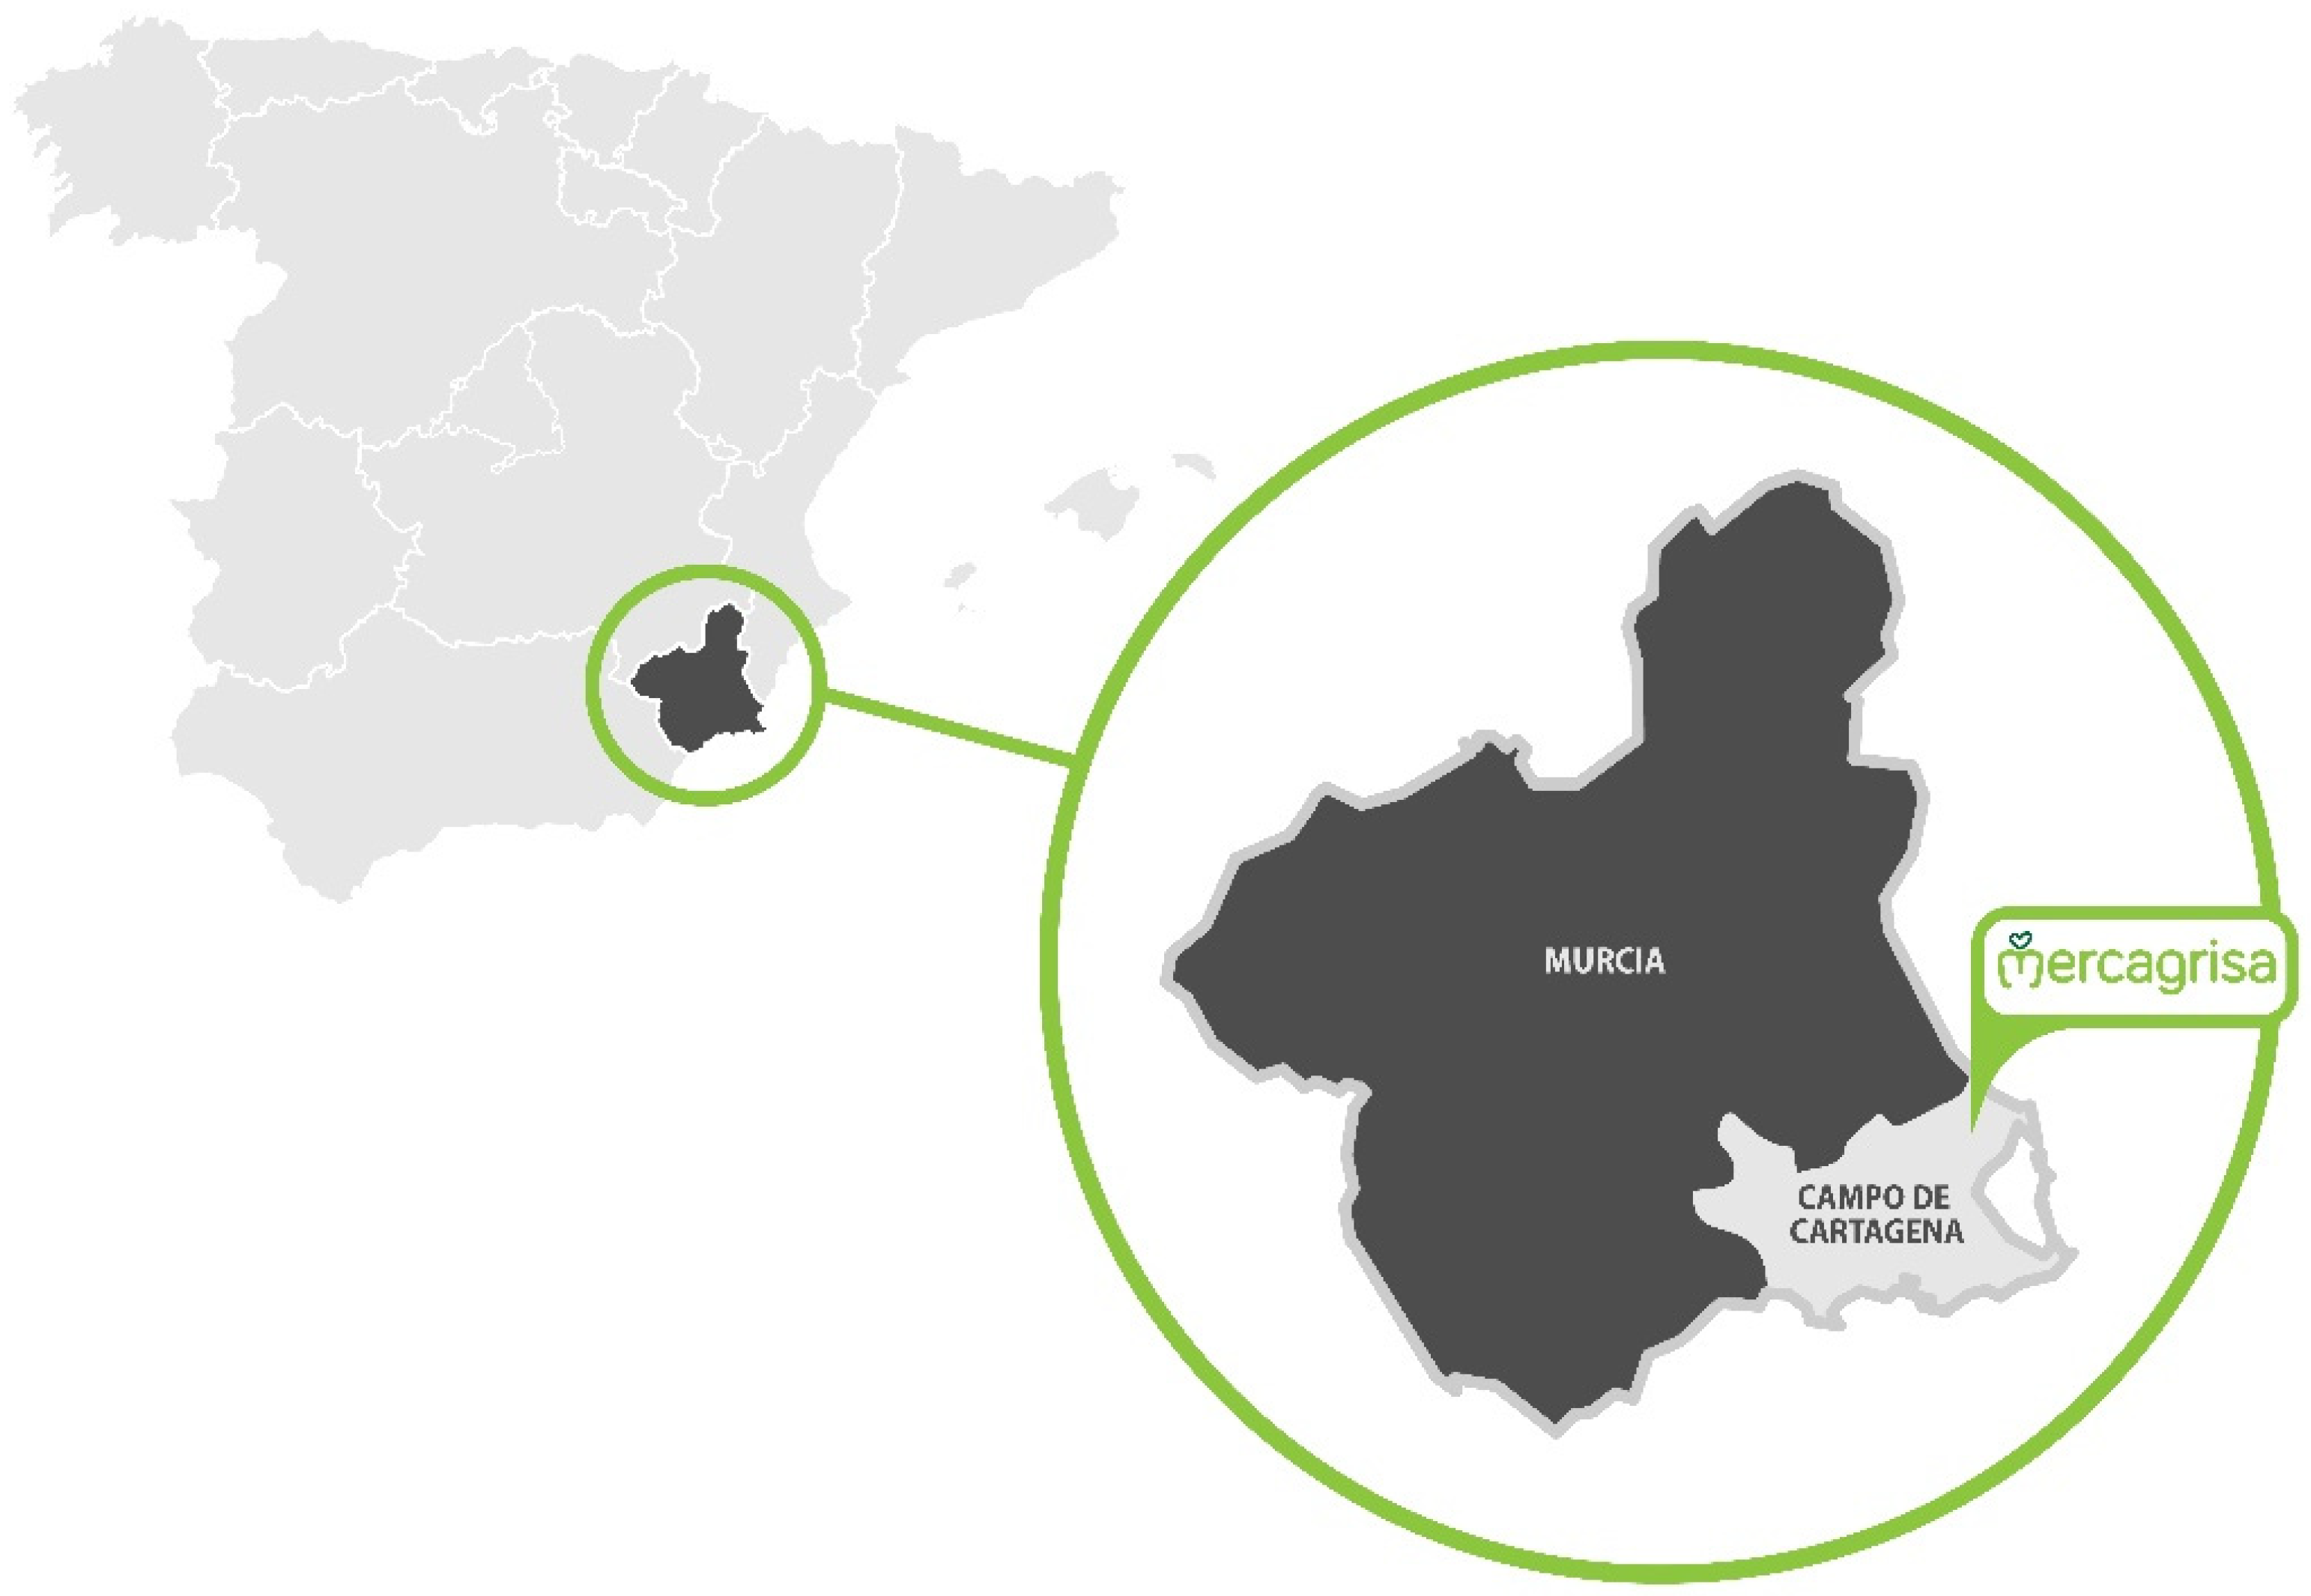
For the evaluation of the sustainability of greenhouse pepper cultivation in intensive conventional systems, a model farm was first defined, based on the information provided by MERCAGRISA, an important company located in the Campo de Cartagena area (Figure 1), which for years has been cultivating more than 250 hectares of land and marketing the output. Secondly: (i) a productive description of the system was carried out with the corresponding structure of costs and income being established, to permit an analysis through economic indicators; (ii) some indicators of the social repercussion of the activity were also evaluated; (iii) the LCA was developed; and finally (iv) a sensitivity analysis was carried out, evaluating different scenarios in relation to the current process (2020–2021).
2.1. Description of Case Study: Greenhouse Pepper Cultivation
Campo de Cartagena (Murcia, SE Spain) has a Mediterranean climate, with scarce and irregular rainfall typical of semi-arid areas. Over the last 20 years (2001–2021), the average annual precipitation and evapotranspiration have been 286 mm and 1275 mm, respectively. The average annual temperature is 18 °C; winters are mild, with an average minimum temperature of 5.4 °C, and the summers are hot, with an average maximum temperature of 29 °C (data extracted from [46]). The soil is clay loam, poor in organic matter (2–3%) [3], and has 1.0–1.5 g kg−1 total N, 10.0–15.8 g kg−1 organic C, a C/N ratio of 10.0–10.5, and a pH of 7.5–7.8 [25,26,27,33]. The water for irrigation in the study area has different origins that vary according to the availability of each of them at a particular time. However, it can be accepted that, in the current scenario, it has the following composition: 19.8% surface, 23.4% groundwater, 7.6% reclaimed, 32.2% Tagus-Segura transfer, and 17.0% desalinated seawater [3].
Based on the information provided by MERCAGRISA, an intensive pepper cropping system, within a vine-type greenhouse of 1 ha with localized drip irrigation, was dimensioned. California-type pepper is the main crop, being grown for export. The plants are cultivated 0.4 m apart in rows that are 1 m apart (25,000 plants ha−1), and each is pruned to 2–3 branches; there is one dripper (2 dm3 h−1) per plant. The general characteristics of the pepper crops grown in SE Spain are described in García García [2], and are shown in Table 1.
2.1.1. Investment and Fixed Assets
The farm has a vine-type greenhouse made of galvanized steel with two slopes, with openings and automation for ventilation. It is covered externally with 800-gauge low-density polyethylene (LDPE) plastic; the ventilation holes are covered with “anti-thrips” plastic mesh to prevent the entry of insects, especially Franklinella occidentalis, which are potential vectors of TSWV. The irrigation installation consists of an irrigation head with a flow rate of 25 m3 h−1, as well as an LDPE pipe with integrated self-compensating drippers (2 dm3 h−1) that are 40 cm apart (1 dripper/plant). Also included is a 60 m2 warehouse for the irrigation head and storage of supplies, as well as a regulating reservoir with sufficient capacity to supply the crop in the month of maximum requirements.
2.1.2. Production Process and Means of Production
A description of the processes was made in relation to the costs, which were grouped so that the economic analysis (LCC) was analogous to the environmental analysis (LCA). In this way, the processes and means of production in an annual cycle were considered to be:
- Crop removal. The plastic elements (double chamber plastic and the plastic threads for guiding and trellising the plants) are removed manually; subsequently, the crop is incorporated into the soil by means of two tractor tasks (one crusher pass and one rotavator pass). It is a recently introduced practice, but already very common, which aims to incorporate the plant remains of the crop to increase the organic matter of the soil and the advantages that derive from this.
- Soil disinfection. At present, soil disinfection is carried out through two processes that alternate, with one used the first year and the other the following year: biosolarization and soil fumigation (chemical disinfection). The latter is still authorized, but will be banned shortly. In biosolarization, sheep/goat manure (15 t ha−1) is added, deep irrigation (to a depth of 30 cm) is applied, and the soil is covered with 200-gauge LDPE plastic. The treatment period is 4–5 weeks in summer. The cost of the manure was accounted for as the cost of fertilization. The chemical disinfection, which is only allowed once every two years, involves a chloropicrin + 1,3-dichloropropene treatment applied through the drip irrigation network, once the soil has been covered with 120-gauge TIF-type (LDPE) plastic. It is also necessary to irrigate several times (but less deeply) to maintain the soil moisture.
- Preparation and planting. Once the disinfection has been carried out, tilling and leveling of the land are carried out. Planting is manual, with plants from a nursery.
- Plastic in the double chamber and plastic for staking. This includes a 200-gauge LDPE sheet placed manually in the double chamber. The plants are supported with stakes and plastic threads (PVC) that are arranged both horizontally and vertically; formation pruning leaves 2–3 branches.
- Manual work. Staking, guiding, pruning, and whitewashing of plastic roofing.
- Machinery. This includes the use of machinery and implements in various activities: phytosanitary treatments, herbicide treatments, and transport of the harvest to the warehouse.
- Phytosanitary products and herbicides. Phytosanitary products and herbicides applied in the production cycle. Currently, the application of integrated control and biological control and the implementation of good agricultural practices have managed to significantly reduce the phytosanitary treatments [2,20].
- Biological control: Placement of chromotropic traps, release of beneficial insects (Eretmocerus eremicus, Aphidius ervi, Orius laevigatus) and mites (Amblyseius californicus, Amblyseius swirskii, Phytoseiulus persimilis), and placement of pheromones [2].
- Organic and inorganic fertilization. Organic matter provided as part of the soil disinfection (sheep–goat manure), as well as an inorganic fertilization program using fertigation.
- Maintenance. Annual maintenance of the infrastructure (tool shed, head, and irrigation network), calculated as a percentage of the value of the investment (1.5%).
- Irrigation water. This includes the water consumed by the irrigation schedule of the production cycle. The water is supplied by the Irrigation Users Community (Campo de Cartagena), and is a mixture of waters of various origins: surface, underground, reused, Tagus-Segura transfer, and desalinated seawater [3].
- Electric power. The power consumed by the irrigation head in the distribution of water and inorganic fertilizers (fertigation).
- Harvest. The harvest is staggered over time, depending on the degree of maturity of the peppers, and is completely manual. It includes the harvest in the greenhouse, loading, and delivery to the warehouse.
- Fixed staff. It is usual that this refers to the owner of the farm, whose tasks are linked to phytosanitary support and control, irrigation and fertilization, harvesting support, personnel management, and general administration.
2.2. Life Cycle Costing (LCC): Socioeconomic Analysis
We established the productive structure of the costs and income of greenhouse pepper cultivation using indicators for this evaluation [2,47]. The methodology followed was in line with the so-called LCC [40,42,43,44]. Both the costs and income are those of one year of production. To carry out this analysis, the operating costs were identified, and then grouped and classified into fixed costs and variable costs.
- Fixed costs. The fixed costs were calculated as the annual amortization cost, applying the straight-line method.
- Variable costs. These include the cost of the inputs, services, and activities required in the course of a production cycle. They were calculated taking as reference the cost of the inputs used and the activities carried out in the production process. For each of the costs, both fixed and variable, the corresponding opportunity cost was calculated; that is, the alternative use of the money in a bank savings account without risk was taken into account.
- Income. The income was calculated based on the average price of the product, after subtracting non-commercial waste (8%). The price was established based on the average prices, weighted by quality, received by the commercial companies during the previous three years.
To analyze the viability/profitability conditions of the activity, the Net Margin (NM) was calculated first, as the difference between the Total Income and the Total Costs (TC), from the following formula:
NM = Income − (Fixed Costs + Variable Costs + Opportunity costs)
From the NM, the following socioeconomic indicators were calculated [48]:
- NM/TC (%): this shows the global profitability of the activity.
- Viability threshold (€ kg−1): this indicates the minimum sale price of the product at origin for the activity to be viable.
- Dead point (kg ha−1): this indicates the minimum production, for the average market sale price, for the activity to be viable.
- Employment/ha (AWU ha−1): this is an indicator of the direct employment generation linked to the rural environment. The Agricultural Work Unit (AWU) corresponds to the work carried out by a person employed on a full-time basis at a farm (MAPA, 2019).
- Contribution to the regional economy (CRE) (€ ha−1): this equals the gross unit income. This indicator has a social nature, since it measures the gross economic productivity of agricultural activity, which has repercussions for the environment and for the rural population.
2.3. Life Cycle Analysis
The life cycle analysis (LCA), according to the ISO 14040 standard [49], consists of four interrelated phases: (i) definition of the objective and scope; (ii) life cycle inventory analysis; (iii) impact analysis; and (iv) interpretation of the results.
2.3.1. Objective and Scope
The objective is the environmental evaluation of greenhouse pepper production in Campo de Cartagena, as well as the provision of data that enhance our scientific knowledge of the potential impacts associated with it. The scope of the LCA, therefore, focuses solely on the cultivation phase, and the functional unit (FU) to which the environmental impacts refer is 1 t of peppers harvested in the field. Since the system only produces peppers, it is treated as a monofunctional system, so environmental load allocation procedures are not applied.
The following components of the system were taken into account:
- Infrastructure. This corresponds to the investment and fixed assets of the LCC. It includes the greenhouse—in terms of the metal structure, concrete footings, wires, covering plastic, and “anti-thrips” mesh—and the elements related to fertigation: the reservoir, irrigation head, and irrigation network.
- Plastic supplies. Those plastic materials that are renewed in each production cycle: double chamber plastic and plastic threads for guiding and staking the plants.
- Machinery. The fuel consumed by the agricultural machinery in the different tasks, as well as its emissions.
- Fertigation. The electrical energy consumed by the water booster pumps in the fertigation.
- Water. The electrical energy associated with the supply of the water mix to the agricultural holding, according to the different origins.
- Fertilizers. The production of inorganic and organic fertilizers, their transport and packaging, and emissions into the air due to the application of nitrogenous compounds to the soil.
- Biosolarization (soil disinfection). The plastic used to cover the ground in disinfection by biosolarization. This is carried out every other year, with disinfection by fumigation being carried out in the other years.
- Soil fumigation (soil disinfection). The chemicals for the disinfection and the plastic to cover the ground. This is performed every other year, with disinfection by biosolarization being carried out in the other years.
- Phytosanitary products. The production of the phytosanitary products and herbicides, and their transport and packaging.
- Waste treatment. The treatment of infrastructure and supply elements (metals, concrete, and plastics) at the end of their useful life. Currently, both plastic and metal items are recycled at a rate of at least 95%.
The production of the plants in the nursery was not taken into account because the specific information was not available. However, for tomato cultivation, it has been estimated that the production of seedlings represents less than 4% of the total for the impact categories evaluated [50]. It should be noted that the seedlings are grown in a greenhouse at a density of at least 200 seedlings m−2, and in the subsequent cultivation, the density of the plants is 2.5 per m2. In addition, it was not possible to consider the components related to biological control because the specific information was not available. To carry out the LCA, SimaPro 9.1 software developed by Pré Sustainability was used [51]. The background data (energy, fuel, materials, products, etc.) were obtained from the Ecoinvent 3.6 database that is available in the aforementioned software.
2.3.2. Life Cycle Inventory
The primary data were obtained from the information provided by MERCAGRISA and are shown in Table 2. For the background data (raw materials, energy, fuel, materials, products, and transportation), the processes of the Ecoinvent 3.6 database were used. The electrical energy values associated with the supply of the different sources of water for irrigation were taken from Martin-Górriz et al. [3]. The specific energy values used (kWh per m3 of water) were: 0.06 surface, 0.90 groundwater, 0.78 reclaimed, 1.21 Tagus-Segura transfer, and 4.32 desalinated seawater. The emissions arising from the use of diesel by agricultural machinery were estimated based on the emission factors established by EEA [52]. The emissions into the atmosphere due to the application of nitrogenous fertilizers were estimated according to the following sources: NH3 and NO2, according to EEA [52]; N2O, direct as well as indirect (due to NH3 volatilization), according to Nemecek et al. [53]. Nitrate leaching was considered null, since fertigation is used with low daily amounts of water.
2.3.3. Life Cycle Impact Assessment and Interpretation
For the characterization of the potential environmental impacts, the CML-IA Baseline 4.7 (August 2016) midpoint methodology (available in SimaPro) was used. This has been applied widely in LCA for agri-food products [7,8,40,44,54,55,56,57]. The impact categories used were: abiotic depletion (AD), abiotic depletion fossil fuels (ADFF), global warming (GW), ozone layer depletion (OLD), human toxicity (HT), fresh water aquatic ecotoxicity (FWAE), marine aquatic ecotoxicity (MAE), terrestrial ecotoxicity (TE), photochemical oxidation (PO), acidification (A), and eutrophication (E).
The characterized results for the environmental impacts were normalized to obtain neutral global units. Normalization, which is an optional process in LCA [49], estimates the degree of contribution of each impact category to the environmental problem in a given region. Therefore, it shows the extent to which the value of an impact category indicator is relatively high or relatively low in relation to a reference; EU25 normalization factors were used [51].
To interpret the results, a contribution analysis was carried out to calculate the percentage contribution of each of the different components of the scenario to each impact category. In addition, the overall contribution was used, which shows how each component of the system contributes to all of the impacts [44,55,58]. Sensitivity analysis was also used.
2.4. Sensitivity Analysis
The different scenarios proposed (Table 3) were related to the following three components of the crop:
- Water mix for irrigation. The limitations in the availability of water from the Tagus-Segura transfer imply that this resource will disappear, to be completely replaced by desalinated seawater [3]. Of the current mix, it is assumed that surface water (19.8%), groundwater (23.4%), and reused water (7.6%) will remain constant over time, and that desalinated seawater will change from 17.0% of the current mix to 49.2%, completely replacing the water from the Tagus-Segura transfer. This substitution will have repercussions for the production costs due to the higher price of water (€ m−3), as well as leading to a higher environmental cost derived from greater energy expenditure (kWh). The specific effect of this factor is evaluated in S2 and S4 (Table 3).
- Soil fumigants. Currently, chemical disinfection is part of a two-year cycle, alternating with biosolarization. However, the former procedure will be banned shortly by the European authorities, so biosolarization will have to be applied annually. However, biosolarization used alone does not completely solve the problems of pathogenic nematodes [29,30], with productivity falling by 20%, as indicated by companies in the sector (MERCAGRISA, among others). The economic and environmental repercussions of this are evaluated in scenarios S3 and S4.
- Plant material resistant to nematodes. In relation to the problems associated with the loss of productivity due to the elimination of chemical disinfection, there are two lines of ongoing research that are aimed at solving the problem: (a) to obtain seedlings from certified seeds resistant to nematodes, which is under development in the private sector; and (b) the use of resistant rootstocks—this is being developed in both public and private research. Conclusive data are scarce in relation to these two lines. However, according to the companies and the researchers, line (a) supposes a decrease in production of 10% and a slightly higher seedling price than at present (Table 3); the impact with respect to the current scenario (S1) is evaluated in S5. Line (b) does not imply a loss of productivity, but would have a significant impact on the seedling price (Table 3); the impact in relation to S1 is evaluated in S6.
The results of the analysis of the different scenarios were evaluated with the relative difference (RD) of the distinct economic and environmental indices, expressed as:
RD (%) = 100 × (Sn–S1)/Sn, Sn being each of the defined scenarios.
3. Results and Discussion
3.1. Economic Analysis of Current Scenario
Greenhouse pepper cultivation in SE Spain is intensive, with high productivity. The cost accounting (Table 4) indicates a system with relatively high fixed assets (12.86%) compared to other intensive outdoor horticultural crops, such as potatoes, watermelon, or melon, for which the fixed assets comprise around 4–5% of the total cost. It is a value that is slightly higher than, but similar to, that of greenhouse tomatoes (11.21%) [2]; in both cases, the value is fundamentally due to the structure and plastic cover of the greenhouse. The most important cost is that related to manual labor (staking, training, pruning, liming, harvesting, and permanent labor), which accounts for €24,030, or 41% of the total cost of production (TC). Pepper production is an activity with great relevance to the generation of employment in rural areas; as shown in Table 5, production at origin generates 1.78 AWU ha−1. The annual preparation and planting represent 18.47% of the TC, and the seed and nursery costs stand out within this section at €8975 over 10,817 (Table 4). Another important contribution is that of soil disinfection, which currently, and based on the alternation of chemical disinfection and biosolarization, represents 6.4% of the TC.
This production system requires very few inputs in relation to its productivity. This is verified by the fact that items such as fertilizers or phytosanitary products (including herbicides) make a very low contribution to the cost: 1.77% and 1.79% in the accounting structure, respectively (Table 4). The advance of biological control in this crop has been a resounding success, reducing chemical phytosanitary treatments in a very notable way [10,11].
The economic indicators used show an activity with high profitability (NM/TC = 43.3%), with an average cost or viability threshold of €0.53 per commercial kilogram—that is, after the elimination of waste (Table 5). The break-even point is 77,055 kg ha−1, a value that is easy to achieve with the existing technology and cultivation experience. In relation to the social indicators, as already mentioned, this is an activity with a very high AWU ha−1, one of the highest of all the fruit and vegetable production activities in Spain [2]. The contribution to the regional economy, expressed in gross income per hectare, amounts to €83,904 ha−1. These two socioeconomic indicators give an idea of the importance of this crop to the environment and the rural population.
3.2. Life Cycle Analysis
The components of the system that contribute the most (overall contribution) to the environmental impacts (Table 6) are the electrical energy associated with the supply of water for irrigation (23.73%), the infrastructures (37.23%), and the soil fumigants (chemical disinfection) of the soil (19.61%). Global contributions between 10% and 20% correspond to fertilizers (15.71%) and plastic supplies (11.01%); soil disinfection by biosolarization, fuel for agricultural work, electricity for fertigation, and phytosanitary products make contributions of less than 10%. Waste management has a negative value insofar as nearly all (95%) of the different plastic and metallic materials are recycled.
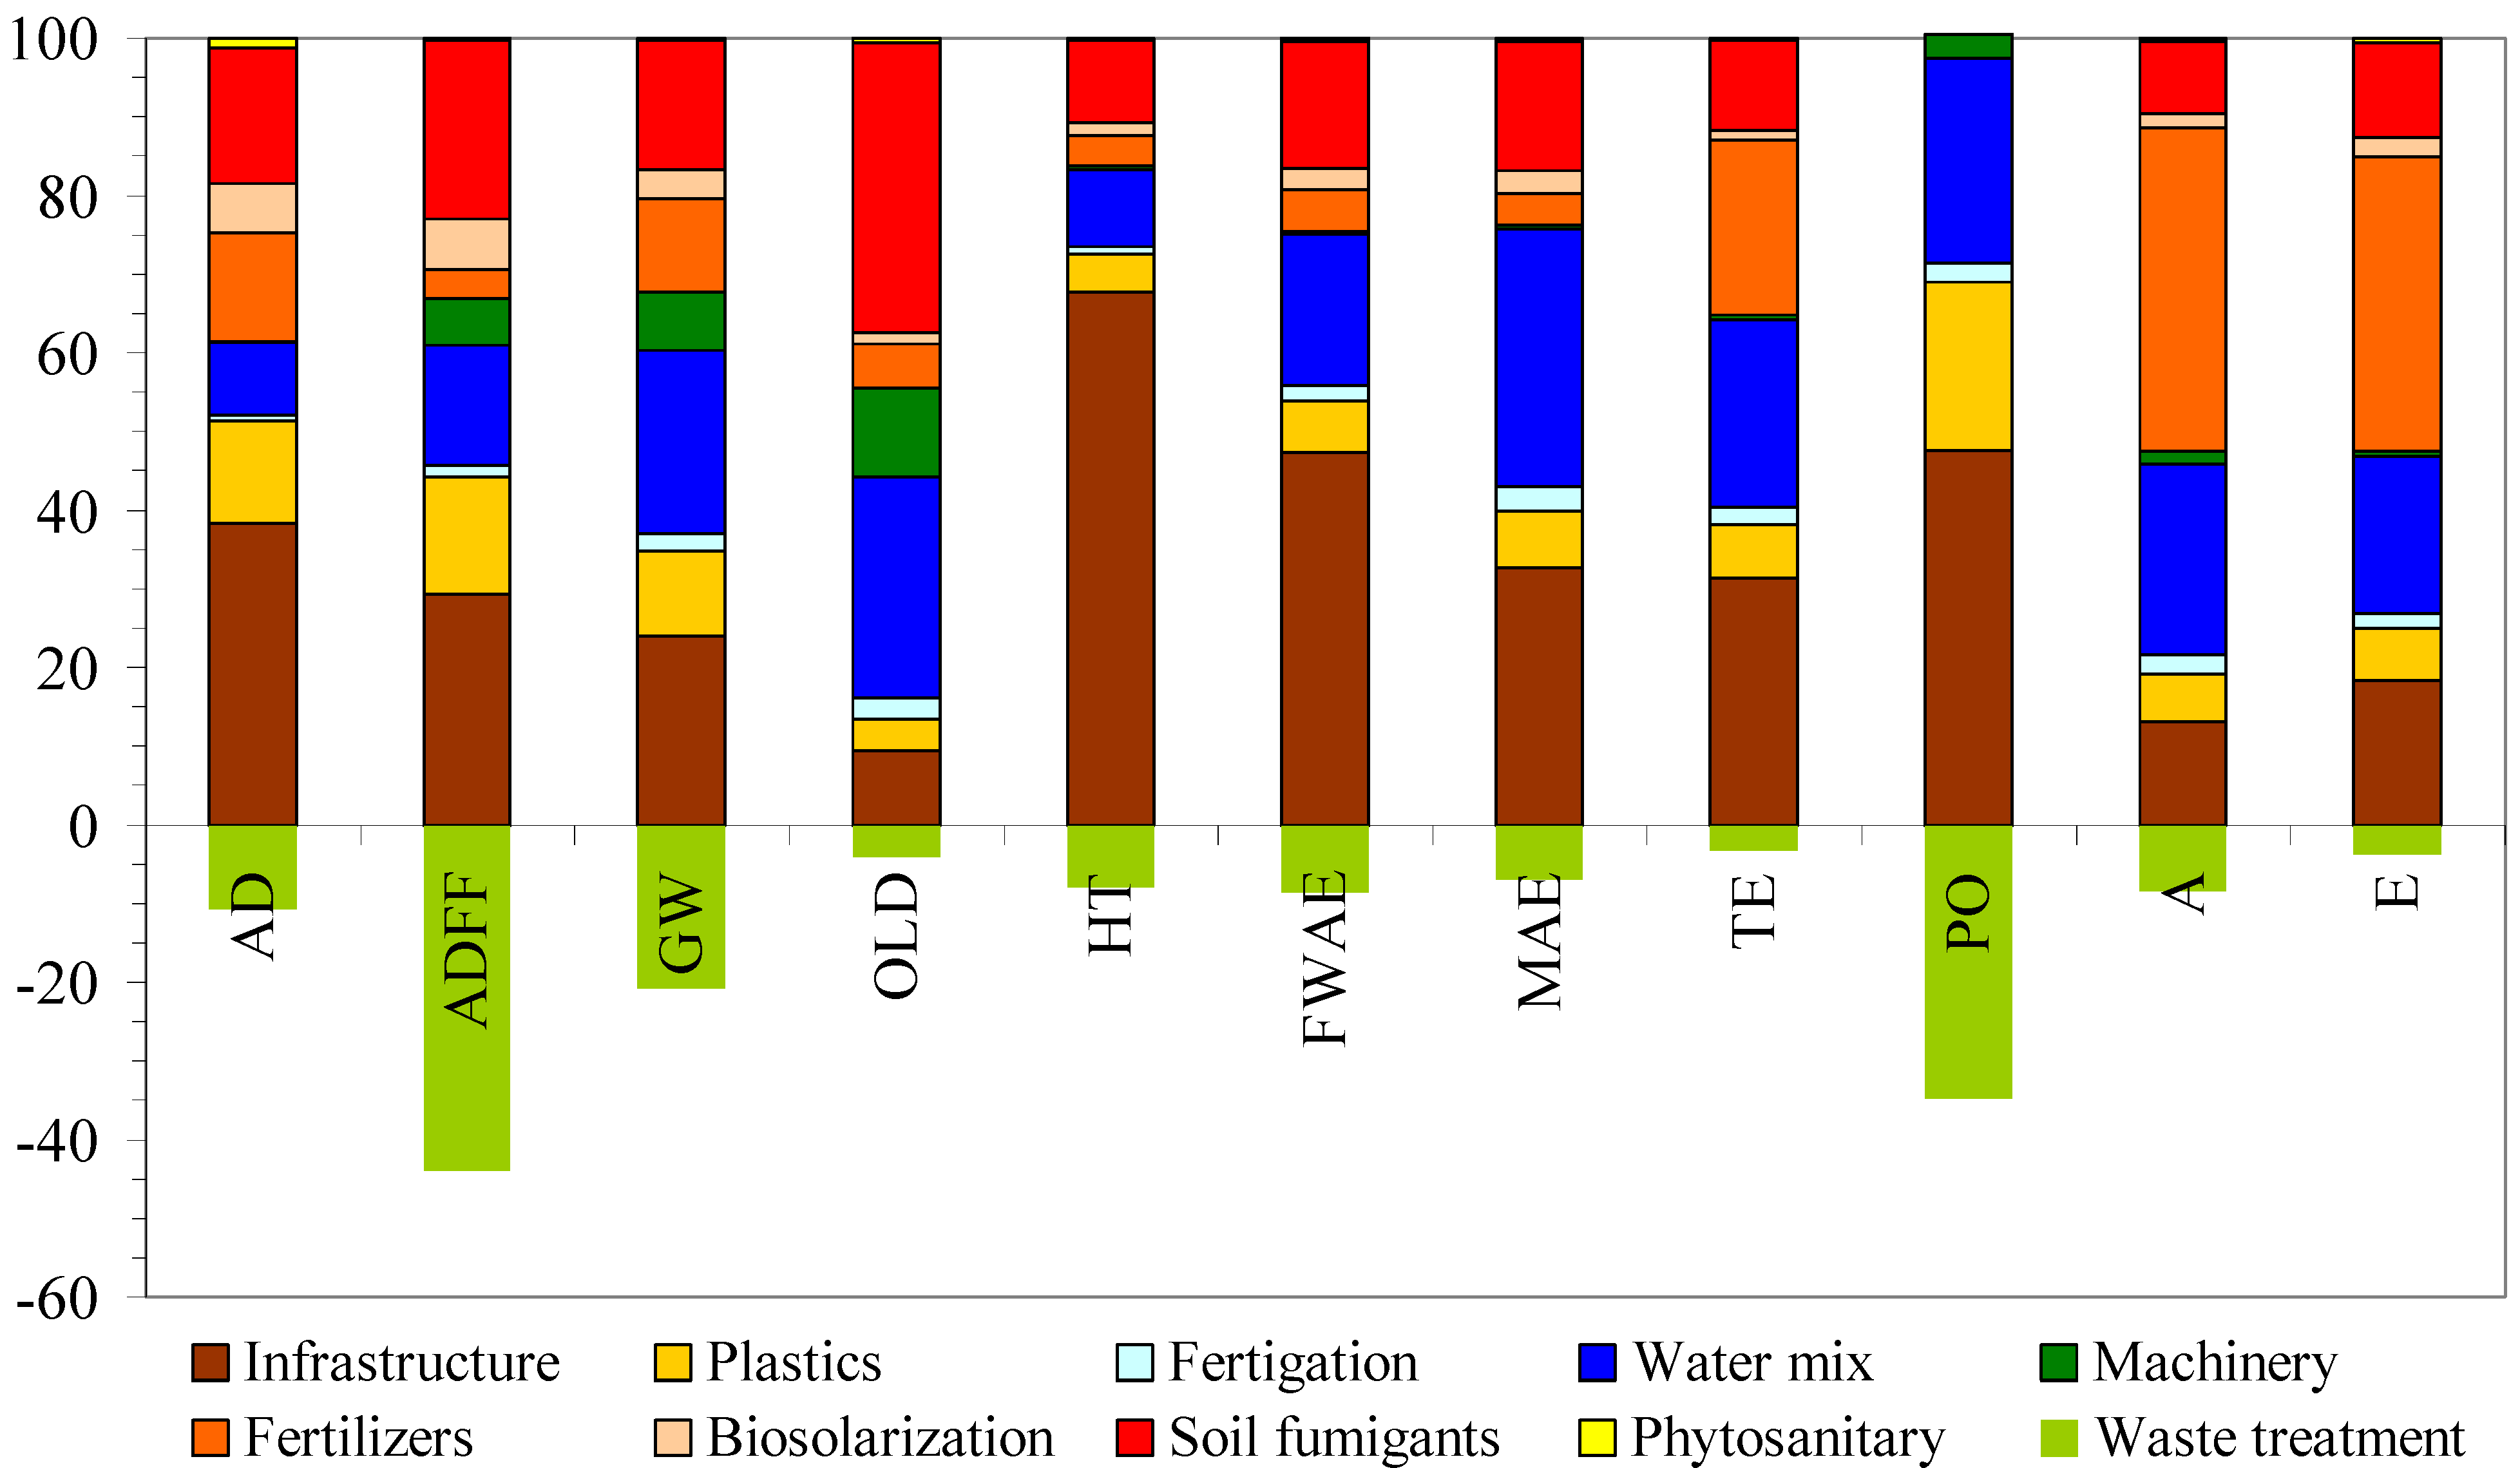
The contributions of the system components to the different impact categories are shown in Table 6. Among them, the following can be highlighted:
- AD. The component that contributes the most is the infrastructure, due to the metallic structure of the greenhouse, as well as the different polyethylene components. The contribution of the manufacture of chemical products for the chemical disinfection of the soil, as well as that of the fertilizers and plastic inputs, is also significant (Figure 2).
- ADFF. The plastic elements of the infrastructure and supplies contribute prominently, as do the chemical products for soil disinfection and the electrical energy of the water supply for irrigation. The recycling of plastic materials diminishes this impact in a notable way, since the supply of raw materials is avoided.
- GW. The electricity associated with the supply of water for irrigation is the component that contributes the most, but infrastructure, chemical disinfection, and fertilizers are also significant. For the latter, both the production of fertilizers and the emissions into the atmosphere following the application of nitrogenous fertilizers are relevant.
- OLD. In this impact category, the electrical energy associated with the mix of water used for irrigation and the manufacture of chemical products for soil disinfection stand out.
- HT. This impact is fundamentally due to the infrastructure, especially the metallic structure of the greenhouse.
- FWAE. Here, the metallic structure of the greenhouse is mainly responsible for the contribution of the infrastructure. Also noteworthy is the electricity required for the irrigation water mix and the chemical products.
- MAE. The electricity associated with the supply of the mix of water for irrigation is the component of the system that contributes the most, followed by the infrastructure (the metallic structure and polyethylene of the greenhouse) and the chemical disinfection of the soil.
- TE. In addition to the infrastructure and the electricity required for the water mix, the contribution of fertilizers, especially organic ones, is also significant.
- PO. The materials that contribute the most are the plastics used in infrastructures and supplies. The electricity associated with the water mix also contributes significantly. The repercussion of the waste treatment in terms of the recycling of plastic materials should also be highlighted in this impact category.
- A. The fertilizers represent the component that contributes the most, with emissions derived from the application of organic fertilizers, especially NH3, playing an important role.
- E. Fertilizers also play a relevant role in this impact category, especially the emissions due to the application of organic fertilizers.
The values obtained from the different potential environmental impacts in relation to 1 t of peppers produced in a greenhouse in Campo de Cartagena are much lower than those found by Naderi et al. [7] for the cultivation of bell pepper in a heated greenhouse, mainly due to differences in energy consumption. In this system, the consumption of electrical energy is 761 kWh t−1 and of natural gas 3866 m3 t−1. As a consequence, the production of 1 t of peppers supposes a GW value of 5200 kg CO2-eq, FWAE is 178 kg 1,4 DB-eq, and MAE 646,190 kg 1,4 DB-eq. In our system, without energy expenditure for heating, the electricity consumption, which is reduced to that of the fertigation and water mix supply, is 117 kWh t−1, and GW is 122 kg CO2-eq, FWAE is 81 kg 1,4 DB-eq, and MAE 173,500 kg 1,4 DB-eq.
For tomato cultivation in France, it has been reported that the environmental impacts of heated greenhouses are 4.5 times greater than those of unheated ones [4]. In the Mediterranean area, with warm climates, some of the GW values that have been reported for unheated greenhouse tomato cultivation are 120 kg CO2-eq t−1 [59] and 250 kg CO2-eq t−1 [60] in Spain, and 215 kg CO2-eq t−1 [50] in Morocco, which are values very close to those recorded in this study. In colder climates, production in heated greenhouses leads to higher GW values, such as 3300 kg CO2-eq t−1 in Sweden [61] or 1000 and 1700 kg CO2-eq t−1 in South Korea [9].
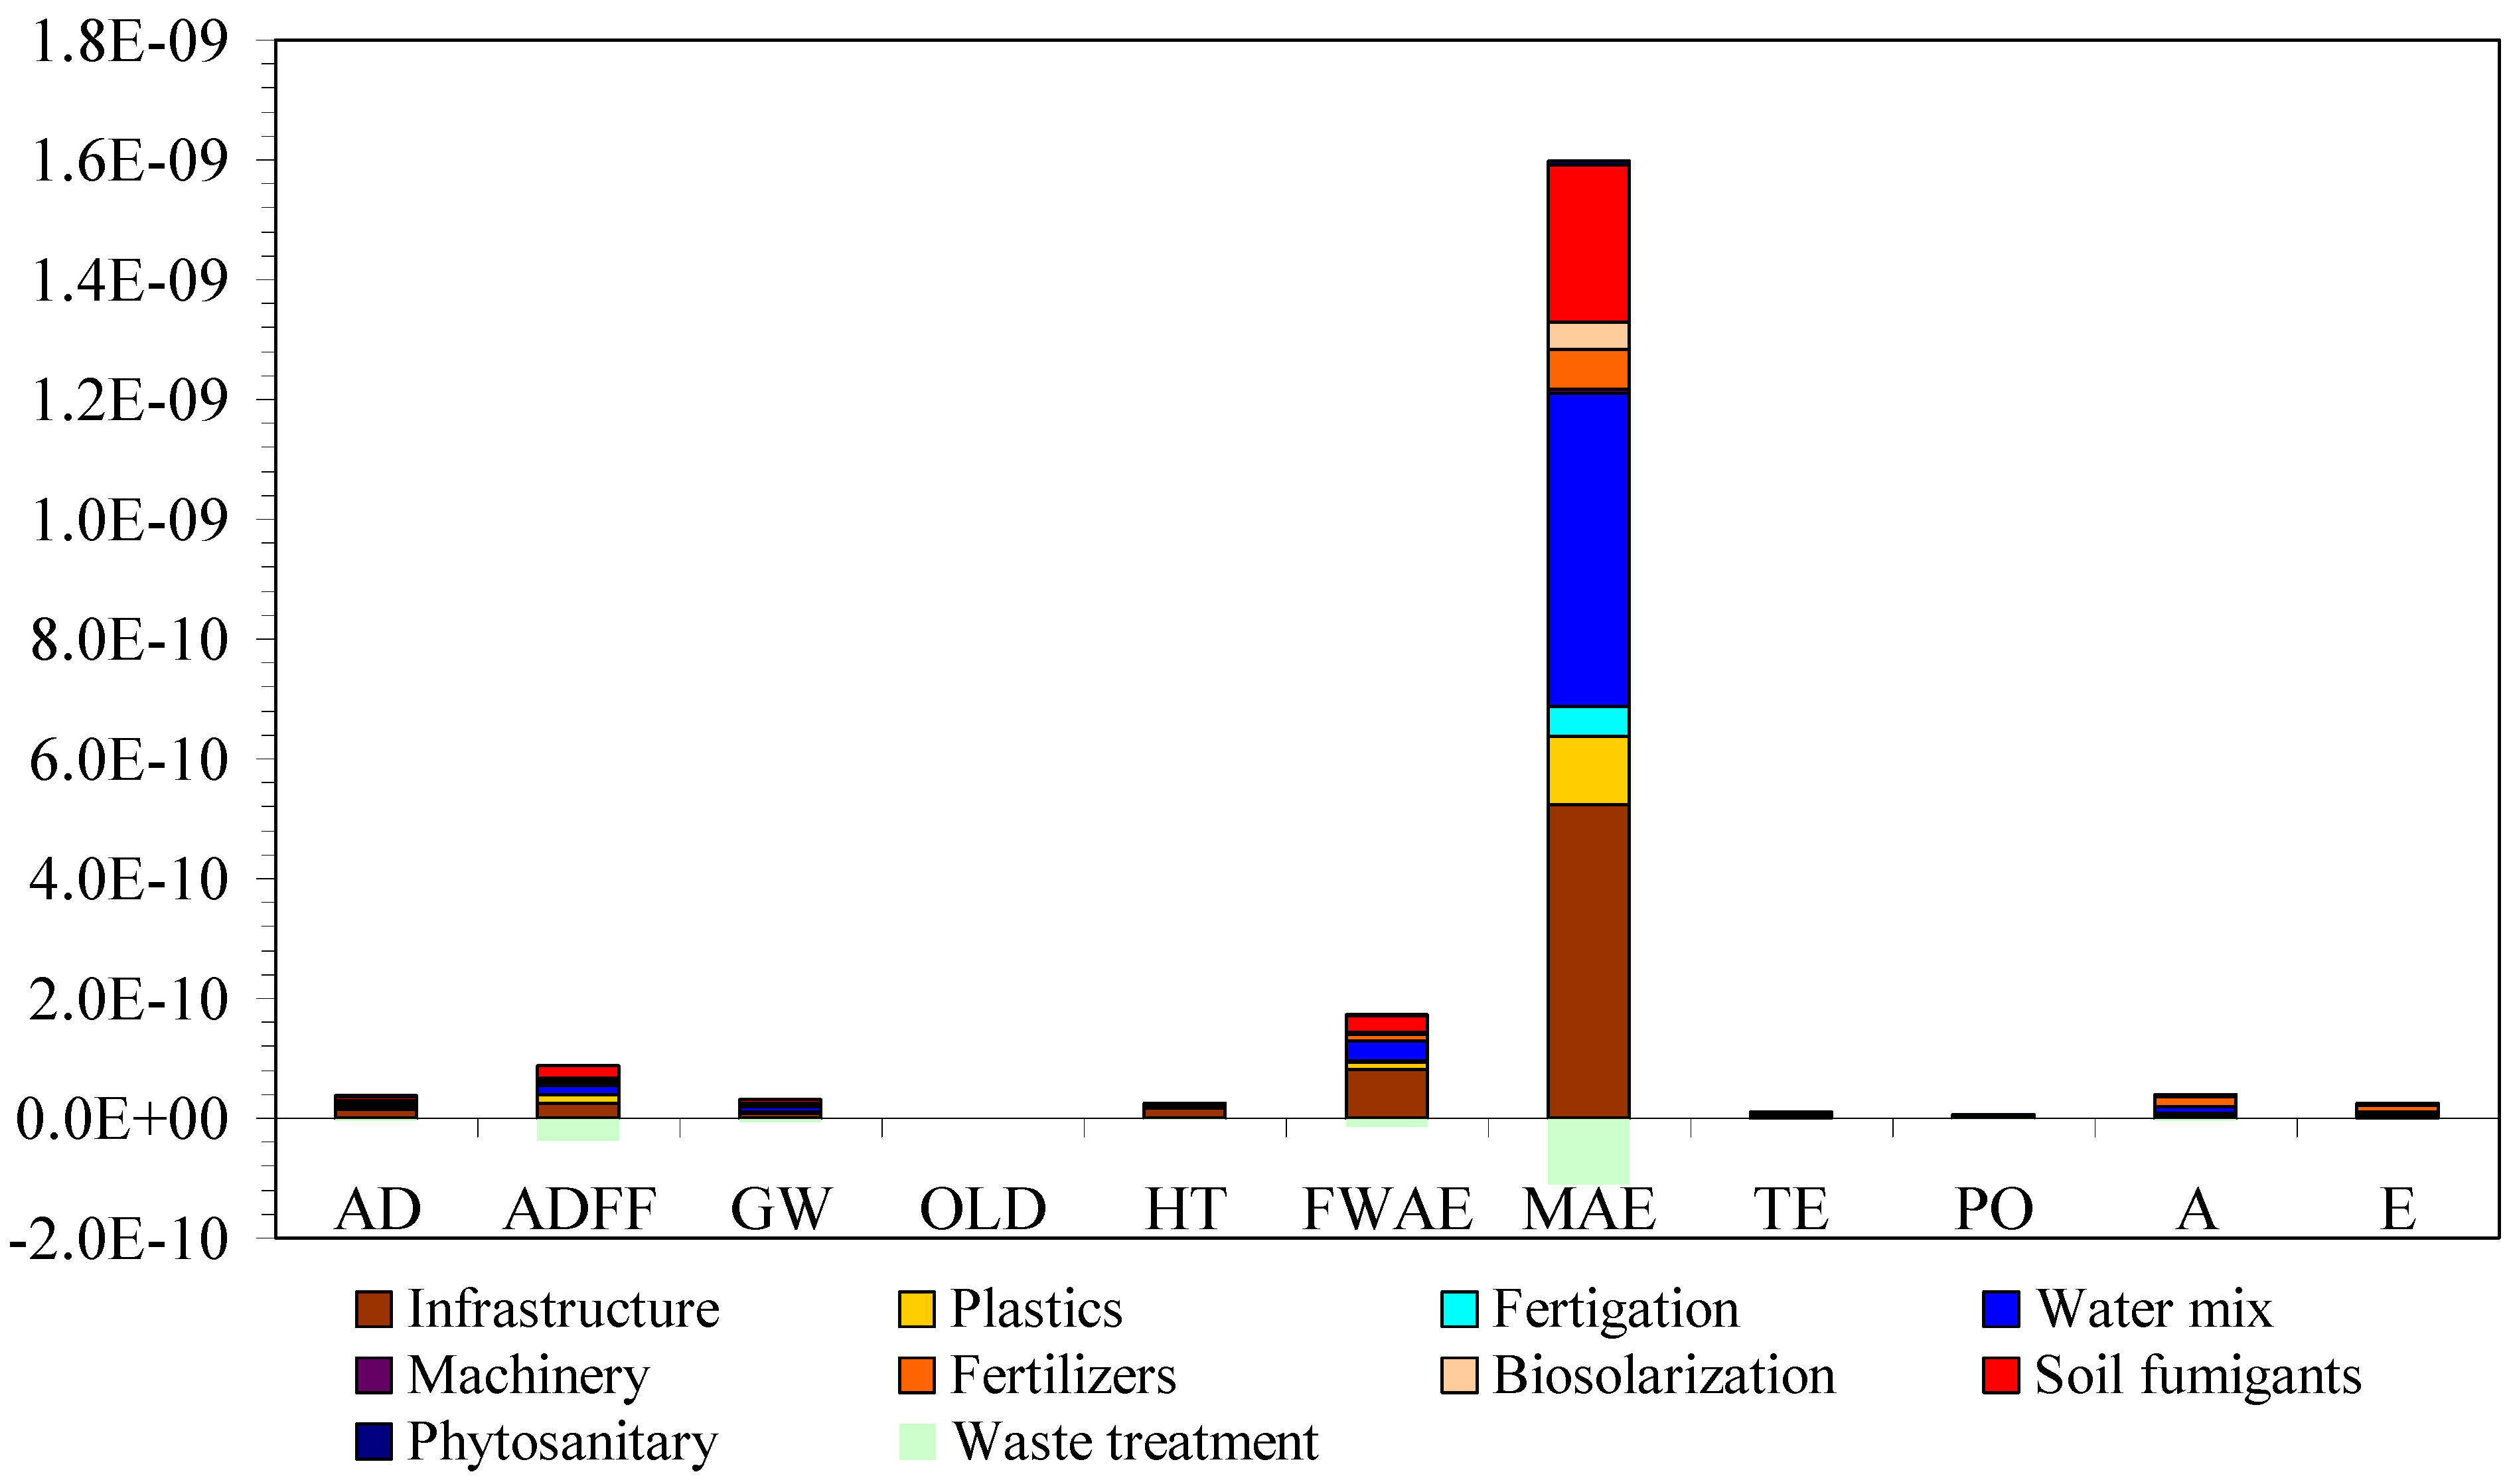
The normalization of the potential environmental impacts shows that the most relevant category is MAE (Figure 3), which represents 80%, while FWAE represents 7.82%; AD, ADFF, GW, HT, A, and E have values between 1 and 2%; and OLD, TE, and PO have values lower than 1%. Similar results, especially regarding the outstanding values of MAE and FWAE, have been recorded in other studies of greenhouse pepper cultivation [7]. For both MAE and FWAE, the components that contribute the most are the electrical energy associated with the supply of the water mix, the infrastructure, and the chemical disinfection of the soil. These components account for 35.42%, 30.15%, and 19.58% of the MAE normalization, respectively (Table 6).
For open-air pepper cultivation, both conventional and organic, it has also been recorded that MAE and FWAE contribute significantly to the effect on the environment, although the impact category with the highest normalized value by far was E in conventional cultivation [62]. In the present study, we found that the component that contributes the most to MAE and FWAE is the electrical energy associated with the supply of water for irrigation. However, as mentioned before, the characterized values of MAE and FWAE in the present study, for an unheated greenhouse, are lower than those found by Naderi et al. [7] for a heated greenhouse; specifically, the MAE was about four times higher and the FWAE was almost three times higher with heating. This was mainly due to the energy (natural gas and electricity) used for heating [7].
3.3. Sensitivity Analysis
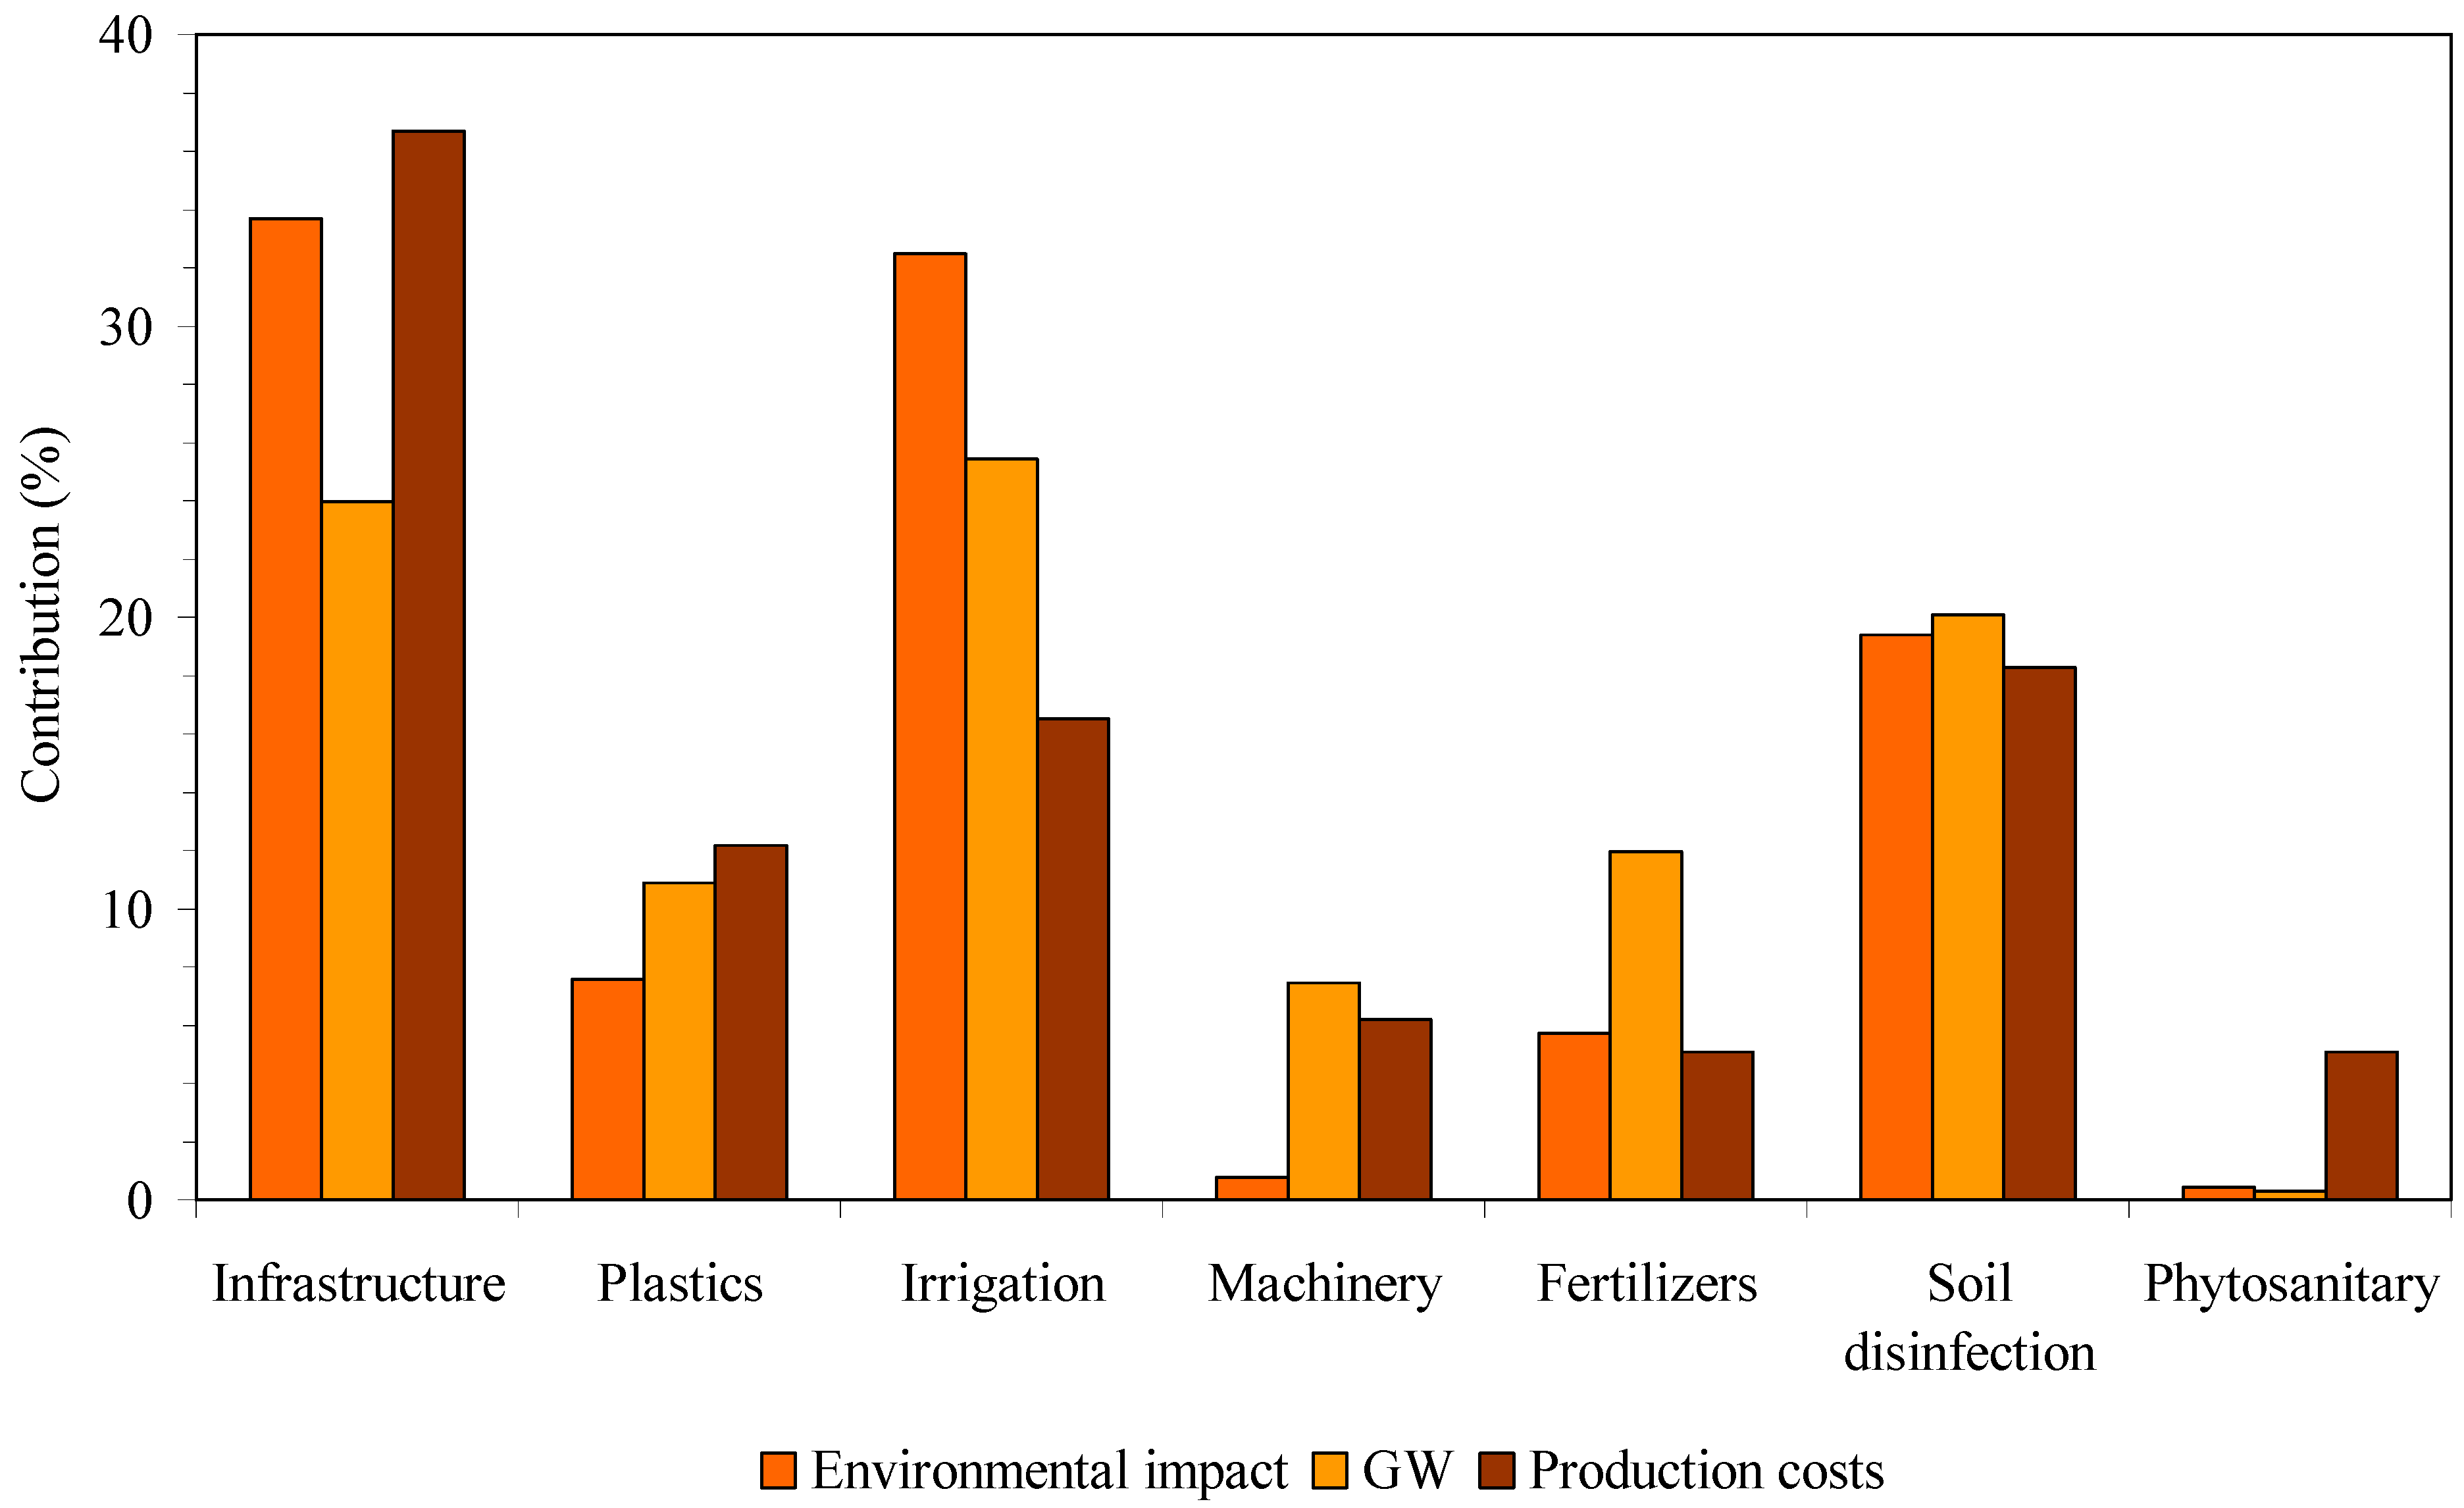
First, the components of the costs and impacts were grouped so that the economic analysis (LCC) is analogous to the environmental analysis (LCA) in Figure 3, to give a view of the costs and impacts in parallel.
The infrastructure is the component that contributes the most to the production costs, and it is also very significant in relation to the environmental impacts (Figure 4). This result coincides with what has been described in other crops for which the infrastructures are relevant, such as in intensively cultivated vineyards where the vines are grown on trellises [41]. Irrigation (the water mix and fertigation pumping) contributes more to the impacts than to the production costs, as occurs with the fertilizers and, to a lesser extent, with soil disinfection (biosolarization and chemical disinfection). In the latter, chemical disinfection is the component that contributes the most to the production costs and impacts (Table 6).
In general, fertilizers, especially the inorganic ones [7,50,62,63], tend to be a component that greatly influences the impacts, while their contribution to the production costs is usually not very relevant [2,40,41,42,43]. In contrast, the contribution of phytosanitary products to the production costs, although low, is much higher than their contribution to the impacts (Figure 4); in any case, the low contribution is the result of their limited use, since they have been partially replaced by biological control. Regarding the plastic inputs and the machinery, their contributions to the production costs and the impacts are of a similar order of magnitude.
In relation to possible future scenarios (sensitivity analysis), the cost of irrigation—that is, the sum of the water and energy used in irrigation—accounts for 5.79% of the TC. The cost of water has been rising steadily in recent years, fundamentally due to the increasing presence of desalinated water in the mix of well, transfer, surface, treated, and desalinated water typically used by the irrigation communities in SE Spain [3,64].
In the near future, the proportion of desalinated water is expected to increase, to the detriment of surface and transfer water. Thus, an increase in the cost of irrigation water is expected, in line with the trend of recent years. For this reason, we included the variable “price of water” in the sensitivity analysis (Table 3). We used the value €0.35 m−3 as the current unit price, as this is the case in most of the area where this crop is grown, and a unit value of €0.508 m−3 as an alternative value in a scenario in which the contributions of transfer water are replaced by desalinated water (S2). The NM/TC of S2 is 39.9%; that is, the profitability is lower than in S1 (43.3%). This is not a significant decrease in profitability, since this crop has a very high economic productivity of water; peppers and greenhouse tomatoes are the crops with the highest water productivity among the horticultural crops grown in SE Spain [2].
In the face of an imminent ban on the chemical disinfection of the soil, as currently practiced, biosolarization is being used. However, in recent years, technicians from companies in the sector have found that productivity drops by at least 15% when biosolarization disinfection is used exclusively. In this sense, it was shown that the productivity was higher for grafted plants on three different rootstocks than for non-grafted plants grown in soil receiving biosolarization [65]. The loss of productivity with a non-grafted plant is around 20% of the commercial yield. Faced with this decrease, which results in an important loss of income, there are two ongoing lines of research that are trying to address and solve the problem: one is the development of certified seeds resistant to nematodes, and the other is the application of grafting. In this situation, we propose four scenarios (S3, S4, S5, and S6; Table 3) once chemical treatment is prohibited definitively. Table 5 displays the possible scenarios, their variables, and the NM/TC values as an indicator of profitability. As can be seen, the most profitable alternative is S5 (biosolarization and planting with seeds resistant to nematodes), with an NM/TC of 29.8%. However, it has several drawbacks compared to the use of conventional seeds. One is that it seems to have lower productivity [66] and the technicians of the companies in the area; based on this information, we estimated a 10% decrease in gross production (Table 3). Another is the current absence of resistant varieties of Lamuyo-type peppers, destined to a greater extent for the national market (the majority of the plants grown are of the California type, destined for export). The alternatives that only involve biosolarization (S3 and S4) show a decrease in gross income that reduces profitability: to an NM/TC value of 17.5% (current water mix) or 14.7% in the most unfavorable case (without transfer water). In general terms, the alternative that involves the use of grafted plants has such a high cost that profitability drops to an NM/TC value of 3.9%, a very low figure for a crop with such a high investment and productive and commercial risk. The production process for grafted seedlings is standardized and is frequent in the cultivation of peppers and, above all, greenhouse tomatoes [2,65]. In tomato, the planting pattern results in a much lower density (10,000 plants ha−1) compared to pepper (25,000 plants ha−1) and, obviously, the cost per hectare is also much lower. The only way to reduce the costs for grafted plants would be to use rootstocks with lower seed costs. In any case, it should be considered that the increased vigor of the grafted plants makes a longer crop cycle possible, preserving the quality characteristics (size) of the fruit; that is, the greater strength of the grafted plants has a positive effect on the quantity and quality of the fruit produced.
The environmental effect of the total substitution of water from the Tagus-Segura transfer by desalinated seawater is shown in S2; there is generally a significant increase in all of the environmental impacts compared to the current scenario, S1 (Table 7). The RD is highest for MAE (21.14%) and lowest for AD (6.50%). This is a result of the higher consumption of electrical energy in the desalination process. This factor is external to the pepper production system, so it cannot be acted upon directly; it will only be possible to diminish the impact with an increase in clean energies in the national electricity mix. However, it is also true that the use of desalinated seawater implies a reduction in the use of fresh water, which is a scarce resource.
The effect of not using chemical disinfection, relative to the current situation (S1), is shown in S6, where seedlings grafted on rootstocks are used. All of the impacts clearly decrease, the effect being greatest in OLD (−58.39%) and smallest in PO (−8.06%). With the use of the resistant seed (S5), which removes the need for chemical disinfection, while there is a decrease in production (Table 3), practically all of the impacts decrease except PO and A, although the increases relative to S1 are very small (2.77% and 2.15%, respectively; Table 7). In any case, in both S5 and S6, the greatest decrease is for OLD (−42.53% and −58.39%, respectively); fundamentally, this reflects the impact of the manufacture of the chemical products used in disinfection. There is no chemical disinfection in S3, but there is a significant decrease in production (20%) since the traditional seedlings are not resistant to nematodes. The lower production has a greater effect on the environmental impacts than does the absence of chemical disinfection, in such a way that all of the impacts increase except ADFF and OLD. In S4, the water mix incorporates the maximum amount of desalinated water, and as a result, the environmental impacts have their highest values. Summing up, the current environmental scenario would have an intermediate impact, and the most unfavorable scenarios would be, from most to least, S4, S2, and S3, and the most favorable would be S6 and S5.
4. Conclusions
Greenhouse pepper cultivation in Campo de Cartagena is an intensive system with high productivity. It has great socioeconomic importance in the area in which it is located, in terms of both economic activity and job creation. In relation to the inputs, it is very productive and the costs associated with them are relatively low. The biological control of infestations in this crop means that the expenditure on phytosanitary products is relatively low. These circumstances also contribute to the low values of the environmental impacts in comparison with the production of pepper or tomato in other areas, especially in cold areas where the energy expenditure on heating is high.
The mix of water used for irrigation makes a rather small contribution to the production costs; however, it is one of the components that contributes the most to the environmental impacts due to the energy use associated with the desalination of seawater. For this reason, the foreseeable increase in the use of desalinated water, to replace the water from the Tagus-Segura transfer, will have a low impact on profitability, but will produce an increase in the environmental impacts analyzed.
Chemical soil disinfection has a significant impact on the production and environmental costs. It will be banned shortly, but biosolarization alone does not eliminate pathogen problems, so the productivity may decrease significantly. This would mean a decrease in profitability and an increase in the environmental impacts. Of the two alternatives that are being developed for plant material resistant to nematodes, environmentally, the most favorable would be resistant rootstocks, but these involve a high cost that translates into a lack of economic viability. However, resistant seeds, although they may lead to a slight decrease in production, maintain acceptable profitability and environmental costs, which is why they seem to be the optimal alternative.
Author Contributions
J.G.G. and B.G.G. conceived and designed the present study. J.G.G. collected the data from the collaborating company, made the agronomic calculations, and performed the economic analysis. B.G.G. performed the life cycle assessment. J.G.G. and B.G.G. drafted the manuscript. All authors have read and agreed to the published version of the manuscript.
Funding
This research received no external funding.
Institutional Review Board Statement
Not applicable.
Informed Consent Statement
Not applicable.
Data Availability Statement
Not applicable.
Acknowledgments
The authors are grateful to MERCAGRISA.
Conflicts of Interest
The authors declare no conflict of interest.
References
- HORTOINFO. Available online: https://Hortoinfo.Es/Precios-Por-Campana/ (accessed on 20 April 2022).
- García García, J. Estructura de Costes de las Orientaciones Productivas Agrícolas de La Región de Murcia: Horticultura al Aire Libre y Bajo Invernadero; Técnica; Consejería de Agua, Agricultura, Ganadería, Pesca y Medio Ambiente de la Región de Murcia: Murcia, Spain, 2020. [Google Scholar]
- Martin-Gorriz, B.; Martínez-Alvarez, V.; Maestre-Valero, J.F.; Gallego-Elvira, B. Influence of the Water Source on the Carbon Footprint of Irrigated Agriculture: A Regional Study in South-Eastern Spain. Agronomy 2021, 11, 351. [Google Scholar] [CrossRef]
- Boulard, T.; Raeppel, C.; Brun, R.; Lecompte, F.; Hayer, F.; Carmassi, G.; Gaillard, G. Environmental Impact of Greenhouse Tomato Production in France. Agron Sustain. Dev. 2011, 31, 757–777. [Google Scholar] [CrossRef] [Green Version]
- Dias, G.M.; Ayer, N.W.; Khosla, S.; Van Acker, R.; Young, S.B.; Whitney, S.; Hendricks, P. Life Cycle Perspectives on the Sustainability of Ontario Greenhouse Tomato Production: Benchmarking and Improvement Opportunities. J. Clean. Prod. 2017, 140, 831–839. [Google Scholar] [CrossRef]
- Hendricks, P. Life Cycle Assessment of Greenhouse Tomato (Solanum lycopersicum L.) Production in Southwestern Ontario. Master’s Thesis, The University of Buelph, Guelph, ON, Canada, 2012. [Google Scholar]
- Naderi, S.A.; Dehkordi, A.L.; Taki, M. Energy and Environmental Evaluation of Greenhouse Bell Pepper Production with Life Cycle Assessment Approach. Environ. Sustain. Indic. 2019, 3–4, 100011. [Google Scholar] [CrossRef]
- Torres Pineda, I.; Lee, Y.D.; Kim, Y.S.; Lee, S.M.; Park, K.S. Review of Inventory Data in Life Cycle Assessment Applied in Production of Fresh Tomato in Greenhouse. J. Clean. Prod. 2021, 282, 124395. [Google Scholar] [CrossRef]
- Torres Pineda, I.; Cho, J.H.; Lee, D.; Lee, S.M.; Yu, S.; Lee, Y.D. Environmental Impact of Fresh Tomato Production in an Urban Rooftop Greenhouse in a Humid Continental Climate in South Korea. Sustainability 2020, 12, 9029. [Google Scholar] [CrossRef]
- Sanchez, J.A.; Lacasa, A. A Biological Pest Control Story. Bull. IOBC-WPRS 2006, 29, 17–22. [Google Scholar]
- García García, J.; Torró Valls, F.; Sánchez Sánchez, J.A. Efecto Económico de La Implantación Del Control Biológico En Los Cultivos de Pimiento En Invernadero Del Sureste de España. Phytoma-España 2021, 327, 1–4. [Google Scholar]
- Ros, M.; García, C.; Hernández, M.T.; Lacasa, A. Effects of Biosolarization as Methyl Bromide Alternative to Meloidogyne Incognita Control on Quality of Soil under Pepper. Biol. Fertil. Soils 2008, 45, 37–44. [Google Scholar] [CrossRef]
- Sanchez, J.A.; Contreras, J.; Lacasa, A.; Lorca, M. Datos Prliminares Sobre La Utilización de Orius laevigatus (Fieber) En El Control de Frankliniella occidentalis (Pergande) En Pimiento En Invernadero. Phytoma-España 1995, 68, 32–38. [Google Scholar]
- Sanchez, J.A.; García, F.; Lacasa, A.; Gutiérrez, L.; Oncina, M.; Contreras, J.; Gómez, J. Response of the Antocorids Orius Laevigatus and Orius albidipennis and the Phytoseiid Amblyseius cucumeris for the Control of Frankliniella occidentalis in Comercial Crops of Sweet Peppers in Plastic House in Murcia (Spain). Bull. IOBC-WPRS 1997, 20, 186–195. [Google Scholar]
- Sanchez, J.A.; Lacasa, A.; Gutiérrez, L.; Contreras, J. Distribution Pattern and Binomial Sampling for Frankliniella Occidentalis and Orius Spp. in Sweet Pepper Crops. Bull. IOBC-WPRS 1997, 20, 177–185. [Google Scholar]
- Lacasa, A.; Contreras, J.; Torres, J.; González, A.; Martínez, M.C.; García, F.; Hernández, A. Utilización de Mallas En El Control de Frankliniella Occidentalis y El Virus Del Broceado Del Tomate En El Pimiento En Invernadero. Bol. San Veg. Plagas 1994, 20, 561–580. [Google Scholar]
- Sanchez, J.A.; Alcázar, A.; Lacasa, A.; Llamas, A.; Bielza, P. Integrated Pest Management Strategies in Sweet Pepper Plastic Houses in the Southeast of Spain. Bull. IOBC-WPRS 2000, 23, 21–30. [Google Scholar]
- Sanchez, J.A.; Lacasa, A.; Gutiérrez, L.; Torres, J.; González, A.; Alcázar, A. Efecto Del Arranque de Las Plantas Con Síntomas de Tomato Spotted Wilt Virus (TSWV) Sobre La Incidencia de La Enfermedad y La Producción En Cultivos de Pimiento En Invernadero. Actas de Horticultura 1999, 26, 264–270. [Google Scholar]
- Calvo, F.J.; Bolckmans, K.; Belda, J.E. Biological Control-Based IPM in Sweet Pepper Greenhouses Using Amblyseius Swirskii (Acari: Phytoseiidae). Biocontrol. Sci. Technol. 2012, 22, 1398–1416. [Google Scholar] [CrossRef]
- Monserrat Delgado, A. Recomendaciones Fitosanitarias Para Las Plantaciones de Pimiento de Invernadero; Consejería de Agricultura y Agua de la Región de Murcia: Murcia, Spain, 2012; ISBN MU-137-2012. [Google Scholar]
- Ros, C.; Guerrero, M.d.M.; Martínez, M.A.; Lacasa, A.; Bello, A. Integrated Management of Meloidogyne resistence in Sweet Pepper Grenhouse. Bull. OILB/Crops 2006, 29, 255–262. [Google Scholar]
- Rudolph, R.E.; Sams, C.; Steiner, R.; Thomas, S.H.; Walker, S.; Uchanski, M.E. Biofumigation Performance of Four Brassica Crops in a Green Chile Pepper (Capsicum annuum) Rotation System in Southern New Mexico. Hortscience 2015, 50, 247–253. [Google Scholar] [CrossRef]
- Guerrero, M.M.; Guirao, P.; Martínez, M.C.; Tello, J.; Lacasa, A. Soil Fatigue and Its Specificity towards Pepper Plants in Greenhouses. Span. J. Agric. Res. 2014, 12, 644–652. [Google Scholar] [CrossRef] [Green Version]
- Oka, Y.; Shapira, N.; Fine, P. Control of Root-Knot Nematode in Organic Farming Systems by Organic Amendments and Soil Solarization. Crop Prot. 2007, 26, 1556–1565. [Google Scholar] [CrossRef]
- Guerrero-Díaz, M.M.; Lacasa-Martínez, C.M.; Hernández-Piñera, A.; Martínez-Alarcón, V.; Lacasa-Plasencia, A. Evaluation of Repeated Biodisinfestation Using Brassica Carinata Pellets to Control Meloidogyne Incognita in Protected Pepper Crops. Span. J. Agric. Res. 2013, 11, 485. [Google Scholar] [CrossRef] [Green Version]
- Lacasa, C.M.; Martínez, V.; Hernández, A.; Ros, C.; Lacasa, A.; Guerrero, M.d.M.; del Carmen Rodriguez-Molina, M.; Serrano-Pérez, P.; Larregla, S. Survival Reduction of Phytophthora capsici Oospores and P. nicotianae Chlamydospores with Brassica Green Manures Combined with Solarization. Sci. Hortic. 2015, 197, 607–618. [Google Scholar] [CrossRef]
- Núñez-Zofío, M.; Larregla, S.; Garbisu, C.; Guerrero, M.M.; Lacasa, C.M.; Lacasa, A. Application of Sugar Beet Vinasse Followed by Solarization Reduces the Incidence of Meloidogyne incognita in Pepper Crops While Improving Soil Quality. Phytoparasitica 2013, 41, 181–191. [Google Scholar] [CrossRef]
- Ros, C.; Robertson, L.; Martínez, M.C.; Lacasa, A. Development of Virulence to Meloidogyne Incognita on Resistant Pepper Roodstocks. Span. J. Agric. Res. 2014, 12, 225–232. [Google Scholar]
- Guerrero, M.d.M.; Ros, C.; Martínez, M.A.; Bello, A.; Lacasa, A. Biosolarization vs Biofumigation plus Solarization to Control Meloidogyne incognita in Sweet Pepper. Bull. IOBC-WPRS 2006, 29, 313–318. [Google Scholar]
- Ros, C.; Martínez, C.; Sánchez, F.; Lacasa, C.M.; Guerrero, M.d.M.; Lacasa, A. Biosolarization and Grafting as a Way Mitigate the Selection of Virulent Population of Meloidogyne Incognita in Pepper. Bull. IOBC-WPRS 2011, 7, 113–116. [Google Scholar]
- Ros, C.; Lacasa, C.M.; Martínez, V.; Bielza, P.; Lacasa, A. Response of Pepper Rootstocks to Co-Infection of Meloidogyne incognita and Phytophthora spp. Eur. J. Hort. Sci. 2014, 79, 22–28. [Google Scholar]
- Talavera, M.; Sayadi, S.; Chirosa-Ríos, M.; Salmerón, T.; Flor-Peregrín, E.; Verdejo-Lucas, S. Perception of the Impact of Root-Knot Nematode-Induced Diseases in Horticultural Protected Crops of South-Eastern Spain. Nematology 2012, 14, 517–527. [Google Scholar] [CrossRef]
- Ros, C.; Martínez, V.; Sánchez-Solana, F.; López-Marín, J.; Lacasa, C.M.; Guerrero, M.d.M.; Lacasa, A. Combination of Biosolarization and Grafting to Control Meloidogyne incognita in Greenhouse Pepper Crops. Crop Prot. 2018, 113, 33–39. [Google Scholar] [CrossRef]
- MAPA. Directrices Nacionales para la Elaboración de los Pliegos de Condiciones Referentes a las Acciones Medioambientales; Ministerio de Agricultura, Pesca y Alimentación: Madrid, Spain, 2017.
- Bakht, J.; Shafi, M.; Jan, M.T.; Shah, Z. Influence of Crop Residue Management, Cropping System and N Fertilizer on Soil N and C Dynamics and Sustainable Wheat (Triticum destivum L.) Production. Soil Tillage Res. 2009, 104, 233–240. [Google Scholar] [CrossRef]
- Moreno Conejo, J. Valoración Agronómica de Restos de Pimiento: Influencia en las Propiedades del Suelo y Producción de Brócoli; Universidad Politécnica de Cartagena: Cartagena, Colombia, 2013. [Google Scholar]
- CHS. Plan Hidrológico de la Cuenca del Segura 2015–2021; CHS: Murcia, Spain, 2015. [Google Scholar]
- Pellicer-Martínez, F.; Martínez-Paz, J.M. Climate Change Effets on the Hydrology of the Headwaters of the Tagus River: Implications for the Management of the Tagus-Segura Transfer. Hydrol. Earth Syst. Sci. 2018, 22, 6473–6491. [Google Scholar] [CrossRef] [Green Version]
- Martínez-Alvarez, V.; González-Ortega, M.J.; Martin-Gorriz, B.; Soto-García, M.; Maestre-Valero, J.F. The Use of Desalinated Seawater for Crop Irrigation in the Segura River Basin (South-Eastern Spain. Desalination 2017, 364, 2–16. [Google Scholar] [CrossRef]
- Falcone, G.; De Luca, A.; Stillitano, T.; Strano, A.; Romeo, G.; Gulisano, G. Assessment of Environmental and Economic Impacts of Vine-Growing Combining Life Cycle Assessment, Life Cycle Costing and Multicriterial Analysis. Sustainability 2016, 8, 793. [Google Scholar] [CrossRef] [Green Version]
- García-Castellanos, B.; García-García, B.; García-García, J. Evaluación de la sostenibilidad de tres sistemas de cultivo de viña característicos de la Región de Murcia. ITA-Inf. Tec. Econ. Agrar 2022, 118, 137–157. [Google Scholar] [CrossRef]
- Strano, A.; De Luca, A.I.; Falcone, G.; Iofrida, N.; Stillitano, T.; Gulisano, G. Economic and Environmental Sustainability Assessment of Wine Grape Production Scenarios in Southern Italy. Agric. Sci. 2013, 4, 12–20. [Google Scholar] [CrossRef] [Green Version]
- Zhang, C.; Rosentrater, K.A. Estimating Economic and Environmental Impacts of Red-Wine-Making Processes in the USA. Fermentation 2019, 5, 77. [Google Scholar] [CrossRef] [Green Version]
- Noguera-Muñoz, F.A.; García García, B.; Ponce-Palafox, J.T.; Wicab-Gutierrez, O.; Castillo-Vargasmachuca, S.G.; García García, J. Sustainability Assessment of White Shrimp (Penaeus vannamei) Production in Super-Intensive System in the Municipality of San Blas, Nayarit, Mexico. Water 2021, 13, 304. [Google Scholar] [CrossRef]
- Nita, A.; Fineran, S.; Rozylowicz, L. Researchers’ Perspective on the Main Strengths and Weaknesses of Environmental Impact Assessment (EIA) Procedures. Environ. Impact Assess. Rev. 2022, 92, 106690. [Google Scholar] [CrossRef]
- Sistema de Información Agrario de Murcia. Available online: http://Siam.Imida.Es/Apex/f?P=101:1:8751385424600662 (accessed on 16 February 2022).
- Romero Azorín, P.; García García, J. The Productive, Economic, and Social Efficiency of Vineyards Using Combined Drought-Tolerant Rootstocks and Efficient Low Water Volume Deficit Irrigation Techniques under Mediterranean Semiarid Conditions. Sustainability 2020, 12, 1930. [Google Scholar] [CrossRef] [Green Version]
- MAPA. Resultados Técnico-Económicos de Frutales 2017; Ministerio de Agricultura, Pesca y Alimentación: Madrid, Spain, 2019.
- ISO. Environmental Management-Life Cycle Assessment: Principles and Framework. ISO 14040; ISO-International Organization for Standards: Geneva, Switzerland, 2006. [Google Scholar]
- Payen, S.; Basset-Mens, C.; Perret, S. LCA of Local and Imported Tomato: An Energy and Water Trade-Off. J. Clean Prod. 2015, 87, 139–148. [Google Scholar] [CrossRef]
- PRé. Introduction to LCA with SimaPro; PRé: Amersfoort, The Netherlands, 2016. [Google Scholar]
- EEA. EMEP/EEA Air Pollution Emission Inventory Guidebook 2019. Technical Guidance to Prepare National Emission Inventories; EEA Report; Publications Office of the European Union: Luxembourg, 2019; ISBN 978-92-9213-806-6. [Google Scholar]
- Nemecek, T.; Schnetzer, J.; Reinhard, J. Updated and Harmonised Greenhouse Gas Emissions for Crop Inventories. Int. J. Life Cycle Assess. 2014, 21, 1361–1378. [Google Scholar] [CrossRef]
- Bosco, S.; Di Bene, C.; Galli, M.; Remorini, D.; Massai, R.; Bonari, E. Greenhouse Gas Emissions in the Agricultural Phase of Wine Production in the Maremma Rural District in Tuscany, Italy. Ital. J. Agron. 2011, 6, 93–100. [Google Scholar] [CrossRef]
- García García, B.; Rosique Jiménez, C.; Aguado-Giménez, F.; García García, J. Life Cycle Assessment of Gilthead Seabream (Sparus Aurata) Production in Offshore Fish Farms. Sustainability 2016, 8, 1228. [Google Scholar] [CrossRef] [Green Version]
- Gazulla, C.; Raugei, M.; Fullana-i-Palmer, P. Taking a Life Cycle Look at Crianza Wine Production in Spain: Where Are the Bottlenecks? Int. J. Life Cycle Assess. 2010, 15, 330–337. [Google Scholar] [CrossRef]
- Villanueva-Rey, P.; Vázquez-Rowe, I.; Moreira, M.T.; Feijoo, G. Comparative Life Cycle Assessment in the Wine Sector: Biodynamic vs. Conventional Viticulture Activities in NW Spain. J. Clean. Prod. 2014, 65, 330–341. [Google Scholar] [CrossRef]
- García García, B.; Rosique Jiménez, C.; Aguado-Giménez, F.; García García, J. Life Cycle Assessment of Seabass (Dicentrarchus labrax) Produced in Offshore Fish Farms: Variability and Multiple Regression Analysis. Sustainability 2019, 11, 3523. [Google Scholar] [CrossRef] [Green Version]
- Antón, A.; Montero, J.I.; Muñoz, P.; Castells, F. LCA and Tomato Production in Mediterranean Greenjouses. Int. J. Agric. Resour. Govern. Ecol. 2005, 4, 102–112. [Google Scholar] [CrossRef]
- Torrellas, M.; Antón, A.; López, J.C.; Baeza, E.J.; Pérez Parra, J.; Muñoz, P.; Montero, J.I. LCA of a Tomato Crop in a Multi-Tunnel Greenhouse in Almeria. Int. J. Life Cycle Assess. 2012, 17, 863–875. [Google Scholar] [CrossRef]
- Carlsson-Kanyama, A. Climate Change and Dietary Choices—How Can Emissions of Greenhouse Gases from Food Consumption Be Reduced? Food Policy 1998, 23, 277–293. [Google Scholar] [CrossRef]
- Chatzisymeon, E.; Foteinis, S.; Borthwick, A.G.L. Life Cycle Assessment of the Environmental Performance of Conventional and Organic Methods of Open Field Pepper Cultivation System. Int. J. Life Cycle Assess. 2017, 22, 896–908. [Google Scholar] [CrossRef] [Green Version]
- Ferrara, C.; De Feo, G. Life Cycle Assessment Application to the Wine Sector: A Critical Review. Sustainability 2018, 10, 395. [Google Scholar] [CrossRef] [Green Version]
- Calatrava, J.; Martínez-Granados, D. El Valor de Uso Del Agua En El Regadío de La Cuenca Del Segura y En Las Zonas Regables Del Trasvase Tajo-Segura. Econ. Agrar y Recur. Nat. 2012, 12, 5–32. [Google Scholar] [CrossRef] [Green Version]
- López-Marín, J.; Gálvez, A.; Porras, I.; Brotons-Martínez, J.M. Injerto En Pimiento (Capsicum annuum): Beneficios y Rentabilidad de Su Uso. ITEA-Inf. Tec. Econ. Agrar 2016, 112, 127–146. [Google Scholar] [CrossRef]
- Ros, C.; Martínez Mora, C.; Sánchez López, E.; Hernádez Colucho, M.A.; Esteban López, A.; Martínez Alarcón, V.; Lacasa Martínez, C.M.; Gomariz Pérez, J.; Martínez Lluch, M.C.; Monserrat Delgado, A. Comportamiento de Líneas de Pimiento Del Banco de Germoplasma Del IMIDA Frente a Meloidogyne Incognita. In Proceedings of the Actas XVI Congreso Nacional de Ciencias Hortícolas, Córdoba, Spain, 17–22 October 2021. [Google Scholar]
Figure 1.
Geographic location of Campo de Cartagena and MERCAGRISA.

Figure 2.
Contributions of the system components to each of the environmental impacts.

Figure 3.
Normalization of the potential environmental impacts and the contributions of the components of the system.
Figure 3.
Normalization of the potential environmental impacts and the contributions of the components of the system.

Figure 4.
Contributions of the system components to the normalized environmental impacts, specifically to GW, and to the production costs. In the latter, each contribution was calculated without taking into account those aspects that do not represent an environmental impact (manpower) or that are not taken into account in the LCA (seedling production, biological control).


Table 1.
Characteristics of greenhouse pepper cultivation in Campo de Cartagena.
| Concept | Components, Material, and Products |
|---|---|
| Yield (kg/ha) | Gross: 120,000; net: 110,400 |
| Greenhouse, “parralvine” type (Useful life, years) | Metallic structure (25 yrs.), concrete footing (25 yrs.), wire (4 yrs.) 800-gauge plastic covering (3 yrs.), anti-thrips plastic mesh (3 yrs.) |
| Irrigation infrastructure (Useful life, years) | Water reservoir (30 yrs.), irrigation equipment (15 yrs.), irrigation network (10 yrs.) |
| Planting | Planting scheme: 1 × 0.4 m; 25,000 plants ha−1 |
| Plastic supplies | Double chamber plastic sheet (200-gauge); plastics for trellising |
| Machinery | Machine usage hours: 33 h ha−1; diesel: 408 dm3 ha−1 |
| Irrigation water | Supply: 8750 m3 ha−1; fertigation electricity: 1158 kWh ha−1 |
| Mix water (%) | S: 19.8, G: 23.4, R: 7.6, T-S: 32.2, D: 17.0 (*) |
| Fertilizer balance | 280-150-360-150-20 (**) |
| Manure (kg ha−1) | 15,000 |
| Inorganic fertilizers (kg ha−1) | Ca(NO3)2: 56; KNO3: 33; NH4NO3: 135; H3PO4: 79 |
| Soil disinfectant: | |
| Biosolarization (alternate years) | Plastic sheet (200-gauge) |
| Soil fumigants (alternate years) | Plastic sheet (120-gauge); Telopic 60 (***): 400 L/ha |
| Biological pest control | Traps, beneficial insects and mites, pheromones |
| Phytosanitary (kg ha−1) | Sulfur: 18; cyprodinil 37.5% + fludioxonil 25%: 2.8; pirimicarb: 1.8; glyphosate: 2.9 |
(*) S: surface, G: groundwater, R: reclaimed, T-S: Tagus-Segura transfer, D: desalinated seawater. (**) Gross fertilizer balance N-P2O5-K2O-CaO-MgO. (***) 1,3-dichloropropene (60.8% w/w) + chloropicrin (33.3% w/w).
Table 2.
Inputs. Functional unit: 1 t of peppers. For the infrastructures, the useful life is taken into account.
Table 2.
Inputs. Functional unit: 1 t of peppers. For the infrastructures, the useful life is taken into account.
| Components | Materials | Units | Amounts |
|---|---|---|---|
| Infrastructure | |||
| Greenhouse | Steel pipe | kg | 0.9390 |
| Steel wire | kg | 2.0833 | |
| Zinc coating | m2 | 0.0788 | |
| Concrete | kg | 6.7275 | |
| Local transportation | tnkm | 0.4002 | |
| LDPE sheet | kg | 7.7778 | |
| PVC mesh | kg | 0.2333 | |
| Local transportation | tnkm | 0.4006 | |
| Irrigation reservoir | Diesel | kg | 0.1126 |
| Lubricant oil | kg | 0.0001 | |
| HDPE sheet | kg | 0.0486 | |
| Local transportation | tnkm | 0.0024 | |
| Irrigation equipment | Iron | g | 2.7778 |
| Steel | g | 0.2778 | |
| Copper | g | 0.8333 | |
| Brass | g | 0.0556 | |
| PVC pipe | g | 2.2222 | |
| LDPE pipe | g | 0.1111 | |
| Polyamide | g | 0.1667 | |
| HDPE tanks | g | 2.5000 | |
| Local transportation | tnkm | 0.0004 | |
| Irrigation network | LDPE pipe | kg | 0.5929 |
| Local transportation | tnkm | 0.0030 | |
| Supplies | |||
| Plastics | LDPE sheet | kg | 4.3216 |
| PVC rope | kg | 0.8333 | |
| Local transportation | tnkm | 0.6783 | |
| Agricultural machinery | Diesel | kg | 2.8300 |
| Lubricant oil | kg | 0.0030 | |
| Fertigation | Electricity | kwh | 9.6511 |
| Water | Electricity | kwh | 101.3892 |
| Fertilizers | Calcium nitrate | kg N | 0.0723 |
| Potassium nitrate | kg N | 0.0358 | |
| Ammonium nitrate | kg N | 0.3769 | |
| Phosphoric acid | kg | 0.3423 | |
| Packaging | kg | 0.0052 | |
| Local transportation | tnkm | 0.1188 | |
| Manure | kg N | 0.7938 | |
| Local transportation | tnkm | 6.2500 | |
| Biosolarization | LDPE sheet | kg | 4.4296 |
| Local transportation | tnkm | 0.2215 | |
| Chemical disinfection | LDPE sheet | kg | 2.5454 |
| 1,3-dichloropropene | kg | 2.0267 | |
| Chloropicrin | kg | 1.1100 | |
| Packaging | kg | 0.0147 | |
| Local transportation | tnkm | 0.1568 | |
| Phytosanitary | Sulfur | kg | 0.1200 |
| Fungicide | kg | 0.0146 | |
| Insecticide | kg | 0.0075 | |
| Herbicide | kg | 0.0240 | |
| Local transportation | tnkm | 0.0085 |
The plastic materials (LDPE, HDPE, PVC) include raw materials and processes (extrusion and plastic film; extrusion and plastic pipes; blow molding).
Table 3.
Scenarios evaluated in the economic and environmental sensitivity analysis.
| Scenario 1 (S1) (Current) | Scenario 2 (S2) | Scenario 3 (S3) | Scenario 4 (S4) | Scenario 5 (S5) | Scenario 6 (S6) | |
|---|---|---|---|---|---|---|
| Net yield (%) | 100 | 100 | 80 | 80 | 90 | 100 |
| Tagus-Segura transfer (%) | 32.2 | 0.0 | 32.2 | 0.0 | 32.2 | 32.2 |
| Desalinated seawater (%) | 17.0 | 49.2 | 17.0 | 49.2 | 17.0 | 17.0 |
| Energy cost of water (kWh m−3) | 1.390 | 2.363 | 1.390 | 2.363 | 1.390 | 1.390 |
| Water price (€ m−3) | 0.350 | 0.508 | 0.350 | 0.508 | 0.350 | 0.350 |
| Soil fumigants | Yes | Yes | NO | NO | NO | NO |
| Unit cost of the seedlings (€ unid−1) | 0.359 | 0.359 | 0.359 | 0.359 | 0.400 | 1.304 |
Table 4.
Cost structure of greenhouse pepper cultivation.
| Concept | Absolute Cost € ha−1 | Relative Cost % |
|---|---|---|
| Fixed costs: | 7528 | 12.86 |
| Shed for equipment | 329 | 0.56 |
| Irrigation equipment | 662 | 1.13 |
| Irrigation network | 471 | 0.80 |
| Various | 41 | 0.07 |
| Irrigation reservoir | 241 | 0.41 |
| Greenhouse structure, ventilation and automatisms | 2984 | 5.10 |
| Anti-thrips plastic mesh | 142 | 0.24 |
| 800-gauge plastic covering | 2660 | 4.54 |
| Variable costs: | 51,034 | 87.14 |
| Crop withdrawal, preparation and planting | 10,817 | 18.47 |
| Soil disinfection | 3749 | 6.40 |
| Double chamber plastic sheet and plastics for trellising | 2501 | 4.27 |
| Manual work (staking, pruning, liming) | 893 | 1.53 |
| Machinery | 1267 | 2.16 |
| Phytosanitary and herbicides | 1045 | 1.79 |
| Auxiliary insects, traps, pheromones | 2812 | 4.80 |
| Organic and inorganic fertilization | 1039 | 1.77 |
| Maintenance | 384 | 0.66 |
| Electric power (irrigation) | 282 | 0.48 |
| Irrigation water | 3108 | 5.31 |
| Harvesting | 10,686 | 18.25 |
| Fixed personnel | 12,451 | 21.26 |
| Total cost (€ ha−1) | 58,562 | 100 |
| Unitary total cost (€ kg−1) | 0.53 |
Relative cost (%) = 100 × absolute cost/total cost.
Table 5.
Values of the economic indicators in the scenarios analyzed (Table 3) and the relative difference (RD) between the current scenario (S1) and those proposed (Sn).
Table 5.
Values of the economic indicators in the scenarios analyzed (Table 3) and the relative difference (RD) between the current scenario (S1) and those proposed (Sn).
| Indexes | Scenario 1 (S1) | Scenario 2 (S2) | Scenario 3 (S3) | Scenario 4 (S4) | Scenario 5 (S5) | Scenario 6 (S6) |
|---|---|---|---|---|---|---|
| Incomes (€/ha) | 83,904 | 83,904 | 67,123 | 67,123 | 75,514 | 83,094 |
| Costs (€/ha) | 58,562 | 59,964 | 57,131 | 58,532 | 58,172 | 79,946 |
| Net margin (NM) (€ ha−1) | 25,342 | 23,940 | 9992 | 8591 | 17,342 | 3148 |
| Net margin/costs (NM/CT) (%) | 43.3 | 39.9 | 17.5 | 14.7 | 29.8 | 3.9 |
| Average cost (€ kg−1) | 0.53 | 0.54 | 0.60 | 0.61 | 0.54 | 0.67 |
| Break-even point (kg ha−1) | 77,055 | 78,900 | 75,172 | 77,016 | 76,541 | 106,258 |
| Employment/ha (AWU ha−1) | 1.78 | 1.78 | 1.64 | 1.64 | 1.71 | 1.78 |
| Gross unit income (€ ha−1) | 83,094 | 83,094 | 67,123 | 67,123 | 75,514 | 83,094 |
| Relative difference (%) | S2 vs. S1 | S3 vs. S1 | S4 vs. S1 | S5 vs. S1 | S6 vs. S1 | |
| Incomes | 0.00 | −25.00 | −25.00 | −11.11 | −0.97 | |
| Costs | 2.34 | −2.50 | −0.05 | −0.67 | 26.75 | |
| Net margin (NM) | −5.86 | −153.62 | −194.98 | −46.13 | −705.02 | |
| Net margin/costs (NM/CT) | −8.52 | −147.43 | −194.56 | −45.30 | −1010.26 | |
| Average cost | 1.85 | 11.67 | 13.11 | 1.85 | 20.90 | |
| Break-even point | 2.34 | −2.50 | −0.05 | −0.67 | 27.48 | |
| Employment ha−1 | 0.00 | −8.54 | −8.54 | −4.09 | 0.00 | |
| Gross unit income | 0.00 | −23.79 | −23.79 | −10.04 | 0.00 |
RD (%) = 100 × (Sn–S1)/Sn.
Table 6.
Characterization of the potential environmental impacts and the contributions of the components of the system; normalized values and their contributions to the environmental problem.
Table 6.
Characterization of the potential environmental impacts and the contributions of the components of the system; normalized values and their contributions to the environmental problem.
| Impact Category | Values | 1 | 2 | 3 | 4 | 5 | 6 | 7 | 8 | 9 | 10 |
|---|---|---|---|---|---|---|---|---|---|---|---|
| Characterization | Contribution (%) | ||||||||||
| AD (kg Sb-eq) | 2.77 × 10⁻³ | 42.91 | 14.53 | 0.98 | 10.24 | 0.17 | 15.39 | 7.04 | 19.37 | 1.37 | −12.00 |
| ADFF (MJ) | 1.54 × 10³ | 52.31 | 26.63 | 2.61 | 27.29 | 10.58 | 6.59 | 11.29 | 40.67 | 0.46 | −78.43 |
| GW (kg CO2-eq) | 1.22 × 10² | 30.25 | 13.76 | 2.81 | 29.33 | 9.38 | 15.09 | 4.69 | 20.65 | 0.40 | −26.36 |
| OLD (kg CFC−11-eq) | 1.80 × 10⁻⁵ | 9.85 | 4.18 | 2.81 | 29.38 | 11.64 | 5.91 | 1.53 | 38.24 | 0.73 | −4.26 |
| HT (kg 1,4-DB-eq) | 1.79 × 10² | 73.62 | 5.23 | 1.02 | 10.67 | 0.45 | 4.29 | 1.76 | 11.31 | 0.30 | −8.64 |
| FWAE (kg 1,4-DB-eq) | 8.15 × 101 | 51.75 | 7.29 | 2.02 | 21.17 | 0.30 | 5.83 | 3.02 | 17.56 | 0.47 | −9.42 |
| MAE (kg 1,4-DB-eq) | 1.74 × 10⁵ | 35.18 | 7.66 | 3.37 | 35.26 | 0.42 | 4.43 | 3.03 | 17.68 | 0.44 | −7.46 |
| TE (kg 1,4-DB-eq) | 5.29 × 10⁻¹ | 32.50 | 6.92 | 2.36 | 24.63 | 0.62 | 22.81 | 1.47 | 11.74 | 0.32 | −3.36 |
| PO (kg C2H4-eq) | 3.87 × 10⁻² | 47.63 | 21.34 | 2.48 | 25.91 | 3.13 | 8.52 | 8.74 | 16.11 | 0.86 | −34.73 |
| A (kg SO2-eq) | 1.03 × 100 | 14.35 | 6.65 | 2.54 | 26.53 | 1.69 | 45.01 | 1.95 | 9.94 | 0.51 | −9.17 |
| E (kg PO4-eq) | 3.05 × 10⁻¹ | 19.15 | 6.86 | 1.98 | 20.66 | 0.68 | 38.89 | 2.60 | 12.45 | 0.66 | −3.94 |
| Overall contribution (%) | 37.23 | 11.01 | 2.27 | 23.73 | 3.55 | 15.71 | 4.28 | 19.61 | 0.59 | −17.98 | |
| Normalization | 1.85 × 10⁻⁹ | 6.84 × 10⁻¹⁰ | 1.53 × 10⁻¹⁰ | 5.76 × 10⁻¹¹ | 6.02 × 10⁻¹⁰ | 1.53 × 10⁻¹¹ | 1.16 × 10⁻¹⁰ | 6.10 × 10⁻¹¹ | 3.33 × 10⁻¹⁰ | 8.60 × 10⁻¹² | −1.83 × 10⁻¹⁰ |
| Contribution (%) | 36.99 | 8.30 | 3.12 | 32.58 | 0.83 | 6.29 | 3.30 | 18.01 | 0.47 | −9.88 | |
1: Infrastructure. 2: Plastic supplies. 3: Fertigation. 4: Water mix. 5: Machinery. 6: Fertilizers. 7: Biosolarization. 8: Soil fumigants. 9: Phytosanitary. 10: Waste treatment. AD: abiotic depletion. ADFF: abiotic depletion fossil fuels. GW: global warming. OLD: ozone layer depletion. HT: human toxicity. FWAE: fresh water aquatic ecotoxicity. MAE: marine aquatic ecotoxicity. TE: terrestrial ecotoxicity. PO: photochemical oxidation. A: acidification. E: eutrophication.
Table 7.
Values of the potential environmental impacts (PEI) in the scenarios analyzed (Table 3) and the relative difference (RD) between the current scenario (S1) and those proposed (Sn).
Table 7.
Values of the potential environmental impacts (PEI) in the scenarios analyzed (Table 3) and the relative difference (RD) between the current scenario (S1) and those proposed (Sn).
| PEI | Units | Scenario 1 (S1) | Scenario 2 (S2) | Scenario 3 (S3) | Scenario 4 (S4) | Scenario 5 (S5) | Scenario 6 (S6) |
|---|---|---|---|---|---|---|---|
| AD | kg Sb-eq | 2.77 × 10⁻³ | 2.97 × 10⁻³ | 3.04 × 10⁻³ | 3.28 × 10⁻³ | 2.70 × 10⁻³ | 2.43 × 10⁻³ |
| ADFF | MJ | 1.54 × 10³ | 1.83 × 10³ | 1.36 × 10³ | 1.72 × 10³ | 1.21 × 10³ | 1.09 × 10³ |
| GW | kg CO2-eq | 1.22 × 10² | 1.47 × 10² | 1.29 × 10² | 1.60 × 10² | 1.14 × 10² | 1.03 × 10² |
| OLD | kg CFC-11-eq | 1.80 × 10⁻⁵ | 2.17 × 10⁻⁵ | 1.43 × 10⁻⁵ | 1.89 × 10⁻⁵ | 1.27 × 10⁻⁵ | 1.14 × 10⁻⁵ |
| HT | kg 1,4-DB-eq | 1.79 × 10² | 1.92 × 10² | 2.03 × 10² | 2.19 × 10² | 1.80 × 10² | 1.62 × 10² |
| FWAE | kg 1,4-DB-eq | 8.15 × 101 | 9.36 × 101 | 8.71 × 101 | 1.02 × 10² | 7.74 × 101 | 6.96 × 101 |
| MAE | kg 1,4-DB-eq | 1.74 × 10⁵ | 2.16 × 10⁵ | 1.85 × 10⁵ | 2.39 × 10⁵ | 1.65 × 10⁵ | 1.48 × 10⁵ |
| TE | kg 1,4-DB-eq | 5.29 × 10⁻¹ | 6.20 × 10⁻¹ | 5.94 × 10⁻¹ | 7.08 × 10⁻¹ | 5.28 × 10⁻¹ | 4.75 × 10⁻¹ |
| PO | kg C2H4-eq | 3.87 × 10⁻² | 4.57 × 10⁻² | 4.48 × 10⁻² | 5.36 × 10⁻² | 3.98 × 10⁻² | 3.58 × 10⁻² |
| A | kg SO2-eq | 1.03 × 100 | 1.22 × 100 | 1.18 × 100 | 1.42 × 100 | 1.05 × 100 | 9.45 × 10⁻¹ |
| E | kg PO4-eq | 3.05 × 10⁻¹ | 3.49 × 10⁻¹ | 3.43 × 10⁻¹ | 3.98 × 10⁻¹ | 3.05 × 10⁻¹ | 2.75 × 10⁻¹ |
| Relative Difference (%) | S2 vs. S1 | S3 vs. S1 | S4 vs. S1 | S5 vs. S1 | S6 vs. S1 | ||
| SAD | 6.68 | 8.76 | 15.65 | −2.64 | −14.06 | ||
| ADFF | 16.02 | −13.26 | 10.83 | −27.42 | −41.60 | ||
| GW | 17.02 | 4.83 | 23.49 | −7.07 | −18.99 | ||
| OLD | 17.04 | −26.37 | 4.60 | −42.17 | −57.99 | ||
| HT | 6.94 | 11.57 | 18.31 | 0.52 | −10.56 | ||
| FWAE | 12.89 | 6.40 | 20.22 | −5.30 | −17.02 | ||
| MAE | 19.78 | 6.29 | 27.29 | −5.43 | −17.16 | ||
| TE | 14.69 | 10.86 | 25.21 | −0.29 | −11.45 | ||
| PO | 15.34 | 13.65 | 27.78 | 2.86 | −7.95 | ||
| A | 15.65 | 13.07 | 27.66 | 2.20 | −8.68 | ||
| E | 12.62 | 11.28 | 23.53 | 0.19 | −10.92 |
RD (%) = 100 × (Sn–S1)/Sn.
Publisher’s Note: MDPI stays neutral with regard to jurisdictional claims in published maps and institutional affiliations. |
© 2022 by the authors. Licensee MDPI, Basel, Switzerland. This article is an open access article distributed under the terms and conditions of the Creative Commons Attribution (CC BY) license (https://creativecommons.org/licenses/by/4.0/).
Share and Cite
MDPI and ACS Style
García García, J.; García García, B. Sustainability Assessment of Greenhouse Pepper Production Scenarios in Southeastern Spain. Agronomy 2022, 12, 1254. https://0-doi-org.brum.beds.ac.uk/10.3390/agronomy12061254
AMA Style
García García J, García García B. Sustainability Assessment of Greenhouse Pepper Production Scenarios in Southeastern Spain. Agronomy. 2022; 12(6):1254. https://0-doi-org.brum.beds.ac.uk/10.3390/agronomy12061254
Chicago/Turabian StyleGarcía García, José, and Benjamín García García. 2022. "Sustainability Assessment of Greenhouse Pepper Production Scenarios in Southeastern Spain" Agronomy 12, no. 6: 1254. https://0-doi-org.brum.beds.ac.uk/10.3390/agronomy12061254
Note that from the first issue of 2016, this journal uses article numbers instead of page numbers. See further details here.