
Diversity in Root Architecture of Durum Wheat at Stem Elongation under Drought Stress


Department of Agricultural and Forest Sciences, Tuscia University, Via S. C. de Lellis, snc, 01100 Viterbo, Italy
*
Author to whom correspondence should be addressed.
Agronomy 2022, 12(6), 1329; https://0-doi-org.brum.beds.ac.uk/10.3390/agronomy12061329
Submission received: 22 April 2022
/
Revised: 26 May 2022
/
Accepted: 28 May 2022
/
Published: 30 May 2022
(This article belongs to the Special Issue Plant Responses to Stress and Environmental Stimulus)
Abstract
:Durum wheat is a major crop in the Mediterranean basin, where water deficit is the most important factor affecting its production. Under drought conditions, the root system has a crucial role in crop productivity as a water and nutrition supplier. The aim of the study was to analyze root system diversity in six contrasting durum wheat accessions, including two hydric stress-tolerant genotypes, and to evaluate root traits using the high-throughput phenotyping scanner Win-RHIZO in order to determine the main traits to be used in breeding programs. Six durum wheat accessions were subjected to two drought events under greenhouse conditions from the seedlings stage (BBCH12) for 49 days. Root phenotyping data were validated with results from plants grown in the rainfed field. This study highlighted a great variability among the analyzed genotypes in terms of development, distribution, and architecture of the root system under difficult environments, underlining a good resilience to climate change. Interestingly, the two hydric stress-tolerant genotypes, Cham1 and J. Khetifa, showed different root system ideotypes and rooting patterns under drought conditions. The late flowering landrace J. Khetifa (as also genotypes; Pelsodur and Vulci) showed a steep and long root system ideotype that led to the maintaining of the highest root biomass, length, and volume under drought conditions, while the early flowering genotype Cham1 (as also genotype; Sebatel) was distinguished by a wider root system ideotype, and by increasing the root volume in the topsoil as a strategy to tolerate drought. Moreover, a significant positive correlation was obtained between the root angle of plants grown under greenhouse conditions and plants from the field. Our results demonstrated that screening plant roots in early stages grown under greenhouse conditions using high-throughput phenotyping systems can speed up the selection for crop improvement and future drought stress breeding programs.
1. Introduction
As a result of climate changes, drought is probably the most severe and unpredictable abiotic stress, significantly affecting crop production due to decreased water and fertilizer availability [1,2]. Drought negatively affects the grain yield and crop production, with a variation reaching 82%, as plants experience both water deficit and the ability for nitrogen uptake and assimilation, which reduce plant vigour [3,4]. Moreover, drought reduces grain yield depending on its intensity, duration, and timing [5,6]. In the Mediterranean basin, water deficit is the most important factor affecting grain yield. Durum wheat (Triticum turgidum L. subsp. durum (Desf) Husn.) is one of the major cultivated crops according to the importance and cultivated area [7,8]. Furthermore, the Mediterranean basin also has high volatility in rainfall distribution, so water scarcity, with a negative effect on productivity, can also occur in the early growth stages. Several studies revealed that drought affects grain yield more during the vegetative stage (tillering and stem elongation) than in reproductive stages, and can cause about 72% of yield loss [9,10,11]. Since spikelet initiation starts at the seedling stage to tillering, and floret initiation begins from tillering to stem elongation, both these stages determine spike and spikelet numbers per plant, and in turn grain yield [12]. Therefore, studies on tillering and stem elongation stages should get more attention, as they have a significant impact on grain yield; moreover, selection in early stages can save labour and time.
Root system architecture (RSA) plays a crucial role in crop productivity, especially in drought conditions as a water and nutrition supplier [13,14]. Previous studies have shown that early vigour is important for crop development in dry areas [15,16], and that RSA is directly involved in the resilience of wheat in drought-prone environments [17,18]. The root system cannot be considered only as a whole, as the roots could be divided into seminal, lateral, crown and primary roots, and different root typology could react differently to different external stimuli across different genotypes [19]. However, roots are not easily studied; they are not accessible by non-destructive analyses as opposed to aboveground plant organs, and different methods to study root systems have not always given consistent results. Difficulties in studying root systems increase with plant growth, since a wider root system has a higher percentage of damage during the measurement. Researchers try to avoid these problems by (i) analysing plants at an earlier stage (seedlings) and (ii) using artificial systems or an easy-to-clean substrate. Moreover, it was reported that RSA traits detected on the seedling stage can be used to predict the RSA of adult plants in the field-grown [20] or in an artificial system [21] in order to evaluate the crop adaptation under water stress conditions, but these reports were validated only for what concerned the roots angle and seminal root apparatus.
The studies of root system characteristics have recently received more attention since several high-throughputs, multifunctional root phenotyping platforms have been developed, and the studies of root system characteristics have recently received more attention. Consequently, some root system ideotypes and their growth patterns under different environments have been identified [22]. For example, the root angle is considered a very important feature to select wheat accessions for drought tolerance, since it has high heritability, and is able to give some indications about root ideotypes’ capacity for soil water extraction under a drought regime [23,24]. In early stages, wheat genotypes with a narrow root angle have grown deeper compared with varieties that have wider root angles [21,25]. Such findings suggest that wheat with longer roots and with a narrower root angle will be more drought tolerant, as it can reach water from deeper soil layers. In addition, it has been observed that drought-tolerant genotypes have a great number of nodal and seminal roots concentrated in the crown region and located near the surface, while in susceptible genotypes, roots are located far from the top of the soil [26]. Root phenotyping using the high-throughput technique could help to determine root system architectures, traits or ideotypes and rooting patterns, which can be used to select durum wheat for conditions similar to the Mediterranean basin.
The present study was conducted to better understand the genotypic diversity of root architecture in six contrasting durum wheat accessions by evaluating root traits using a high-throughput scanner Win-RHIZO. High-throughput analysis can accelerate the determination of root traits for crop improvement under drought conditions and enable the selection of tolerant and susceptible durum wheat genotypes for breeding programs at the early stages.
2. Materials and Methods
2.1. Plant Materials
The plant materials consisted of six durum wheat accessions with contrasting morphological and stress resistance characteristics, including two hydric stress-tolerant genotypes Cham1 and Jennah Khetifa (J. Khetifa). J. Khetifa is a landrace grown in the dry areas of Algeria and Tunisia that shows specific adaptation to the North African continental dry land; it is tall and resistant to abiotic and biotic stresses [27,28]. The semi-dwarf variety Cham1, selected at ICARDA (the International Center for Agricultural Research in the Dry Areas) and released for commercial production in several countries of the Mediterranean basin, is characterized by both salt and drought tolerance and yield stability [29,30]. Several studies report that both of these genotypes are hydric stress-tolerant [31,32,33,34], and only one mentioned abiotic stress effect on roots [27].
The other four genotypes were chosen according to the flowering time, as Mv-Pelsodur (from now on just Pelsodur) and Vulci were chosen for late, and Azeghar 2-1 (56) (from now on just Azeghar), and Sebatel2 (45) (from now on just Sebatel) were chosen for early [35].
2.2. Greenhouse Experimental Design and Conditions
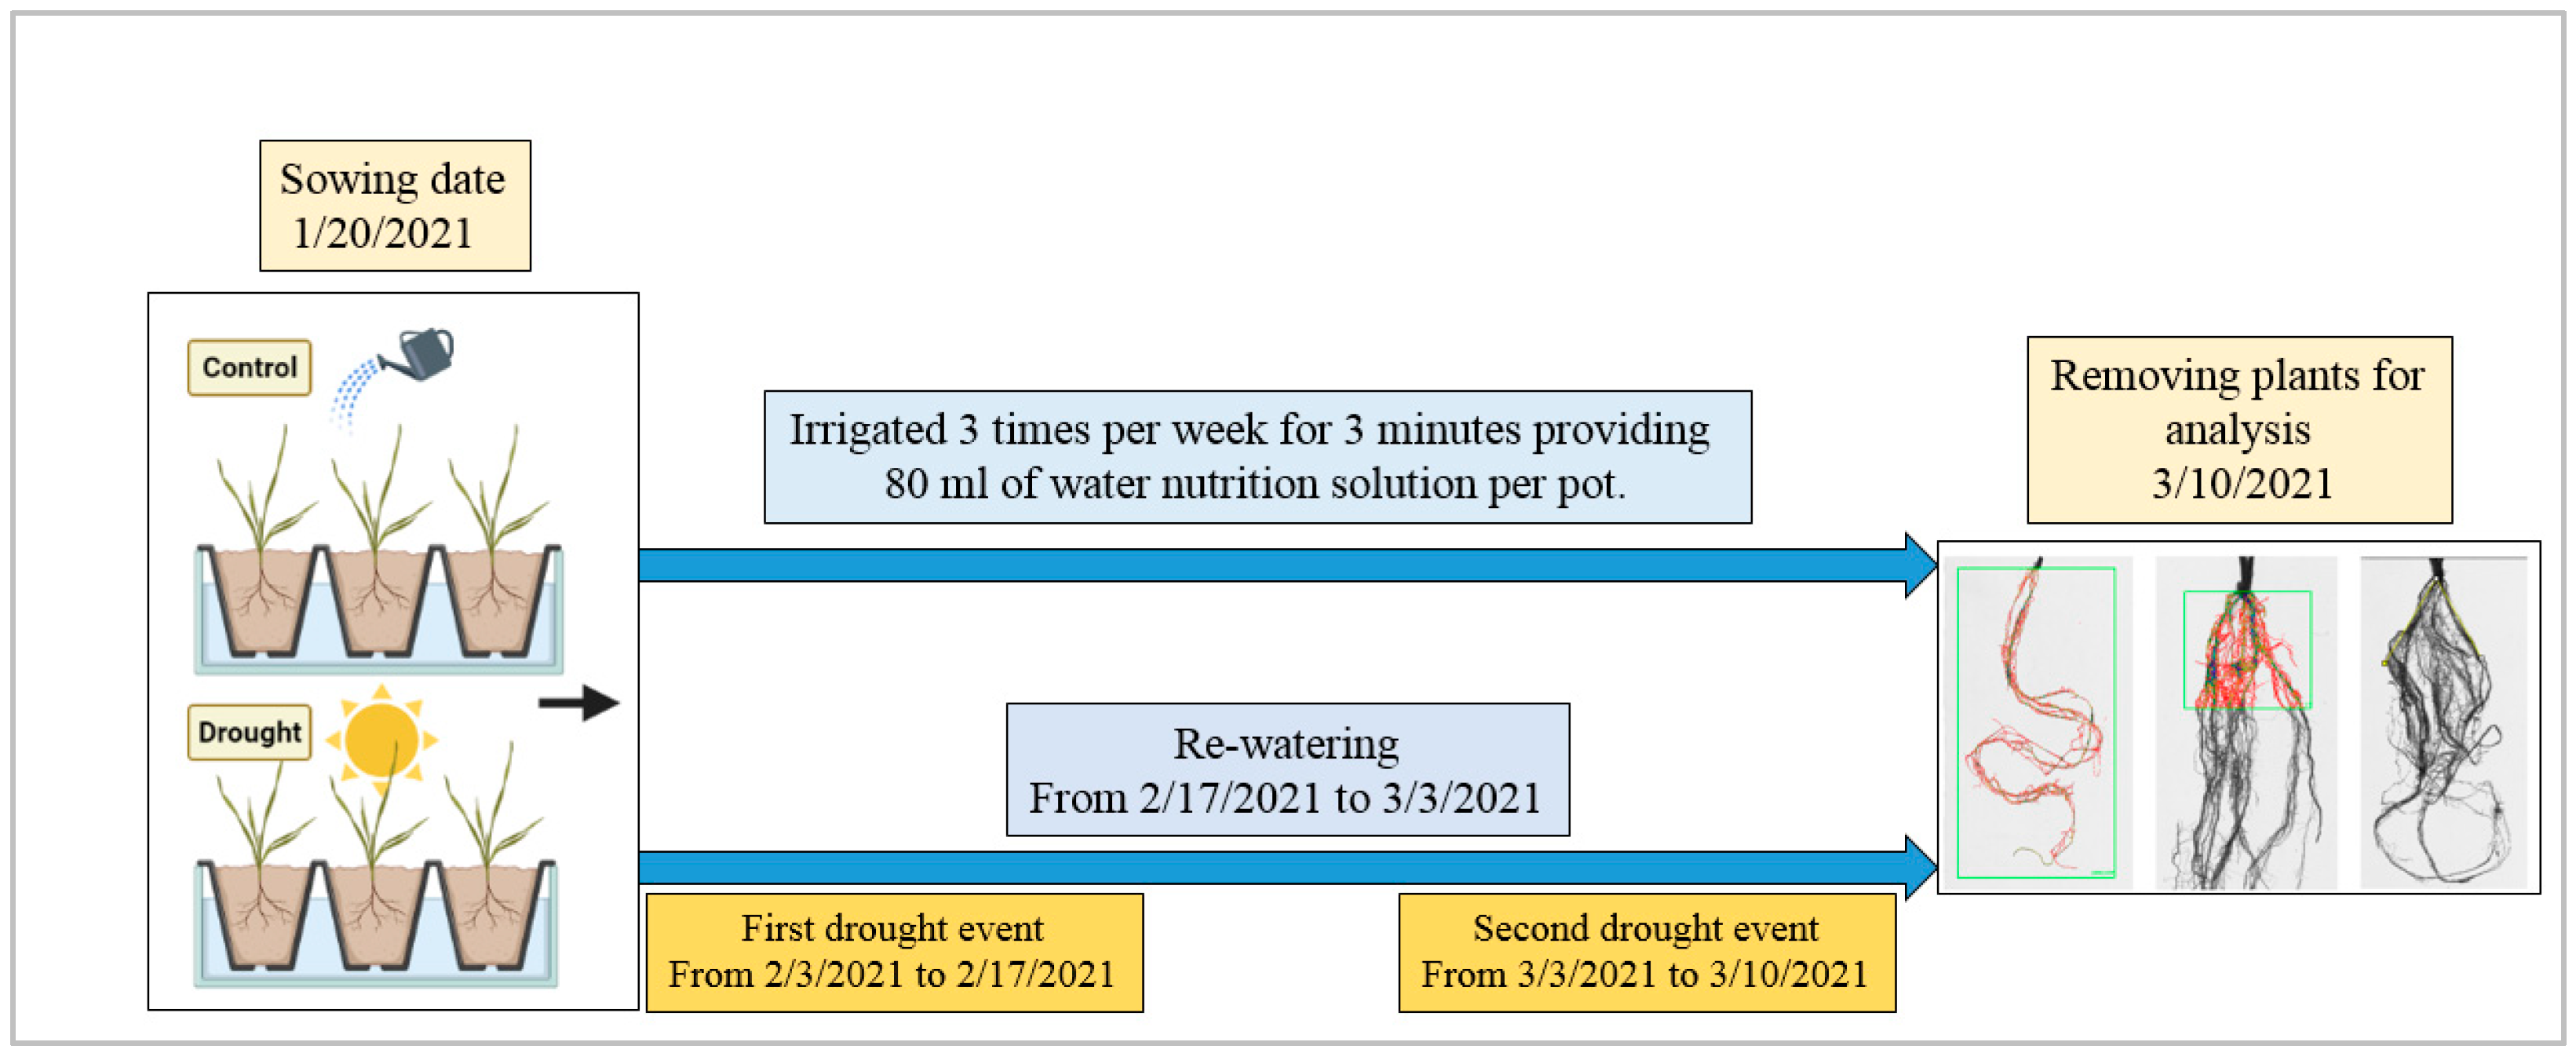
The six genotypes were sown, with one seed per pot placed with the embryo facing down, in the greenhouse at the Tuscia University experimental farm (Viterbo, Italy), on 20 January 2021. The air temperature ranged from 22 to 28 °C during the day and from 14 to 17 °C during the night. The pots (17 cm diameter, 16 cm high) were filled with 2.5 L of sand. Pots were irrigated three times per week to keep them at 50% soil field capacity (FC), and 80 mL/per pot were filled with a water nutrition solution composed of nitric acid (0.286 mL/L), calcium nitrate (0.432 g/L), potassium nitrate (0.436 g/L), dihydrogen phosphate potassium (0.13 g/L), potassium sulphate (0.04 g/L), magnesium nitrate (0.244 g/L) and Mikron (0.23 g/L) (Prof. Giuseppe Colla, personal communication). The experiment lasted 49 days, and drought treatment was applied two times by discontinuing irrigation; treated plants were re-watered to prevent death. The first drought treatment started when all plants reached early seedling stages (two leaves unfolded—BBCH12) and continued for 14 days. The first drought treatment plants were re-watered (80 mL/per pot) three times per week for two weeks. The second drought treatment, which continued for seven days, started after re-watering (Figure 1).
2.3. Phenotyping
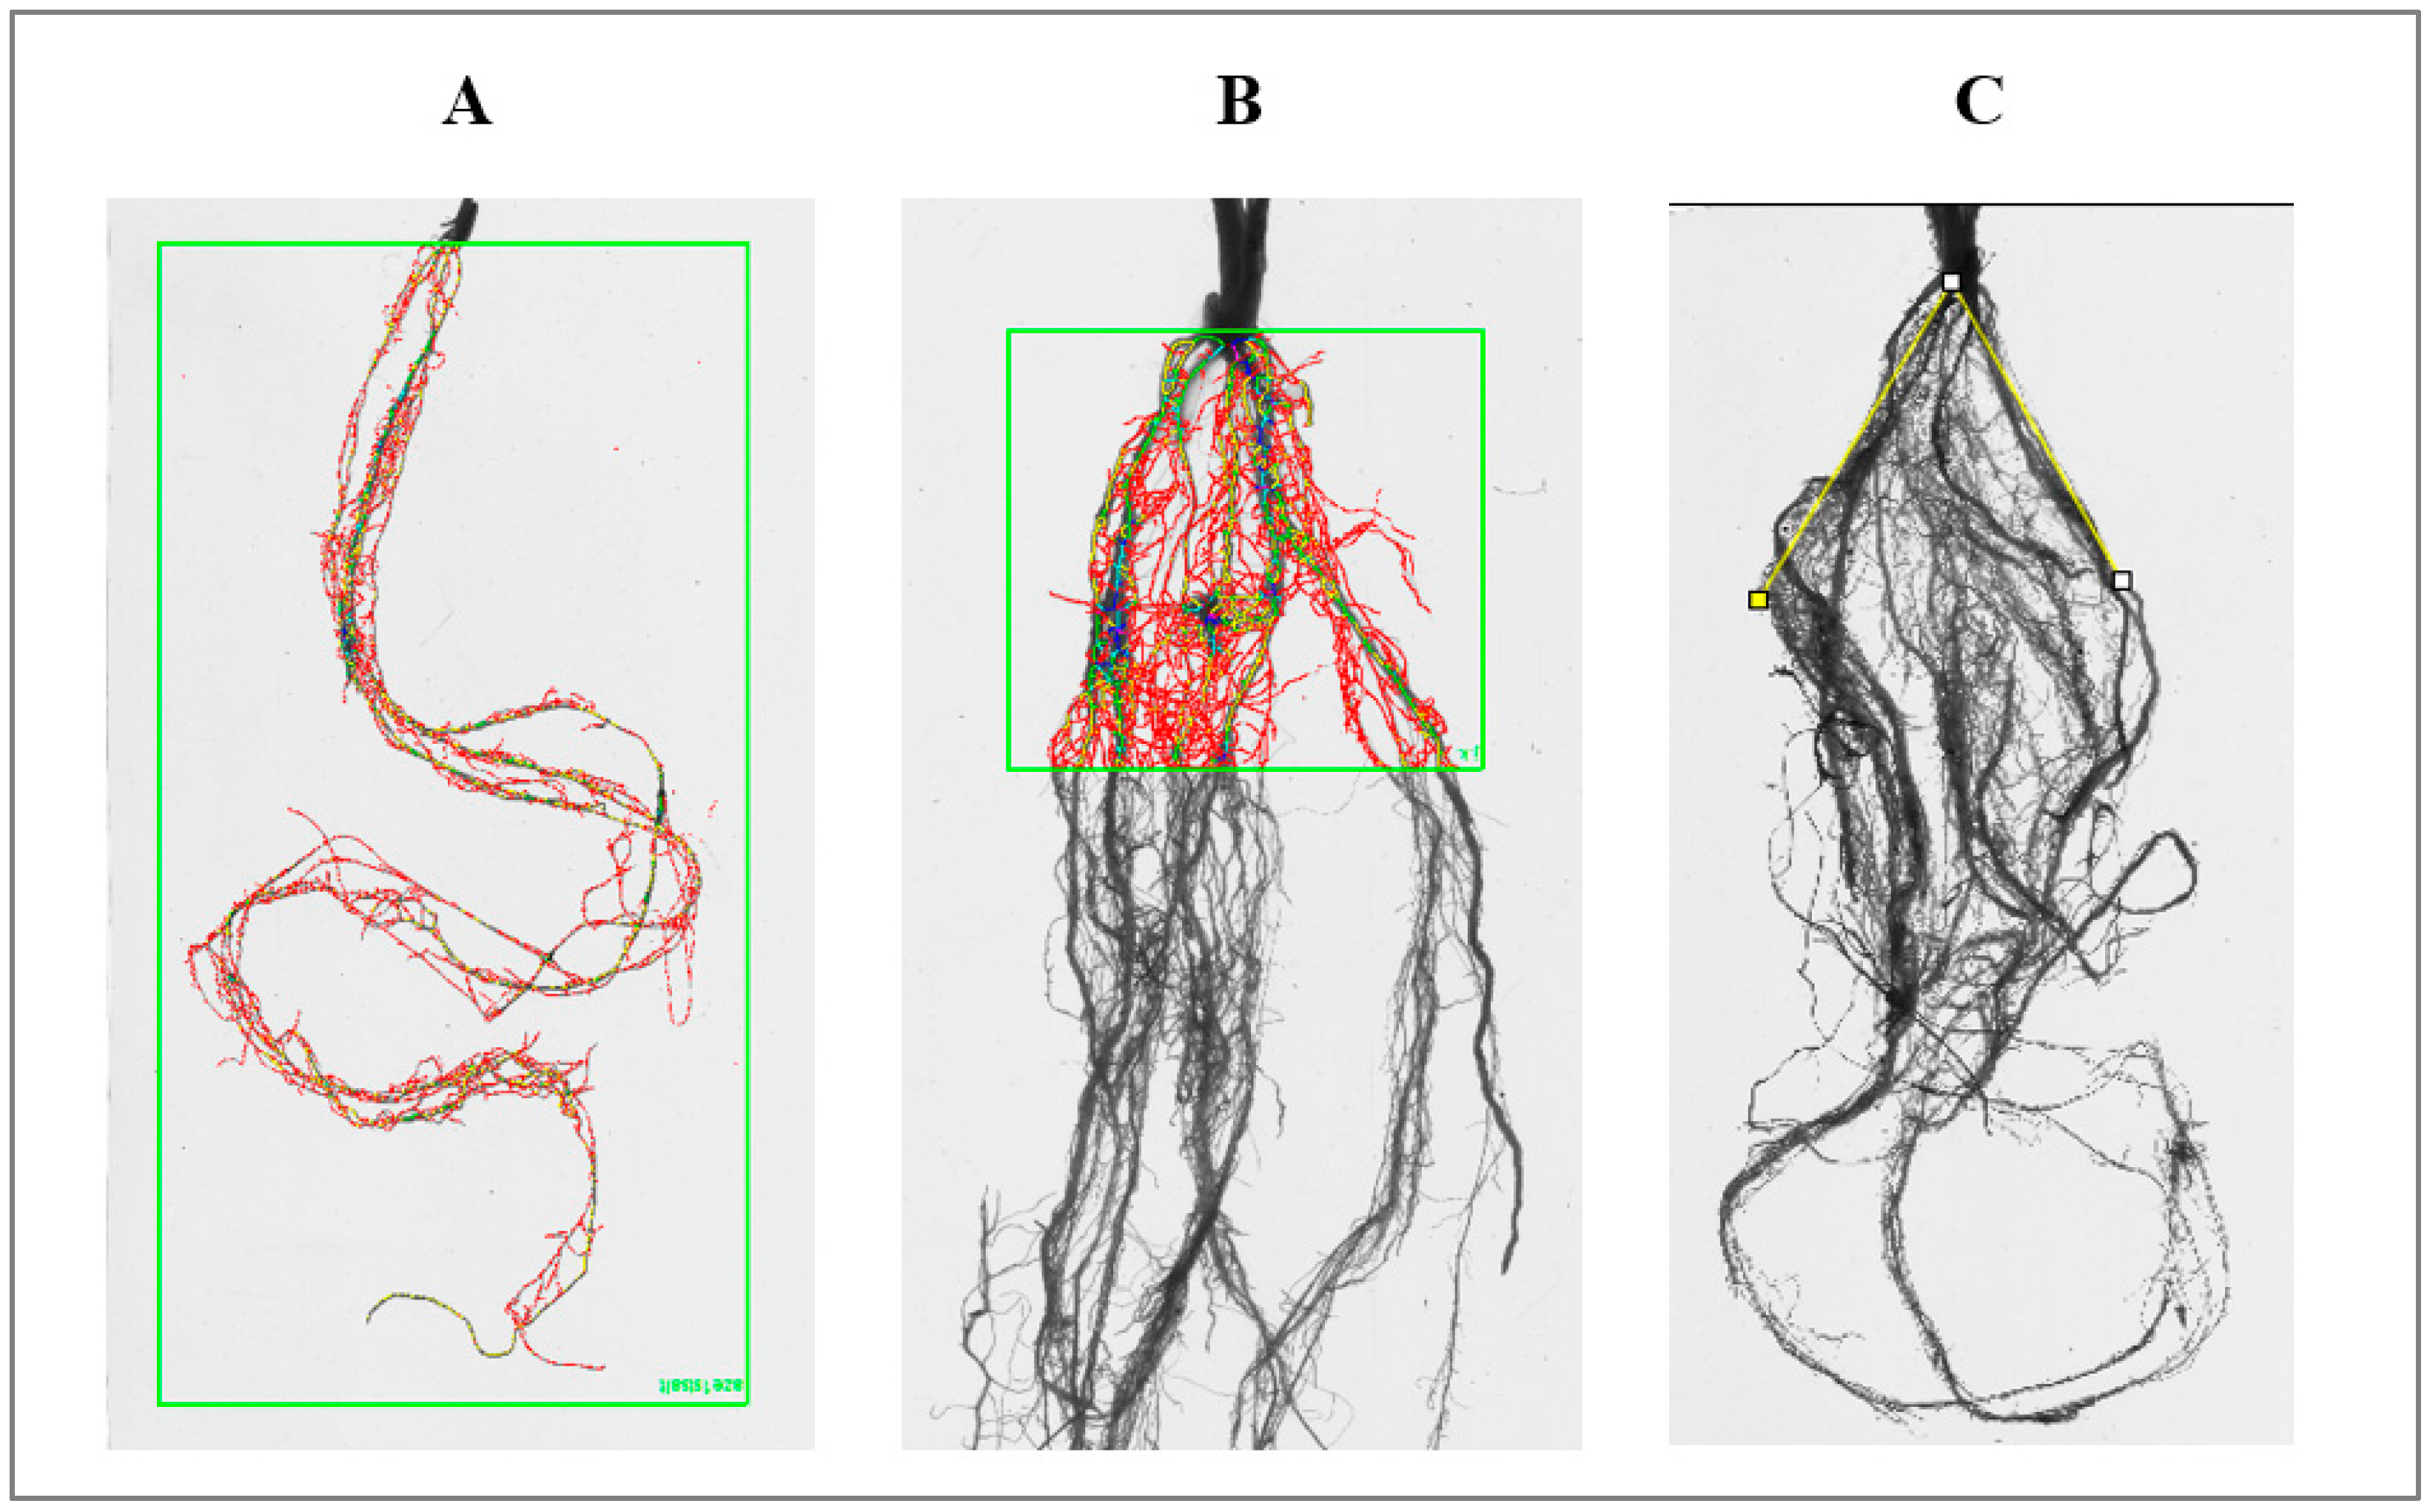
The stress effects on plant growth and development in durum wheat genotypes were evaluated by several morphological characters above and below ground. All plants from both treatments were collected 49 days after sowing; roots were carefully washed to remove the sand using a soft spray watering head. The morphological traits of the roots were recorded both for the whole root system (W) and separately in the first 5 cm (5) below ground (Figure 3A,B), such as root length (RLW, RL5 sum of all roots lengths, cm), surface area (SAW, SA5 total root surface area, cm2), root volume (RVW, RV5 total root volume, cm3), number of tips (TIW, TI5), forks (FRW, FR5), and crossings (CRW, CR5) using Win-RHIZO Pro software v2009 (version 4.0b; Regent Instruments, Montreal, QC, Canada). The root angle (RA°) was measured using the software ImageJ when the angle between the two extreme sides of the roots with the center set in the middle of the crown, as shown in Figure 3C. After measurements, the plants were separated into roots and shoots, dried in an oven (80 °C for 12 h), and weighed for shoot and root dry weight (SDW, RDW). In addition, the number of leaves (NL), and number of tillers (NT) were assessed. Moreover, some ratios were calculated, such as the root/shoot (RS) ratio, to determine which above-ground or below-ground part of the plant is dominant. The ratio of total root length and number of tips (RL/TI) was also evaluated, since it could show root system pattern, i.e., the capacity to generate a longer root system or to increase the number of new roots under stress conditions. To determine root system distribution at different soil layers, the ratio of some root traits between the whole system and topsoil was evaluated, such as RL5/RLW, SA5/SAW, and RV5/RVW. Root length density (RLD) was calculated using the following equation: RLW/Soil volume (cm/cm−3). The recorded raw data are public available (after an access request) at the Zenodo web site with DOI: 10.5281/zenodo.5883299.
2.4. Field Experiment
To validate the results obtained in greenhouse conditions, the same genotypes were sown in rain fed field conditions without any specific treatment (i.e., natural agronomic conditions). A field experiment was performed at Tuscia University experimental farm (Viterbo, Italy). The experimental design was a randomized complete block design with three replicates. Plot size was 1.5 × 5.2 m (7.8 m2) and sowed with 234.7 g seeds per plot on 11 November 2021. The soil was sandy loam, the pH was 6.9 and organic matter was 14.8 g kg−1.
Plants were collected on 17 March 2022, when all genotypes reached the end of tillering and the beginning of stem elongation stages. Plant samples from the field were collected very carefully so as not to damage the root system of the topsoil, at 5 cm deep. Roots were carefully washed to remove soil and analyzed for root angle (°) using ImageJ software. The morphological traits of the roots of plants from field such as root length (RLF), surface area (SAF), root volume (RVF), number of tips (TIF), forks (FRF), and crossings (CRF) were recorded using Win-RHIZO Pro software v2009 (version 4.0b; Regent Instruments, Montreal, QC, Canada).
2.5. Statistical Analysis
All of the statistical analyses were performed using R Studio (Version R-4.1.0). Two-way analysis of variance (ANOVA) was conducted at a significance level of 5% using the aov() function, while, one-way ANOVA was used to test the variance component of each trait under each treatment, with genotype as a factor. Fischer’s least significant difference (LSD) test was used for mean comparisons. The correlation matrix between all traits was constructed and Pearson correlation coefficients were calculated using the corrplot function R package [37]. Principal component analysis was performed using the prcomp() function and then biplot was generated with the ggbiplot function R package [38].
3. Results
3.1. Drought Effect on Shoot Growth and Development in Greenhouse Experiment
Recurrent short events of drought at the vegetative stage, from two fully expanded leaves to stem elongation, had adverse effects and growth reductions both below and aboveground in all genotypes. Compared with the control condition, water deficit significantly reduced shoot dry weight (SDW) in the six investigated durum wheat genotypes (Table 1). The ANOVA revealed the presence of highly significant differences among genotypes and treatments for shoot traits, such as number of leaves (NL) and number of tillers (NT) per plant, while there were no statistical differences among genotypes for shoot dry weight (in control condition) (Table 1). Under control conditions, the studied genotypes were divided into two groups in accord with the number of leaves produced: J. Khetifa, Pelsodur, and Vulci, with a higher number of leaves (on average 32 leaves), and Cham1, Azeghar, and Sebatel with a lower number of leaves (on average 19 leaves) (Table 1). Furthermore, J. Khetifa and Pelsodur also produced a higher number of tillers (on average 10 tillers) in comparison with the other genotypes (on average four tillers). Not surprisingly, in general, NL and NT are reduced by the drought stress (Table 1). Even so, these decreases under drought conditions have different degrees in the different genotypes. Vulci and Cham1 have a stronger drought effect on NL (−47.2% and −62.3% respectively) than on NT (−23.5% and −42.9% respectively), while Azeghar loses more tillers than leaves (−66.7% and −55.3% respectively) (Table 1).
Interestingly, J. Khetifa and Pelsodur have similar degrees of reduction in both the number of leaves and number of tillers, while the main effect of treatment was not significant for the Sebatel genotype. Results confirm that the development dynamics of the number of tillers and number of leaves highly depend not only on environment conditions but also by genotype inner capacity. This is also highlighted by the significant G × T interaction (Table 1). Moreover, regarding shoot biomass (SDW), Sebatel, J. Khetifa, Pelsodur and Vulci maintained significantly higher SDW than Cham1 and Azeghar under drought conditions. That means that these genotypes are more tolerant to drought according to their successful development of shoots under stress conditions.
3.2. Drought Effect on Whole Root System in Greenhouse Experiment
Under control conditions, no significant differences between genotypes for some root traits, such as total root length (RLW), root surface area (SAW), root tips (TIW), and root length density (RLD), were found. However, the effect of recurrent short events of drought was significant and varied between genotypes (Table 2).
The RLW of Azeghar shortened by about 40% in drought compared with control (Table 2), while, Pelsodur, which had the lowest RLW under control conditions, grew slightly during the drought and had the longest roots. RLW decreased by about 23% in Vulci and Cham1, while in J. Khetifa it was most stable, having the smallest difference between drought and control (Table 2). The root surface area (SAW) appeared to be a quite important characteristic, as it has a crucial role for water and nutrition uptake efficiency. Interestingly, no significant differences were detected between genotypes for SAW under control conditions (Table 2). Contrarily, drought affected the root surface area in the different genotypes differently. Pelsodur maintained the highest value of SAW, while Azeghar the lowest. Significant differences clustered genotypes into those with higher (Pelsodur, Vulci, and J. Khetifa) and those with lower (Azeghar, Cham1, and Sebatel) root surface area under drought, where two putative hydric stress-tolerant genotypes J. Khetifa and Cham 1 were separated. In addition, it was observed that genotypes were allocated into the same groups according to phenological development under control conditions. Cham1 was assigned to the early flowering group together with Sebatel and Azeghar. Tolerant landrace J. Khetifa showed a late flowering habit and was grouped with late Pelsodur and Vulci. No significant differences were detected between genotypes for RLD (Table 2). However, root length density was affected by drought. The trends indicated that J. Khetifa and Pelsodur were affected the least, and maintained the highest RLD. Meanwhile, the RLD of Azeghar was above 40 percent, and it had the lowest RLD in drought conditions.
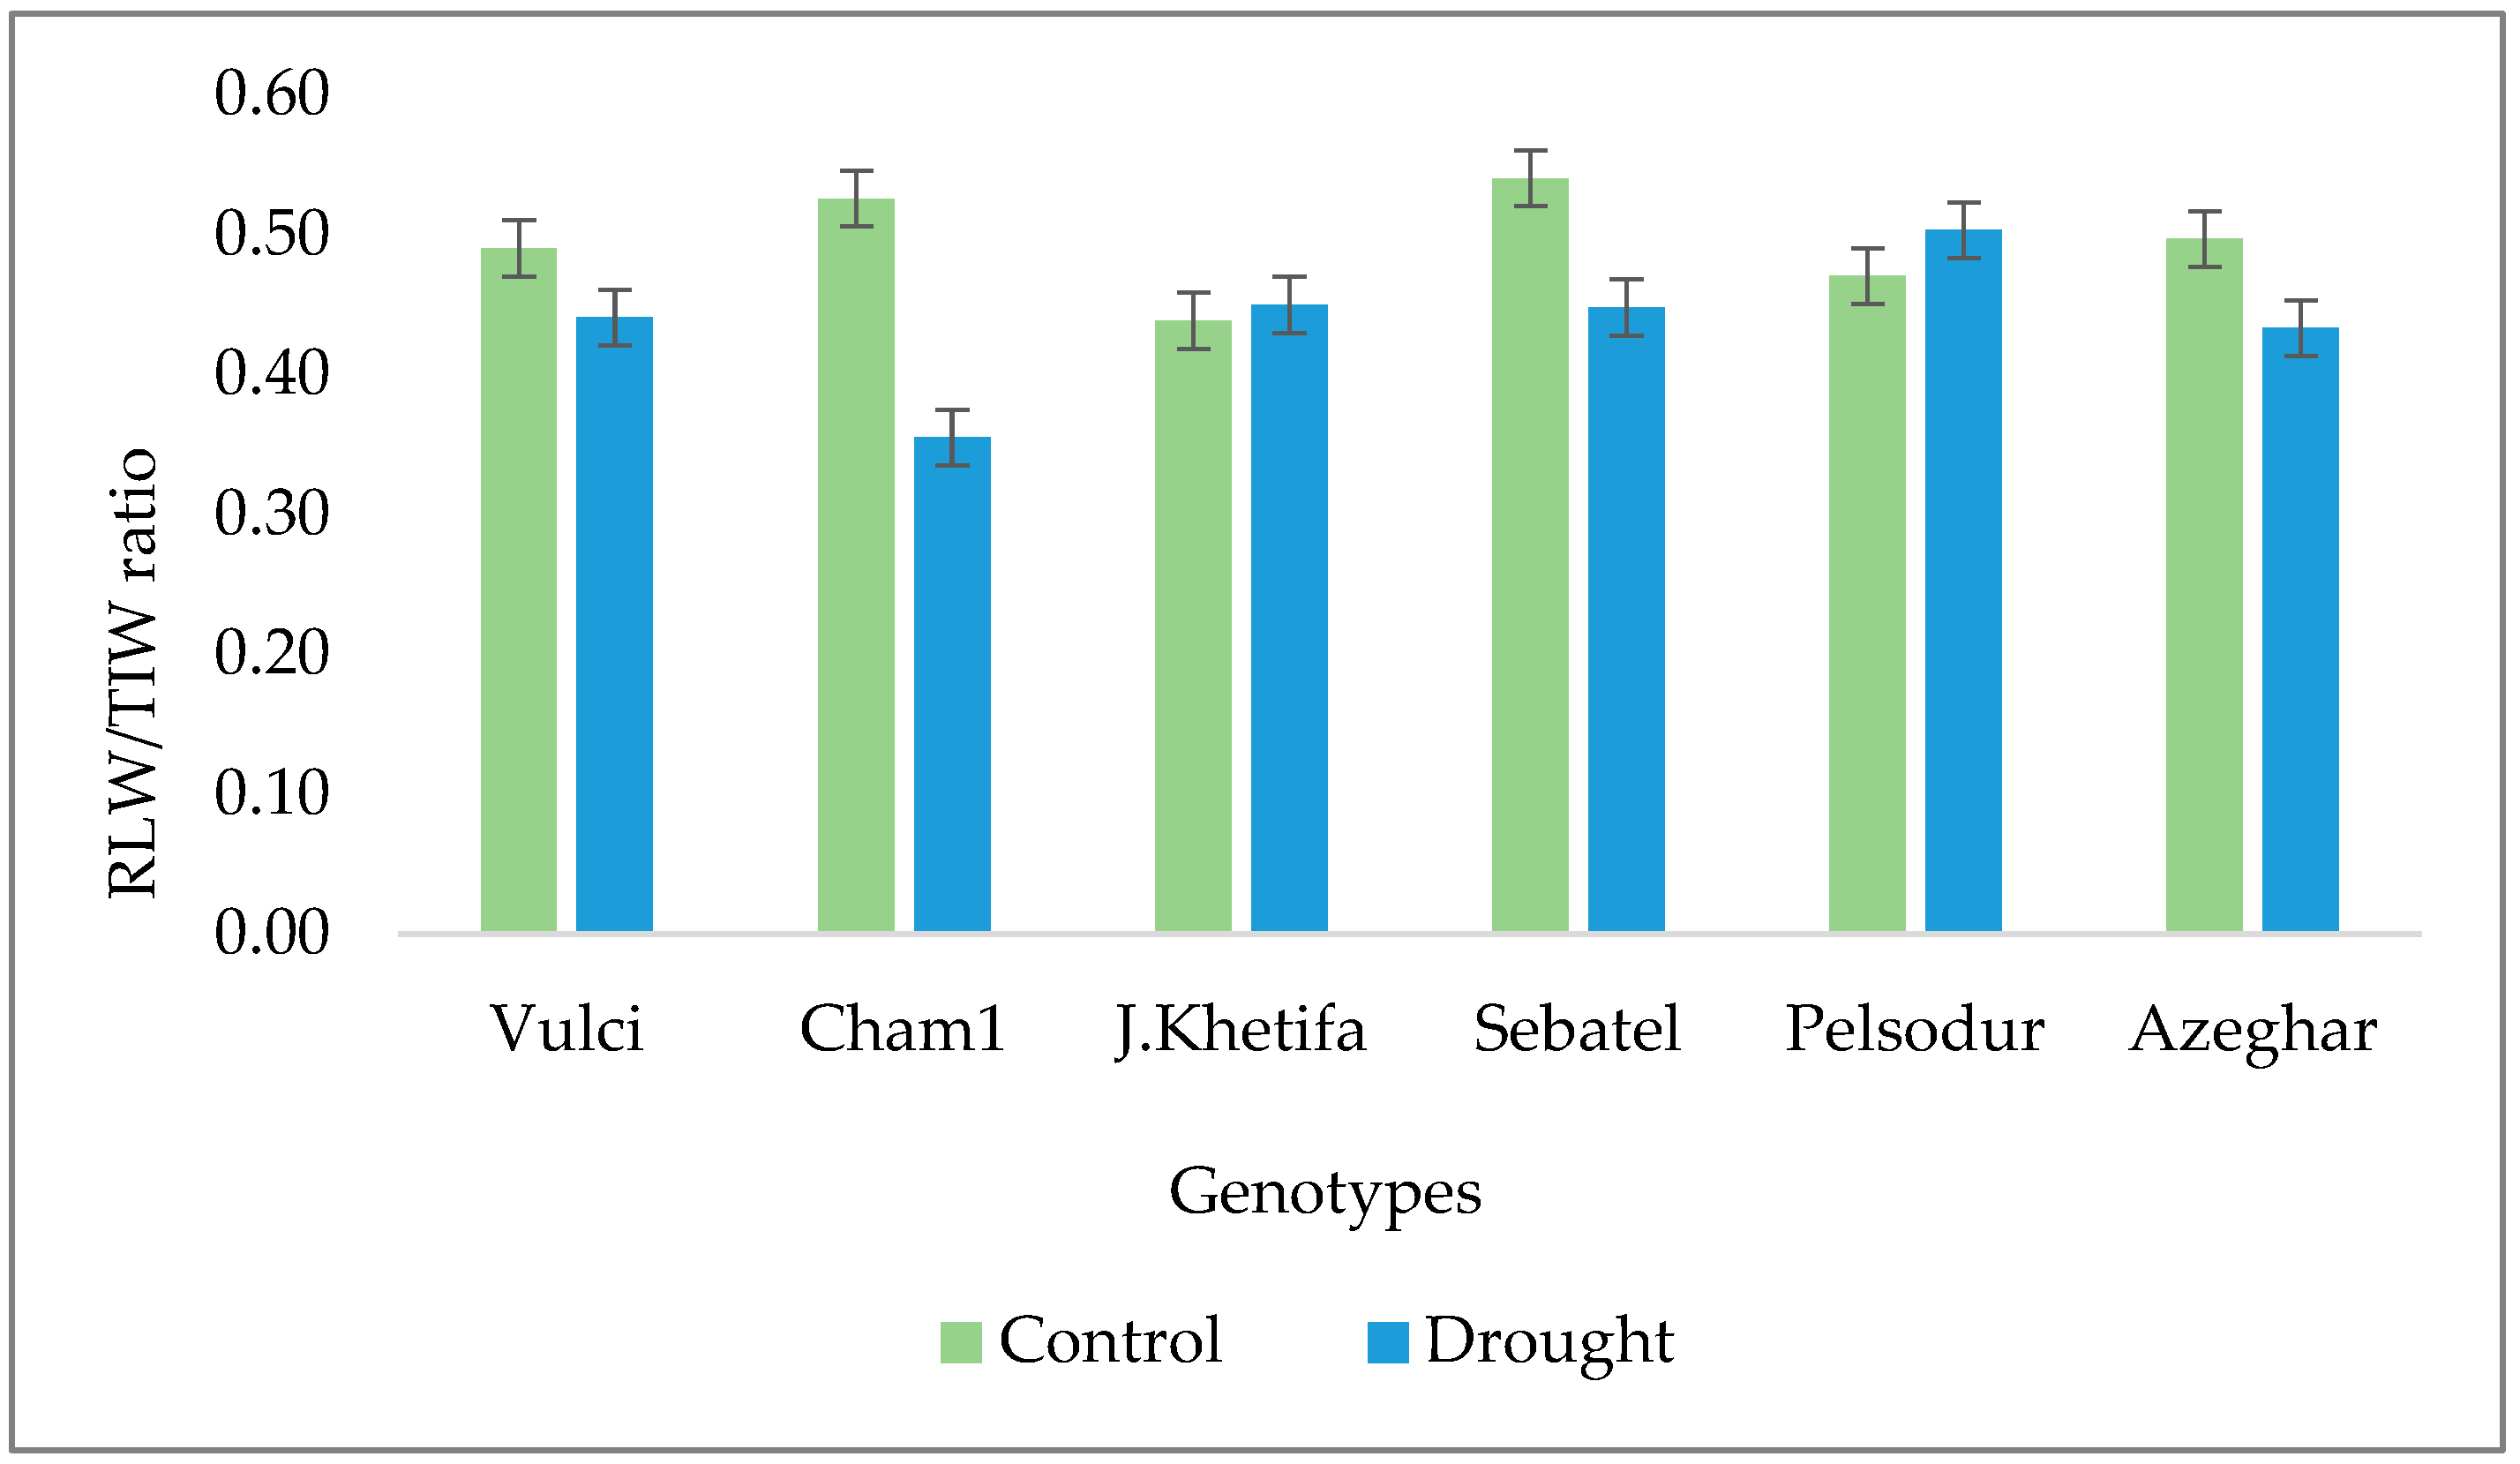
Highly significant differences among genotypes and treatments were obtained for total root volume (RVW). Under control conditions, J. Khetifa and Vulci had significantly larger RVW compared to other genotypes (Table 2). However, under drought conditions, Pelsodur maintained the highest RVW, while Azeghar experienced great losses and had the lowest RVW. Genotypes were divided by root volume values under drought treatment into three groups; (i) Pelsodur, Vulci and J. Khetifa, with a root volume over 2 cm3; (ii) Cham1 and Sebatel, with RVW less than 2 cm3; while (iii) Azeghar was less than 1 cm3 (Table 2). Drought effects also varied between genotypes in terms of number of tips (TIW). Although Sebatel and Pelsodur had the lowest number of tips under control conditions, under drought TIW remained the same. Azeghar had highest TIW losses (around 33.9%), followed by Vulci (−14.4%) and J. Khetifa (−9%), while only Cham1 increased the number of TIW (+14%) under drought conditions. According to the ratio of root length by the number of tips (RLW/TIW), J. Khetifa and Pelsodur had the smallest drought effect on both, growing new roots and maintaining the root length (Figure 4). However, Cham1 and Sebatel increased the number of new roots under drought conditions, since the RLW/TIW ratio decreased from 33% to 17% (Figure 4).
The short drought events had a significant negative effect on root biomass (RDW), even if the effect was different among genotypes. Under control conditions, J. Khetifa and Cham1 produced the highest root biomass, but Pelsodur, Vulci, and J. Khetifa had the highest root mass under drought. Azeghar had the lowest root biomass under both conditions. Genotypes could be distinguished by different root system angles, where Azeghar had the widest root angle, J. Khetifa, and Pelsodur the steepest, and Vulci, Sebatel, and Cham1 were of medium root angle. However, there were highly significant differences between genotypes and their response, as indicated by the significant interaction (G × T) (Table 2). The RA of Azeghar and Vulci narrowed, passing from control to drought, while in all other genotypes it flattened (Table 2). According to RDW and root system angle, six investigated genotypes showed five root ideotypes under control (C) conditions. These are: (iC) widest angle and lowest root biomass (i.e., Azeghar); (iiC) moderate root angle moderate biomass (i.e., Sebatel and Vulci); (iiiC) moderate root angle and high biomass (i.e., Cham1); (ivC) narrow root angle moderate biomass (i.e., Pelsodur); and (vC) narrow root angle high biomass (i.e., J. Khetifa). However, under drought (D) conditions, four root ideotypes were highlighted according to the same traits, root angle and biomass. These are: (iD) widest root angle and retained moderate root biomass (i.e., Sebatel and Cham1); (iiD) moderate root angle and low root biomass (i.e., Azeghar); (iiiD) moderate root angle and high root biomass (i.e., J. Khetifa, and Vulci); and (ivD), narrowest root angle and high root biomass (i.e., Pelsodur). In terms of overall plant development, as shown by the proportion of shoots and roots, three groups were highlighted under drought stress. (i) Pelsodur with Vulci had the highest root shoot ratio, (ii) Sebatel with Azeghar had the lowest, and (iii) two tolerant genotypes, J. Khetifa with Cham1, fell in between.
3.3. Drought Effect on Root Parameters at Topsoil in Greenhouse Experiment
At a depth of the first 5 cm, the total root length (RL5) had no significant differences between genotypes under control conditions (Table 3), just like the total length of the whole root (Table 2).
In order to determine the peculiarities of rooting in different soil layers, the ratio between the root traits was also recorded on the whole root and the ones recorded on the topsoil layer (first 5 cm) were calculated and expressed as a percentage. Under drought, the root reduction in the different layers varied among genotypes, while at 5 cm topsoil the total root length significantly increased for J. Khetifa, Pelsodur, and Sebatel. The largest decrease of RL5 was found in Azeghar (about 30%), then in Cham1 (about 17%). Vulci remained almost the same RL5 under drought as under control conditions. According to the RL5/RLW ratio, in the first 5 cm below ground, the root length ranged from 10 to 16 percent of the whole root length under control conditions, while under drought it increased (from 15 to 25%); indicating a higher root concentration in the first soil layer.
Nevertheless, the effect of drought on root length distribution in different layers varied among genotypes, even if not statistically. According to the RL5/RLW ratio, J. Khetifa, Sebatel, and Pelsodur showed an increase of root length at topsoil under drought conditions, which almost doubled, while Cham1 maintained almost the same root distribution between layers under both conditions. Although the effect of drought on the roots length at different depths varied, all genotypes under drought conditions have increased concentration of the roots at topsoil (Table 3). The number of TI5 at a depth of first 5 cm (TI5, Table 3) had no significant differences between genotypes under control conditions, but the response to drought showed Azeghar to have the lowest tip number. Under stress conditions, Azeghar lost about 50% of TI5, while other genotypes increased it, especially J. Khetifa and Sebatel, where TI5 doubled. Regarding the ratio between root length and number of TI5 at the first 5 cm below ground (RL5/TI5), some genotypes maintained the same pattern under drought as the ratio of the whole plant (RLW/TIW) (Figure 4). J. Khetifa had the smallest drought effect on developing new roots and maintaining the length in both the upper and deeper layers of the soil (Table 3). Sebatel, in contrast, showed smaller changes at the topsoil level. Interestingly, Azeghar applied different strategies at different layers; when the whole plant RLW/TIW ratio decreased, at the topsoil level this ratio (RL5/TI5) increased. According to ratio SAW/SA5, at a depth of five centimeters under control conditions, the surface area (SA5) accounted for 15 to 20 percent of the whole root SAW, where Vulci had the highest SA5 and Azeghar with Sebatel had the lowest SA5. Under drought conditions the ratio SAW/SA5 increased (about 17 to 30%) and varied between genotypes (Table 3). Pelsodur, Sebatel, J. Khetifa, and Vulci maintained significantly higher SA5 compared with Azeghar and Cham1. The smallest changes in SA5 between control and drought conditions were observed for Sebatel.
Comparing the distribution of SAW under drought conditions among soil layers, the smallest changes in the SA5/SAW ratio were found for Pelsodur, Cham1, and Vulci. Furthermore, drought root volume at a depth of the first 5 cm (RV5) significantly decreased. Also, the distribution of root volume among layers varied between genotypes. Sebatel had the most concentrated root volume at 5 cm depth under drought conditions (Table 3). Moreover, Azeghar and Cham1 also increased RV5 concentration at topsoil under drought, while J. Khetifa, Vulci, and Pelsodur maintained a higher volume of the whole root systems.
3.4. The Comparison of Root System between Greenhouse and Field
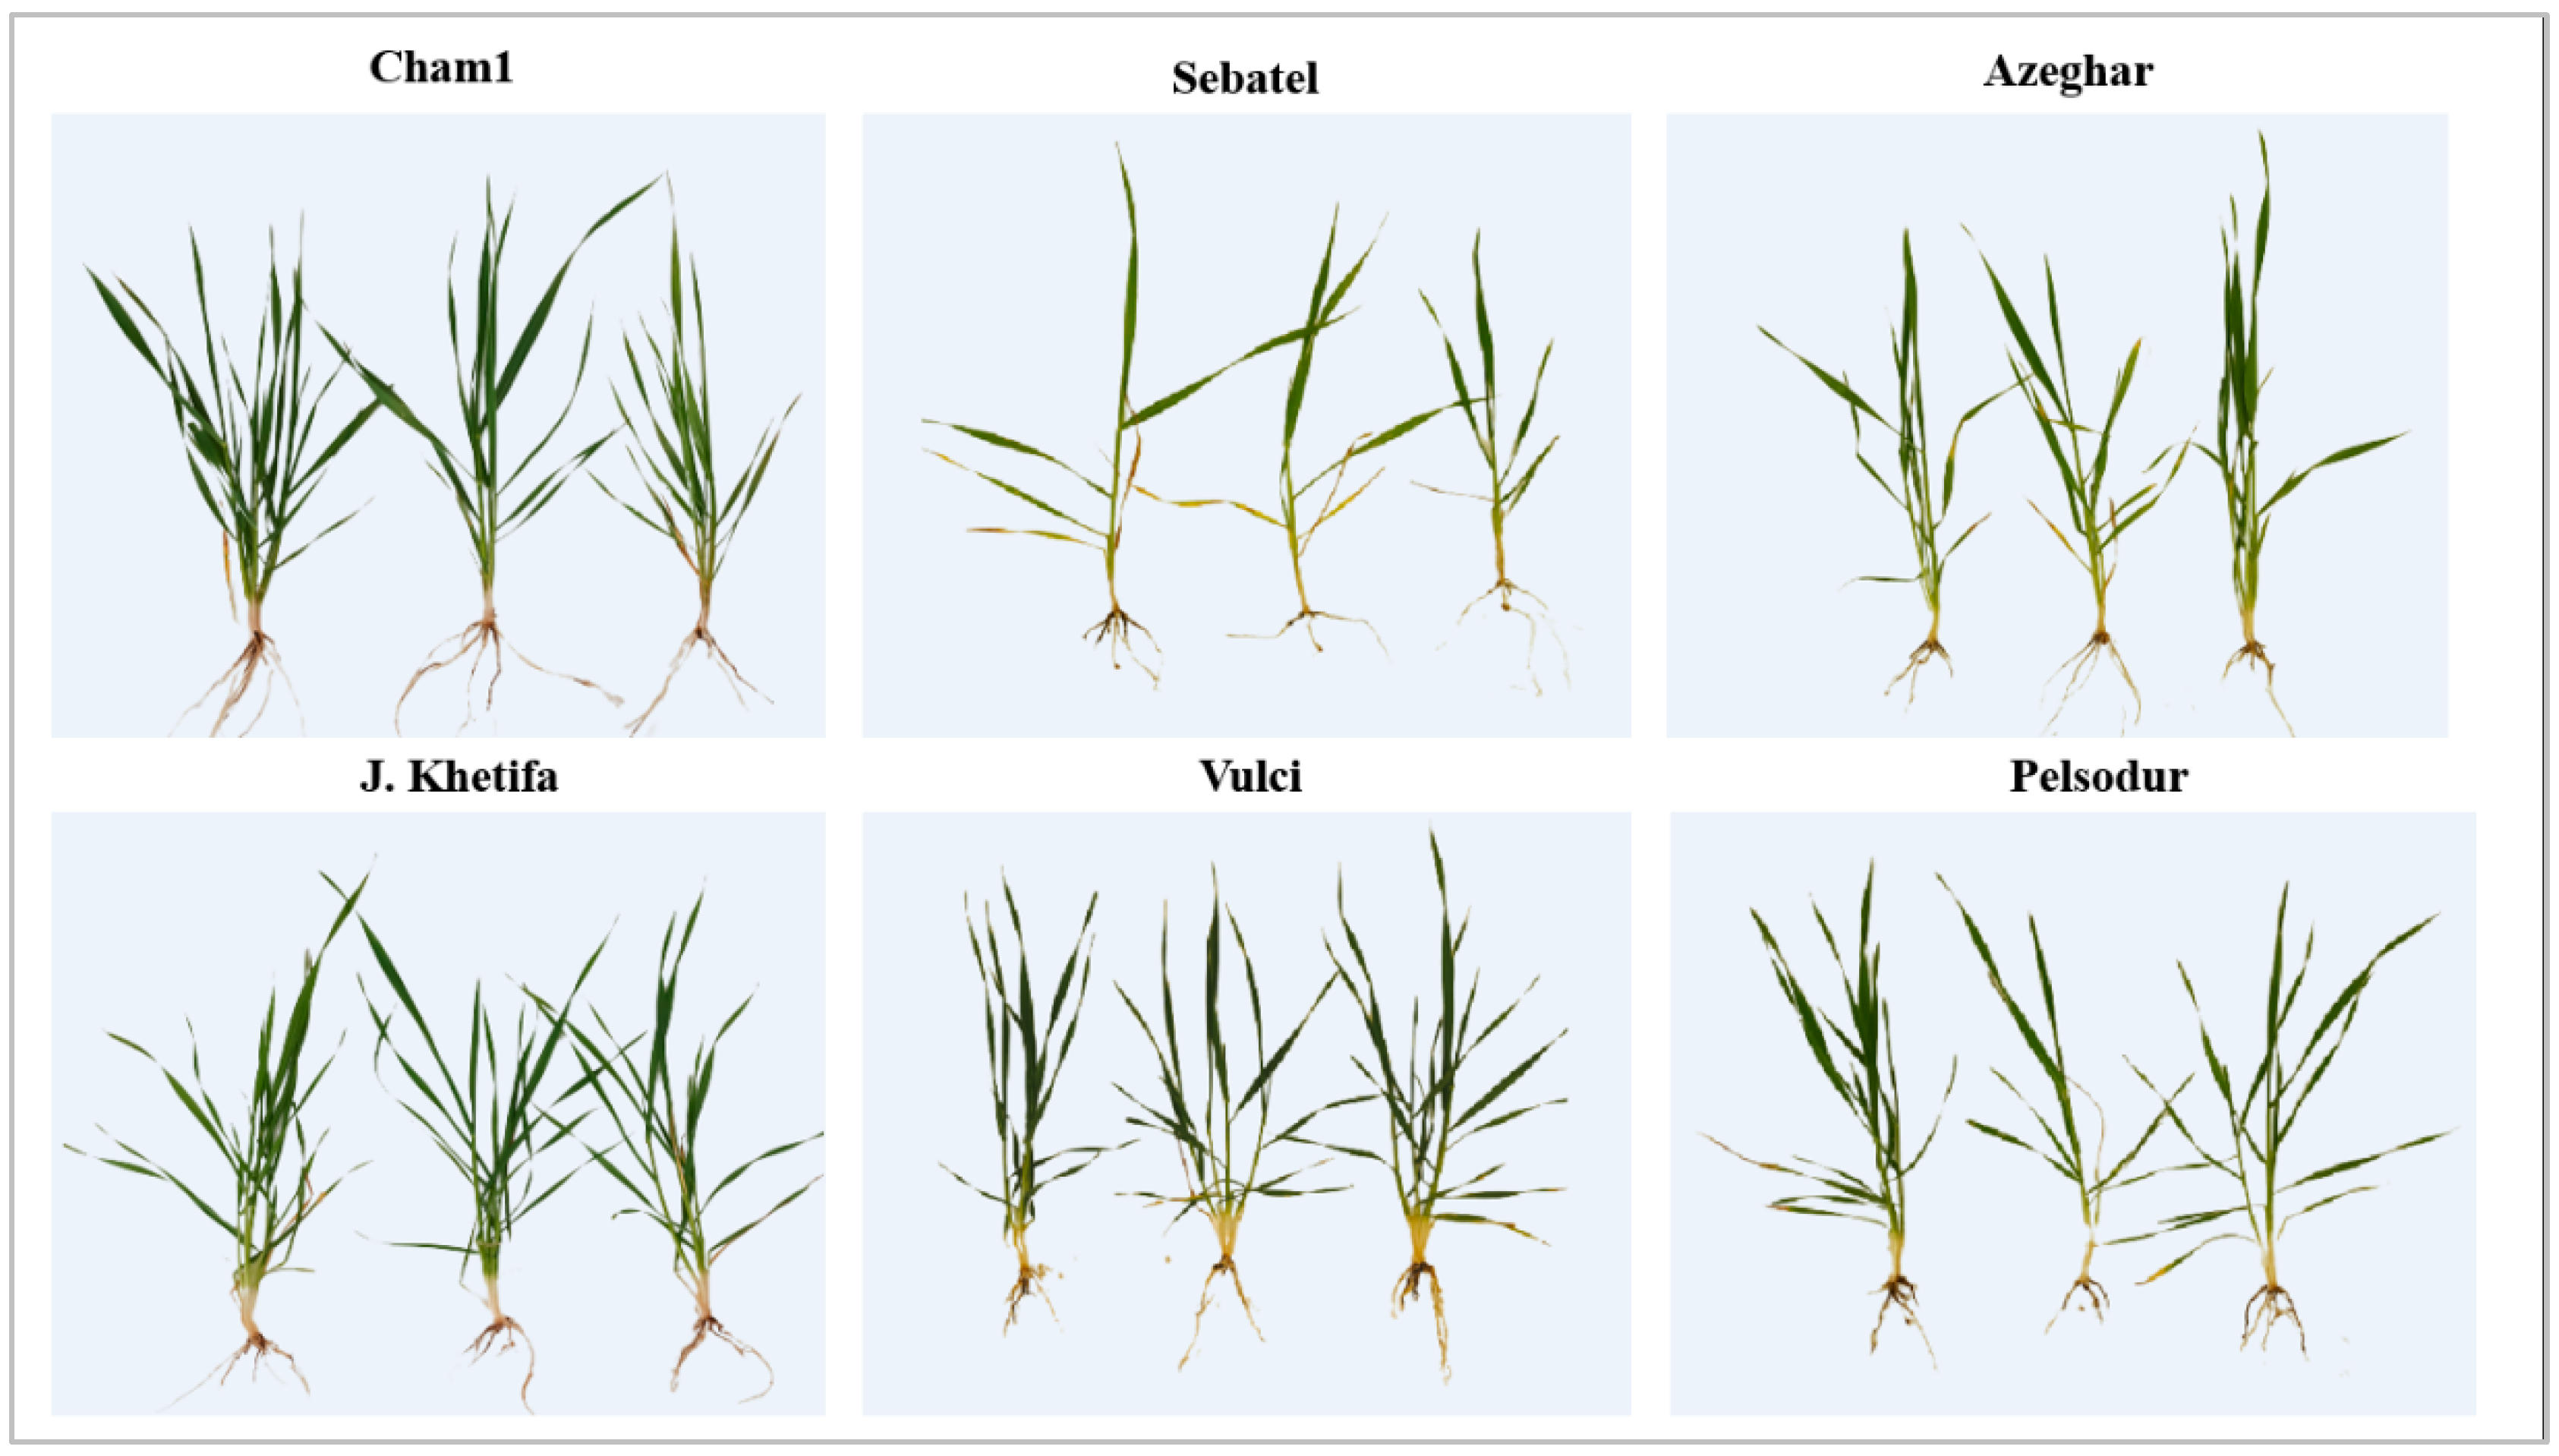
The total root volume (RVF) and the number of crossings (CRF) of plants collected from field experiments, at a depth of first 5 cm (Figure 5) had no significant differences between genotypes (Table 4). However, the two tolerant genotypes, Cham1 and J. Khetifa, had significantly higher root length (RLF) and root surface area (SAF). J. Khetifa also had a significantly higher number of root tips (TIF) and forks (FRF).
The comparison between genotype root angles, measured using ImageJ software in the greenhouse under control condition and in the field, showed the same trend, where Azeghar had the widest root angle, J. Khetifa and Pelsodur the steepest, and Sebatel and Cham1 were between wide and narrow (Table 2 and Table 4).
Although all genotypes showed lower values of root angle in the field than in the greenhouse, Vulci had the greatest differences compared with control conditions in the greenhouse, where the root angle was wider. This could be explained by the fact that the plants were grown by a single plant per pot in a greenhouse, without any competition, unlike in the field, where the plants were sown in dense conditions.
3.5. Correlation among Traits
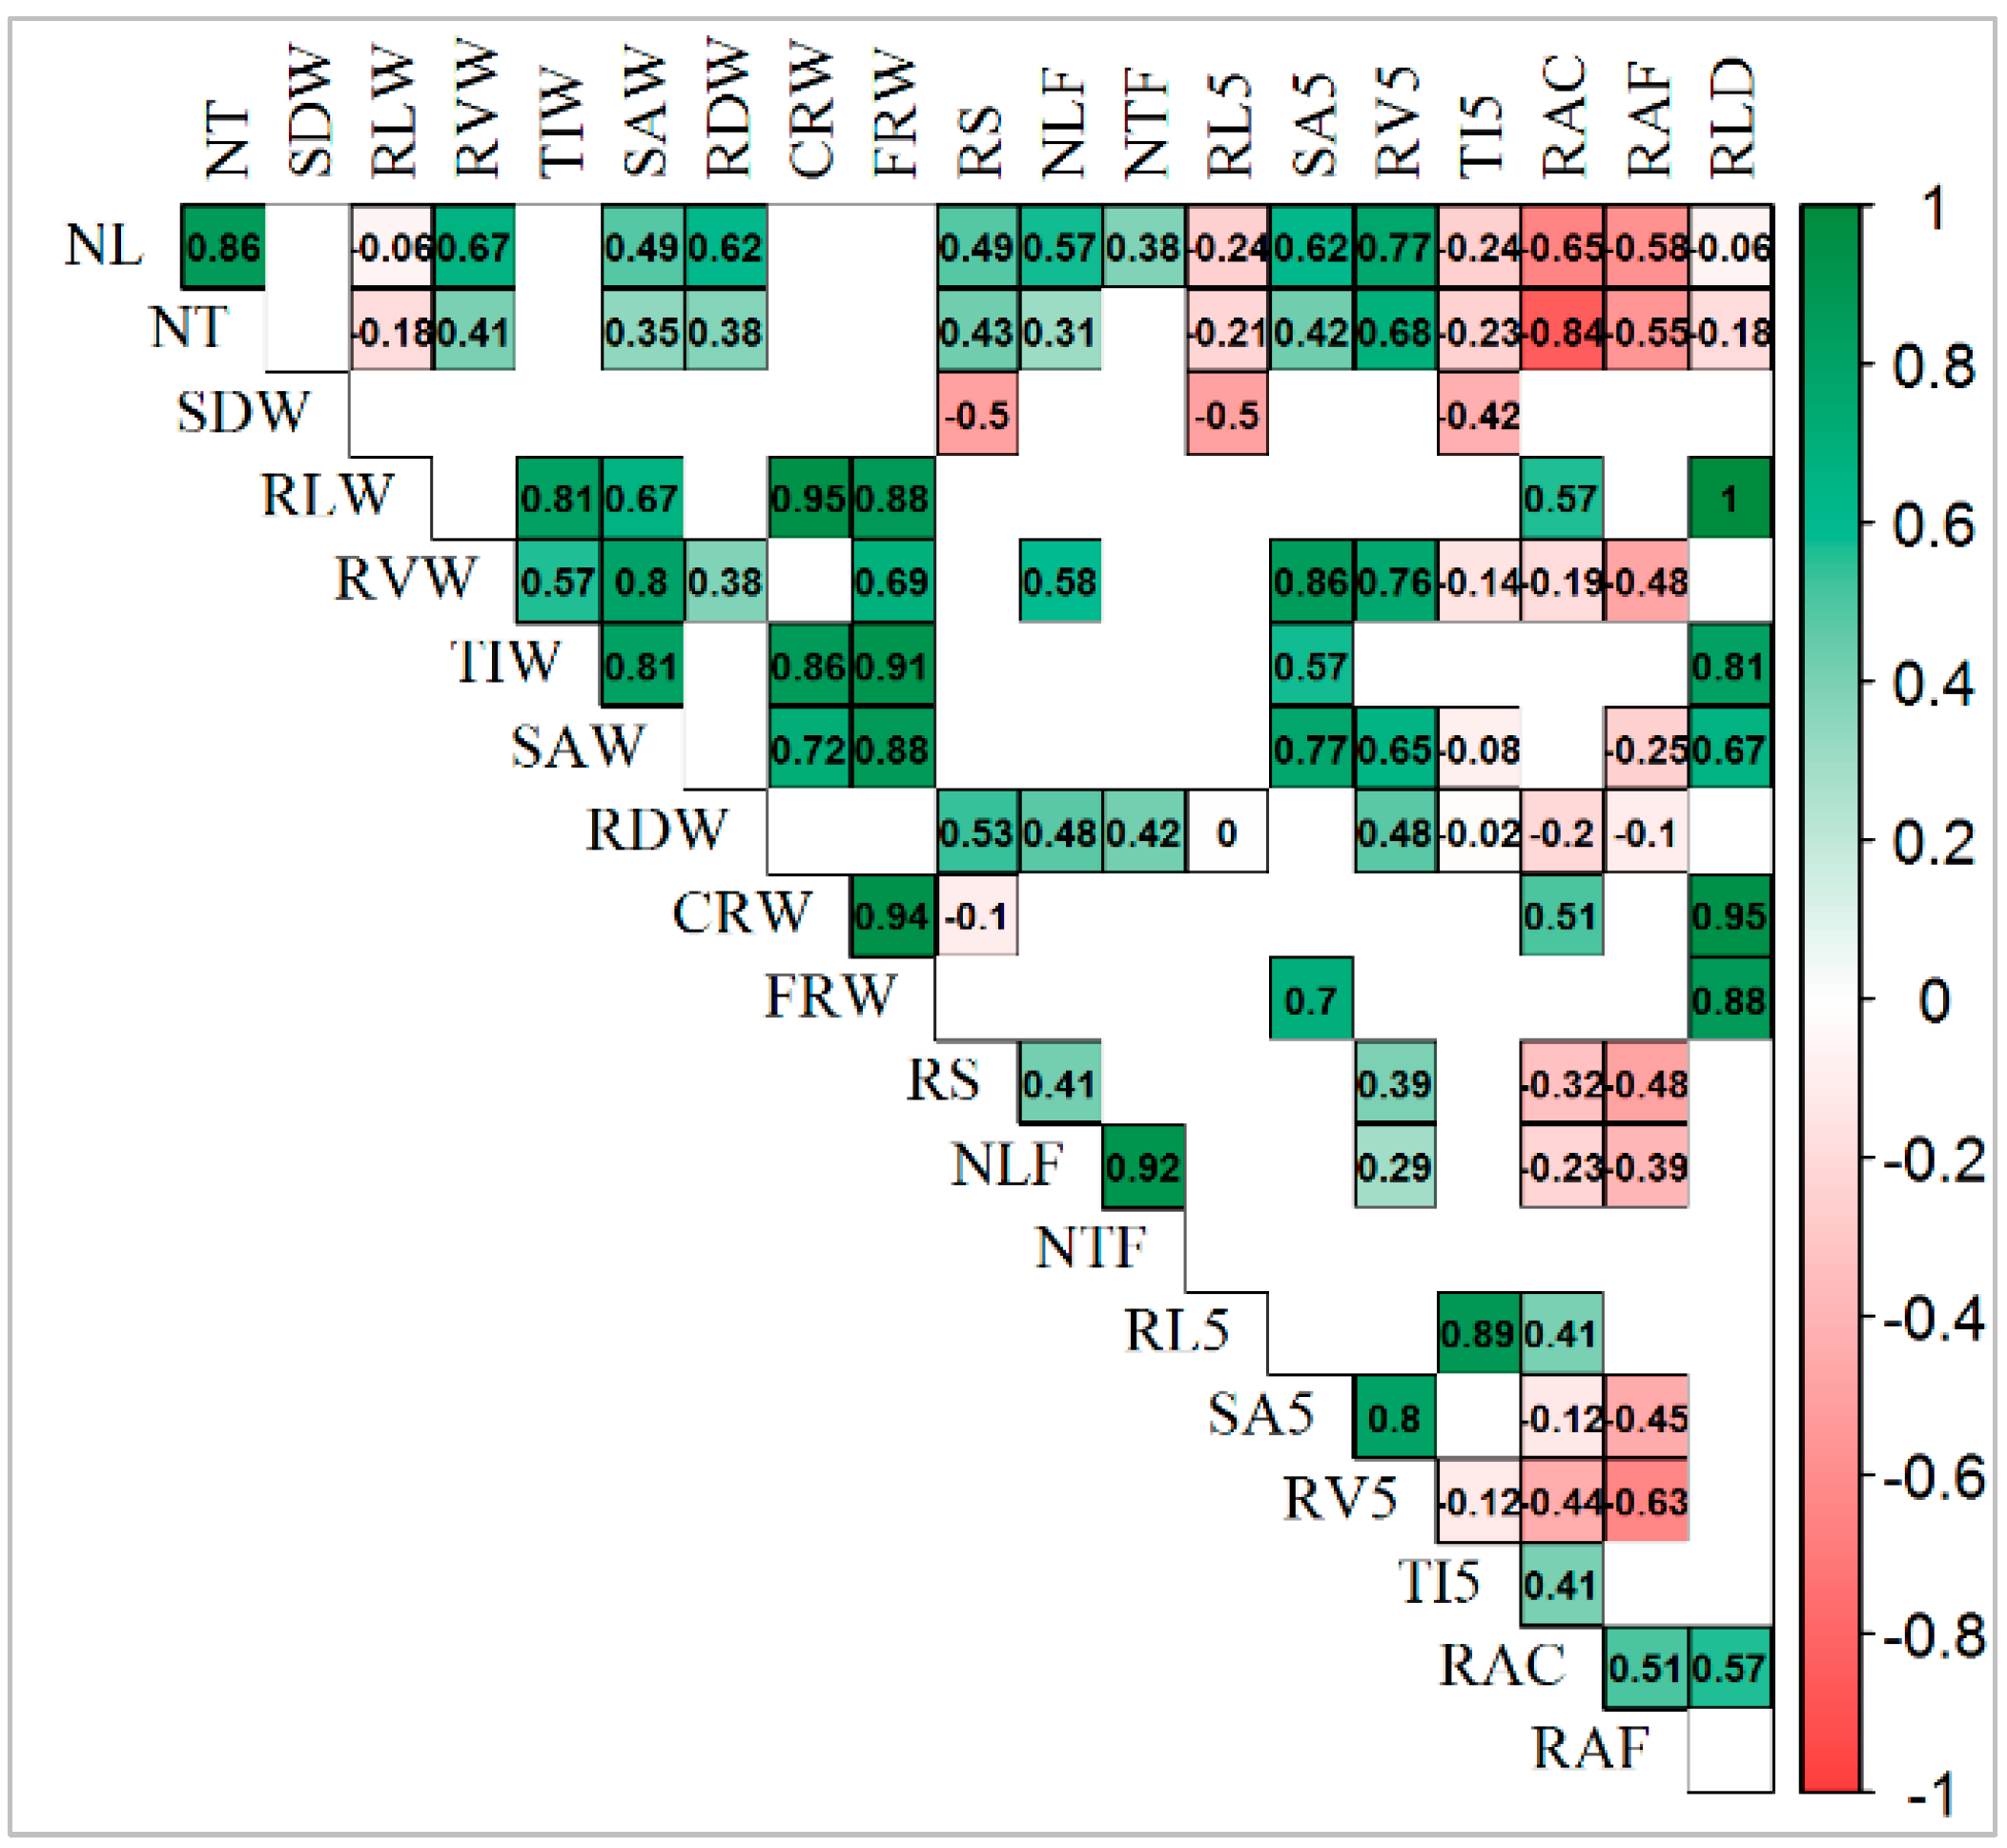
The correlation matrix among traits under the control condition (Figure 6) shows that the number of leaves (NL) and number of tillers (NT) had a highly significant positive correlation between themselves and the root volume at topsoil (RV5). Moreover, a significant positive correlation was found for traits such as root shoot ratio (RS), root dry weight (RDW), root volume (RVW), and root surface area (SAW; SA5).
Furthermore, both NL and NT had highly significant negative correlation with root angle under both greenhouse (RAC) and field conditions (RAF). Root length (RLW) under control conditions had a highly significant positive correlation with root angle (RA), number of leaves (NL), and number of root elements such as tips (TIW), forks (FRW), and crosses (CRW). Root volume (RVW) under control conditions had a highly significant positive correlation with RV5, SAW, SA5, and FRW.
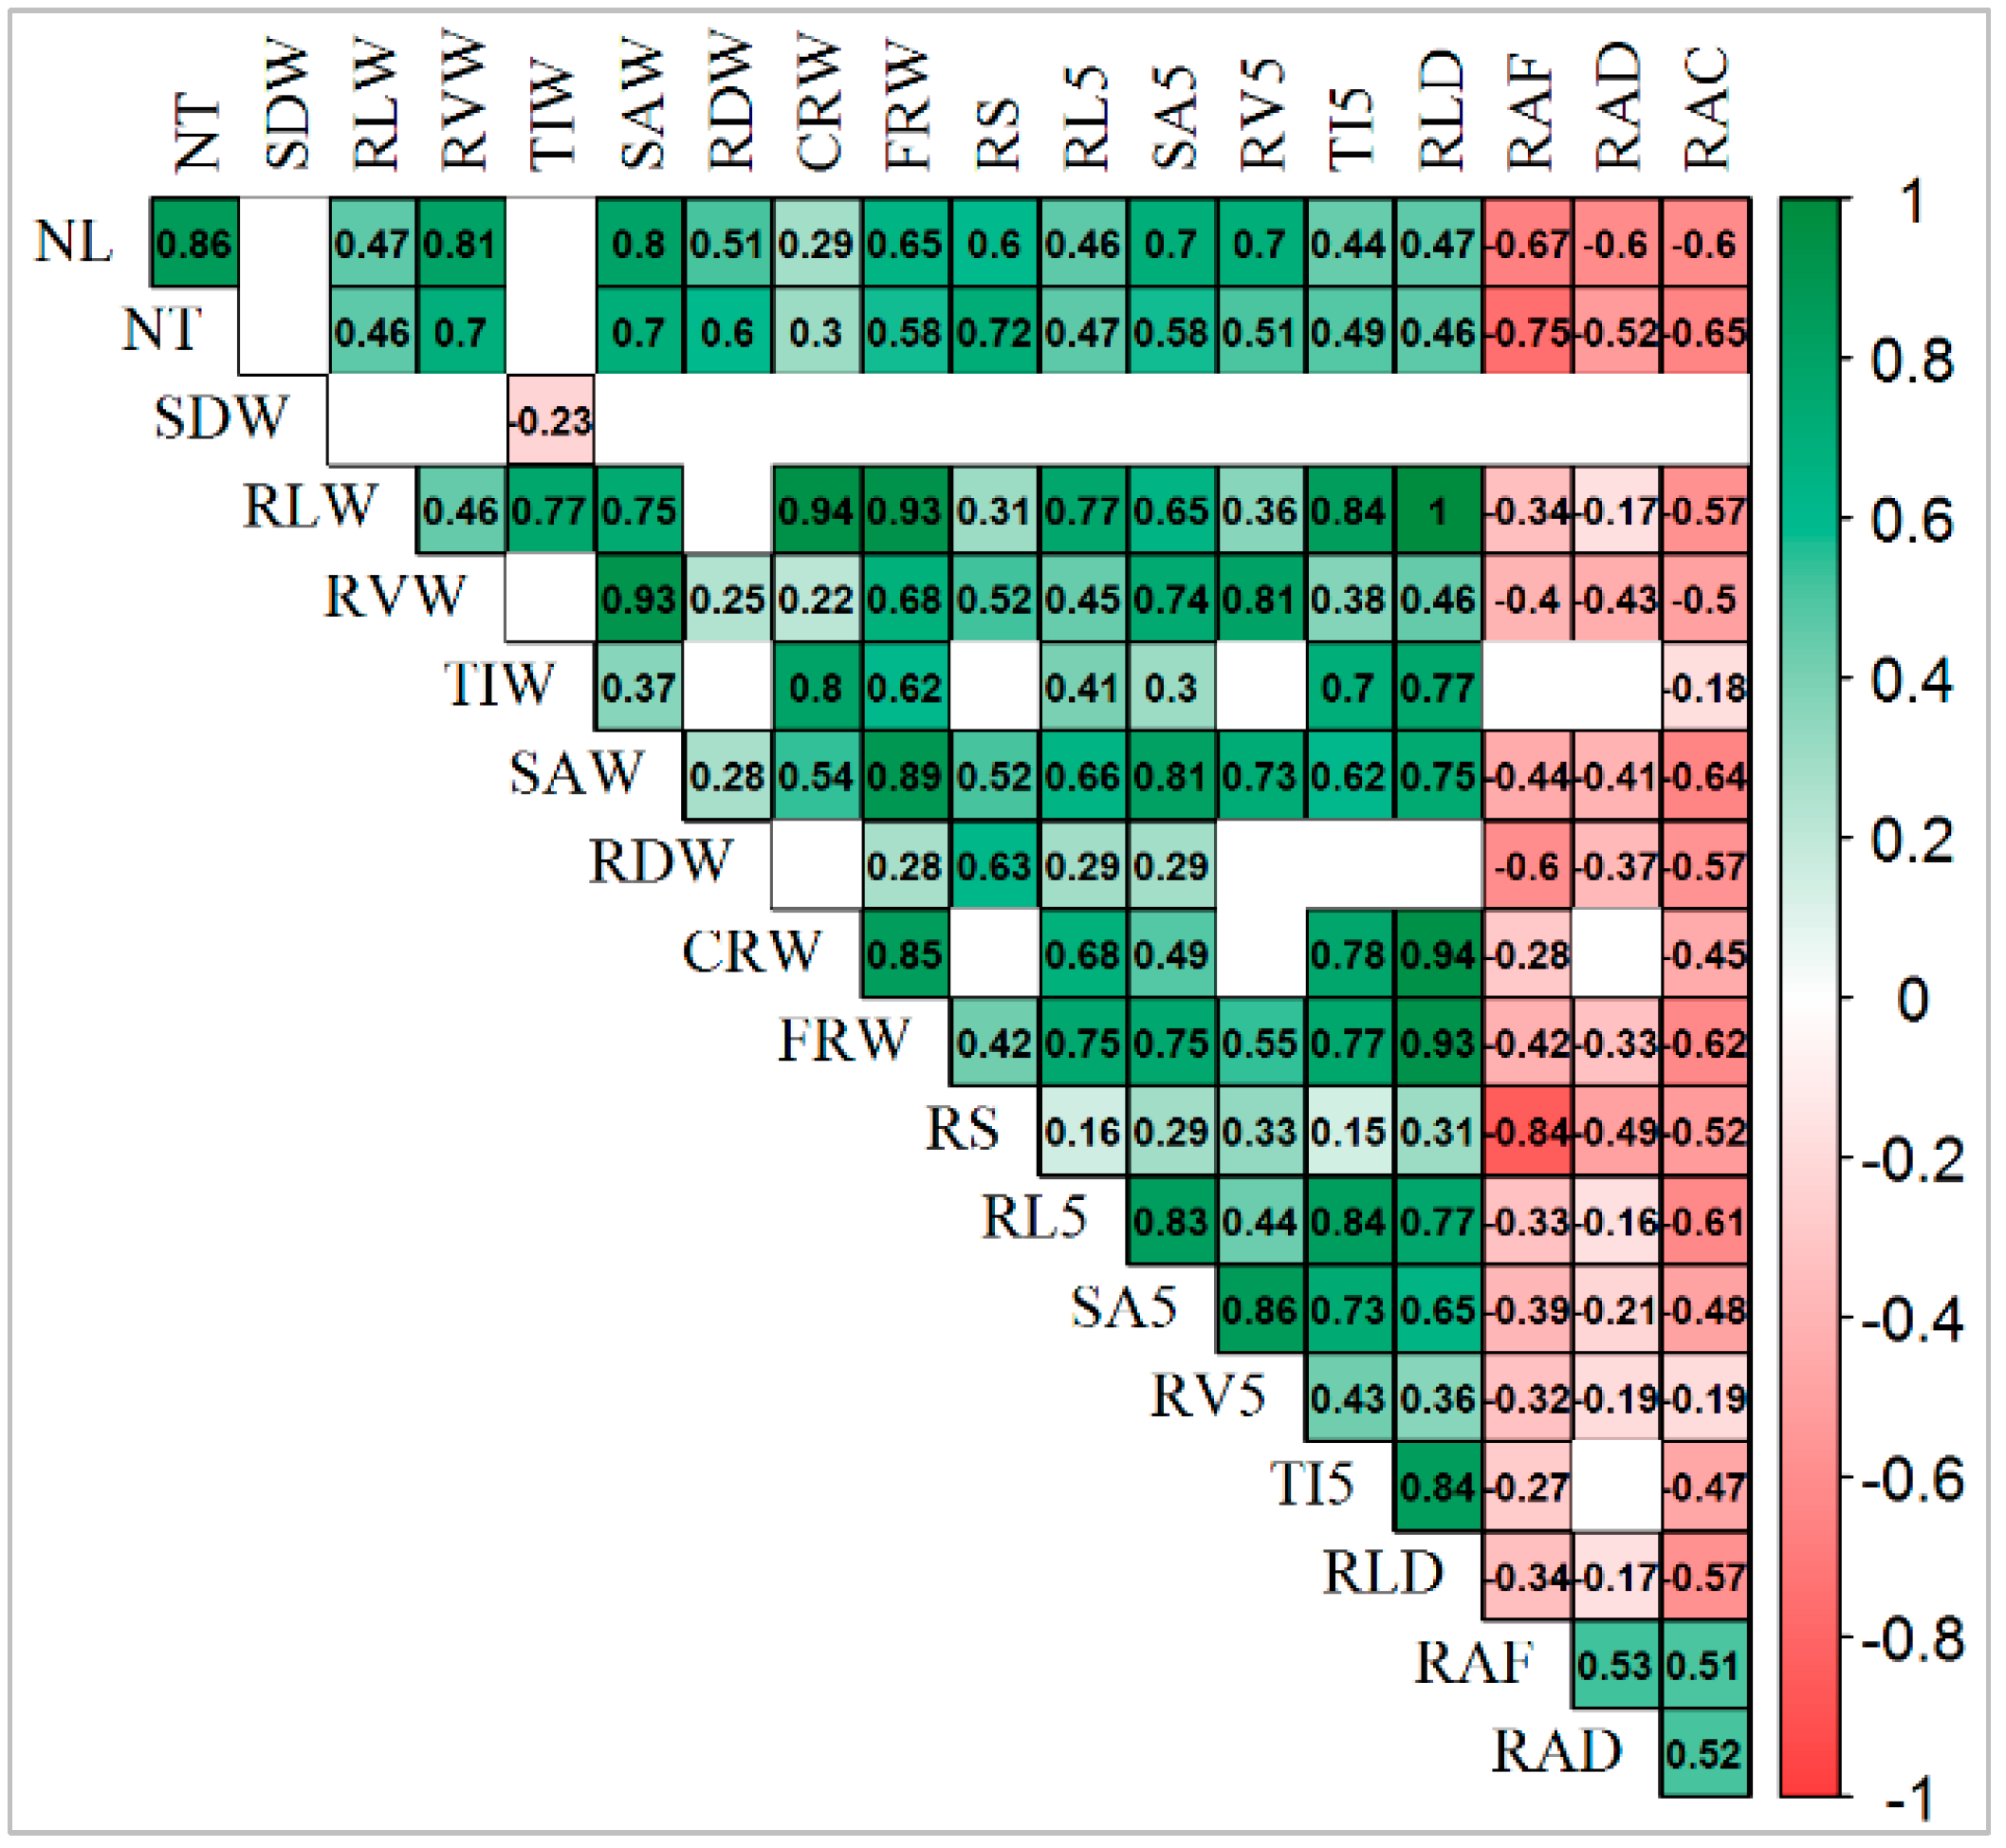
Interesting results were found in the relation between traits under drought conditions and root system angle under all conditions: control (RAC), drought (RAD), and field (RAF) (Figure 7). For example, between almost all traits, statistically positive significant correlations were obtained, except shoot biomass (SDW), and root angle under all conditions, which had a significant negative correlation. However, root angles from all conditions (RAC, RAD, and RAF), had a significant positive correlation between each other and showed a similar trend in the relation with other traits such as a significant negative correlation with almost all traits under drought conditions (Figure 7). Furthermore, a significant negative correlation (−0.57) between root angle under control (RAC) and root length under drought stress (RLW) was obtained, which means that genotypes with a narrower root angle in control conditions retained longer roots in water deficit environments. Moreover, a significant negative correlation was obtained between the root angle of plants under all conditions (control, drought, and field) and plants root biomass under drought conditions (RDW), which means that genotypes with a narrower root angle can grow higher root biomass. Highly statistically (p < 0.001) significant positive correlations were detected between the main traits of the whole root system and topsoil, such as RL and RL5 (0.8), RV and RV5 (0.8), SA and SA5 (0.8), TI and TI5 (0.7).
3.6. PCA in Response to Drought
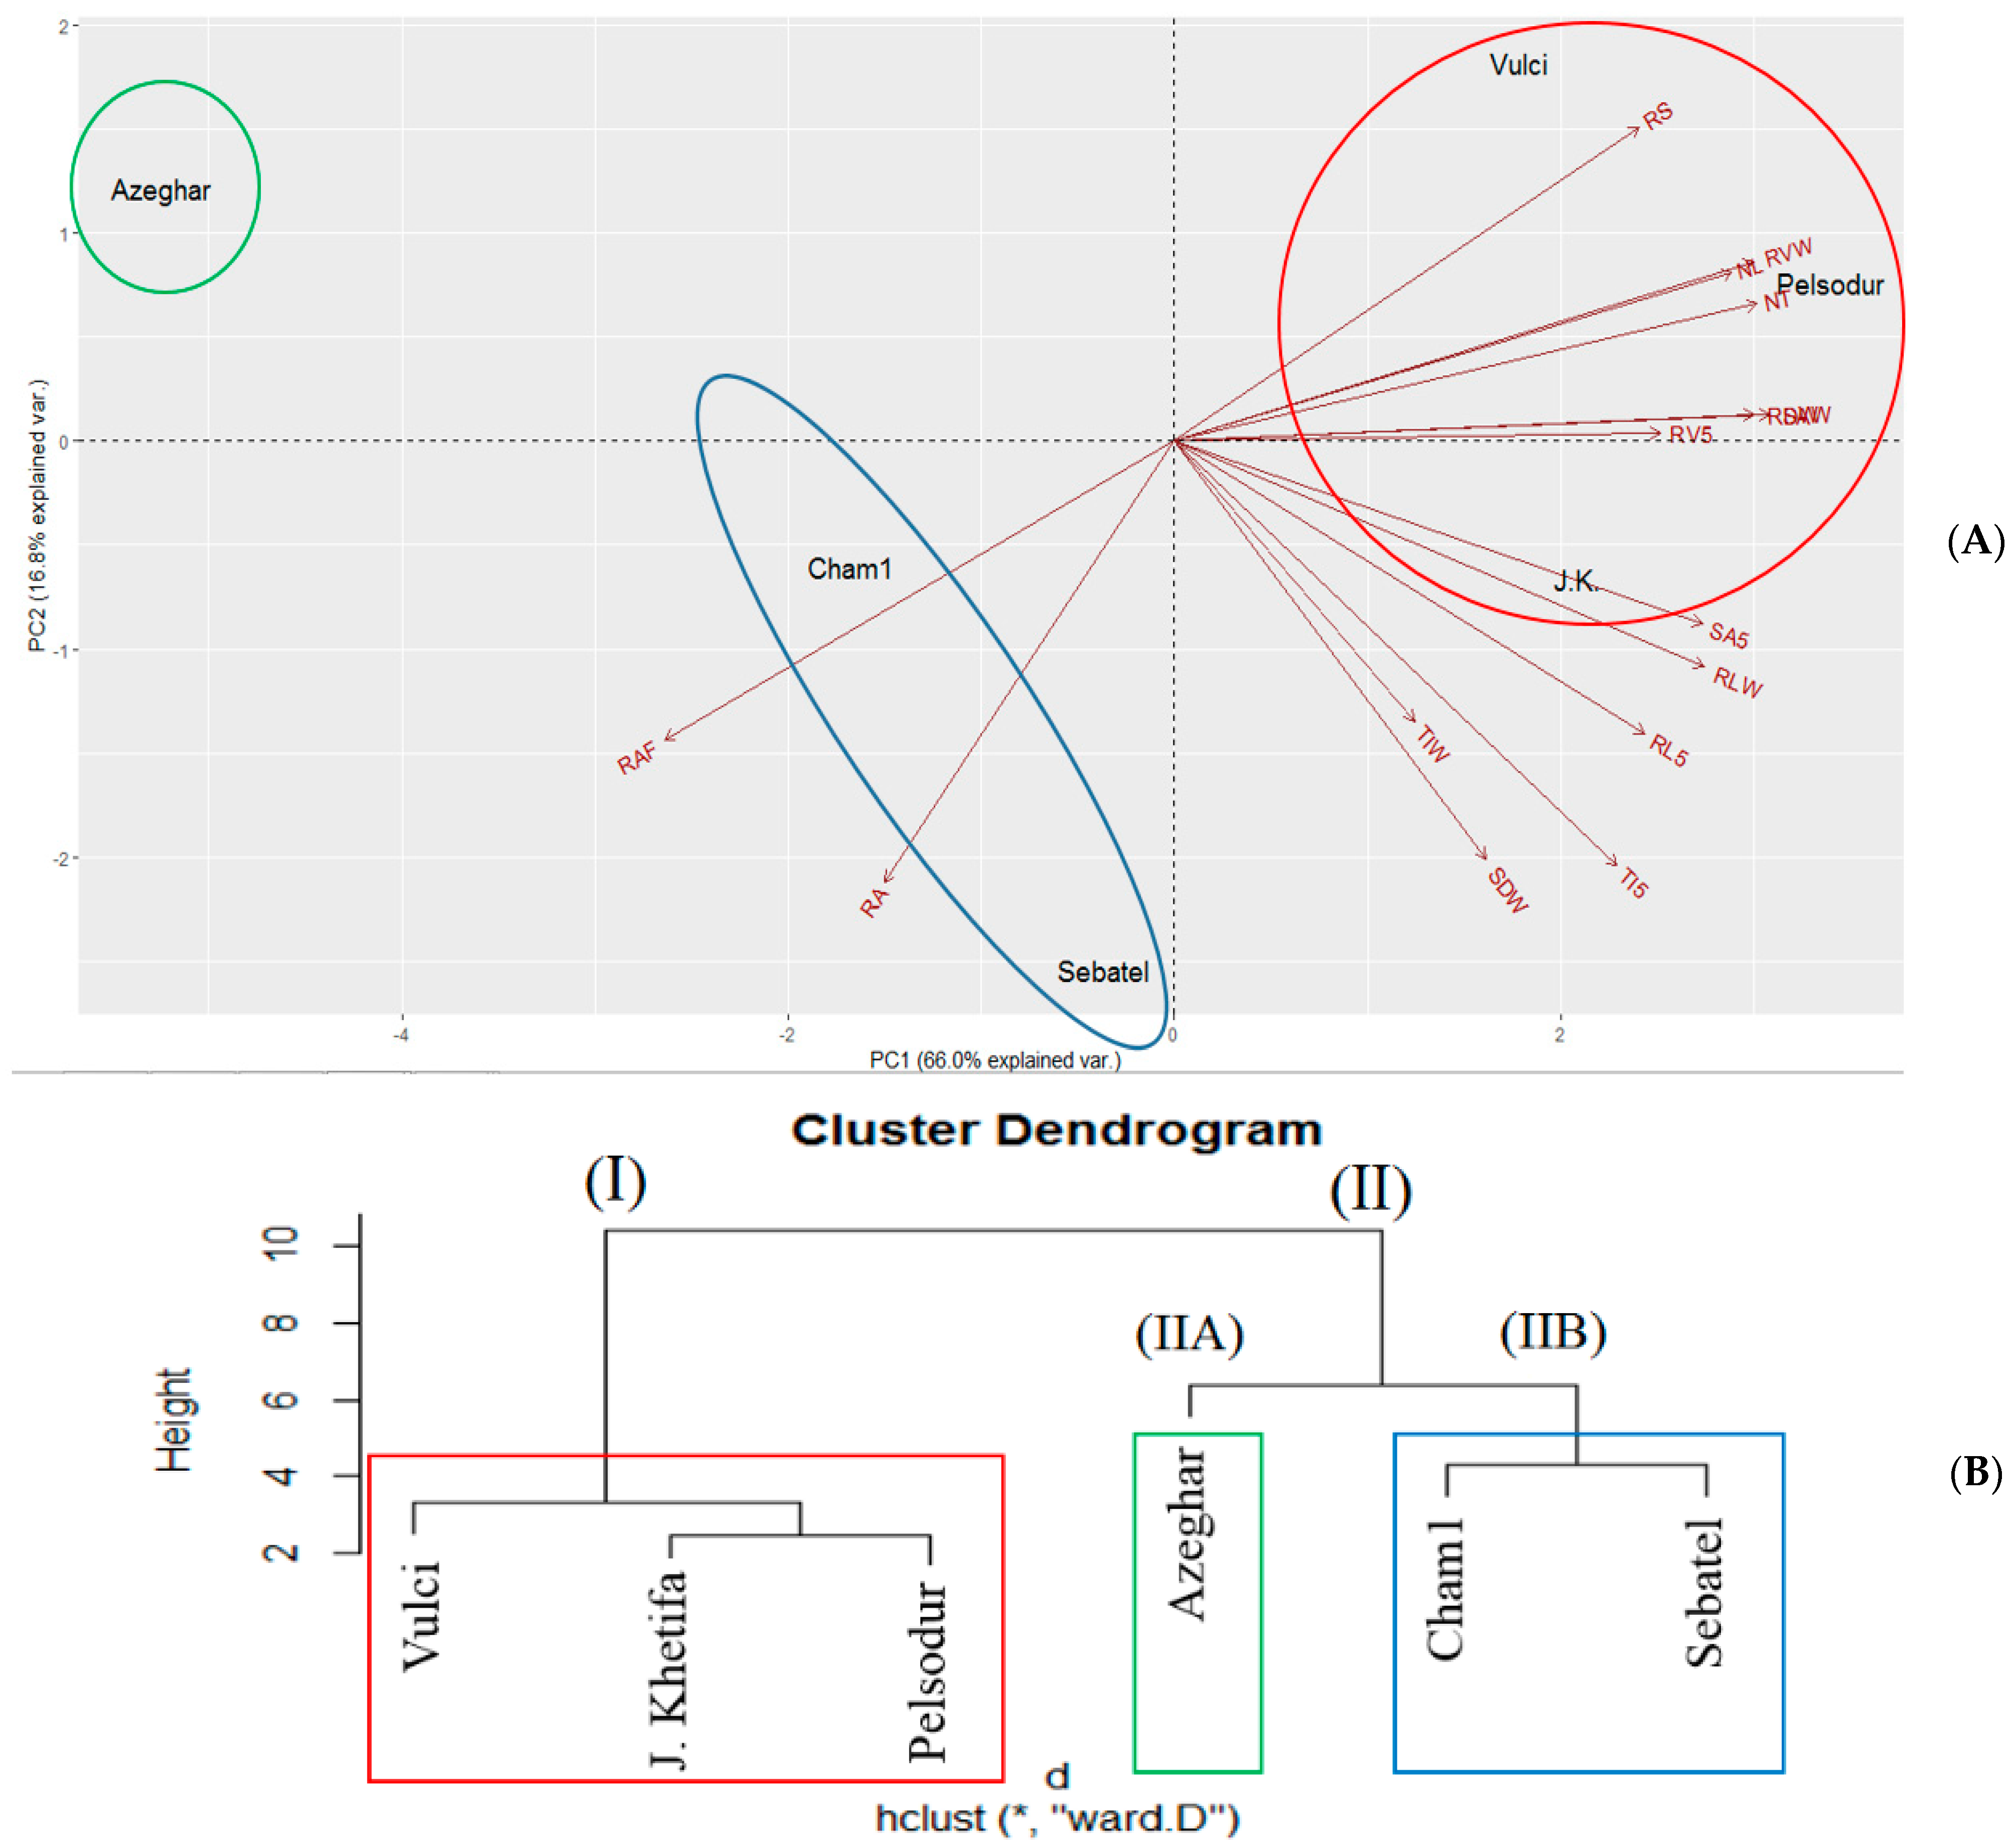
The three top PCA account for 93.9% of the total variation of shoot root traits under drought stress and root angle from field plants (RAF) (Table S1). PC1 accounted for 66.0% of the total variation and was strongly influenced by several traits (i.e., RLW, RVW, SAW, SA5, NL, NT, and RDW). PC2 accounted for 16.8% of the total variation and was mainly associated with RS, -RL5, -TI5, -RAD, AND -RAF, while PC3 accounted for 11.1% and was strongly associated with TIW, -SDW, and -RV5. The first two principal components, explaining 82.8% of the total variation, divided genotypes into two groups (I) and (II) (Figure 8).
Pelsodur and Vulci were assigned to cluster (I) with the drought tolerant landrace J. Khetifa, due to their positive association with traits on the positive side of PC1, while the Sebatel and Azeghar with tolerant Cham1 under drought conditions are on the negative side of PC1, associated with root angle under drought (RAD) and field (RAF), and assigned to cluster (II). Interestingly, these two groups overlapped with genotype shoot development either early or late flowering. Moreover, the same groups were highlighted regarding RV changes at different soil layers; early flowering growth genotypes had the lowest RV, but maintained higher root volume at 5 cm depth compared with a group of late genotypes. However, cluster (II) was divided into two subgroups, where Azeghar (IIA) was separated from the Cham1 and Sebatel cluster (IIB) due to the largest losses in the aboveground part of the plant under drought conditions.
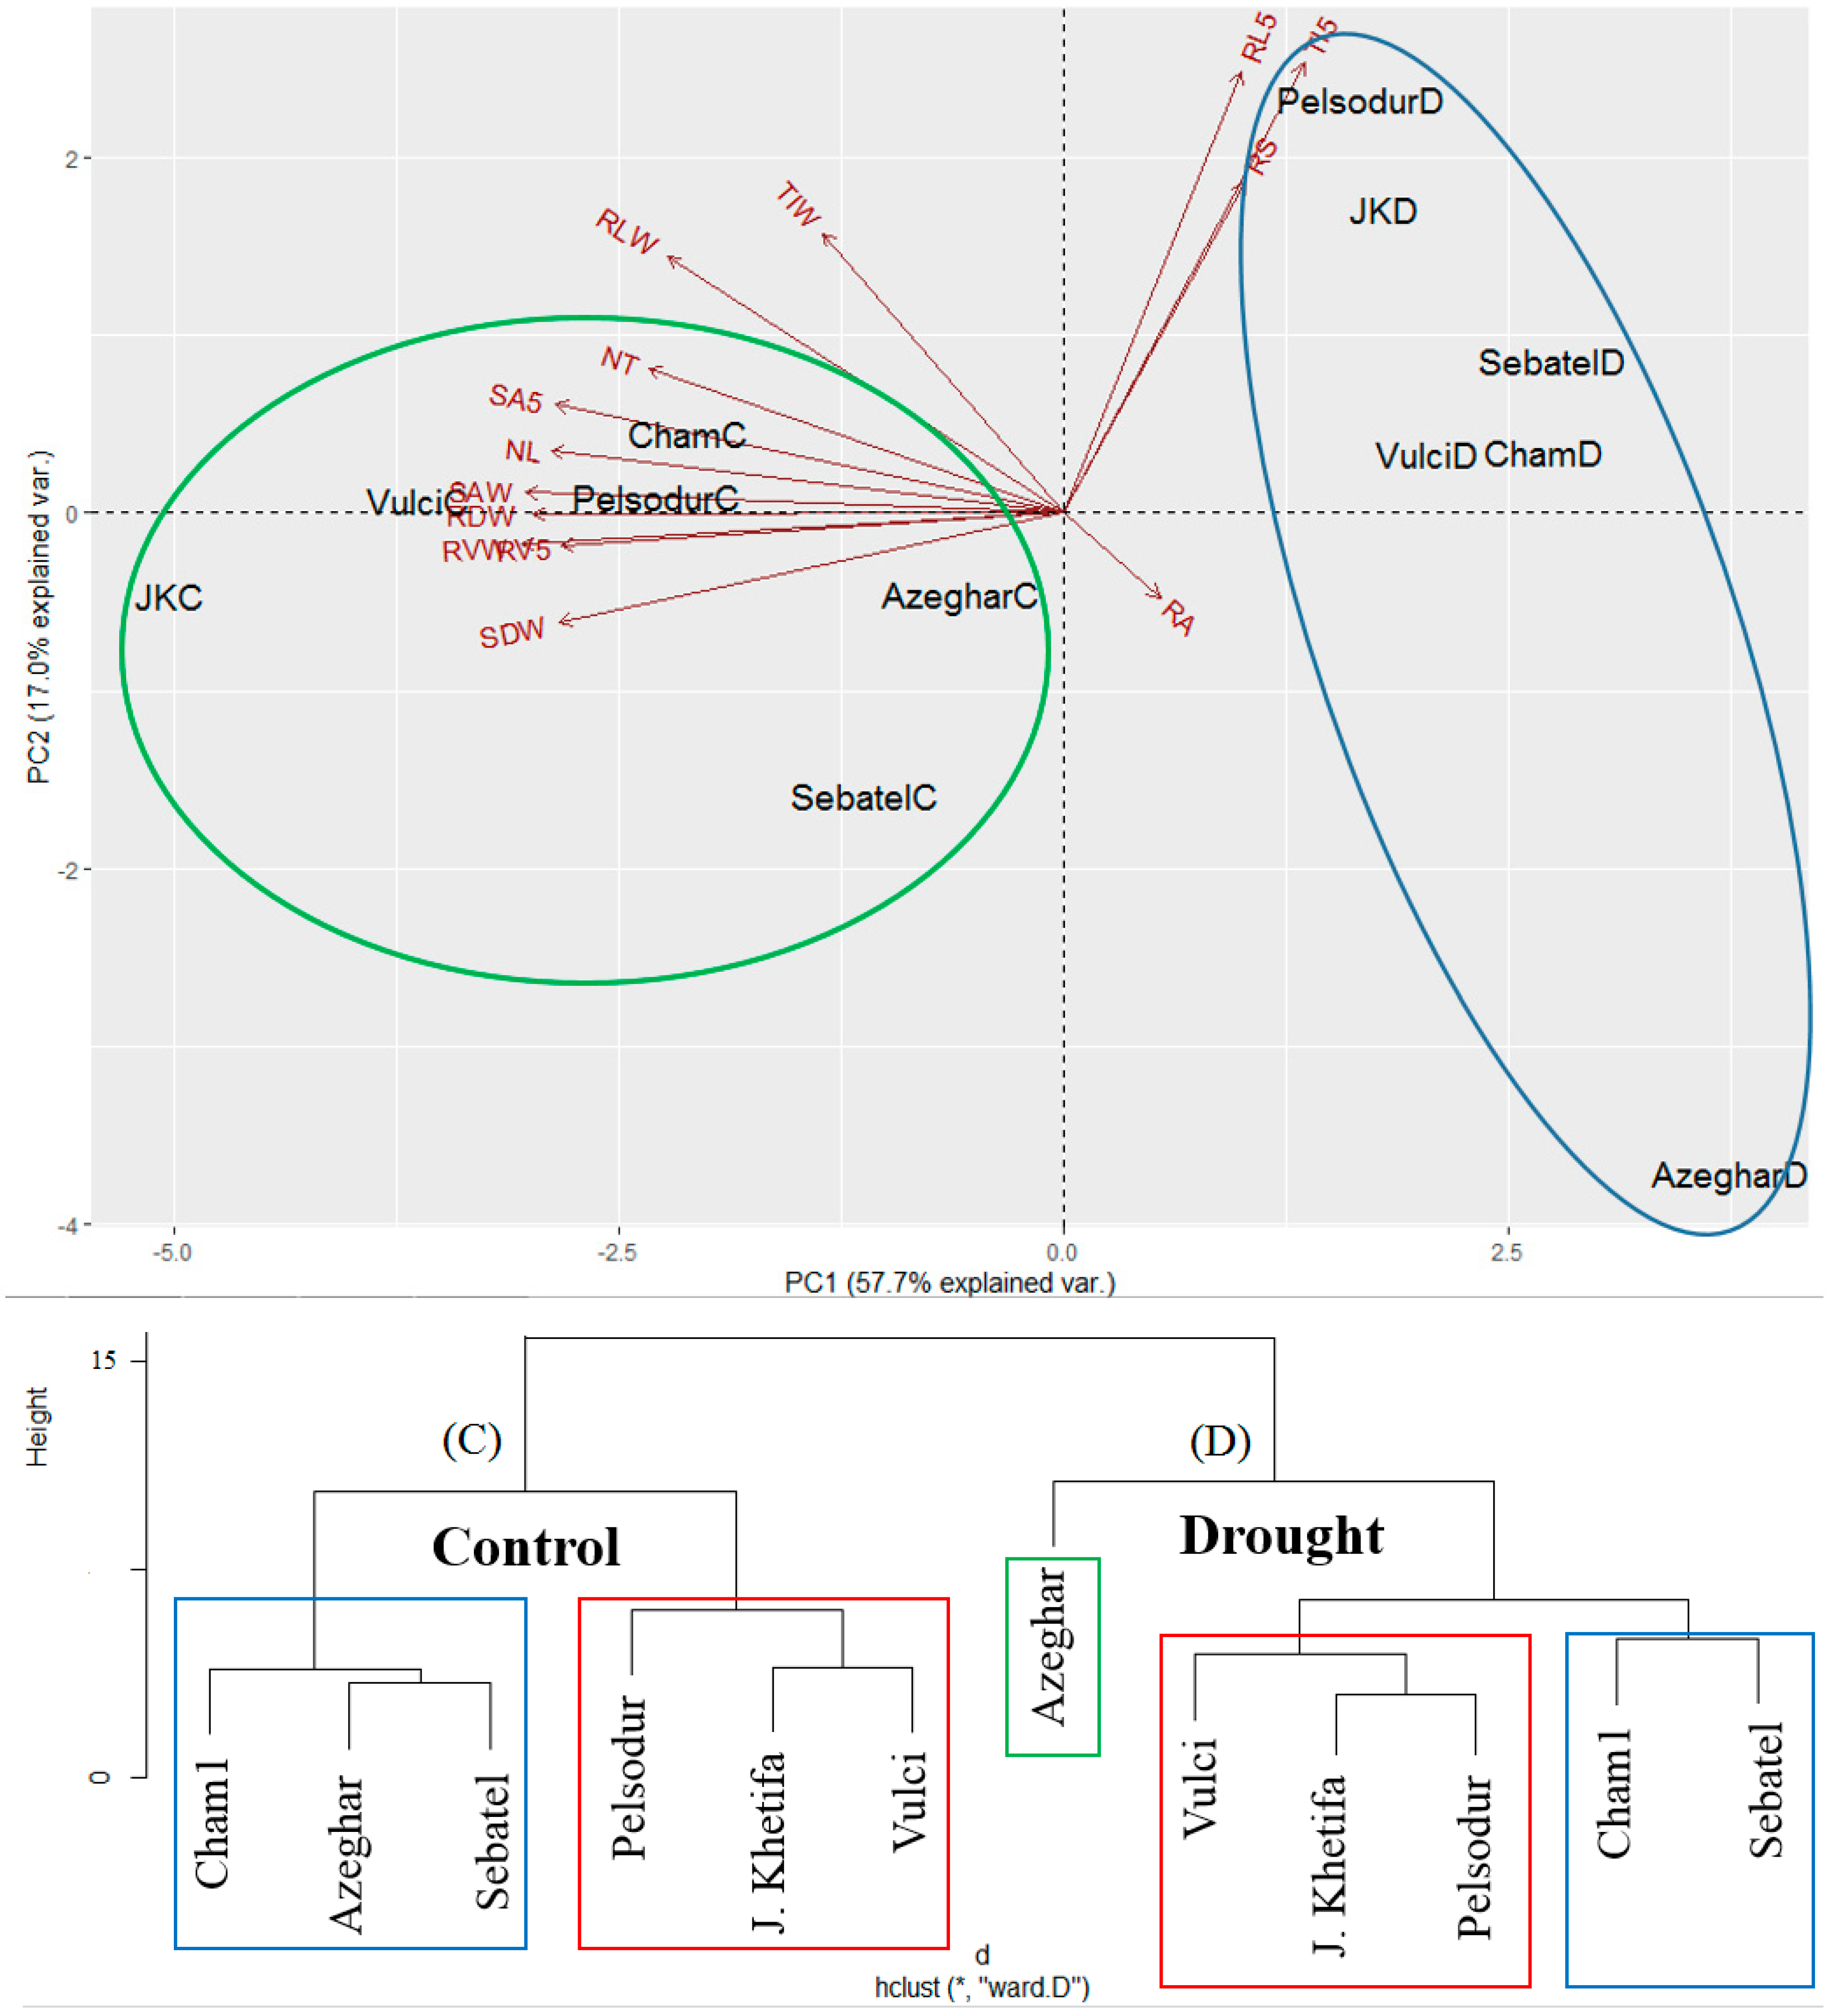
The first three components of PCA considering all traits under both drought and control conditions accounted for 89.9% of total variation: 57.7% to PC1, and 17.0% to PC2, and 14.4% to PC3 (Table S2). Interestingly, all the genotypes under drought stress are grouped on the positive side of PC1 with more or less the same values (ranging from about 2 to 4). While the same genotypes under control conditions are on the negative side of PC1 with different values, AzegarC is close to zero, while J. Khetifa (JKC) is almost at −5 of PC1. Considering that PC1 is mainly determined by –RVW, -RV5, -RDW, -SAW, SA5, -NL, and -SDW, these traits are different among the genotypes under control (ending with C in Figure 9) and drought (ending with D in Figure 9) conditions, and in particularly are negatively associated (decreased) in the case of drought. On the other hand, PC2, which is mainly determined by RLW, RS, RL5, TIW, and TI5, is very wide (ranging from 2 to −4) for the genotypes under drought while it is more or less constant (ranging from about 1 to −1) for the same genotypes under controlled conditions.
The tolerant landrace J. Khetifa was assigned together with Pelsodur and Vulci to the same cluster under both conditions. However, under control conditions J. Khetifa was closer to the Vulci, while under drought conditions it was closer to the late flowering time Pelsodur. Early flowering genotypes, such as Cham1, Sebatel, and Azeghar formed one cluster under control conditions, while the drought separate Azeghar, which is probably a susceptible genotype to hydric stress.
4. Discussion
According to Reynolds and Langridge [39], several crucial steps are required to improve crop tolerance for abiotic stress; among them, trait-based breeding and a “crop ideotype design” are the first to be considered. Breeding programs have focused largely on above ground traits, leaving the root system importance overlooked [40]. Some of the previous studies reported that RSA traits on the seedling stage can be used to predict the RSA of adult plants in field-grown [20] or in an artificial system [21] to evaluate the crop adaptation under water stress conditions; unfortunately, these were validated only for what concerned the root angle and seminal root apparatus. Conversely, in the present study, the analysis was performed on a more advanced stage than seedling and on several root traits since different root types could perform differently under different conditions [23], as also highlighted by the present results. For what concerns the substrate, in the present study we used sand that allows roots to grow around the 360° rather than rhizotrons (GrowScreen-Rhizo 1) [41], growth pouch, or clear pot [21] which fundamentally allow a root development in only two dimensions. Moreover, Gregory et al. [42] recorded a significant soil by genotype interaction, when wheat root length among accessions grown on agar plates showed positive differences of about 40%, while in a sandy loam soil the differences were negative and at about 30%. However, in our study, we obtained a positive correlation between the root angle of genotypes grown under greenhouse and field conditions, which are good traits for selection for drought tolerance [23,24]. In addition, the highly statistically significant correlations between the main traits of the whole root system and topsoil indicate that it would be possible to extrapolate the root phenotyping of the whole root system by analyzing only the topsoil root system.
After simulations of several root system traits and ideotypes for drought conditions, it was proposed that for cereals a “deep, steep, and cheap” root system is the most proper for water scarcity environments [43,44]. A deep root system is the most important characteristic for the drought tolerant crop ideotype, as it allows access to residual water resources and N from deeper soil layers [45]. Moreover, recent studies observed an association between steep root angle and the depth of RSA, when narrower angles allow for an increase in deep rooting [14,46,47]. The same relationship was found in our study, as genotypes from the same cluster with the narrowest root angle in control conditions, such as J. Khetifa and Pelsodur, retained longer roots in water deficit environments and vice versa, while Azeghar with the widest angle in control conditions had the shortest RLW under drought conditions. Furthermore, a significant negative correlation between root angle under control (RAC) conditions and root length under drought stress (RLD) support the methods proposing to analyze the root angle at a seedling stage and select the genotypes adapted to drought on the basis of that data. These root system characteristics are often associated with the germplasm origin and the relative climate conditions. In general, a narrow root angle and deep root system are more common for rain-fed crops, which depend on stored water in the soil. However, the analysis of durum wheat landraces from the Mediterranean basin showed large variability in root system architecture [48,49,50]. Cultivars originating from the western Mediterranean showed a narrow root angle, the same as genotype J. Khetifa, which originated from Tunisia [34,48]. In agreement with Ober et al. [51], we demonstrated that a narrow root angle was associated with higher root biomass; for example, J. Khetifa and Pelsodur had a narrow root angle under control conditions (RAC) and maintained higher root biomass (RDW) under water scarcity.
Manschadi et al. [14] demonstrated how the yield increases of 55 kg/ha for each millimeter of water extracted from the soil after anthesis (i.e., in grain filling stage); hence a deep root system, but also wide root system, are the most desirable in environments with terminal drought [40]. In addition, genotypes from cluster (II) Cham1 and Sebatel showed different root ideotypes than genotypes from cluster (I). They had a wider root angle under control conditions, and under drought stress maintained moderate root biomass, length, surface area, and volume. However, regarding shoot biomass (SDW), Sebatel maintained significantly higher SDW than Cham1 under drought conditions. Interestingly, most of the differences between the Sebatel and Cham1 genotypes were found in topsoil root traits. Sebatel maintained significantly longer root length, volume, and surface area at the topsoil compared to Cham1, which helps to develop a significantly higher shoot biomass. Similar results were obtained in other studies, where the late flowering genotypes (in our case J. Khetifa, Pelsodur and Vulci) had a more uniform distribution of the root system compared to the early flowering genotypes (in our case Cham1 and Sebatel), which kept a higher root volume at 5 cm depth under drought [52].
The deep root allocation for durum wheat was determined to be a good strategy for drought avoidance in Mediterranean-type environments, which facilitates access to subsoil water resources [43]. In agreement with the “deep, steep, and cheap” root system ideotype, the genotypes Pelsodur, J. Khetifa, and Vulci can be considered drought tolerant; confirming the suitability for drought-tolerant breeding, as it was reported that this root system had significant functional relation to water absorption and drought avoidance in rice [53]. Also, the genotypes Sebatel and Cham1 with compact topsoil rooting patterns under drought condition could be good candidates for breeding, as it was demonstrated that higher root mass and root length density in subsoil layers contribute to the grain yield of winter wheat under drought conditions [54]. Finally, Azeghar with the lowest root biomass, surface area, length, and volume under drought stress and the widest root angle under control conditions shows susceptible root ideotype for hydric stress.
5. Conclusions and Perspectives
This study highlighted huge variability among a small number of genotypes in terms of the development, distribution, and architecture of the root system in order to tolerate difficult environments and to increase resilience to climate change. Even two hydric stress-tolerant genotypes showed different root system ideotypes and rooting patterns under drought. Moreover, it was demonstrated that screening plants’ roots in the early stage grown under control conditions using a high-throughput scanner can expedite the selection of novel traits for crop improvement in plant breeding.
Supplementary Materials
The following are available online at https://0-www-mdpi-com.brum.beds.ac.uk/article/10.3390/agronomy12061329/s1, Table S1: Principal Components Analysis of traits detected under drought stress, Table S2: Principal Components Analysis of traits detected under both drought and control conditions.
Author Contributions
Conceptualization, I.U., L.B. and M.A.P.; methodology, M.A.P.; software, L.B.; validation, I.U., L.B. and M.A.P.; formal analysis, L.B.; investigation, I.U. and L.B.; resources, M.A.P.; data curation, I.U. and L.B.; writing—original draft preparation, I.U.; writing—review and editing, M.A.P.; visualization, I.U.; supervision, M.A.P.; project administration, M.A.P.; funding acquisition, M.A.P. All authors have read and agreed to the published version of the manuscript.
Funding
This research was funded by the European Union’s Horizon 2020 research and innovation programme under grant agreement No 771367 (ECOBREED project).
Data Availability Statement
The recorded raw data are public available (after an access request) at the Zenodo web site with DOI: 10.5281/zenodo.5883299.
Conflicts of Interest
The authors declare no conflict of interest.
Abbreviations
| CR5 | number of crossings in the first 5 cm below the ground |
| CRF | number of crossings in the first 5 cm below the ground of plants from field |
| CRW | total number of crossings |
| FR5 | number of forks in the first 5 cm below the ground |
| FRF | number of forks in the first 5 cm below the ground of plants from field |
| FRW | total number of forks |
| NL | number of leave |
| NT | number of tillers |
| RAC | root angle of plants grown in greenhouse as control |
| RAD | root angle of plants grown in greenhouse under drought condition |
| RAF | root angle of plants grown in the field |
| RDW | root dry weight |
| RL5 | sum of roots lengths in the first 5 cm below the ground |
| RLD | root length density |
| RLF | sum of roots lengths in the first 5 cm below the ground of plants from field |
| RLW | sum of all root lengths |
| RS | root shoot ratio |
| RV5 | root volume in the first 5 cm below the ground |
| RVF | root volume in the first 5 cm below the ground of plants from field |
| RVW | total root volume |
| SA5 | root surface area in the first 5 cm below the ground |
| SAF | root surface area in the first 5 cm below the ground of plants from field |
| SAW | total root surface area |
| SDW | shoot dry weight |
| TI5 | numbers of tips in the first 5 cm below the ground |
| TIF | number of tips in the first 5 cm below the ground of plants from field |
| TIW | total number of tips |
References
- Nam, W.H.; Hayes, M.J.; Svoboda, M.D.; Tadesse, T.; Wilhite, D.A. Drought hazard assessment in the context of climate change for South Korea. Agric. Water Manag. 2015, 160, 106–117. [Google Scholar] [CrossRef]
- Mann, M.E.; Gleick, P.H. Climate change and California drought in the 21st century. Proc. Natl. Acad. Sci. USA 2015, 112, 3858–3859. [Google Scholar] [CrossRef] [PubMed] [Green Version]
- Lawlor, D.W. Stress metabolism: Its implication in breeding programmes. In Drought Tolerance in Winter Cereals; Srivastava, J.P., Porceddu, E., Acevedo, E., Varma, S., Eds.; John Wiley & Sons, Inc.: Hoboken, NJ, USA, 1987. [Google Scholar]
- Baird, J.; Gentry, J.; Lawrence, D.; Erbacher, A.; Aisthorpe, D.; Bell, L.; Anderson, B.; Brook, G.; Verrell, A.; Dunn, M.; et al. Nitrogen in the Farming System: Drought Implications on the Availability of Nitrogen. How Much Is There and Where Is It within the Profile? Does Cropping Sequence Influence Fallow Mineralisation Activity? Available online: https://grdc.com.au/resources-and-publications/grdc-update-papers/tab-content/grdc-update-papers/2020/03/nitrogen-in-the-farming-system-drought-implications-on-the-availability-of-nitrogen.-how-much-is-there-and-where-is-it-within-the-profile-does-cropping-sequence-influence-fallow-mineralisation-activity (accessed on 21 April 2022).
- Sarto, M.V.M.; Sarto, J.R.W.; Rampim, L.; Rosset, J.S.; Bassegio, D.; da Costa, P.F.; Inagaki, A.M. Wheat phenology and yield under drought: A review. Aust. J. Crop Sci. 2017, 11, 941–946. [Google Scholar] [CrossRef]
- Daryanto, S.; Wang, L.; Jacinthe, P.A. Global synthesis of drought effects on maize and wheat production. PLoS ONE 2016, 11, e0156362. [Google Scholar] [CrossRef]
- Carvalho, P.; Azam-Ali, S.; Foulkes, M.J. Quantifying relationships between rooting traits and water uptake under drought in Mediterranean barley and durum wheat. J. Integr. Plant Biol. 2014, 56, 455–469. [Google Scholar] [CrossRef]
- Rezzouk, F.Z.; Gracia-Romero, A.; Kefauver, S.C.; Nieto-Taladriz, M.T.; Serret, M.D.; Araus, J.L. Durum wheat ideotypes in Mediterranean environments differing in water and temperature conditions. Agric. Water Manag. 2022, 259, 107257. [Google Scholar] [CrossRef]
- Saeidi, M.; Ardalani, S.; Jalali-Honarmand, S.; Ghobadi, M.E.; Abdoli, M. Evaluation of drought stress at vegetative growth stage on the grain yield formation and some physiological traits as well as fluorescence parameters of different bread wheat cultivars. Acta Biol. Szeged. 2015, 59, 35–44. [Google Scholar]
- Blum, A.; Ramaiah, S.; Kanemasu, E.T.; Paulsen, G.M. Wheat recovery from drought stress at the tillering stage of development. F. Crop. Res. 1990, 24, 67–85. [Google Scholar] [CrossRef]
- Ding, J.; Huang, Z.; Zhu, M.; Li, C.; Zhu, X.; Guo, W. Does cyclic water stress damage wheat yield more than a single stress? PLoS ONE 2018, 13, e0195535. [Google Scholar] [CrossRef] [PubMed] [Green Version]
- Khadka, K.; Earl, H.J.; Raizada, M.N.; Navabi, A. A Physio-Morphological Trait-Based Approach for Breeding Drought Tolerant Wheat. Front. Plant Sci. 2020, 11, 715. [Google Scholar] [CrossRef] [PubMed]
- Passioura, J.B. Water Transport in and to Roots. Annu. Rev. Plant Physiol. Plant Mol. Biol. 1988, 39, 245–265. [Google Scholar] [CrossRef]
- Manschadi, A.M.; Christopher, J.; deVoil, P.; Hammer, G.L.; Manschadi, A.M.; Christopher, J.; deVoil, P.; Hammer, G.L. The role of root architectural traits in adaptation of wheat to water-limited environments. Funct. Plant Biol. 2006, 33, 823–837. [Google Scholar] [CrossRef] [PubMed] [Green Version]
- Lopez-Castaneda, C.; Richards, R.A.; Farquhar, G.D. Variation in Early Vigor between Wheat and Barley. Crop Sci. 1995, 35, 472–479. [Google Scholar] [CrossRef]
- Reynolds, M.; Tuberosa, R. Translational research impacting on crop productivity in drought-prone environments. Curr. Opin. Plant Biol. 2008, 11, 171–179. [Google Scholar] [CrossRef]
- Sanguineti, M.C.; Li, S.; MacCaferri, M.; Corneti, S.; Rotondo, F.; Chiari, T.; Tuberosa, R. Genetic dissection of seminal root architecture in elite durum wheat germplasm. Ann. Appl. Biol. 2007, 151, 291–305. [Google Scholar] [CrossRef]
- Manschadi, A.M.; Hammer, G.L.; Christopher, J.T.; DeVoil, P. Genotypic variation in seedling root architectural traits and implications for drought adaptation in wheat (Triticum aestivum L.). Plant Soil 2008, 303, 115–129. [Google Scholar] [CrossRef]
- Hochholdinger, F.; Tuberosa, R. Genetic and genomic dissection of maize root development and architecture. Curr. Opin. Plant Biol. 2009, 12, 172–177. [Google Scholar] [CrossRef]
- Maccaferri, M.; El-Feki, W.; Nazemi, G.; Salvi, S.; Canè, M.A.; Colalongo, M.C.; Stefanelli, S.; Tuberosa, R. Prioritizing quantitative trait loci for root system architecture in tetraploid wheat. J. Exp. Bot. 2016, 67, 1161–1178. [Google Scholar] [CrossRef]
- Richard, C.A.I.; Hickey, L.T.; Fletcher, S.; Jennings, R.; Chenu, K.; Christopher, J.T. High-throughput phenotyping of seminal root traits in wheat. Plant Methods 2015, 11, 13. [Google Scholar] [CrossRef] [Green Version]
- Clark, R.T.; Famoso, A.N.; Zhao, K.; Shaff, J.E.; Craft, E.J.; Bustamante, C.D.; Mccouch, S.R.; Aneshansley, D.J.; Kochian, L.V. High-throughput two-dimensional root system phenotyping platform facilitates genetic analysis of root growth and development. Plant Cell Environ. 2013, 36, 454–466. [Google Scholar] [CrossRef]
- El Hassouni, K.; Alahmad, S.; Belkadi, B.; Filali-Maltouf, A.; Hickey, L.T.; Bassi, F.M. Root system architecture and its association with yield under different water regimes in Durum wheat. Crop Sci. 2018, 58, 2331–2346. [Google Scholar] [CrossRef] [Green Version]
- Chen, X.; Li, Y.; He, R.; Ding, Q. Phenotyping field-state wheat root system architecture for root foraging traits in response to environment × management interactions. Sci. Rep. 2018, 8, 2642. [Google Scholar] [CrossRef] [PubMed] [Green Version]
- Wasson, A.P.; Richards, R.A.; Chatrath, R.; Misra, S.C.; Prasad, S.V.S.; Rebetzke, G.J.; Kirkegaard, J.A.; Christopher, J.; Watt, M. Traits and selection strategies to improve root systems and water uptake in water-limited wheat crops. J. Exp. Bot. 2012, 63, 3485–3498. [Google Scholar] [CrossRef] [PubMed] [Green Version]
- Gesimba, R.M.; Njoka, E.; Kinyua, M. Root Characteristics of Drought Tolerant Bread Wheat (Triticum aestivum) Genotypes at Seedling Stage. Asian J. Plant Sci. 2004, 4, 512–515. [Google Scholar] [CrossRef]
- Mondini, L.; Nachit, M.; Porceddu, E.; Pagnotta, M.A. Identification of SNP mutations in DREB1, HKT1, and WRKY1 genes involved in drought and salt stress tolerance in durum wheat (Triticum turgidum L. var durum). Omics A J. Integr. Biol. 2012, 16, 178–187. [Google Scholar] [CrossRef] [PubMed]
- Nachit, M.M.; Elouafi, I.; Pagnotta, M.A.; El Saleh, A.; Iacono, E.; Labhilili, M.; Asbati, A.; Azrak, M.; Hazzam, H.; Benscher, D.; et al. Molecular linkage map for an intraspecific recombinant inbred population of durum wheat (Triticum turgidum L. var. durum). Theor. Appl. Genet. 2001, 102, 177–186. [Google Scholar] [CrossRef]
- Annicchiarico, P.; Pecetti, L. Developing a tall durum wheat plant type for semi-arid, Mediterranean cereal–livestock farming systems. F. Crop. Res. 2003, 80, 157–164. [Google Scholar] [CrossRef]
- Katerji, N.; Van Hoorn, J.W.; Fares, C.; Hamdy, A.; Mastrorilli, M.; Oweis, T. Salinity effect on grain quality of two durum wheat varieties differing in salt tolerance. Agric. Water Manag. 2005, 75, 85–91. [Google Scholar] [CrossRef]
- Katerji, N.; Van Hoorn, J.W.; Hamdy, A.; Mastrorilli, M.; Oweis, T. Salt tolerance analysis of chickpea, faba bean and durum wheat varieties: I. Chickpea and faba bean. Agric. Water Manag. 2005, 72, 177–194. [Google Scholar] [CrossRef]
- Mondini, L.; Nachit, M.M.; Porceddu, E.; Pagnotta, M.A. HRM technology for the identification and characterization of INDEL and SNPs mutations in genes involved in drought and salt tolerance of durum wheat. Plant Genet. Resour. 2011, 9, 166–169. [Google Scholar] [CrossRef] [Green Version]
- Mondini, L.; Nachit, M.M.; Pagnotta, M.A. Allelic variants in durum wheat (Triticum turgidum L. var. durum) DREB genes conferring tolerance to abiotic stresses. Mol. Genet. Genom. 2015, 290, 531–544. [Google Scholar] [CrossRef] [PubMed]
- Monneveux, P.; Rekika, D.; Acevedo, E.; Merah, O. Effect of drought on leaf gas exchange, carbon isotope discrimination, transpiration efficiency and productivity in field grown durum wheat genotypes. Plant Sci. 2006, 170, 867–872. [Google Scholar] [CrossRef]
- Pagnotta, M.A.; Luca, B.; Poala, F. Selection of Durum Wheat Lines under Organic Management—Preliminary Results/Zenodo. Available online: https://zenodo.org/record/4675513#.YkGRWFXP3IU (accessed on 28 March 2022).
- Grewal, K.S.; Buchan, G.D.; Tonkin, P.J. Estimation of field capacity and wilting point of some new zealand soils from their saturation percentages. N. Z. J. Crop Hortic. Sci. 1990, 18, 241–246. [Google Scholar] [CrossRef]
- GitHub—Taiyun/Corrplot: A Visual Exploratory Tool on Correlation Matrix. Available online: https://github.com/taiyun/corrplot (accessed on 23 December 2021).
- Vincent, Q.V. GitHub—Vqv/Ggbiplot: A Biplot Based on Ggplot2. Available online: https://github.com/vqv/ggbiplot (accessed on 23 December 2021).
- Reynolds, M.; Langridge, P. Physiological Breeding. Curr. Opin. Plant Biol. 2016, 31, 162–171. [Google Scholar] [CrossRef] [PubMed] [Green Version]
- Alahmad, S.; El Hassouni, K.; Bassi, F.M.; Dinglasan, E.; Youssef, C.; Quarry, G.; Aksoy, A.; Mazzucotelli, E.; Juhász, A.; Able, J.A.; et al. A major root architecture QTL responding to water limitation in durum wheat. Front. Plant Sci. 2019, 10, 436. [Google Scholar] [CrossRef] [PubMed] [Green Version]
- Nagel, K.A.; Putz, A.; Gilmer, F.; Heinz, K.; Fischbach, A.; Pfeifer, J.; Faget, M.; Blossfeld, S.; Ernst, M.; Dimaki, C.; et al. GROWSCREEN-Rhizo is a novel phenotyping robot enabling simultaneous measurements of root and shoot growth for plants grown in soil-filled rhizotrons. Funct. Plant Biol. 2012, 39, 891–904. [Google Scholar] [CrossRef] [Green Version]
- Gregory, P.J.; Bengough, A.G.; Grinev, D.; Schmidt, S.; Thomas, W.T.B.; Wojciechowski, T.; Young, I.M. Root phenomics of crops: Opportunities and challenges. Funct. Plant Biol. 2009, 36, 922–929. [Google Scholar] [CrossRef] [PubMed]
- Nakhforoosh, A.; Nagel, K.A.; Fiorani, F.; Bodner, G. Deep soil exploration vs. topsoil exploitation: Distinctive rooting strategies between wheat landraces and wild relatives. Plant Soil 2021, 459, 397–421. [Google Scholar] [CrossRef] [PubMed]
- Lynch, J.P. Steep, cheap and deep: An ideotype to optimize water and N acquisition by maize root systems. Ann. Bot. 2013, 112, 347–357. [Google Scholar] [CrossRef] [Green Version]
- Bengough, A.G.; Gordon, D.C.; Al-Menaie, H.; Ellis, R.P.; Allan, D.; Keith, R.; Thomas, W.T.B.; Forster, B.P. Gel observation chamber for rapid screening of root traits in cereal seedlings. Plant Soil 2004, 262, 63–70. [Google Scholar] [CrossRef]
- York, L.; Slack, S.; Bennett, M.; Foulkes, M.J. Wheat shovelomics I: A field phenotyping approach for characterising the structure and function of root systems in tillering species. bioRxiv 2018, 280875. [Google Scholar] [CrossRef]
- Tracy, S.R.; Nagel, K.A.; Postma, J.A.; Fassbender, H.; Wasson, A.; Watt, M. Crop Improvement from Phenotyping Roots: Highlights Reveal Expanding Opportunities. Trends Plant Sci. 2020, 25, 105–118. [Google Scholar] [CrossRef] [Green Version]
- Roselló, M.; Royo, C.; Sanchez-Garcia, M.; Soriano, J.M. Genetic Dissection of the Seminal Root System Architecture in Mediterranean Durum Wheat Landraces by Genome-Wide Association Study. Agronomy 2019, 9, 364. [Google Scholar] [CrossRef] [Green Version]
- Mengistu, D.K.; Kiros, A.Y.; Pè, M.E. Phenotypic diversity in Ethiopian durum wheat (Triticum turgidum var. durum) landraces. Crop J. 2015, 3, 190–199. [Google Scholar] [CrossRef] [Green Version]
- Alemu, A.; Feyissa, T.; Maccaferri, M.; Sciara, G.; Tuberosa, R.; Ammar, K.; Badebo, A.; Acevedo, M.; Letta, T.; Abeyo, B. Genome-wide association analysis unveils novel QTLs for seminal root system architecture traits in Ethiopian durum wheat. BMC Genom. 2021, 22, 20. [Google Scholar] [CrossRef] [PubMed]
- Ober, E.S.; Alahmad, S.; Cockram, J.; Forestan, C.; Hickey, L.T.; Kant, J.; Maccaferri, M.; Marr, E.; Milner, M.; Pinto, F.; et al. Wheat root systems as a breeding target for climate resilience. Theor. Appl. Genet. 2021, 134, 1645–1662. [Google Scholar] [CrossRef]
- Puccio, G.; Ingraffia, R.; Giambalvo, D.; Amato, G.; Frenda, A.S. Morphological and Physiological Root Traits and Their Relationship with Nitrogen Uptake in Wheat Varieties Released from 1915 to 2013. Agronomy 2021, 11, 1149. [Google Scholar] [CrossRef]
- Gowda, V.R.P.; Henry, A.; Yamauchi, A.; Shashidhar, H.E.; Serraj, R. Root biology and genetic improvement for drought avoidance in rice. Field Crops Res. 2011, 122, 1–13. [Google Scholar] [CrossRef]
- Fang, Y.; Du, Y.; Wang, J.; Wu, A.; Qiao, S.; Xu, B.; Zhang, S.; Siddique, K.H.M.; Chen, Y. Moderate drought stress affected root growth and grain yield in old, modern and newly released cultivars of winter wheat. Front. Plant Sci. 2017, 8, 672. [Google Scholar] [CrossRef] [PubMed] [Green Version]
Figure 1.
Experimental model.

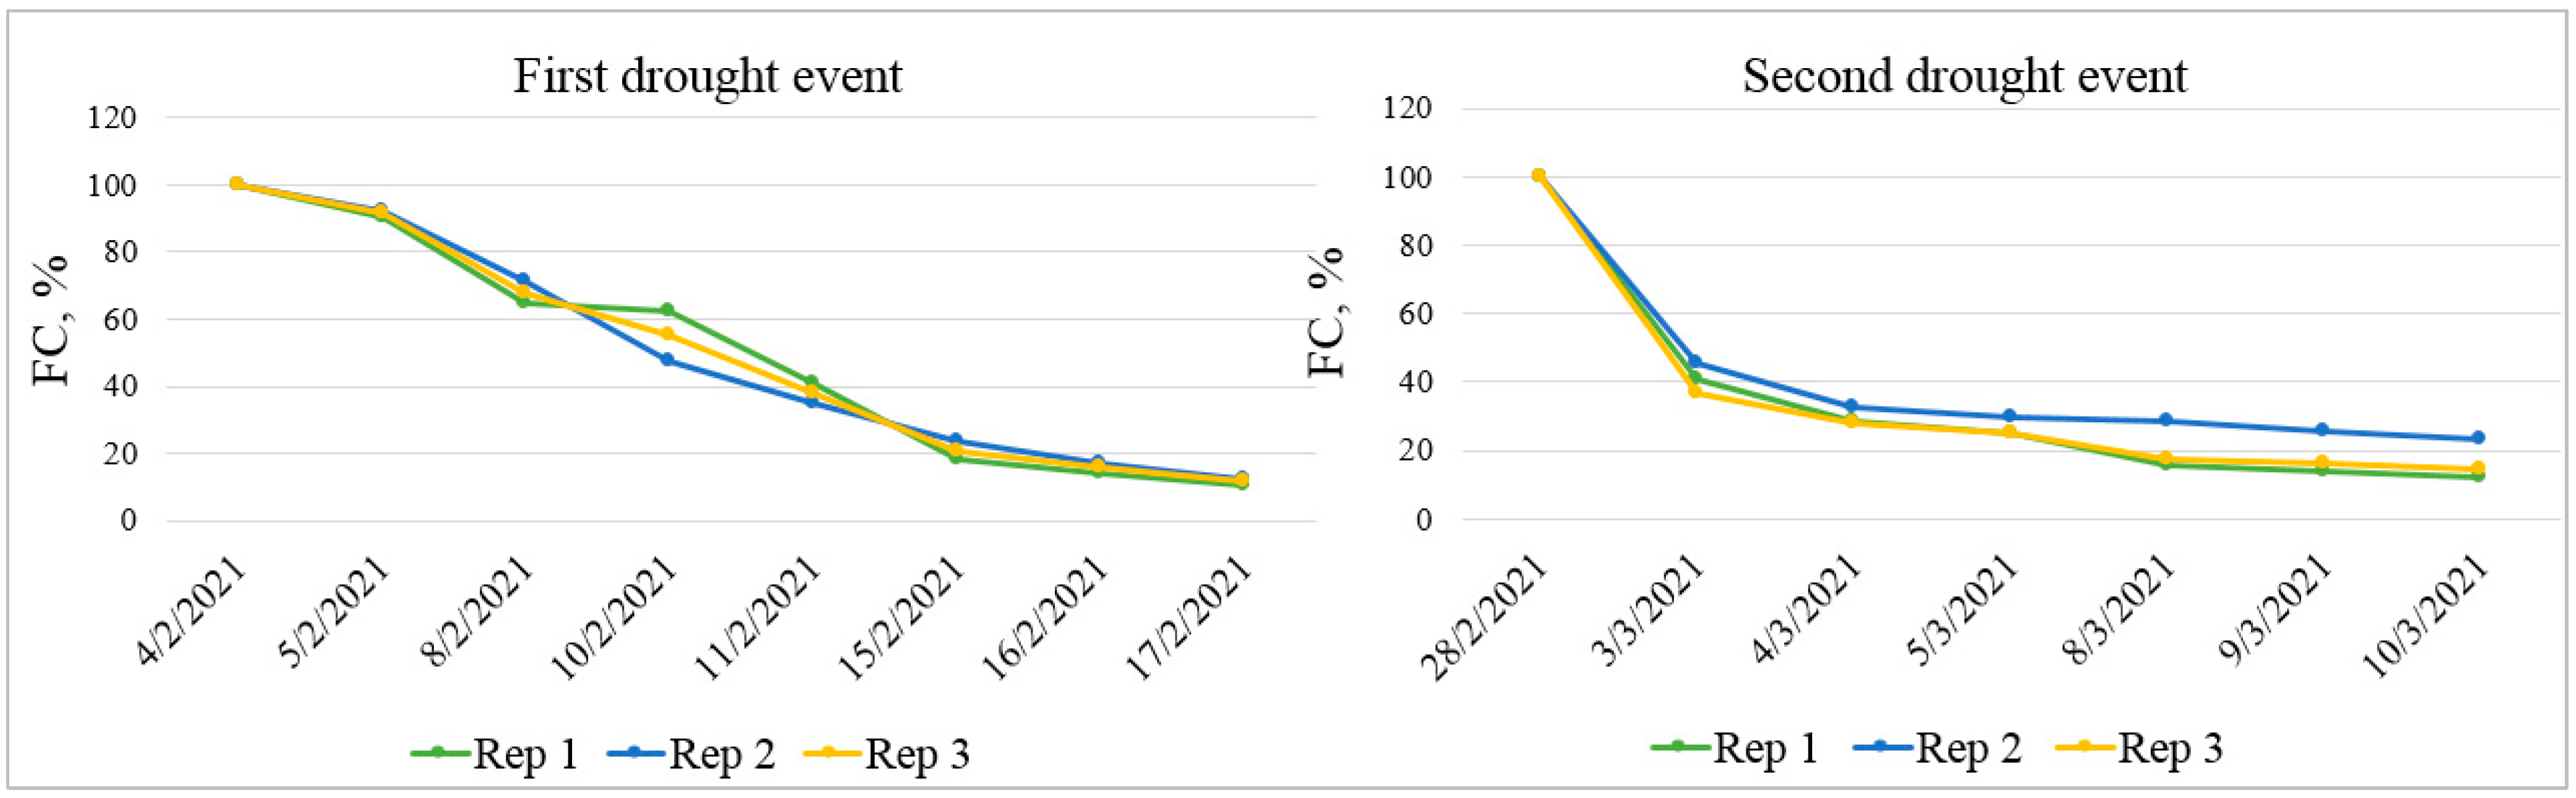
Figure 2.
Pots’ water content in terms of percentage of field capacity (FC, %) for first and second drought treatments.
Figure 2.
Pots’ water content in terms of percentage of field capacity (FC, %) for first and second drought treatments.

Figure 3.
The measurements of morphological traits for whole roots (A), topsoil (B) using Win-RHIZO system, and root angle (C) using ImageJ (°).
Figure 3.
The measurements of morphological traits for whole roots (A), topsoil (B) using Win-RHIZO system, and root angle (C) using ImageJ (°).

Figure 4.
The ratio of sum of all root lengths and total number of tips (RLW/TIW) under greenhouse conditions.
Figure 4.
The ratio of sum of all root lengths and total number of tips (RLW/TIW) under greenhouse conditions.

Figure 5.
Pictures of six durum wheat genotypes grown in field.

Figure 6.
Positive significant correlation (in green) and negative significant correlation (in red) among all traits under control conditions. NL—number of leaves; NT—number of tillers; SDW—shoot dry weight; RVW—total root volume; RLW—sum of all root lengths; TIW—total number of tips; RDW—root dry weight; SAW—total root surface area, RLD—root length density, CRW—total number of crossings; FRW—total number of forks; RS—root shoot ratio; RL5—sum of root lengths in the first 5 cm below the ground; SA5—root surface area in the first 5 cm below the ground; TI5—number of tips in the first 5 cm below the ground; RV5—root volume in the first 5 cm below the ground; RAC—root angle of plants grown in greenhouse as control; RAD—root angle of plants grown in greenhouse under drought conditions; RAF—root angle of plants grown in the field.

Figure 7.
Positive significant correlation (in green) and negative significant correlation (in red) among all traits under drought conditions and root angle under different conditions. NL—number of leaves; NT—number of tillers; SDW—shoot dry weight; RVW—total root volume; RLW—sum of all root lengths; TIW—total number of tips; RDW—root dry weight; SAW—total root surface area, RLD—root length density, CRW—total number of crossings; FRW—total number of forks; RS—root shoot ratio; RL5—sum of root lengths in the first 5 cm below the ground; SA5—root surface area in the first 5 cm below the ground; TI5—number of tips in the first 5 cm below the ground; RV5—root volume in the first 5 cm below the ground; RAC—root angle of plants grown in greenhouse as control; RAD—root angle of plants grown in greenhouse under drought conditions; RAF—root angle of plants grown in the field.

Figure 8.
Principal component analysis (A) and hierarchical cluster dendrogram applying Ward’s method (B) of the six investigated durum wheat genotypes under drought conditions. NL—number of leaves; NT—number of tillers; SDW—shoot dry weight; RVW—total root volume; RLW—sum of all root lengths; TIW—total number of tips; RDW—root dry weight; SAW—total root surface area; RS—root shoot ratio; RL5—sum of root lengths in the first 5 cm below the ground; SA5—root surface area in the first 5 cm below the ground; TI5—number of tips in the first 5 cm below the ground; RV5—root volume in the first 5 cm below the ground; RA—root angle of plants grown in greenhouse under drought conditions; RAF—root angle of plants grown in the field. * indicates significance at p < 0.05.

Figure 9.
Principal component analysis and cluster dendrogram of 6 investigated durum wheat genotypes under control (C) and drought (D) conditions. NL—number of leaves; NT—number of tillers; SDW—shoot dry weight; RVW—total root volume; RLW—sum of all root lengths; TIW—total number of tips; RDW—root dry weight; SAW—total root surface area; RS—root shoot ratio; RL5—sum of root lengths in the first 5 cm below the ground; SA5—root surface area in the first 5 cm below the ground; TI5—number of tips in the first 5 cm below the ground; RV5—root volume in the first 5 cm below the ground; RA—root angle of plants grown in greenhouse under drought conditions; RAF—root angle of plants grown in the field. * indicates significance at p < 0.05.


Table 1.
Drought effect on shoot growth and development in greenhouse experiment. D/C—drought vs. control.
Table 1.
Drought effect on shoot growth and development in greenhouse experiment. D/C—drought vs. control.
| Genotype | Shoot Dry Weight (g) | Number of Leaves | Number of Tillers | ||||||
|---|---|---|---|---|---|---|---|---|---|
| Control | Drought | D/C, % | Control | Drought | D/C, % | Control | Drought | D/C, % | |
| Azeghar | 2.1 ± 0.1a | 0.51 ± 0.1c | −75.7 *** | 16 ± 3d | 7b | −55.3 * | 3d | 1c | −66.7 * |
| Cham1 | 2.1 ± 0.1a | 0.50 ± 0.1bc | −76.3 *** | 23 ± 2c | 99 ± 1b | −62.3 *** | 5 ± 1bc | 3 ± 1b | −42.9 * |
| J. Khetifa | 2.6 ± 0.2a | 0.63 ± 0.2a | −75.9 *** | 37 ± 1a | 16 ± 1a | −56.4 *** | 9a | 4 ± 1a | −51.9 *** |
| Pelsodur | 1.6 ± 0.1b | 0.58 ± 0.1a | −63.7 * | 31 ± 1ab | 15 ± 2a | −51.1 *** | 10 ± 1a | 5 ± 1a | −50.0 *** |
| Sebatel | 2.1 ± 0.1a | 0.66 ± 0.1a | −68.4 ** | 17 ± 4d | 10 ± 1b | −43.1ns | 4 ± 1cd | 2 ± 1b | −36.4ns |
| Vulci | 2.0 ± 0.1a | 0.55 ± 0.1ab | −72.1 ** | 30 ± 6b | 16 ± 3a | −47.2 *** | 6 ± 1b | 4 ± 1a | −23.5ns |
| Genotype | ns | *** | *** | ||||||
| Treatments | *** | *** | *** | ||||||
| G × T | ns | ** | *** | ||||||
Values are means ± standard deviations (n = 3). Means with same letter in each column are not significantly different between genotypes (p < 0.05) (LSD test). ns—Not significant; *, **, and *** indicate significance at p < 0.05, p < 0.01, and p < 0.001 levels, respectively.
Table 2.
Drought effect on the whole root growth and plants development.
| Genotype | RVW (cm3) | RLW (cm) | TIW | RDW (g) | ||||
| Control | Drought | Control | Drought | Control | Drought | Control | Drought | |
| Azeghar | 5.3 ± 1.1b | 0.97 ± 0.3c | 989 ± 84 | 569 ± 186b | 1989 ± 217 | 1314 ± 329b | 0.53 ± 0.1c | 0.17 ± 0.1c |
| Cham1 | 7.0 ± 0.3b | 1.5 ± 0.5bc | 1056 ± 182 | 816 ± 125ab | 2009 ± 312 | 2299 ± 524a | 0.83 ± 0.1a | 0.26 ± 0.1ab |
| J. Khetifa | 9.7 ± 1.9a | 2.2 ± 0.2ab | 973 ± 124 | 887 ± 107a | 2218 ± 309 | 1970 ± 168ab | 0.86 ± 0.1a | 0.30 ± 0.1a |
| Pelsodur | 6.4 ± 0.9b | 2.7 ± 0.4a | 835 ± 187 | 912 ± 190a | 1775 ± 556 | 1812 ± 438ab | 0.68 ± 0.1b | 0.36 ± 0.1a |
| Sebatel | 6.1 ± 1.6b | 1.5 ± 0.1abc | 921 ± 231 | 806 ± 168ab | 1704 ± 385 | 1799 ± 489ab | 0.62 ± 0.1b | 0.25 ± 0.1ab |
| Vulci | 9.4 ± 0.5a | 2.4 ± 1.5ab | 992 ± 93 | 768 ± 36ab | 2024 ± 68 | 1742 ± 316ab | 0.72 ± 0.1b | 0.29 ± 0.1a |
| Genotype | *** | ns | ns | * | ||||
| Treatments | *** | ** | ns | *** | ||||
| G × T | ** | ns | ns | ns | ||||
| Genotype | Root/Shoot Ratio | SAW (cm2) | Root Angle (°) | RLD (cm cm−3) | ||||
| Control | Drought | Control | Drought | Control | Drought | Control | Drought | |
| Azeghar | 0.25 ± 0.1c | 0.33 ± 0.1c | 256 ± 33 | 83 ± 26c | 125 ± 4a | 108 ± 5b | 0.39 ± 0.03 | 0.23 ± 0.07b |
| Cham1 | 0.42 ± 0.2ab | 0.51 ± 0.0b | 304 ± 28 | 123 ± 24bc | 115 ± 8ab | 121 ± 1a | 0.42 ± 0.07 | 0.33 ± 0.05ab |
| J. Khetifa | 0.33 ± 0.1abc | 0.48 ± 0.1b | 345 ± 56 | 156 ± 15ab | 102 ± 2c | 105 ± 4b | 0.39 ± 0.05 | 0.35 ± 0.04a |
| Pelsodur | 0.46 ± 0.1a | 0.63 ± 0.1a | 281 ± 72 | 175 ± 15a | 94 ± 2c | 98 ± 3c | 0.33 ± 0.07 | 0.36 ± 0.08a |
| Sebatel | 0.3 ± 0.02bc | 0.38 ± 0.0c | 265 ± 68 | 124 ± 14bc | 114 ± 9b | 121 ± 1a | 0.37 ± 0.09 | 0.32 ± 0.07ab |
| Vulci | 0.43 ± 0.02ab | 0.67 ± 0.1a | 315 ± 36 | 147 ± 50ab | 114 ± 6b | 106 ± 1b | 0.31 ± 0.04 | 0.31 ± 0.01ab |
| Genotype | *** | * | *** | ns | ||||
| Treatments | *** | *** | ns | ** | ||||
| G × T | ns | ns | *** | ns | ||||
Values are means ± standard deviations (n = 3). Means with same letter in each column are not significantly different between genotypes (p < 0.05) (LSD test). RVW—total root volume; RLW—sum of all root lengths; TIW—total number of tips; RDW—root dry weight; SAW—total root surface area; RLD—root length density. ns—Not significant; *, **, and *** indicate significance at p < 0.05, p < 0.01, and p < 0.001 levels, respectively.
Table 3.
Root characteristics at a depth of the first 5 cm below ground in greenhouse experiment.
| Genotype | RL5 Root Length (cm) | SA5 Root Surface Area (cm2) | TI5 Tips | RV5 Root Volume (cm3) | ||||
| Control | Drought | Control | Drought | Control | Drought | Control | Drought | |
| Azeghar | 144 ± 35 | 96 ± 12c | 40 ± 12b | 17. ± 1.5b | 341 ± 60 | 181 ± 43b | 0.9 ± 0.3 | 0.24 ± 0.03b |
| Cham1 | 149 ± 33 | 124 ± 7bc | 46 ± 9ab | 21 ± 3b | 311 ± 82 | 375 ± 38a | 1.14 ± 0.2 | 0.28 ± 0.07b |
| J. Khetifa. | 102 ± 27 | 181 ± 28ab | 57 ± 15ab | 34 ± 3a | 231 ± 79 | 451 ± 60a | 2.88 ± 0.9 | 0.52 ± 0.07ab |
| Pelsodur | 133 ± 4 | 217 ± 49a | 51 ± 3ab | 36 ± 4a | 283 ± 63 | 396 ± 89a | 1.58 ± 0.2 | 0.49 ± 0.01ab |
| Sebatel | 120 ± 42 | 202 ± 58a | 43 ± 15b | 36 ± 7a | 246 ± 97 | 435 ± 137a | 1.26 ± 0.4 | 0.52 ± 0.05ab |
| Vulci | 138 ± 71 | 140 ± 16bc | 63 ± 3a | 33 ± 13a | 261 ± 97 | 326 ± 57a | 3.04 ± 2.3 | 0.65 ± 0.44a |
| Genotype | ns | ** | ns | ns | ||||
| Treatments | *** | *** | ** | *** | ||||
| G × T | ns | ns | ns | ns | ||||
| Genotype | (RL5/RLW) * 100 | (SA5/SAW) * 100 | RL5/TI5 | (RV5/RVW) * 100 | ||||
| Control | Drought | Control | Drought | Control | Drought | Control | Drought | |
| Azeghar | 14.7 | 17.8bc | 15.6ab | 21.4bc | 0.4 | 0.5 | 16.6 | 26.5 |
| Cham1 | 14.2 | 15.4c | 15.1b | 17.2c | 0.5 | 0.3 | 16.3 | 19.4 |
| J. Khetifa | 10.6 | 20.5ab | 16.5ab | 22.0bc | 0.4 | 0.4 | 28.3 | 23.7 |
| Pelsodur | 16.5 | 23.7a | 18.9ab | 20.7bc | 0.5 | 0.6 | 21.7 | 18.1 |
| Sebatel | 12.8 | 24.8a | 16.2ab | 29.1a | 0.5 | 0.5 | 20.6 | 34.3 |
| Vulci | 13.6 | 18.2bc | 20.1a | 22.5b | 0.5 | 0.4 | 37.2 | 28.3 |
| Genotype | ns | ** | ns | ns | ||||
| Treatments | *** | *** | ns | ns | ||||
| G × T | ns | * | ns | ns | ||||
Values are means ± standard deviations (n = 3). Means with same letter in each column are not significantly different between genotypes (p < 0.05) (LSD test). RL5—sum of root lengths in the first 5 cm below the ground; SA5—root surface area in the first 5 cm below the ground; TI5—number of tips in the first 5 cm below the ground; RV5—root volume in the first 5 cm below the ground. Description is added i.e. “ns—Not significant; *, **, and *** indicate significance at p < 0.05, p < 0.01, and p < 0.001 levels, respectively”.
Table 4.
Root characteristics of plants collected from field at a depth of the first 5 cm below ground.
Table 4.
Root characteristics of plants collected from field at a depth of the first 5 cm below ground.
| Azeghar | Cham1 | J. Khetifa | Pelsodur | Sebatel | Vulci | ANOVA | |
|---|---|---|---|---|---|---|---|
| RVF, cm3 | 0.2 ± 0.1 | 0.3 ± 0.1 | 0.2 ± 0.1 | 0.2 ± 0.1 | 0.2 ± 0.1 | 0.3 ± 0.0 | ns |
| RLF, cm | 59 ± 4cd | 89 ± 6a | 84 ± 15ab | 49 ± 6de | 38 ± 3e | 69 ± 11bc | *** |
| SAF, cm2 | 11.8 ± 2.1bc | 19.1 ± 3.4a | 14.5 ± 1.3b | 11.3 ± 2.7bc | 8.2 ± 2.9c | 15.0 ± 2.2ab | ** |
| TIF | 224 ± 48bc | 266 ± 44b | 390 ± 65a | 218 ± 83bc | 142 ± 30c | 261 ± 20b | ** |
| FRF | 223 ± 5bc | 345 ± 34ab | 449 ± 88a | 248 ± 84bc | 114 ± 50c | 446 ± 155a | ** |
| CRF | 22 ± 8 | 28 ± 7 | 50 ± 29 | 15 ± 3 | 8 ± 2 | 44 ± 29 | ns |
| RAF, ° | 112 ± 6a | 102 ± 5ab | 93 ± 6bc | 84 ± 7cd | 105 ± 5ab | 76 ± 13d | *** |
Values are means ± standard deviations (n = 3). Means with same letter in the line are not significantly different between genotypes (p < 0.05) (LSD test). RVF—root volume in the first 5 cm below the ground of plants from field; RLF—sum of all root lengths in the first 5 cm below the ground of plants from field of plants from field; SAF—root surface area in the first 5 cm below the ground of plants from field of plants from field; TIF—number of tips in the first 5 cm below the ground of plants from field of plants from field; FRF—number of forks in the first 5 cm below the ground of plants from field of plants from field; CRF—number of crossings in the first 5 cm below the ground of plants from field of plants from field; RAF—root angle of plants grown in field. ns—Not significant; **, and *** indicate significance at p < 0.01 and p < 0.001 levels, respectively.
Publisher’s Note: MDPI stays neutral with regard to jurisdictional claims in published maps and institutional affiliations. |
© 2022 by the authors. Licensee MDPI, Basel, Switzerland. This article is an open access article distributed under the terms and conditions of the Creative Commons Attribution (CC BY) license (https://creativecommons.org/licenses/by/4.0/).
Share and Cite
MDPI and ACS Style
Urbanavičiūtė, I.; Bonfiglioli, L.; Pagnotta, M.A. Diversity in Root Architecture of Durum Wheat at Stem Elongation under Drought Stress. Agronomy 2022, 12, 1329. https://0-doi-org.brum.beds.ac.uk/10.3390/agronomy12061329
AMA Style
Urbanavičiūtė I, Bonfiglioli L, Pagnotta MA. Diversity in Root Architecture of Durum Wheat at Stem Elongation under Drought Stress. Agronomy. 2022; 12(6):1329. https://0-doi-org.brum.beds.ac.uk/10.3390/agronomy12061329
Chicago/Turabian StyleUrbanavičiūtė, Ieva, Luca Bonfiglioli, and Mario A. Pagnotta. 2022. "Diversity in Root Architecture of Durum Wheat at Stem Elongation under Drought Stress" Agronomy 12, no. 6: 1329. https://0-doi-org.brum.beds.ac.uk/10.3390/agronomy12061329
Note that from the first issue of 2016, this journal uses article numbers instead of page numbers. See further details here.