Article

Comparative Genetic Diversity Analysis for Biomass Allocation and Drought Tolerance in Wheat

1
School of Agricultural, Earth and Environmental Sciences, University of KwaZulu-Natal, Pietermaritzburg 3201, South Africa
2
Laboratory of Oceanography and Climate, Experiments and Numerical Approaches (LOCEAN), UMR 7159, IRD/C NRS/UPMC/MNHN, IPSL, 75005 Paris, France
*
Author to whom correspondence should be addressed.
Submission received: 5 April 2022 / Revised: 7 June 2022 / Accepted: 13 June 2022 / Published: 17 June 2022
(This article belongs to the Topic Plant Breeding, Genetics and Genomics)

Abstract

:
Genetic diversity is invaluable in developing climate-smart and drought-adapted wheat varieties. The aim of this study was to determine the extent of genetic variation present in wheat germplasm collections for biomass allocation and drought tolerance based on complementary phenotypic and root attributes and high-density single nucleotide polymorphism (SNP) markers to select breeding parents. A total of 97 bread wheat (Triticum aestivum L.) genotypes were evaluated in field and greenhouse trials under drought-stressed and non-stressed conditions. The molecular variance analysis showed that the intrapopulation variance was very high at 99%, with a small minimal inter-population variance (1%). The genetic distance, polymorphic information content and expected heterozygosity were 0.20–0.88, 0.24–1.00 and 0.29–0.58, respectively. The cluster analysis based on SNP data showed that 44% and 28% of the assessed genotypes maintained their genetic groups when compared to hierarchical clusters under drought-stressed and non-stressed phenotypic data, respectively. The joint analysis using genotypic and phenotypic data resolved three heterotic groups and allowed the selection of genotypes BW140, BW152, BW157, BW162, LM30, LM47, LM48, LM52, LM54 and LM70. The selected genotypes were the most genetically divergent with high root biomass and grain yield and are recommended for production or breeding.

1. Introduction

Wheat (Triticum aestivum L., 2n = 6x = 42, AABBDD) is a highly valued commodity crop cultivated on about 216 million hectares and provides some 766 million tonnes of grain annually globally [1]. In sub-Saharan Africa (SSA), wheat productivity remains low, with a total production of 7.5 million tonnes accounting for only 1.4% of global wheat production [2]. Wheat production in sub-Saharan Africa (SSA) is predominantly under dryland conditions. The region is exceptionally vulnerable to climate change, with devastating consequences on poor productivity and food insecurity [3]. Climate change-induced abiotic stresses, such as heat, drought and poor soil fertility conditions, are the major cause of low wheat productivity [4]. Pironon et al. [5] reported that new sources of genes with abiotic stress tolerance, targeted breeding and speed breeding technologies are among the key strategies in increasing the productivity and adaptive capacity of dryland agriculture in SSA. Therefore, ideotype breeding using key above-ground yield influencing traits, root biomass and root-related traits in plant breeding programs will directly increase drought-stress tolerance and resilience of crops.
The root system is a vital part of a plant providing anchorage and support, access and mobilization of water and nutrients and soil carbon sequestration for plant growth and development [6]. However, breeding under intensive agronomic management and high input production systems has progressively led to weaker root systems in modern wheat cultivars [7,8]. As a result, most modern wheat varieties are highly susceptible to moisture stress, and their weak root system has limited agility to environmental adaptation and access to soil moisture and nutrients [9]. Developing new and modern wheat cultivars with optimized biomass allocation and large root systems will enhance adaptation and wheat productivity in dryland farming systems of SSA [10].
Breeding for high-yielding varieties with robust root systems requires adequate genetic variation for above-ground agro-morphological traits and root biomass. However, due to difficulties associated with root sampling and phenotyping, a few studies have evaluated genetic variation and selection for root traits in wheat [11,12,13,14,15]. Above-ground phenotypic traits such as days to flowering and maturity, tillering ability, plant height and grain yield can be assessed using direct and simple measurements. However, assessing root attributes such as root biomass, root length and root diameter is laborious and invasive, requiring destructive sampling to access root samples [16]. Understanding the interrelationship between above-ground phenotypic traits and root attributes could allow breeders to manipulate biomass allocation between roots and shoots to create a better crop ideotype with more extensive roots to improve productivity in a wide range of environments [17]. For instance, high root biomass has been found to be highly correlated with improved seedling shoot development, water use efficiency and high grain yield [18,19,20,21]. Dual selection for increased root biomass and yield gain is dependent on the balance of sink-source between root and reproductive organs [22].
Genetic diversity analysis through phenotypic traits and root attributes is affected by genotype by environment interaction. Crop species have phenotypic plasticity and modify their response due to prevailing environmental conditions [23]. Phenotypic plasticity could limit the efficiency and accuracy of phenotyping [24]. Conversely, genomic tools such as genomic selection, genome engineering, genome editing and quantitative trait loci (QTL) analysis have become valuable in crop improvement programs, including wheat [25,26,27]. Different molecular markers such as random amplified polymorphic DNA (RAPD), simple sequence repeat (SSR) and single nucleotide polymorphism (SNP) markers have been used in genetic diversity studies of wheat [28,29,30]. SNP markers have gained prominence in genetic diversity analysis due to wide distribution across the genome, genetic stability, compatibility with automation and ease of genotyping [31,32]. SNP markers are especially suitable for studying the genetic diversity of crops with a large and complex genomic structure, such as wheat [33]. Therefore, it is essential to complement phenotypic selection with molecular markers to capture allelic diversity [34] and understand the underlying genetic basis and interrelationships with root traits and biomass partitioning.
Optimizing biomass allocation in new wheat cultivars would increase productivity in rain-fed agro-ecologies while concurrently reducing agriculture’s carbon footprint [17]. Assessing the genetic variation among available wheat germplasm will provide information to classify wheat genotypes into different genetic groups for combining ability analysis and development of new breeding populations. Therefore, the aim of this study was to determine the extent of genetic variation present in wheat germplasm collections for biomass allocation and drought tolerance based on complementary phenotypic and root attributes and high-density single nucleotide polymorphisms (SNP) markers to select breeding parents.

2. Materials and Methods

2.1. Germplasm

A panel of 97 bread wheat (T. aestivum L.) genotypes were used for the study. Ninety-two of the genotypes were obtained from the International Maize and Wheat Improvement Center (CIMMYT) drought and heat tolerant nurseries. The genotypes were selected for their potential drought tolerance and diversity in rooting ability. The remaining five genotypes were locally adapted and widely grown lines that were included to serve as checks. The names and pedigrees of the assessed genotypes are presented in Table S1.

2.2. Phenotyping Trials

Three separate experiments were conducted under drought-stressed and non-stressed conditions. Two greenhouse trials were carried out at the Controlled Environment Facility (CEF), and one field trial was conducted at the Ukulinga Research Farm (29°40′ S, 30°24′ E) of the University of KwaZulu-Natal (UKZN) in South Africa between 2016 and 2018. The greenhouse experiments were all laid out in a 10 × 10 alpha lattice design with two replications. Plants were sown in 10 L capacity plastic pots filled with composted pine bark. Eight seeds were initially planted and thinned to five plants per pot after two weeks of growth. Irrigation and fertiliser (Agchem EasyGro Starter, Pietermaritzburg, South Africa and Agchem Easygro Calmag, Pietermaritzburg, South Africa) were applied using an automated drip irrigation system as per recommendation [35]. The plants received 3 min fertigation cycles four times daily to maintain moisture content at 70% of field capacity (FC). Adequate water was supplied for six weeks after emergence before initiating the drought stress treatment accordingly. Drought stress was induced by withholding irrigation until soil water content dropped to 30% FC and then re-watering to field capacity to allow for continued plant growth and development. The non-stressed treatment received adequate moisture until maturity. The soil moisture was monitored with a soil moisture probe (GTDSMM500, General Tools and Instruments, Secaucus, NJ, USA).
The field experiment was laid out in a 10 × 10 alpha lattice design with two replications. The soil surface was covered with a custom-made black plastic mulch to exclude infiltration of rainwater in the soil profile. Each genotype was planted on a 0.5 m long row, and the rows were 0.5 m apart. Ten plants per genotype were established equidistant within a row. Nitrogen, phosphorous and potassium were applied at rates of 120, 30 and 30 kg ha−1, respectively, at planting as per recommendation [35]. Water was supplied by an automated drip irrigation system. For the non-stressed treatment, adequate water was supplied until maturity. Drought stress was induced by withholding irrigation five weeks after emergence in the drought treatment. After that, irrigation was sparingly applied to prevent permanent wilting. Soil moisture was monitored using digital moisture sensors (HOBO UX120, Onset, Bourne, MA, USA).
Data on days to 50% heading (DTH), days to 50% maturity (DTM), plant height expressed in centimeters (PH), tiller number (TN), plant biomass (PB, gm−2), shoot biomass (SB, gm−2), root biomass (RB, gm−2), root-to-shoot ratio (RS) and grain yield (GY, gm−2) were recorded from both greenhouse and field trials. Prior to analysis, data from greenhouse and field experiments were standardized by adjusting the plot size per m2 area to allow comparison between greenhouse and field plots.
Genotypes were grouped into three drought tolerance levels based on the grain yield obtained under drought-stressed conditions (Table 1). Genotypes with grain yield > 500 gm−2 were considered drought tolerant, 300 to 500 gm−2 as intermediate tolerant and <300 gm−2 as susceptible.

2.3. Analysis of Phenotypic Data

Data collected from each trial was subjected to Bartlet’s homogeneity of variance test prior to a combined analysis of variance (ANOVA) using the lattice procedure. Three-way interactions were assessed involving genotype, water regime and site in Genstat 18th edition [36]. Data were subjected to significance tests using the Fischer’s Unprotected Least Significant Difference (LSD) 5% probability. The adjusted means were further subjected to principal component analysis using SPSS version 25.0 software [37] to assess genotype relatedness. Best linear unbiased predictors (BLUP) were calculated using the nlme package in R software [38] across the environments to eliminate the environmental influence in downstream analysis. Hierarchical clusters were generated using phenotypic data based on the Gower method [39]. The phenotypic clusters were constructed using the Cluster package in R software [40]. Different phenotypic clusters were generated for the drought-stressed and non-stressed conditions.

2.4. Genotyping

For DNA extraction, the 97 wheat genotypes were planted in seedling trays and raised in the greenhouse at UKZN. Genomic DNA was extracted using the modified CTAB method [41] from fresh leaves of three-week-old seedlings using Quick-DNA Microprep Plus (Zymo Research, Irvine, CA, USA) according to the manufacturer’s procedures. Nucleic acid concentration and purity of the DNA were assessed using a NanoDrop 2000 spectrophotometer (ND-2000 V3.5, NanoDrop Technologies, Inc., Wilmington, DE, USA). The DNA samples were then sent to Diversity Arrays Technology (DArT) Pty Ltd. (Bruce, Australia) for genotyping by sequencing on the DArT platform.

2.5. Analysis of Genotypic Data

The marker data were subjected to quality control using minor allele frequency, missing data and heterozygosity parameters. Markers with less than 5% minor allele frequency and more than 20% missing data were eliminated from the data. After that, 16,382 markers distributed across the 21 chromosomes were used in the final data analysis. Genotypes with more than 95% heterozygosity were eliminated from the analysis. Genetic parameters such as genetic distance (GD), polymorphism information content (PIC), minor allele frequency (MAF), observed heterozygosity (Ho) and inbreeding coefficient (F) were calculated for the markers and individuals using the different population groups based on drought tolerance levels of individual genotypes (Table 1) using Powermarker V3.25 software [42]. Hierarchical clusters were generated using genotypic data based on Jaccard’s coefficient [43]. A joint hierarchical cluster was generated using combined data from genotypic and phenotypic dissimilarity matrices. The clusters were constructed using the “Cluster” package in R software [40]. Analysis of molecular variance was conducted using the different population groups based on drought tolerance levels (Table 1) using Powermarker V3.25. The genotype hierarchical cluster was compared to the drought-stressed and non-stressed hierarchical cluster using the Viridis package in R [44] to observe grouping patterns between genotypic and phenotypic data.

3. Results

3.1. Phenotyping

3.1.1. Genotype and Water Regime Effects on Agronomic Traits and Grain Yield

The recorded traits, including PB, SB, RB, RS and GY, exhibited significant genotypic and site variability, while the water regime was significant for all assessed traits except DTH. The effects of the three-way interaction involving genotype, site and water regime were significant for DTM, TN and RS (Table 2). The genotype × site interaction had a significant impact on all traits apart from GY. On the other hand, the DTH and DTM response was significantly affected by the interaction between genotype and water regime.
Genotypes LM52 (with grain yield of 929.40 gm−2), LM30 (927.70 gm−2) and LM157 (782.00 gm−2) were the highest yielding genotypes with high root biomass (>200 gm−2) under drought stress. The phenotypic data showed wide ranges between the minimum and maximum values for each of the traits. GY and RB had ranges of 731.40 gm−2 and 400 gm−2, respectively, under drought-stressed conditions (Table 3). The higher variability was observed under non-stressed conditions than drought-stressed for TN, PB, SB and GY and vice-versa for DTH, DTM, PH, RB and RS as observed among the range of values.

3.1.2. Principal Components of Phenotypic Data

The first three components with Eigenvalues above 1.00 accounted for 70.86% of the total variation under drought-stressed conditions (Table 4). Total plant biomass (0.92), shoot biomass (0.87), root biomass (0.73) and grain yield (0.74) had the highest contributions to the variation explained by the first principal component (PC1), which accounted for 33.92% of the total variation. The second principal component (PC2) explained 21.87% of the total variation and was associated with the DTH (0.83) and DTM (0.74), which had the highest contributions to this principal component. Root-to-shoot ratio (0.87) had the highest contribution to the third principal component (PC3), which accounted for 15.08% of the total variation.
Under non-stressed conditions, the first three PCs with Eigenvalues above 1.00 explained 68.60% of the total variation among the genotypes (Table 4). Notably, PB (0.97), SB (0.86), RB (0.70) and GY (0.75) had the highest contributions to PC1, which explained 31.80% of the total variation. The highest loadings on PC2 were contributed to by DTH (0.88) and DTM (0.74). Plant height (0.71) had the highest loading on PC3, which accounted for 14.81% of the variation. Root-to-shoot ratio and RB had negative loadings of −0.74 and −0.44, respectively, on PC3.

3.1.3. Phenotypic Hierarchical Clustering

Using phenotypic data, hierarchical cluster analysis allocated the wheat genotypes into three groups under non-stressed conditions (Figure 1). The largest cluster (cluster II) contained 45 genotypes, followed by the second largest cluster (cluster III) with 37 genotypes. In general, cluster II contained late maturing genotypes with low plant biomass and grain yield. High yielding genotypes (LM52, BW63 and BW127) were grouped in cluster I, which was characterized by shorter genotypes with early heading, high RB (BW148 and BW152) and high tiller number. Cluster III consisted of genotypes with high root biomass and late flowering.
The genotypes were also grouped into three groups under drought-stress conditions (Figure 2). The first and second largest clusters (cluster III and cluster II, respectively) had 62 and 23 genotypes, respectively, while cluster I had 12 genotypes only. Cluster III consisted of late heading and maturity genotypes with high root-to-shoot ratios. Genotypes with early maturity and low plant biomass were grouped in cluster I. Cluster II contained genotypes with high root and plant biomass and early heading. However, there were some high-yielding genotypes in each cluster.

3.2. Genotyping

3.2.1. Population Genetic Parameters Based on SNP Markers

The general pattern showed that the average values of the genetic parameters did not vary widely among the different populations of highly drought-tolerant, intermediate tolerant and susceptible genotypes (Table 5). The genetic distances of the different populations ranged from 0.20 to 0.88. The polymorphic information content showed that the tested markers contained non-polymorphic and highly polymorphic markers. The lowest PIC was 0.24, while the highest was 1. The average minor allele frequency was highest for the susceptible genotypes (0.47) and was lowest for drought-tolerant genotypes (0.43). The genotypes exhibited high levels of heterozygosity, ranging between 0.29 and 0.58. The inbreeding coefficient had lower and upper values of −0.60 and 0, respectively.

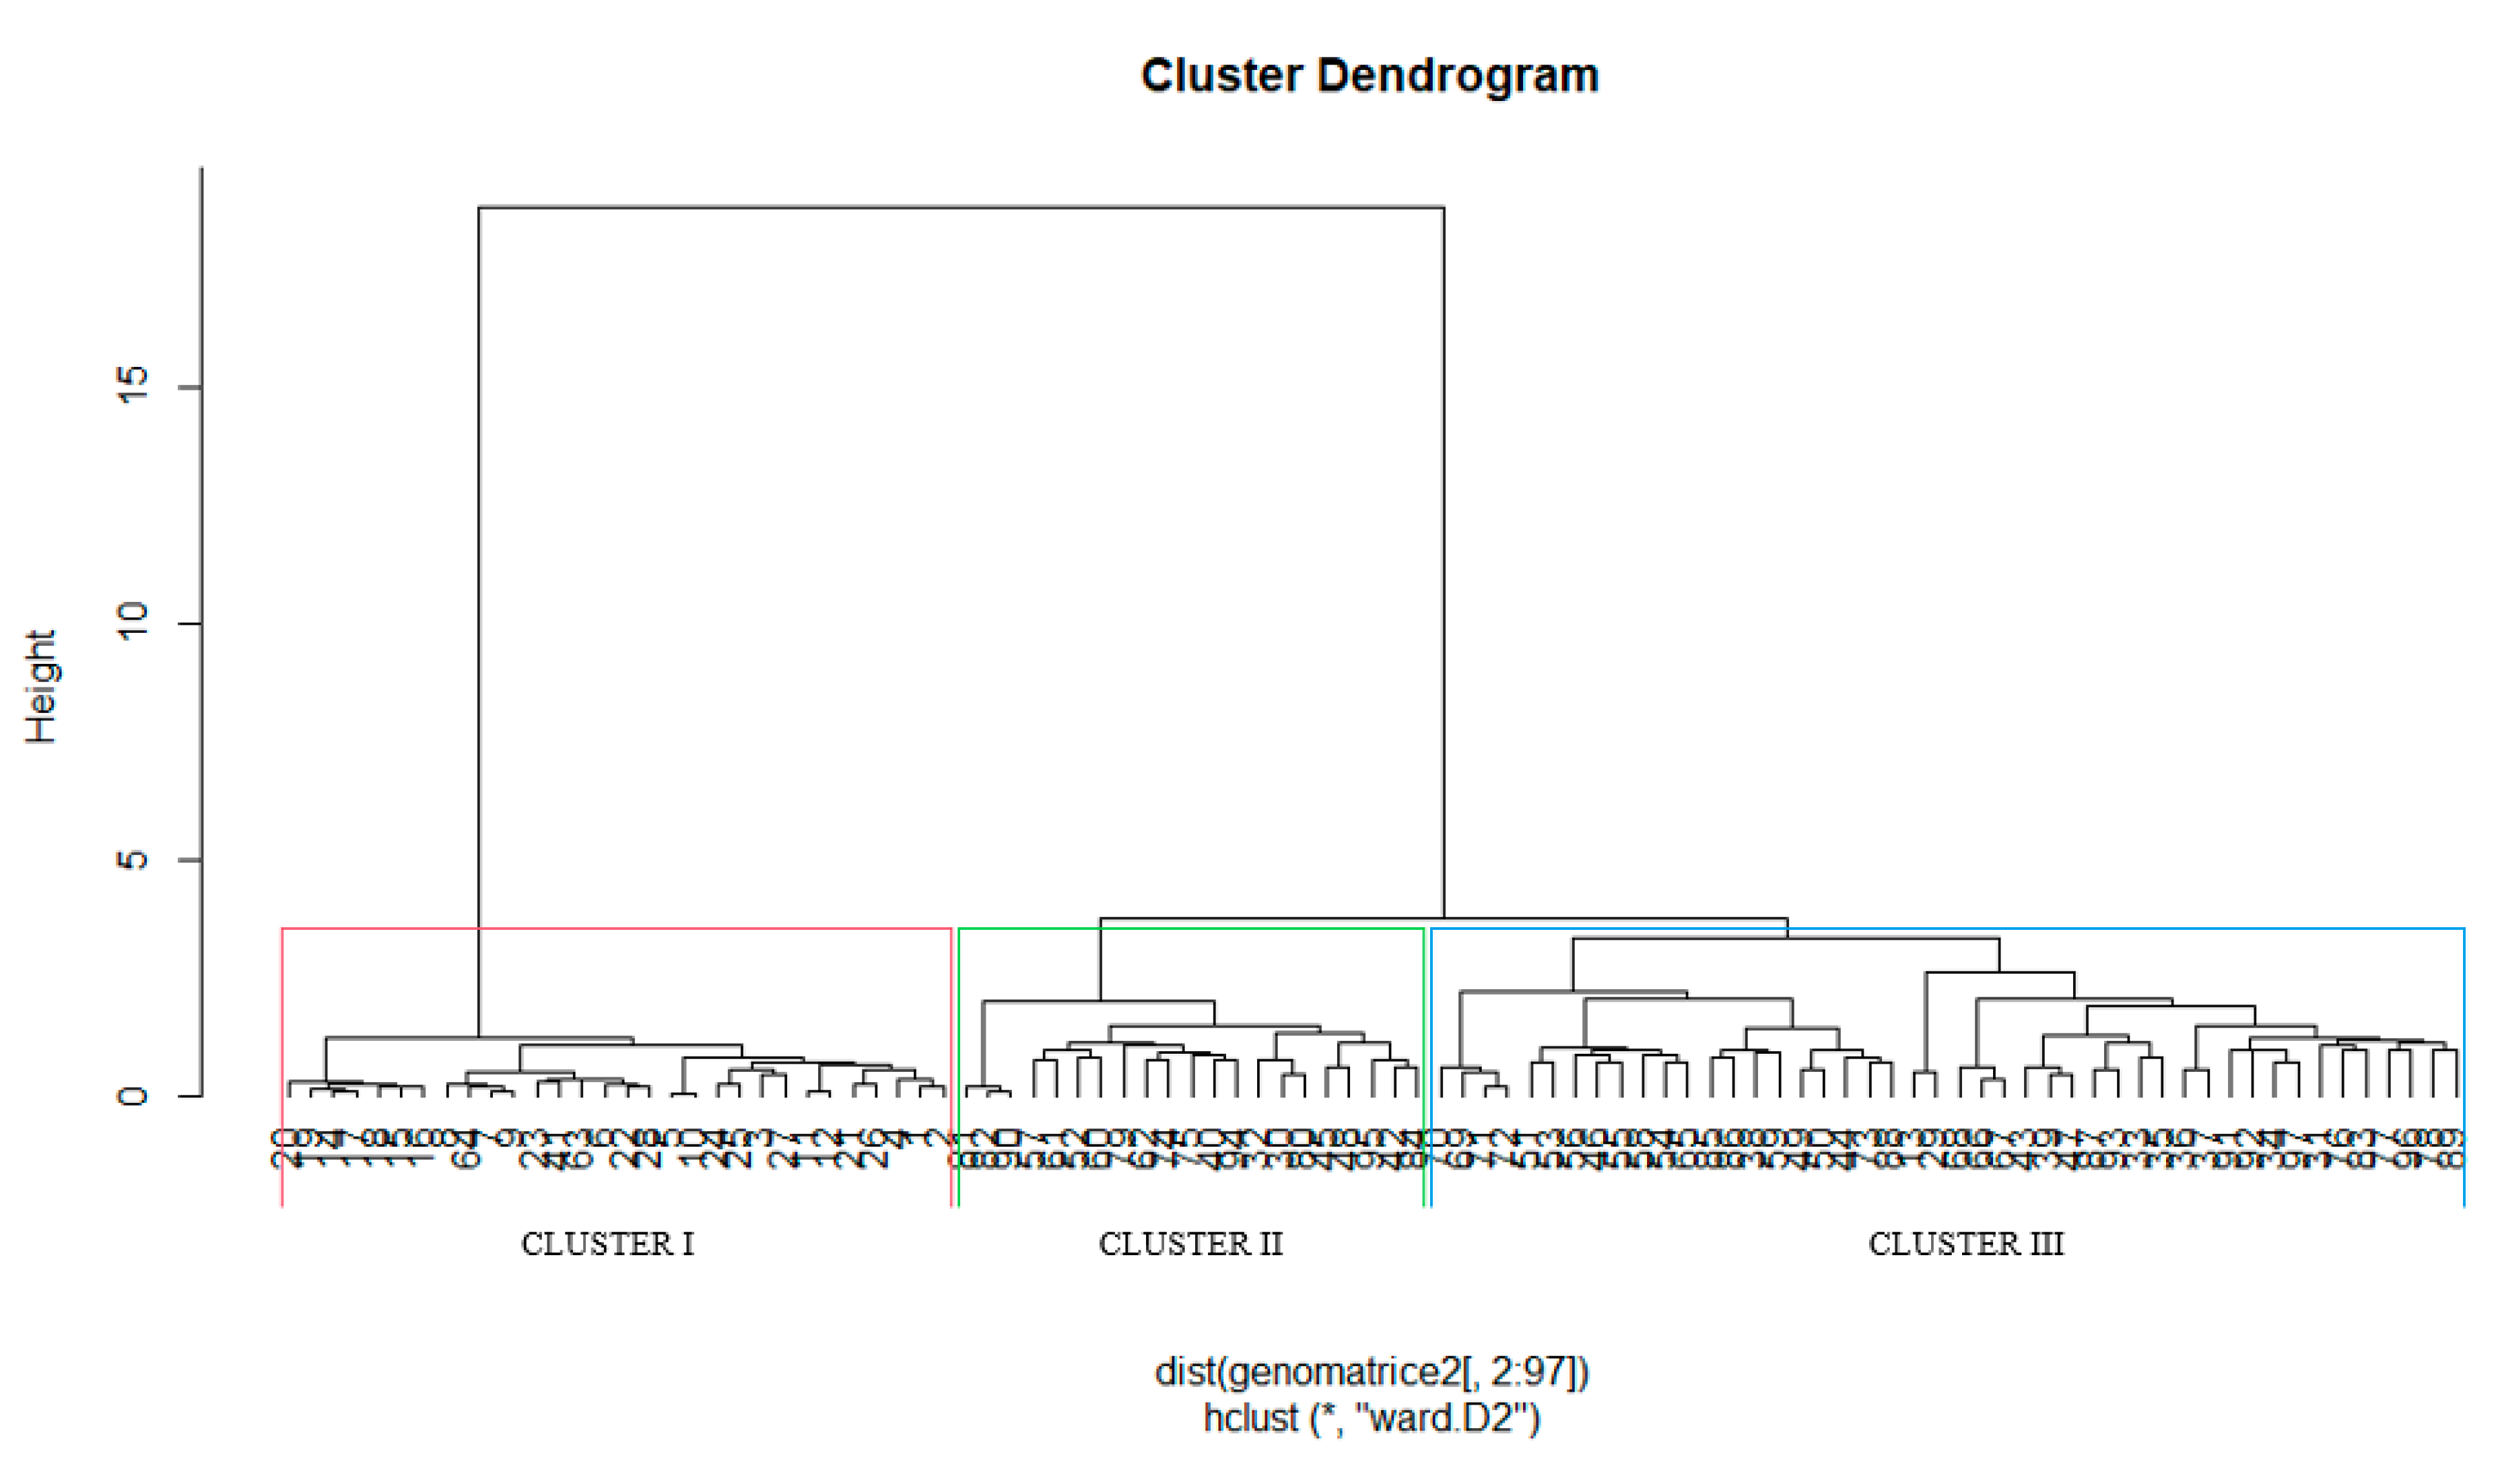
3.2.2. Analysis of Molecular Variance and Genotypic Hierarchical Clustering

Analysis of molecular variance was conducted based on observed drought tolerance levels of individual genotypes using phenotypic data (Table 1). The within-population variation was very high (99%) with a negligible among-population variation of 1% (Table 6).
The genotypes were grouped into three heterogeneous clusters based on the SNP markers (Figure 3). The largest cluster (cluster III) had 46 genotypes, followed by cluster I with 30 and cluster II with 21. Cluster III contained genotypes from the International Bread Wheat Screening Nursery (IBWSN) program at CIMMYT and three from the 6th Heat Tolerant Wheat Screening Nursery (HTWSN) designated as LM23, LM47 and LM48. Common parents for most genotypes in this cluster included 0B, WGY and 099TOPY. Cluster I and Cluster II consisted of genotypes that were part of the HTWSN.

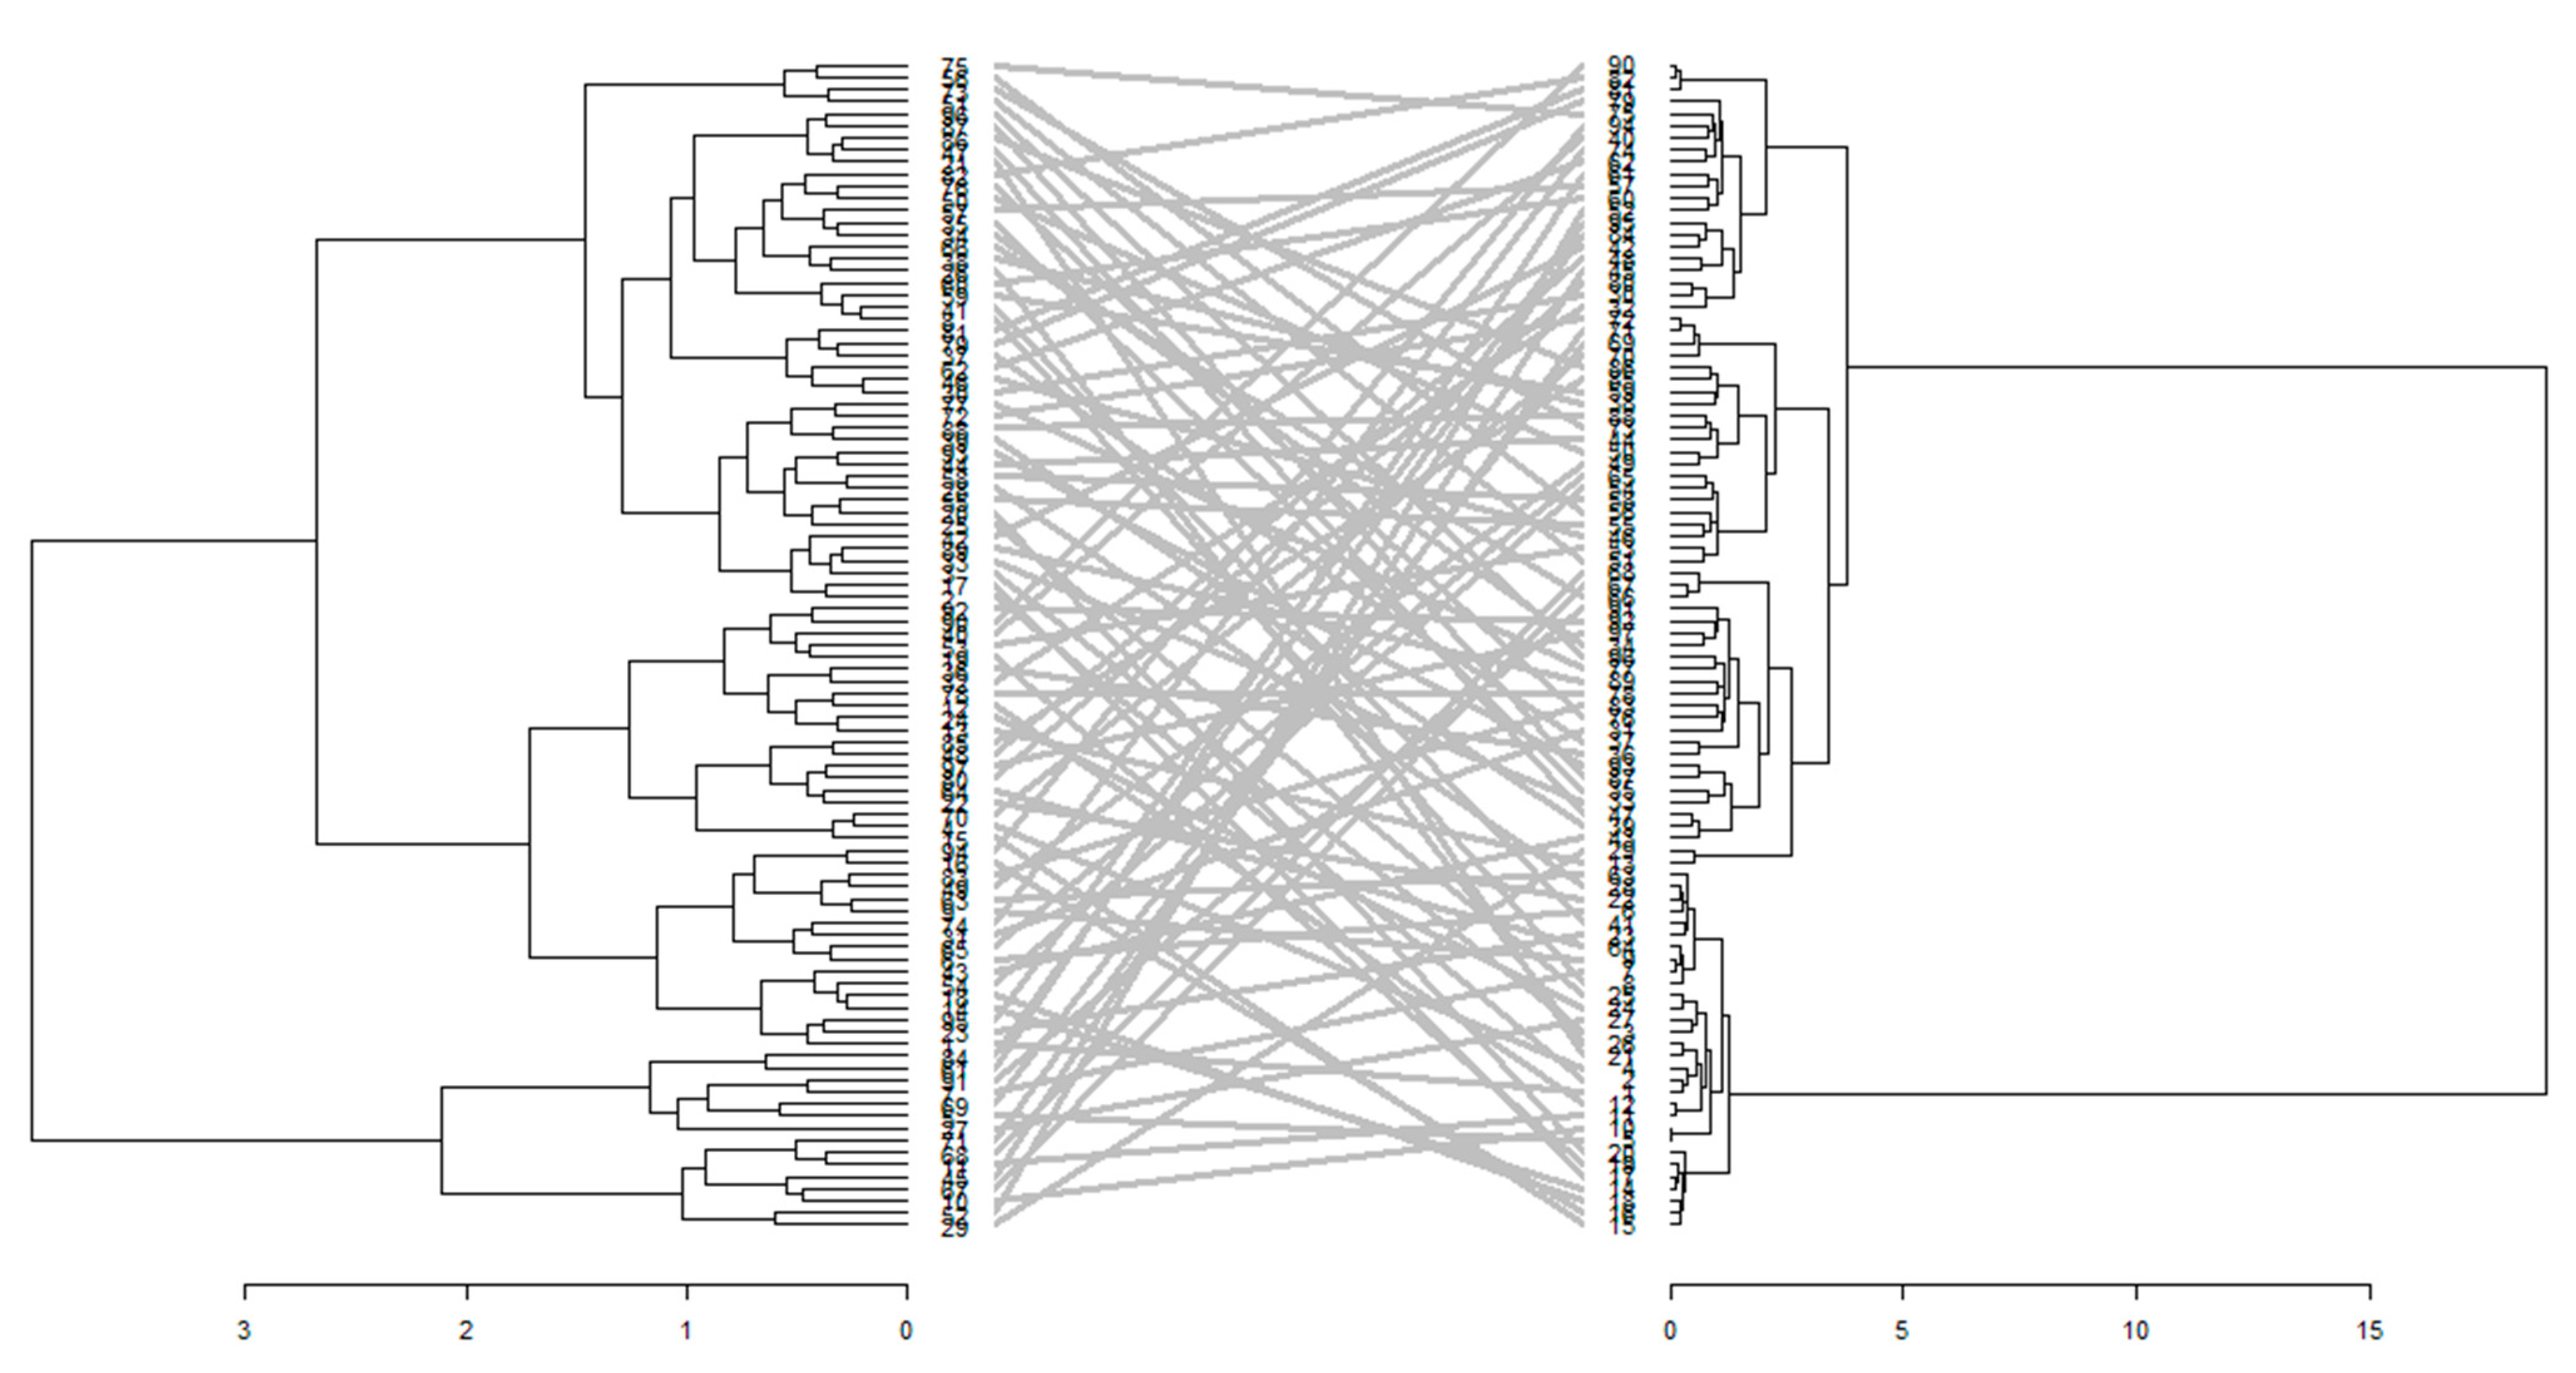
3.2.3. Comparison of Phenotypic and Genotypic Hierarchical Clusters

A comparison of genetic and phenotypic clusters was conducted to determine genotype consistency between different dendrograms. None of the genotypes maintained their positions when genotypic hierarchical clusters were compared to phenotypic clustering under non-stress conditions (Figure 4). Similarly, the genotypic clustering was discordant with the phenotypic clusters under drought-stressed conditions (Figure 5). Under drought stress, only two genotypes (LM56 and LM57) maintained their positions across the genotypic and phenotypic dendrograms. The tanglegram comparison showed that 44% of the genotypes under drought stress maintained their cluster membership in the genotypic and phenotypic hierarchical clustering (Figure 4). Under non-stress conditions, only 28% of genotypes maintained their membership in the genotypic and phenotypic hierarchical clustering (Figure 5). Three different clusters were revealed by the joint matrix of phenotypic and genotypic data (Figure 6).

4. Discussion

4.1. Genotypic Variation for Agronomic Traits and Biomass Allocation

The effect of crop genetics, water availability and growth site on biomass partitioning was strong. Different genotypic responses for key traits (Table 2) such as plant biomass, shoot biomass, root biomass, root-to-shoot ratio and grain yield in the same environments reflect a high genotype by environment interaction and presence of genetic diversity for these traits [45]. Substantial differences in the allocation of biomass and carbon between roots and shoots of different cultivars have been observed with influence from biomass-related traits such as tillering ability [46] and plant height [47]. Manipulating these traits to optimize biomass allocation to roots would increase the capacity of crops to support higher biomass production and grain yield in the absence of sufficient soil moisture [48]. Schneider et al. [49] propose the use of root plasticity as a target trait in plant breeding programs to stabilize crop productivity across diverse environments. Thus, a better understanding of the contribution of roots to yield is important in breeding climate-smart crops. Hence, the plant breeders will need to integrate root phenotyping to improve wheat productivity in resource-poor wheat production environments [50].

4.2. Multivariate Relationships Explained by Principal Components

The presence of high genetic variation in this panel of genotypes can be exploited to develop breeding populations and identify recombinants with superior traits for drought adaptation. The high contributions of plant biomass, shoot biomass, root biomass and grain yield on the first principal component indicate that these traits were the most important in explaining the variation among the genotypes (Table 4). Refs. [51,52] suggest that optimizing biomass allocation will provide more benefits in selection as opposed to increasing one parameter of biomass such as root biomass alone. These traits can therefore be used together for parental selection to develop breeding populations with improved biomass allocation for both grain yield and root biomass. This will increase the adaptability of wheat cultivars across a diverse range of environments, as the traits above were important in explaining variation under both drought-stressed and non-stressed conditions.

4.3. Phenotypic Clustering of Genotypes and Implications for Drought Tolerance and Carbon Sequestration Breeding

Genotypes such as LM52, BW63 and BW127 that were grouped in cluster I under non-stressed conditions (Figure 1) can be selected to develop breeding populations for improving grain yield in wheat. This cluster also contained generally short genotypes with early heading and high root biomass, which are critical attributes for drought escape and carbon sequestration potential. Early heading has been exploited in crop improvement programs to develop cultivars that can complete their growth cycle before the onset of terminal drought stress [53]. High root biomass exhibited by the genotypes in this cluster will be useful for improving root systems in wheat. Extensive rooting ability renders an advantage in moisture-stressed conditions by increasing crop access to water in deeper soil profiles [54] while also contributing to nutrient recycling, especially carbon by rhizodeposition [55]. Breeding for shorter plants with improved harvest indices and lodging resistance was exploited in the green revolution with great success [56]. On the other hand, tall plants usually have higher biomass than shorter plants which contributes to carbon sequestration; however, tall plants are prone to lodging, which negatively impacts grain yield [57]. Genotypes from cluster III under drought-stress (Figure 2) were generally late maturing, making them ideal for long-season environments that are not prone to terminal droughts [58]. In the optimal production conditions, it would be ideal to cultivate late maturity genotypes to maximize irradiation and moisture availability because early maturing genotypes incur a yield penalty due to accelerated growth and development [59]. For carbon sequestration, late maturity genotypes have prolonged periods for carbon assimilation in the biosphere. However, under drought conditions, these positive attributes increase the susceptibility of these genotypes to moisture stress. The high root-to-shoot ratios observed in cluster III would be useful during breeding for optimized biomass allocation [60]. High root-to-shoot ratios indicate that the root systems of these genotypes were large enough to support the above-ground structures and possibly provided a means for increased carbon deposition in the soil [61].

4.4. Genotypic Clustering and Molecular Variance

The low variability of the genetic parameters among the populations indicates a narrow genetic base, which could be from common parentage; the genotypes were mainly sourced from CIMMYT’s heat and drought stress nurseries. A considerable number of genotypes had one or two common parents in their pedigrees. The use of a select few elite parents is common in modern breeding programs. This has led to a focus on improving target traits and discarding any material that does not meet the breeding objectives [62]. However, the continuous use of a few selected lines contributes to narrowing genetic diversity for important traits such as rooting ability, which predisposes modern cultivars to moisture and nutrient deficiencies [63,64]. Landraces possess genetic variation for drought adaptive traits, which are absent in modern cultivars and can be harnessed in breeding programs to develop new cultivars with enhanced stress tolerance [65]. The major challenge would be the need to break linkage with unfavorable traits often encountered when using landraces.
The unexpectedly high level of heterozygosity observed in the population (Table 5) could provide an opportunity to develop new segregants for wheat improvement. Ideally, the population was expected to exhibit lower levels of heterozygosity because the genotypes were advanced generations. However, high levels of heterozygosity have also been observed in advanced wheat lines [66], providing a basis for developing new and useful recombinants after mating divergent genotypes. It would be imperative to select the most genetically distant and phenotypically divergent genotypes for developing breeding populations and crosses that may be advanced for release as varieties.
Cluster analysis grouped genotypes from drought and heat tolerant nurseries in the same clusters indicating that these genotypes are closely related. Heat and drought tolerance are highly correlated, and common genomic loci coding for the combined effect of heat and drought stresses have been identified [67,68,69]. Drought-adaptive traits such as stay-green characteristics and delayed senescence are also observed in wheat genotypes that are tolerant to heat stress indicating that common physiological processes may be responsible for plant response to both drought and heat stress [70].
The molecular variance analysis (Table 6) showed that the intrapopulation variance was very high at 99%, with a small minimal inter-population variance (1%). Autogamous crops like wheat are characterized by low cross-fertilization. This will suppress deleterious genes and promote high intrapopulation diversity observed within the populations [71,72]. This high variation can be exploited to develop new breeding populations with higher productivity than the parental genotypes. The low among-population variance among the populations indicates that similar genetic gains could be achieved even by selecting divergent genotypes within the same populations.

4.5. Genotypic and Phenotypic Divergence under Different Water Regimes

Genetic markers reveal allelic diversity, while phenotypic traits are important indicators of genotype performance in a given environment. As such, the genotype and phenotypic clusters under both water conditions were largely inconsistent because of genotype–environment interactions, which caused fluctuations of phenotypic expression in morphological traits [73]. The inconsistent genetic and phenotypic clustering under both soil moisture conditions can also be attributed to low precision in phenotyping some traits [74], especially root traits that are subject to large environmental variance. Despite the differences constantly observed between genotype and phenotype clusters, the methods are complementary and are useful in assessing wheat genetic diversity for drought tolerance and carbon sequestration as they provide a foundation for identifying underlying genetic control of these traits. Thus, the complementary use of genetic and phenotypic markers in selection would improve selection efficiency by consolidating all the variation in the individuals [34].
Higher consistency in the genotypic and phenotypic clustering under drought-stressed conditions compared to non-stressed conditions could be due to the selection pressure exerted by the drought treatment. Drought induces drought-adaptive biochemical and physiological processes that differ in intensity and duration, resulting in variable phenotypic expression among cultivars [75,76]. In addition, certain genes that confer drought tolerance are only induced in response to stress and dehydration in the plant [75]. In the absence of stress, these genetic regions will not be activated, and thus, it will not be ideal for identifying quantitative trait loci or superior lines in a panel of genotypes with similar underlying responses to soil moisture dynamics. Therefore, multi-environment trials would provide more information on genotype performance by considering different selection pressures exerted by the environments, thereby increasing consistency in the grouping of genotypes.
The joint matrix of phenotypic and genotypic data was used to consolidate the genotypic and phenotypic data to group the genotypes into different heterotic groups to select genotypes for combining ability analysis. This provides the opportunity to select based on both phenotypic and molecular data. Genotypes LM30, LM48, LM52, LM54 and LM70, were selected from cluster I and BW152, BW157, BW162 and LM47 were selected from cluster II. One genotype (BW140) was selected from cluster III, which consisted of only six genotypes. The selected genotypes were divergent and had high grain yield and root biomass.

5. Conclusions

The study revealed the presence of genetic variation that is useful for developing climate-smart and drought-adapted wheat varieties. Principal component analysis revealed that PB, SB, RB and GY explained most of the variation among the genotypes under drought-stressed and non-stressed conditions. Genetic parameters varied widely with the genetic distance, polymorphic information content and expected heterozygosity ranges 0.20–0.88, 0.24–1.00 and 0.29–0.58, respectively. Analysis using genotypic and phenotypic data resolved three heterotic groups and allowed for the selection of desirable parents for combining ability analysis. Information gathered in this study was important in highlighting the utility of biomass allocation partitioning and how it can be utilised to develop new breeding populations to produce climate-smart cultivars more adaptable to changing edaphic and climatic conditions. We recommend conducting genetic diversity analysis in more environments to capture the variation due to the genotype–environment interaction and increase the consistency of the information gathered from phenotypic and molecular data. Our data suggest that landraces, older varieties, and obsolete cultivars should be included to broaden the genetic diversity for biomass allocation and yield-related traits.

Supplementary Materials

The following supporting information can be downloaded at: https://0-www-mdpi-com.brum.beds.ac.uk/article/10.3390/agronomy12061457/s1, Table S1: Names of genotypes and their respective pedigrees used in this study.

Author Contributions

Conceptualisation, K.W.S. and I.M.; methodology, K.W.S. and I.M.; formal analysis, K.W.S., A.S. and I.M.; writing—original draft preparation, K.W.S.; writing—review and editing, H.S., I.M., R.Z. and V.C.; supervision, H.S., R.Z. and V.C.; project administration, H.S., R.Z. and V.C.; funding acquisition, H.S., R.Z. and V.C. All authors have read and agreed to the published version of the manuscript.

Funding

This research was funded by the Water Research Commission of South Africa (WRC) and the National Research Foundation of South Africa (NRF).

Data Availability Statement

The data and materials presented in this study are mentioned in the main text as well as in the Supplementary Files. Further data will be provided on request from the corresponding author.

Acknowledgments

The authors acknowledge the African Centre for Crop Improvement (ACCI) for technical assistance and for overall research support.

Conflicts of Interest

The authors declare no conflict of interest.

References

  1. FAOSTAT Wheat Production Statistics. Available online: http://www.fao.org/faostat/en/#data/QC (accessed on 4 March 2021).
  2. Tadesse, W.; Bishaw, Z.; Assefa, S. Wheat production and breeding in Sub-Saharan Africa: Challenges and opportunities in the face of climate change. Int. J. Clim. Chang. Strateg. Manag. 2019, 11, 696–715. [Google Scholar] [CrossRef] [Green Version]
  3. Yahaya, M.A.; Shimelis, H. Drought stress in sorghum: Mitigation strategies, breeding methods and technologies—A review. J. Agron. Crop. Sci. 2022, 208, 127–142. [Google Scholar] [CrossRef]
  4. Zougmoré, R.B.; Partey, S.T.; Ouédraogo, M.; Torquebiau, E.; Campbell, B.M. Facing climate variability in sub-Saharan Africa: Analysis of climate-smart agriculture opportunities to manage climate-related risks. Cah. Agric. 2018, 27, 1–9. [Google Scholar] [CrossRef] [Green Version]
  5. Pironon, S.; Etherington, T.R.; Borrell, J.S.; Kühn, N.; Macias-Fauria, M.; Ondo, I.; Tovar, C.; Wilkin, P.; Willis, K.J. Potential adaptive strategies for 29 sub-Saharan crops under future climate change. Nat. Clim. 2019, 9, 758–763. [Google Scholar] [CrossRef]
  6. Voss-Fels, K.P.; Snowdon, R.J.; Hickey, L.T. Designer roots for future crops. Trends Plant. Sci. 2018, 23, 957–960. [Google Scholar] [CrossRef]
  7. Wasson, A.P.; Richards, R.; Chatrath, R.; Misra, S.; Prasad, S.S.; Rebetzke, G.; Kirkegaard, J.; Christopher, J.; Watt, M. Traits and selection strategies to improve root systems and water uptake in water-limited wheat crops. J. Exp. Bot. 2012, 63, 3485–3498. [Google Scholar] [CrossRef] [PubMed] [Green Version]
  8. OlaOlorun, B.M.; Shimelis, H.A.; Mathew, I. Variability and selection among mutant families of wheat for biomass allocation, yield and yield-related traits under drought-stressed and non-stressed conditions. J. Agron. Crop. Sci. 2020, 207, 404–421. [Google Scholar] [CrossRef]
  9. Voss-Fels, K.P.; Stahl, A.; Wittkop, B.; Lichthardt, C.; Nagler, S.; Rose, T.; Chen, T.W.; Zetzsche, H.; Seddig, S.; Baig, M.M. Breeding improves wheat productivity under contrasting agrochemical input levels. Nat. Plants 2019, 5, 706–714. [Google Scholar] [CrossRef]
  10. Gram, G.; Roobroeck, D.; Pypers, P.; Six, J.; Merckx, R.; Vanlauwe, B. Combining organic and mineral fertilizers as a climate-smart integrated soil fertility management practice in sub-Saharan Africa: A meta-analysis. PLoS ONE 2020, 15, e0239552. [Google Scholar] [CrossRef]
  11. Junaidi, J.; Kallenbach, C.M.; Byrne, P.F.; Fonte, S.J. Root traits and root biomass allocation impact how wheat genotypes respond to organic amendments and earthworms. PLoS ONE 2018, 13, e0200646. [Google Scholar] [CrossRef]
  12. Nguyen, V.L.; Stangoulis, J. Variation in root system architecture and morphology of two wheat genotypes is a predictor of their tolerance to phosphorus deficiency. Acta Physiol. Plant 2019, 41, 1–13. [Google Scholar] [CrossRef] [Green Version]
  13. Guo, X.; Svane, S.F.; Füchtbauer, W.S.; Andersen, J.R.; Jensen, J.; Thorup-Kristensen, K. Genomic prediction of yield and root development in wheat under changing water availability. Plant Methods 2020, 16, 1–15. [Google Scholar] [CrossRef] [PubMed]
  14. Maeoka, R.E.; Sadras, V.O.; Ciampitti, I.A.; Diaz, D.R.; Fritz, A.K.; Lollato, R.P. Changes in the phenotype of winter wheat varieties released between 1920 and 2016 in response to in-furrow fertilizer: Biomass allocation, yield, and grain protein concentration. Front. Plant. Sci. 2020, 10, 1786. [Google Scholar] [CrossRef] [Green Version]
  15. Rufo, R.; Salvi, S.; Royo, C.; Soriano, J.M. Exploring the genetic architecture of root-related traits in Mediterranean bread wheat landraces by genome-wide association analysis. Agronomy 2020, 10, 613. [Google Scholar] [CrossRef]
  16. Paez-Garcia, A.; Motes, C.M.; Scheible, W.R.; Chen, R.; Blancaflor, E.B.; Monteros, M.J. Root traits and phenotyping strategies for plant improvement. Plants 2015, 4, 334–355. [Google Scholar] [CrossRef] [PubMed]
  17. Shamuyarira, K.W.; Shimelis, H.; Mathew, I.; Zengeni, R.; Chaplot, V. A meta-analysis of combining ability effects in wheat for agronomic traits and drought adaptation: Implications for optimizing biomass allocation. Crop Sci. 2022, 62, 139–156. [Google Scholar] [CrossRef]
  18. Manschadi, A.M.; Christopher, J.; deVoil, P.; Hammer, G.L. The role of root architectural traits in adaptation of wheat to water-limited environments. Funct. Plant Biol. 2006, 33, 823–837. [Google Scholar] [CrossRef] [Green Version]
  19. Hammer, G.L.; Dong, Z.; McLean, G.; Doherty, A.; Messina, C.; Schussler, J.; Zinselmeier, C.; Paszkiewicz, S.; Cooper, M. Can changes in canopy and/or root system architecture explain historical maize yield trends in the US corn belt? Crop Sci. 2009, 49, 299–312. [Google Scholar] [CrossRef]
  20. Chen, Y.L.; Djalovic, I.; Rengel, Z. Phenotyping for Root Traits. In Phenomics in Crop Plants: Trends, Options and Limitations; Kumar, J., Pratap, A., Eds.; Springer: New Delhi, India, 2015; pp. 101–128. [Google Scholar] [CrossRef]
  21. Suneja, Y.; Gupta, A.K.; Bains, N.S. Stress adaptive plasticity: Aegilops tauschii and Triticum dicoccoides as potential donors of drought associated morpho-physiological traits in wheat. Front. Plant Sci. 2019, 10, 211. [Google Scholar] [CrossRef] [Green Version]
  22. Schultz, J.C.; Appel, H.M.; Ferrieri, A.; Arnold, T.M. Flexible resource allocation during plant defense responses. Front. Plant Sci. 2013, 4, 324. [Google Scholar] [CrossRef] [Green Version]
  23. Pieruschka, R.; Schurr, U. Plant phenotyping: Past, present, and future. Plant. Phenomics 2019, 2019, 7507131. [Google Scholar] [CrossRef] [PubMed]
  24. Joshi, D.C.; Singh, V.; Hunt, C.; Mace, E.; van Oosterom, E.; Sulman, R.; Jordan, D.; Hammer, G. Development of a phenotyping platform for high throughput screening of nodal root angle in sorghum. Plant Methods 2017, 13, 1–12. [Google Scholar] [CrossRef] [PubMed] [Green Version]
  25. Morgante, M.; Salamini, F. From plant genomics to breeding practice. Curr. Opin. Biotechnol. 2003, 14, 214–219. [Google Scholar] [CrossRef]
  26. Boukar, O.; Belko, N.; Chamarthi, S.; Togola, A.; Batieno, J.; Owusu, E.; Haruna, M.; Diallo, S.; Umar, M.L.; Olufajo, O. Cowpea (Vigna unguiculata): Genetics, genomics and breeding. Plant Breed 2019, 138, 415–424. [Google Scholar] [CrossRef] [Green Version]
  27. Bohra, A.; Saxena, K.; Varshney, R.K.; Saxena, R.K. Genomics-assisted breeding for pigeon pea improvement. Theor. Appl. Genet. 2020, 133, 1721–1737. [Google Scholar] [CrossRef]
  28. Chen, X.; Min, D.; Yasir, T.A.; Hu, Y.G. Genetic diversity, population structure and linkage disequilibrium in elite Chinese winter wheat investigated with SSR markers. PLoS ONE 2012, 7, e44510. [Google Scholar] [CrossRef] [Green Version]
  29. Rufo, R.; Alvaro, F.; Royo, C.; Soriano, J.M. From landraces to improved cultivars: Assessment of genetic diversity and population structure of Mediterranean wheat using SNP markers. PLoS ONE 2019, 14, e0219867. [Google Scholar] [CrossRef] [Green Version]
  30. Nazarzadeh, Z.; Onsori, H.; Akrami, S. Genetic diversity of bread wheat (Triticum aestivum L.) genotypes using RAPD and ISSR molecular markers. J. Genet. Res. 2020, 6, 69–76. [Google Scholar] [CrossRef]
  31. Mammadov, J.; Aggarwal, R.; Buyyarapu, R.; Kumpatla, S. SNP markers and their impact on plant breeding. Int. J. Plant Genom. 2012, 2012, 728398. [Google Scholar] [CrossRef]
  32. Chung, Y.S.; Choi, S.C.; Jun, T.H.; Kim, C. Genotyping-by-sequencing: A promising tool for plant genetics research and breeding. Hortic. Environ. Biotechnol. 2017, 58, 425–431. [Google Scholar] [CrossRef]
  33. Thomson, M.J. High-throughput SNP genotyping to accelerate crop improvement. Plant Breed. Biotechnol. 2014, 2, 195–212. [Google Scholar] [CrossRef]
  34. Agre, P.; Asibe, F.; Darkwa, K.; Edemodu, A.; Bauchet, G.; Asiedu, R.; Adebola, P.; Asfaw, A. Phenotypic and molecular assessment of genetic structure and diversity in a panel of winged yam (Dioscorea alata) clones and cultivars. Sci. Rep. 2019, 9, 18221. [Google Scholar] [CrossRef] [PubMed] [Green Version]
  35. Department of Agriculture, Forestry and Fisheries (DAFF) 2010. Available online: https://www.dalrrd.gov.za/Portals/0/Brochures%20and%20Production%20guidelines/Wheat%20-%20Production%20Guideline.pdf (accessed on 20 January 2021).
  36. Payne, R.; Murray, D.; Harding, S. An Introduction to the GenStat Command Language; VSN International: Hempstead, UK, 2017. [Google Scholar]
  37. IBM SPSS Statistics. 25 Software, IBM Corp, Version 25.0; IBM SPSS Statistics for Windows: Armonk, NY, USA, 2017. [Google Scholar]
  38. Pinheiro, J.; Bates, D.; DebRoy, S.; Sarkar, D. 2013 Nlme: Linear and Nonlinear Mixed Effects Models. R Package Version 3.1-137. Available online: https://cran.r-project.org/web/packages/nlme/nlme.pdf (accessed on 12 November 2021).
  39. Gower, J.C. A general coefficient of similarity and some of its properties. Biometrics 1971, 27, 857–871. [Google Scholar] [CrossRef]
  40. Maechler, M.; Rousseeuw, P.; Struyf, A.; Hubert, M.; Hornik, K.; Studer, M. 2013 Package ‘Cluster’. Available online: https://cran.microsoft.com/snapshot/2014-10-10/web/packages/cluster/cluster.pdf (accessed on 12 November 2021).
  41. Huang, J.; Ge, X.; Sun, M. Modified CTAB protocol using a silica matrix for isolation of plant genomic DNA. Biotechniques 2000, 28, 432–434. [Google Scholar] [CrossRef] [PubMed]
  42. Liu, K.; Muse, S.V. PowerMarker: An integrated analysis environment for genetic marker analysis. Bioinformatics 2005, 21, 2128–2129. [Google Scholar] [CrossRef] [PubMed] [Green Version]
  43. Jaccard, P. 1908 Nouvelles recherches sur la distribution florale. Bull. Soc. Vaud. Sci. Nat. 1908, 44, 223–270. [Google Scholar]
  44. Garnier, S.; Ross, N.; Rudis, B.; Sciaini, M.; Scherer, C. 2018 Viridis: Default Color Maps from ‘Matplotlib’. R Package Version 0.5. 1. CRAN: The Comprehensive R Archive Network. Available online: https://cran.r-project.org/web/packages/viridis/viridis.pdf (accessed on 12 November 2021).
  45. Nehe, A.; Akin, B.; Sanal, T.; Evlice, A.K.; Ünsal, R.; Dinçer, N.; Demir, L.; Geren, H.; Sevim, I.; Orhan, Ş. Genotype x environment interaction and genetic gain for grain yield and grain quality traits in Turkish spring wheat released between 1964 and 2010. PLoS ONE 2019, 14, e0219432. [Google Scholar] [CrossRef] [Green Version]
  46. Hendriks, P.W.; Kirkegaard, J.; Lilley, J.M.; Gregory, P.; Rebetzke, G. A tillering inhibition gene influences root–shoot carbon partitioning and pattern of water use to improve wheat productivity in rainfed environments. J. Exp. Bot. 2016, 67, 327–340. [Google Scholar] [CrossRef]
  47. Bai, C.; Liang, Y.; Hawkesford, M.J. Identification of QTLs associated with seedling root traits and their correlation with plant height in wheat. J. Exp. Bot. 2013, 64, 1745–1753. [Google Scholar] [CrossRef] [Green Version]
  48. He, C.; Zhang, W.; Gao, Q.; Yang, A.; Hu, X.; Zhang, J. Enhancement of drought resistance and biomass by increasing the amount of glycine betaine in wheat seedlings. Euphytica 2011, 177, 151–167. [Google Scholar] [CrossRef]
  49. Schneider, H.M.; Lynch, J.P. Should root plasticity be a crop breeding target? Front. Plant Sci. 2020, 11, 546. [Google Scholar] [CrossRef]
  50. Waines, J.G.; Ehdaie, B. Domestication and crop physiology: Roots of green-revolution wheat. Ann. Bot. 2007, 100, 991–998. [Google Scholar] [CrossRef] [PubMed] [Green Version]
  51. Passioura, J. Roots and Drought Resistance. In Developments in Agricultural and Managed Forest Ecology; Elsevier: Amsterdam, The Netherlands, 1983; pp. 265–280. [Google Scholar]
  52. Palta, J.A.; Chen, X.; Milroy, S.P.; Rebetzke, G.J.; Dreccer, M.F.; Watt, M. Large root systems: Are they useful in adapting wheat to dry environments? Funct. Plant Biol. 2011, 38, 347–354. [Google Scholar] [CrossRef] [PubMed] [Green Version]
  53. Gao, H.; Wang, Y.; Xu, P.; Zhang, Z. Overexpression of a WRKY transcription factor TaWRKY2 enhances drought stress tolerance in transgenic wheat. Front. Plant Sci. 2018, 9, 997. [Google Scholar] [CrossRef] [PubMed] [Green Version]
  54. Sinclair, T.R. Challenges in breeding for yield increase for drought. Trends Plant Sci. 2011, 16, 289–293. [Google Scholar] [CrossRef]
  55. Hirte, J.; Leifeld, J.; Abiven, S.; Oberholzer, H.R.; Mayer, J. Below ground carbon inputs to soil via root biomass and rhizodeposition of field-grown maize and wheat at harvest are independent of net primary productivity. Agric. Ecosyst. Environ. 2018, 265, 556–566. [Google Scholar] [CrossRef]
  56. Du, Y.; Chen, L.; Wang, Y.; Yang, Z.; Saeed, I.; Daoura, B.G.; Hu, Y.G. The combination of dwarfing genes Rht4 and Rht8 reduced plant height, improved yield traits of rainfed bread wheat (Triticum aestivum L.). Field Crops Res. 2018, 215, 149–155. [Google Scholar] [CrossRef]
  57. Shamuyarira, K.W.; Shimelis, H.A.; Mathew, I.; Tsilo, T.J. Correlation and path coefficient analyses of yield and yield components in drought-tolerant bread wheat populations. S Afr. J. Plant Soil 2019, 36, 367–374. [Google Scholar] [CrossRef]
  58. Figueroa-Bustos, V.; Palta, J.A.; Chen, Y.; Siddique, K.H. Early season drought largely reduces grain yield in wheat cultivars with smaller root systems. Plants 2019, 8, 305. [Google Scholar] [CrossRef] [Green Version]
  59. Aslam, M.A.; Ahmed, M.; Stöckle, C.O.; Higgins, S.S.; Hayat, R. Can growing degree days and photoperiod predict spring wheat phenology? Front Environ. Sci. 2017, 5, 57. [Google Scholar] [CrossRef]
  60. Mathew, I.; Shimelis, H.; Mutema, M.; Clulow, A.; Zengeni, R.; Mbava, N.; Chaplot, V. Selection of wheat genotypes for biomass allocation to improve drought tolerance and carbon sequestration into soils. J. Agron. Crop. Sci. 2019, 205, 385–400. [Google Scholar] [CrossRef]
  61. Hu, T.; Sørensen, P.; Wahlström, E.M.; Chirinda, N.; Sharif, B.; Li, X.; Olesen, J.E. Root biomass in cereals, catch crops and weeds can be reliably estimated without considering aboveground biomass. Agric. Ecosyst. Environ. 2018, 251, 141–148. [Google Scholar] [CrossRef]
  62. van Ginkel, M.; Ogbonnaya, F. Novel genetic diversity from synthetic wheats in breeding cultivars for changing production conditions. Field Crops Res. 2007, 104, 86–94. [Google Scholar] [CrossRef]
  63. Fu, Y.B. Understanding crop genetic diversity under modern plant breeding. Appl. Genet. 2015, 128, 2131–2142. [Google Scholar] [CrossRef] [PubMed] [Green Version]
  64. Girma, E. Genetic erosion of wheat (Triticum spp.): Concept, research results and challenges. J. Nat. Sci. Res. 2017, 7, 72–81. [Google Scholar]
  65. Naderi, S.; Fakheri, B.A.; Maali-Amiri, R.; Mahdinezhad, N. Tolerance responses in wheat landrace Bolani are related to enhanced metabolic adjustments under drought stress. Plant Physiol. Biochem. 2020, 150, 244–253. [Google Scholar] [CrossRef]
  66. Bhatta, M.; Morgounov, A.; Belamkar, V.; Poland, J.; Baenziger, P.S. Unlocking the novel genetic diversity and population structure of synthetic hexaploid wheat. BMC Genom. 2018, 19, 591. [Google Scholar] [CrossRef] [Green Version]
  67. Havaux, M.; Ernez, M.; Lannoye, R. Correlation between heat tolerance and drought tolerance in cereals demonstrated by rapid chlorophyll fluorescence tests. J. Plant Physiol. 1988, 133, 555–560. [Google Scholar] [CrossRef]
  68. Rampino, P.; Mita, G.; Fasano, P.; Borrelli, G.M.; Aprile, A.; Dalessandro, G.; De Bellis, L.; Perrotta, C. Novel durum wheat genes up-regulated in response to a combination of heat and drought stress. Plant Physiol. Biochem. 2012, 56, 72–78. [Google Scholar] [CrossRef]
  69. Acuña-Galindo, M.A.; Mason, R.E.; Subramanian, N.K.; Hays, D.B. Meta-analysis of wheat QTL regions associated with adaptation to drought and heat stress. Crop. Sci. 2015, 55, 477–492. [Google Scholar] [CrossRef]
  70. Tricker, P.J.; ElHabti, A.; Schmidt, J.; Fleury, D. The physiological and genetic basis of combined drought and heat tolerance in wheat. J. Exp. Bot. 2018, 69, 3195–3210. [Google Scholar] [CrossRef] [PubMed] [Green Version]
  71. Ennos, R.A. Maintenance of Genetic Variation in Plant Populations. In Evolutionary Biology; Hecht, M.K., Wallace, B., Prance, G.T., Eds.; Springer: Boston, MA, USA, 1983; Volume 16, pp. 129–155. [Google Scholar]
  72. Dreisigacker, S.; Zhang, P.; Warburton, M.; Skovmand, B.; Hoisington, D.; Melchinger, A. Genetic diversity among and within CIMMYT wheat landrace accessions investigated with SSRs and implications for plant genetic resources management. Crop Sci. 2005, 45, 653–661. [Google Scholar] [CrossRef] [Green Version]
  73. Royo, C.; Maccaferri, M.; Álvaro, F.; Moragues, M.; Sanguineti, M.C.; Tuberosa, R.; Maalouf, F.; del Moral, L.F.G.; Demontis, A.; Rhouma, S. Understanding the relationships between genetic and phenotypic structures of a collection of elite durum wheat accessions. Field Crops Res. 2010, 119, 91–105. [Google Scholar] [CrossRef]
  74. Haghighattalab, A.; Pérez, L.G.; Mondal, S.; Singh, D.; Schinstock, D.; Rutkoski, J.; Ortiz-Monasterio, I.; Singh, R.P.; Goodin, D.; Poland, J. Application of unmanned aerial systems for high throughput phenotyping of large wheat breeding nurseries. Plant Methods 2016, 12, 35. [Google Scholar] [CrossRef] [Green Version]
  75. Saint Pierre, C.; Crossa, J.L.; Bonnett, D.; Yamaguchi-Shinozaki, K.; Reynolds, M.P. Phenotyping transgenic wheat for drought resistance. J. Exp. Bot. 2012, 63, 1799–1808. [Google Scholar] [CrossRef] [Green Version]
  76. Ahmed, K.; Shabbir, G.; Ahmed, M.; Shah, K.N. Phenotyping for drought resistance in bread wheat using physiological and biochemical traits. Sci. Total Environ. 2020, 729, 139082. [Google Scholar] [CrossRef]
Figure 1. Hierarchical clustering of 97 wheat genotypes based on phenotypic traits measured under non-stressed conditions. Clusters are separated by color lines.
Agronomy 12 01457 g001
Figure 2. Hierarchical clustering of 97 wheat genotypes based on phenotypic traits measured under drought-stressed conditions. Clusters are separated by color lines.
Agronomy 12 01457 g002
Figure 3. Hierarchical clustering of 97 wheat genotypes based on 16,382 SNP markers. Clusters are separated by color lines.
Agronomy 12 01457 g003
Figure 4. Tanglegram comparison of genotypic and phenotypic hierarchical clusters of 97 wheat genotypes based on 16,382 SNP markers and phenotypic data measured under non-stressed conditions.
Agronomy 12 01457 g004
Figure 5. Tanglegram comparison of genotypic and phenotypic hierarchical clusters of 97 wheat genotypes based on 16,382 SNP markers and phenotypic data measured under drought-stressed conditions.
Agronomy 12 01457 g005
Figure 6. Joint hierarchical clustering of 97 wheat genotypes based on phenotypic data and 16,382 SNP markers. Clusters are separated by color lines.
Agronomy 12 01457 g006
Table 1. Population groups based on observed drought tolerance levels of individual genotypes based on grain yield under drought stress.
Tolerance LevelEntry
TolerantBW100BW111BW116BW120BW147BW149BW151
BW152BW48BW63LM100LM16LM17LM26
LM29LM37LM51LM71LM76LM90
Intermediate tolerantBW103BW124BW127BW129BW141BW148BW157
BW159BW162BW49BW58BW71BW80LM01
LM12LM14LM18LM19LM21LM22LM25
LM27LM30LM31LM32LM36LM39LM40
LM41LM42LM44LM46LM47LM49LM56
LM58LM60LM70LM72LM79LM83LM85
LM91LM93LM97LM99
SusceptibleBW128BW140BW142BW145BW150BW28LM15
LM20LM23LM24LM28LM33LM35LM38
LM43LM48LM50LM52LM54LM55LM57
LM59LM75LM77LM80LM81LM82LM84
LM86LM96LM98
Table 2. Mean square values and significant tests after combined analysis of variance of biomass and yield-related traits of 97 wheat genotypes evaluated under non-stressed and drought-stressed conditions.
SOVdfDTHDTMPHTNPBSBRBRSGY
Block1996.00 ***225.91 ***999.83 ***18.00 ***7,029,511.00 ***2,506,321.00 ***66,525.00 ***0.03 *876,453.00 ***
Rep1261.72 ***552.71 ***7673.14 ***68.44 ***31,575,567.00 ***15,118,430.00 ***157,718.00 ***0.012,285,866.00 ***
Genotype (Gen)96197.51 ***124.22 ***167.49 ***16.05 ***711,194.00 *270,175.00 ***15,507.00 ***0.03 *146,304.00 *
Water Regime (WR)153.628,022.20 ***31,765.90 ***3358.07 ***110,774,907.00 ***22,763,489.00 ***1,883,093.00 ***1.11 ***18,109,833.00 ***
Site274,612.12 ***125,380.64 ***134,122.84 ***2746.88 ***1,594,700,477.00 ***617,123,646.00 ***11,896,156.00 ***35.55 ***192,151,512.00 ***
Gen*WR9622.31 *39.93 ***30.775.07437,549144,93811,9950.0282,041
Gen*Site19285.02 ***61.80 ***65.12 ***9.69 ***657,583.00 *267,142.00 ***15,107.00 ***0.02 **123,754
Gen*WR*Site19219.7235.19 ***35.917.42 **495,229156,34211,8180.03 *92,026
Residual56117.2123.4730.185.43532,134160,22610,4450.02106,404
* Significant at p < 0.05, ** p < 0.01, *** p < 0.001, SOV = source of variation, df = degrees of freedom, DTH = days to 50% heading, DTM = days to 50% maturity, PH = plant height (cm), TN = tiller number, PB = total plant biomass (gm−2), SB = shoot biomass (gm−2), RB = root biomass (gm−2), RS = root-to-shoot ratio, GY = grain yield (gm−2), Rep = replication.
Table 3. Mean values of the 10 best genotypes and five bottom genotypes based on grain yield (GY) under drought-stress for nine agronomic traits of 97 bread wheat lines under drought-stressed (DS) and non-stressed (NS) conditions.
ENTRYDTHDTMPHTNPBSBRBRSGY
DSNSDSNSDSNSDSNSDSNSDSNSDSNSDSNSDSNS
Top ten genotypes
LM5256.5164.52103.8118.160.675.949.8315.84213730899941487214.2352.40.430.53929.41249.9
LM3066.1266.73109.3116.367.1282.3911.1112.132513260012601370325.9295.40.50.49927.7934.4
BW15765.1365.85104.4114.865.4275.117.9410.842091214510601042249.4298.10.420.53782802.6
BW15264.3965.53108.6116.865.0975.7310.3611.5167224179451266218.3453.10.490.6509.1699.5
BW14068.1657.36108.5115.669.7266.367.5915.85155919788501168228.43100.460.49481.7497.3
LM4769.0567.27112121.165.3578.579.112.25146029018981661171.2311.70.390.61469926.7
LM7068.2568.83109.211968.1174.798.6113.8414781990839990190.9274.90.480.57449.1722.1
LM4871.9965.67112.3118.563.7483.699.0110160623359211181238.4276.80.40.55447.4876.7
BW16263.8563.65108.8114.866.6978.798.7912.35135826397881288160.72800.450.62414.71068.4
LM5461.569.71105.8119.760.6278.491111.67115729526531739136.2424.50.440.57368789.4
Bottom five genotypes
LM3969.1668.61109118.566.3979.897.6813.03129021957991147208.9305.30.420.52281.5741.3
LM4470.2266.17102.611366.6183.289.212.84118621747161286189.6213.80.490.39281.5674.1
BW14773.4567.16111117.465.0776.277.349.7144121679401140218.53460.430.52278.9680.7
LM5565.4363.15108.1113.760.2976.94914.45112720347781133131.9210.50.320.39216.3679.8
LM2964.8366.39112.8122.962.2280.868.513.08106226627101694186.5272.20.40.48198870.2
Mean65.6465.9107.4117.765.3278.679.2212.7514902298853.51252206.2295.10.430.49444.3757.1
SEM0.850.410.470.30.490.440.10.1623.8637.7513.2624.684.876.050.010.0112.1915.48
CV (%)12.726.164.332.497.355.5210.8112.6315.7716.1815.3119.4223.2620.1913.9913.0426.8820.14
Range28.1921.4526.116.742.7319.845.227.74145122577671498400268.50.340.3731.4825.6
LSD (5%)4.35.296.614.176.684.870.353.16532.71053274.8591.374.81148.60.130.16274.2449.2
R2 (%)80.8672.2577.0682.4576.4874.2444.8133.0479.776.7978.7873.4114.9920.7119.4342.6862.2668.91
DTH = days to 50% heading, DTM = days to 50% maturity, PH = plant height (cm), TN = tiller number, PB = total plant biomass (gm−2), SB = shoot biomass (gm−2), RB = root biomass (gm−2), RS = root-to-shoot ratio, GY = grain yield (gm−2), DS = drought stressed, NS = non-stressed, SEM = standard error of mean, CV = coefficient of variation, LSD = least significant difference, R2 = coefficient of determination.
Table 4. Principal component scores and variance of traits measured on 97 wheat genotypes assessed under drought-stress and non-stress conditions.
TraitsDrought-StressedNon-Stressed
PC1PC2PC3PC1PC2PC3
DTH0.350.830.050.140.880.10
DTM0.400.74−0.080.190.740.01
PH0.130.13−0.460.140.390.71
TN−0.12−0.56−0.15−0.05−0.530.10
PB0.94−0.29−0.150.97−0.170.12
SB0.87−0.03−0.270.86−0.070.22
RB0.730.080.500.700.10−0.44
RS0.18−0.190.870.220.29−0.74
GY0.74−0.53−0.120.75−0.330.08
Eigenvalue3.051.971.362.861.981.33
Explained variance (%)33.9221.8715.0831.8021.9914.81
Cumulative variance (%)33.9255.7970.8631.8053.7968.60
PC = principal component, DTH = days to 50% heading, DTM = days to 50% maturity, PH = plant height (cm), TN = tiller number, PB = total plant biomass (gm−2), SB = shoot biomass (gm−2), RB = root biomass (gm−2), RS = root-to-shoot ratio and GY = grain yield (gm−2).
Table 5. Genetic parameters of 97 wheat genotypes genotyped with 16,382 SNP markers.
PopulationGDPICMAFHoF
Drought tolerant0.630.750.380.43−0.38
Intermediate tolerance0.640.80.440.39−0.33
Susceptible0.630.810.470.38−0.32
Range0.20–0.880.24–1.000.05–0.500.29–0.580–−0.60
GD = genetic distance, PIC = polymorphic information content, MAF = minor allele frequency, Ho = observed heterozygosity, F = inbreeding coefficient.
Table 6. Analysis of molecular variance among 97 wheat genotypes genotyped with 16,382 SNP markers.
SourcedfSSMSEstimated VarianceProportion of Variance
Among Pops27713.6723856.83621.9351%
Within Pops94299,495.73186.1243186.12499%
Total96307,209.3 3208.059100%
df = degrees of freedom, SS = sum of squares, MS = mean squares, Pops: populations.
Publisher’s Note: MDPI stays neutral with regard to jurisdictional claims in published maps and institutional affiliations.

