Article

Drench Application of Soy Protein Hydrolysates Increases Tomato Plant Fitness, Fruit Yield, and Resistance to a Hemibiotrophic Pathogen

Département de Phytologie, Université Laval, Quebec, QC G1V 0A6, Canada
*
Author to whom correspondence should be addressed.
Submission received: 16 June 2022 / Revised: 15 July 2022 / Accepted: 22 July 2022 / Published: 27 July 2022
(This article belongs to the Special Issue Agroecology and Organic Horticulture)

Abstract

:
At a time when growers have to increase food production, while facing many environmental challenges, biostimulants and plant defence stimulators (PDS) may help reduce the use of chemical fertilizers and pesticides and to promote agriculture that is more respectful of the environment. For organic farming, they may contribute to increasing plant resilience and crop productivity. Several studies have shown that plant-derived protein hydrolysates may increase nutrient use efficiency and promote plant resistance to abiotic or biotic stresses. We therefore hypothesized that soy protein hydrolysates increase tomato growth and productivity, while promoting plant disease resistance. Our results showed that one or two drench applications of soy protein hydrolysates (SPH13 and SPH18 at 10 g L−1) to the growing medium increased tomato (‘Micro Tom’) plant growth and fruit production, while one studied hydrolysate enriched in glycine (SPH18) increased the expression levels of PR1 and PR8, two defence-related genes. Although no significant effect was observed on Botrytis cinerea resistance of Micro Tom plants, SPHs significantly increased ‘M82’ plant resistance to foliar inoculation with Pseudomonas syringae pv. tomato DC3000, which further confirmed the systemic activation of plant defence mechanisms by SPHs in tomatoes.

1. Introduction

Throughout human history, increasing food productivity has been a driving force behind the ever-growing world population. According to the most recent projections, the human population will surpass 9.7 billion by the year 2050, while the food demand will increase by half [1,2]. The resulting rise in human activity will be followed by increasing soil, water and air pollution, the latter being the main cause behind the accelerating climate change and its many negative effects on agriculture. Given the urgency of the situation, drastic changes must be made to our food production systems to meet the future demands, while reducing their environmental footprints. Agriculture, especially since the green revolution of the 20th century, has been widely based on the use of synthetic fertilizers and chemical pesticides, which not only cause greenhouse emissions during their production but are also responsible for soil degradation, and soil and water pollution [3]. For instance, the Haber-Bosch process, which was invented in the 1900s, allowed for the reduction of atmospheric nitrogen gas (N2) into more reactive forms, which was the base for a stable supply of nitrogen-rich chemical fertilizers [4]. This has been a major breakthrough for agriculture, since nitrogen (N) is an essential nutrient for crop productivity that, if not applied in sufficient quantity, causes low crop yields [5]. However, applying large amounts of N fertilizer leads to ground water contamination, eutrophication of freshwater ecosystems and the release of atmospheric pollutants such as nitrous oxide or ammonia gas [6]. Therefore, optimizing N management is an essential step in creating a more sustainable agriculture [7]. This means that fertilizer supply has to be adapted to plant’s needs in terms of N and other nutrients in order to avoid pollution. To this end, the use of organic fertilizers can be an interesting alternative to chemical fertilizers, since they slowly release mineral N into the growing media as they are degraded by the soil microbiome [8,9]. Increasing the nitrogen use efficiency is, however, particularly important in intensive production systems, as is the case for greenhouse vegetable production. Indeed, the high N demand of fruit vegetable crops combined with the high crop density used in greenhouses requires large amounts of fertilizers, which often limit crop productivity [10].
The need to promote a more efficient and effective use of fertilizers, as well as increasing frequency of adverse environmental conditions for crop growth, have driven the development of biostimulants. These are substances or microorganisms whose function is to stimulate nutrient uptake, nutrient use efficiency, tolerance to abiotic stresses and crop quality [11,12,13]. Many reviews have tried to give a clear and comprehensive definition for the word biostimulant. This task has been made difficult by the fact that this concept encompasses a large variety of products, mode of actions and effects, but there seems to be a consensus on the idea that biostimulants improve plant productivity and tolerance to abiotic stresses [11,12,13]. They are thus distinguished from plant defence stimulators (PDS), which increase plant resistance to biotic stresses. However, it is important to note that some substances and microorganisms have the ability to protect plants against both biotic and abiotic stresses, meaning that they can act as both biostimulant and PDS [14]. This is, for instance, the case for some beneficial fungi and bacteria [15,16].
Several studies have shown that protein hydrolysates (PHs), a category of biostimulants composed of mixtures of free amino acids, oligo- and polypeptides obtained from hydrolysed animal or plant residues, promote growth and productivity, as well as abiotic stress tolerance, through different mechanisms, such as promoting key enzymes involved in N assimilation [17,18,19], stimulating hormone biosynthesis [20] and increasing antioxidant activity, as well as the production of pigments and secondary metabolites [21]. Moreover, effects of PHs on crop performance and nutritional status have been reported for foliar spray applications and, to a lesser extent, for soil drench applications. For instance, Solanum lycopersicum and Zea mays plants treated with PHs showed an increased nutrient absorption due to an increased root growth and root hair diameter [17,22]. PHs are also known to affect the phyllosphere and rhizosphere microbiomes, which can alter the developmental and physiological processes, enhancing water absorption, nutrient uptake and resilience against major environmental changes [19].
Interestingly, a previous study reported that PHs increased grapevine resistance to the biotrophic phytopathogenic oomycete responsible for grapevine downy mildew. Indeed, the authors showed that foliar application of soybean (Glycine max) hydrolysates and casein stimulated plant defence mechanisms, phytoalexin production and, consequently, reduced Plasmopara viticola sporulation in leaves [23]. To date, this has been the only report clearly showing the efficiency of PHs as PDS against a plant pathogen. This feature is all the more interesting as it offers a sustainable and organic alternative to chemical pesticides for crop protection against diseases. The latter is a continuing challenge, particularly in intensive farming systems where high crop densities generate microclimates that are conducive to disease spreading.
The aim of this study was to determine the short- and long-term effects of substrate drench applications with soy protein hydrolysates (SPHs) on tomato plant growth, fruit productivity and disease resistance. We first asked whether one or two treatments with concentrated SPHs could increase growth and fruit production of tomato plants. We also hypothesized that SPH treatment allows for a systemic induction of plant defence gene expression and an increased resistance to plant pathogens such as Botrytis cinerea or Pseudomonas syringae. This is therefore the first report showing the impact of PHs applied through substrate drench on fruit productivity, defence gene expression and pathogen resistance of tomato plants.

2. Materials and Methods

2.1. Plant Materials and Greenhouse Growth Conditions

Tomato cultivars Micro Tom and M82 were used for our experiments. Experiments were carried out in a greenhouse located at Université Laval (Quebec, QC, Canada; Lat. 46°78′ N; long. 71°28′ W). The day and night temperatures were maintained at 23.4 ± 1.2 °C and 19.7 ± 1.1 °C, respectively, with a relative humidity of 44.2 ± 3.9% and 54.8 ± 2.7%. Supplemental lighting was provided to the plants at a photosynthetic photon flux density (PPFD) of 180 μmol m−2 s−1 provided by 600 W HPS lamps (P.L. Light Systems, Beamsville, ON, Canada; Gavita international b.v., Rozenburg, the Netherlands) during 16 h. Micro Tom plants were grown for 16 weeks in standard 15.5-cm round pots containing an organic growing medium made of 75–85% peat moss complemented with perlite and vermiculite (PRO-MIX BX, Premier Tech, Rivière-du-Loup, QC, Canada), whereas M82 plants were grown in 48-cell plastic plug trays (cell dimensions: 6.4 cm × 4.2 cm) for 6 weeks in a growing medium made with a mix of peat moss, perlite and coco fibre (Berger, Saint-Modeste, QC, Canada). Plants were irrigated once per day with a complete nutritive solution (100 mg N L−1; pH of 5.5) made by mixing 57.5 g of Plant Prod 6-11-31 (Plant Products Co. Ltd., Leamington, ON, Canada) and 42.5 g of calcium nitrate 15.5-0-0 (Yara, Oslo, Norway) in 100 L of water. Plants were placed on a table within a randomized complete block design with five replicates and one plant per experimental unit for Micro Tom and two replicates with three plants per experimental unit for M82.

2.2. Soy Protein Hydrolysate Treatments

Soil drench treatments were performed using commercially available SPHs AMINOGRO 13-0-0 (SPH13) and N-18-0-0 (SPH18; EZ-GRO, Kingston, ON, Canada). According to the manufacturer, both products were produced by enzyme hydrolysis of non-GMO soya meal. SPH13 is the original hydrolysed broth, filtered, concentrated and spray-dried, whereas SPH18 is obtained from SPH13. For this, isoelectric focusing was used to concentrate the hydrolysate in certain amino acids (mainly glycine). SPH13 and SPH18 were dissolved in distilled water at final concentrations of 1 and 10 g L−1. They were then applied by substrate drenching; 100 mL were applied on each Micro Tom plant, while 25 mL were applied on each M82 plant.

2.3. Botrytis Cinerea

Botrytis cinerea was graciously provided by the Laboratoire d’expertise et de diagnostic en phytoprotection (MAPAQ, Quebec, QC, Canada). The fungus was preserved on potato dextrose agar (Becton, Dickinson and Company, Sparks, MD, USA) at 4 °C. Botrytis cinerea was cultivated at room temperature under agitation (160 rpm) in a 200 mL Erlenmeyer flask containing 100 mL potato dextrose broth (Becton, Dickinson and Company, Sparks) for two weeks. The liquid culture was filtered with three layers of sterile cheesecloth. The mycelium was then recovered by rinsing the cheesecloth with 200 mL sterile physiological water (0.5% NaCl) supplemented with 0.01% SYLGARD™ OFX-0309 (The Dow Chemical Company, Midland, MI, USA) and grinded mechanically using a sterile food processor. The suspension was adjusted to a concentration of 1 × 10⁵ of mycelial suspension (1 × 10⁵ propagules mL−1) with a haemocytometer (Hausser Scientific, Horsham, PA, USA).

2.4. Pseudomonas syringae pv. Tomato DC3000-LUX (Pst-LUX)

Pseudomonas syringae pv. tomato DC3000-LUX (Pst-LUX) was graciously provided by Dr. Edel Pérez-López (Université Laval, Quebec, QC, Canada). The strain was preserved in 15% glycerol solution (w/v) (VWR International, West Chester, PA, USA). Pst-LUX was cultivated in King’s B liquid medium (20 g L−1 of Bacto™ Proteose Peptone No. 3 (Becton, Dickinson and Company), 1.5 g L−1 of dibasic sodium phosphate (EM Science, Gibbstown, NJ, USA), 10 g L−1 of glycerol (VWR International, West Chester, PA, USA) and 1.5 g L−1 of magnesium sulfate (Fisher Scientific, Geel, Belgium)) under agitation (160 rpm) at 28 °C for 24 h. Bacteria were recovered by centrifugation (3600× g, 5 min) and suspended (1 × 10⁶ colony-forming units (CFU) mL−1) in 10 mM MgSO4 solution supplemented with 0.01% SYLGARD™ OFX-0309. Bacterial concentrations were assessed by optical density at 600 nm (OD600) with 0.5 McFarland standards using an Epoch 2 Microplate Spectrophotometer (BioTek Instruments, Inc., Winooski, VT, USA).

2.5. Pathogen Inoculations

Tomato ‘Micro Tom’ and ‘M82’ plants were cultivated in a greenhouse under the conditions previously described. Six-week-old tomato (‘Micro Tom’) plants were vaporized until runoff twice (3 days after SPH treatments and 8 weeks later) with B. cinerea suspension using a portable sprayer. After the first inoculation, plants were placed under a polythene sheet tent for the rest of the growing cycle to increase relative humidity levels over 70%.
Three days after SPH treatments, six-week-old tomato ‘M82’ plants were dipped in Pst-LUX suspension (1 × 10⁶ CFU mL−1) for 10 s, while control plants were dipped in 10 mM MgSO4 solution supplemented with 0.01% SYLGARD™ OFX-0309. They were then kept for 6 days under plastic domes to keep the relative humidity over 70%.

2.6. Plant Measurements

Plant height was measured as the distance between the growth medium and the highest point on the plant, while the plant diameter was assessed by measuring the longest distance between the tips of two opposing leaves. The chlorophyll contents were measured using a SPAD 502 Plus Chlorophyll Meter (Konica Minolta Co Ltd., Tokyo, Japan). SPAD indexes were measured on leaves of similar sizes and ages. For each plant, the average of three measurements was taken on the same leaf to reduce the variability caused by the sensitivity of the measuring device. The Fv/Fm values were taken on the same leaves as the SPAD measurements using a Handy PEA (Hansatech Instruments Ltd., King’s Lynn, Great Britain).

2.7. Fruit Yield Assessment

At the end of the growing cycle (16 weeks), tomato fruits were harvested from each ‘Micro Tom’ plant separately. They were sorted by colour, and for each plant, green, yellow and red fruits were counted and weighed.

2.8. RNA Isolation and RT-qPCR

Leaf samples taken 2 days after SPH treatments were ground in liquid nitrogen, and total RNA was extracted using the Rapid Plant RNA Isolation Kit (Bio Basic, Markham, ON, Canada). RNA quality was confirmed by gel electrophoresis and genomic DNA removed by treatment with DNase I (Thermo Fisher Scientific Inc., Waltham, MA, USA). The cDNA was then synthesized from 500 ng RNA using a Primescript RT Reagent Kit (Takara Bio, Shiga, Japan) with random hexamer and oligo(dT) primers. The qPCR was performed on 1 μL of one-fifth diluted cDNA in 35-μL reactions containing SYBR™ Green I Nucleic Acid Gel Stain (1:20,000 final dilution; Thermo Fisher Scientific), Taq DNA polymerase (1.75 units) with standard Taq buffer (New England Biolabs, Pickering, ON, Canada) and 0.2 µM primers (Table 1). The reaction was done in a LightCycler® 96 Instrument (Roche, Basel, Switzerland) real-time system. Relative quantification of the gene expression adjusted for efficiency was performed using PCR Miner [24]. ACTIN2 (ACT2), TUBULIN, UBIQUITIN and SAND were used as the reference genes. Their stability values were within the advised limits (M < 0.5 and Cv < 0.25) [25].

2.9. Disease Severity Assessments

Gray mold (B. cinerea) severity was assessed at the end of the growing cycle on each plant by evaluating the average number of necrotic lesions per leaf (total number of necrotic lesions on the plant/number of leaves).
Bacterial speck (Pst-LUX) severity was assessed six days after the inoculation. Disease severity was then determined according to the following scale: 0 = no necrotic lesions, 1 = 1–10 lesions, 2 = 11–25 lesions, 3 = 26–50 lesions, 4 = 51–75 lesions, 5 = 76–100 lesions, 6 = 101–150 lesions, 7 = 151–200 lesions and 8 = over 200 lesions.

2.10. Luciferase Assay and Bioluminescence Imaging

Leaflets of similar size and age were taken for each treatment of three randomly selected plants. Leaves were then incubated for 10 min in the dark in a 1 mM solution of D-Luciferin (potassium salt, Cayman Chemical Company, Ann Arbor, MI, USA) in 10 mM MES and 0.01% Tween 80 at pH 7.0. Bioluminescence images were taken with the Azure c300 Imaging System (Azure biosystems, Dublin, OH, USA) using the chemiluminescence program and a 10 min exposure time.

2.11. Nutrient Quantification

Dry samples of SPH13 and SPH18 mineralized using micro-Kjeldahl [30]. K, Ca and Mg were quantified with an atomic absorption spectrometer (Perkin Elmer, model 3300, Uberlingen, Germany) [31], while N and P were quantified using a colorimeter [32,33]. Other elements—namely, Mo, Sr, Rb, Se, As, Hg, Zn, Cu, Fe and Mn—were analyzed by X-ray fluorescence (XRF) with a portable spectrometer (Niton XL3t-955 GOLDD, Ultra-Mining/Enviro XRF Analyzer, with portable bench, XL2/3; Thermo Fisher Scientific) following the protocol described in [34].

2.12. Statistical Analysis

Results were presented as the mean ± the standard error of the mean. Statistical analyses were performed using R (R-4.1.1, R Core Team, 2021, Vienna, Austria). Sample size was not predetermined using statistical methods but considered the variability of the traits measured, assessed by the standard deviation. Data was transformed using Tukey’s ladder of powers; then, one-way ANOVAs were used to compare multiple sample means, with post hoc LSD tests. Mean values that did not share the same letters were significantly different at p < 0.05. The results for the statistical significance tests are included in the legend of each figure; n values represent the number of biological replicates.

3. Results

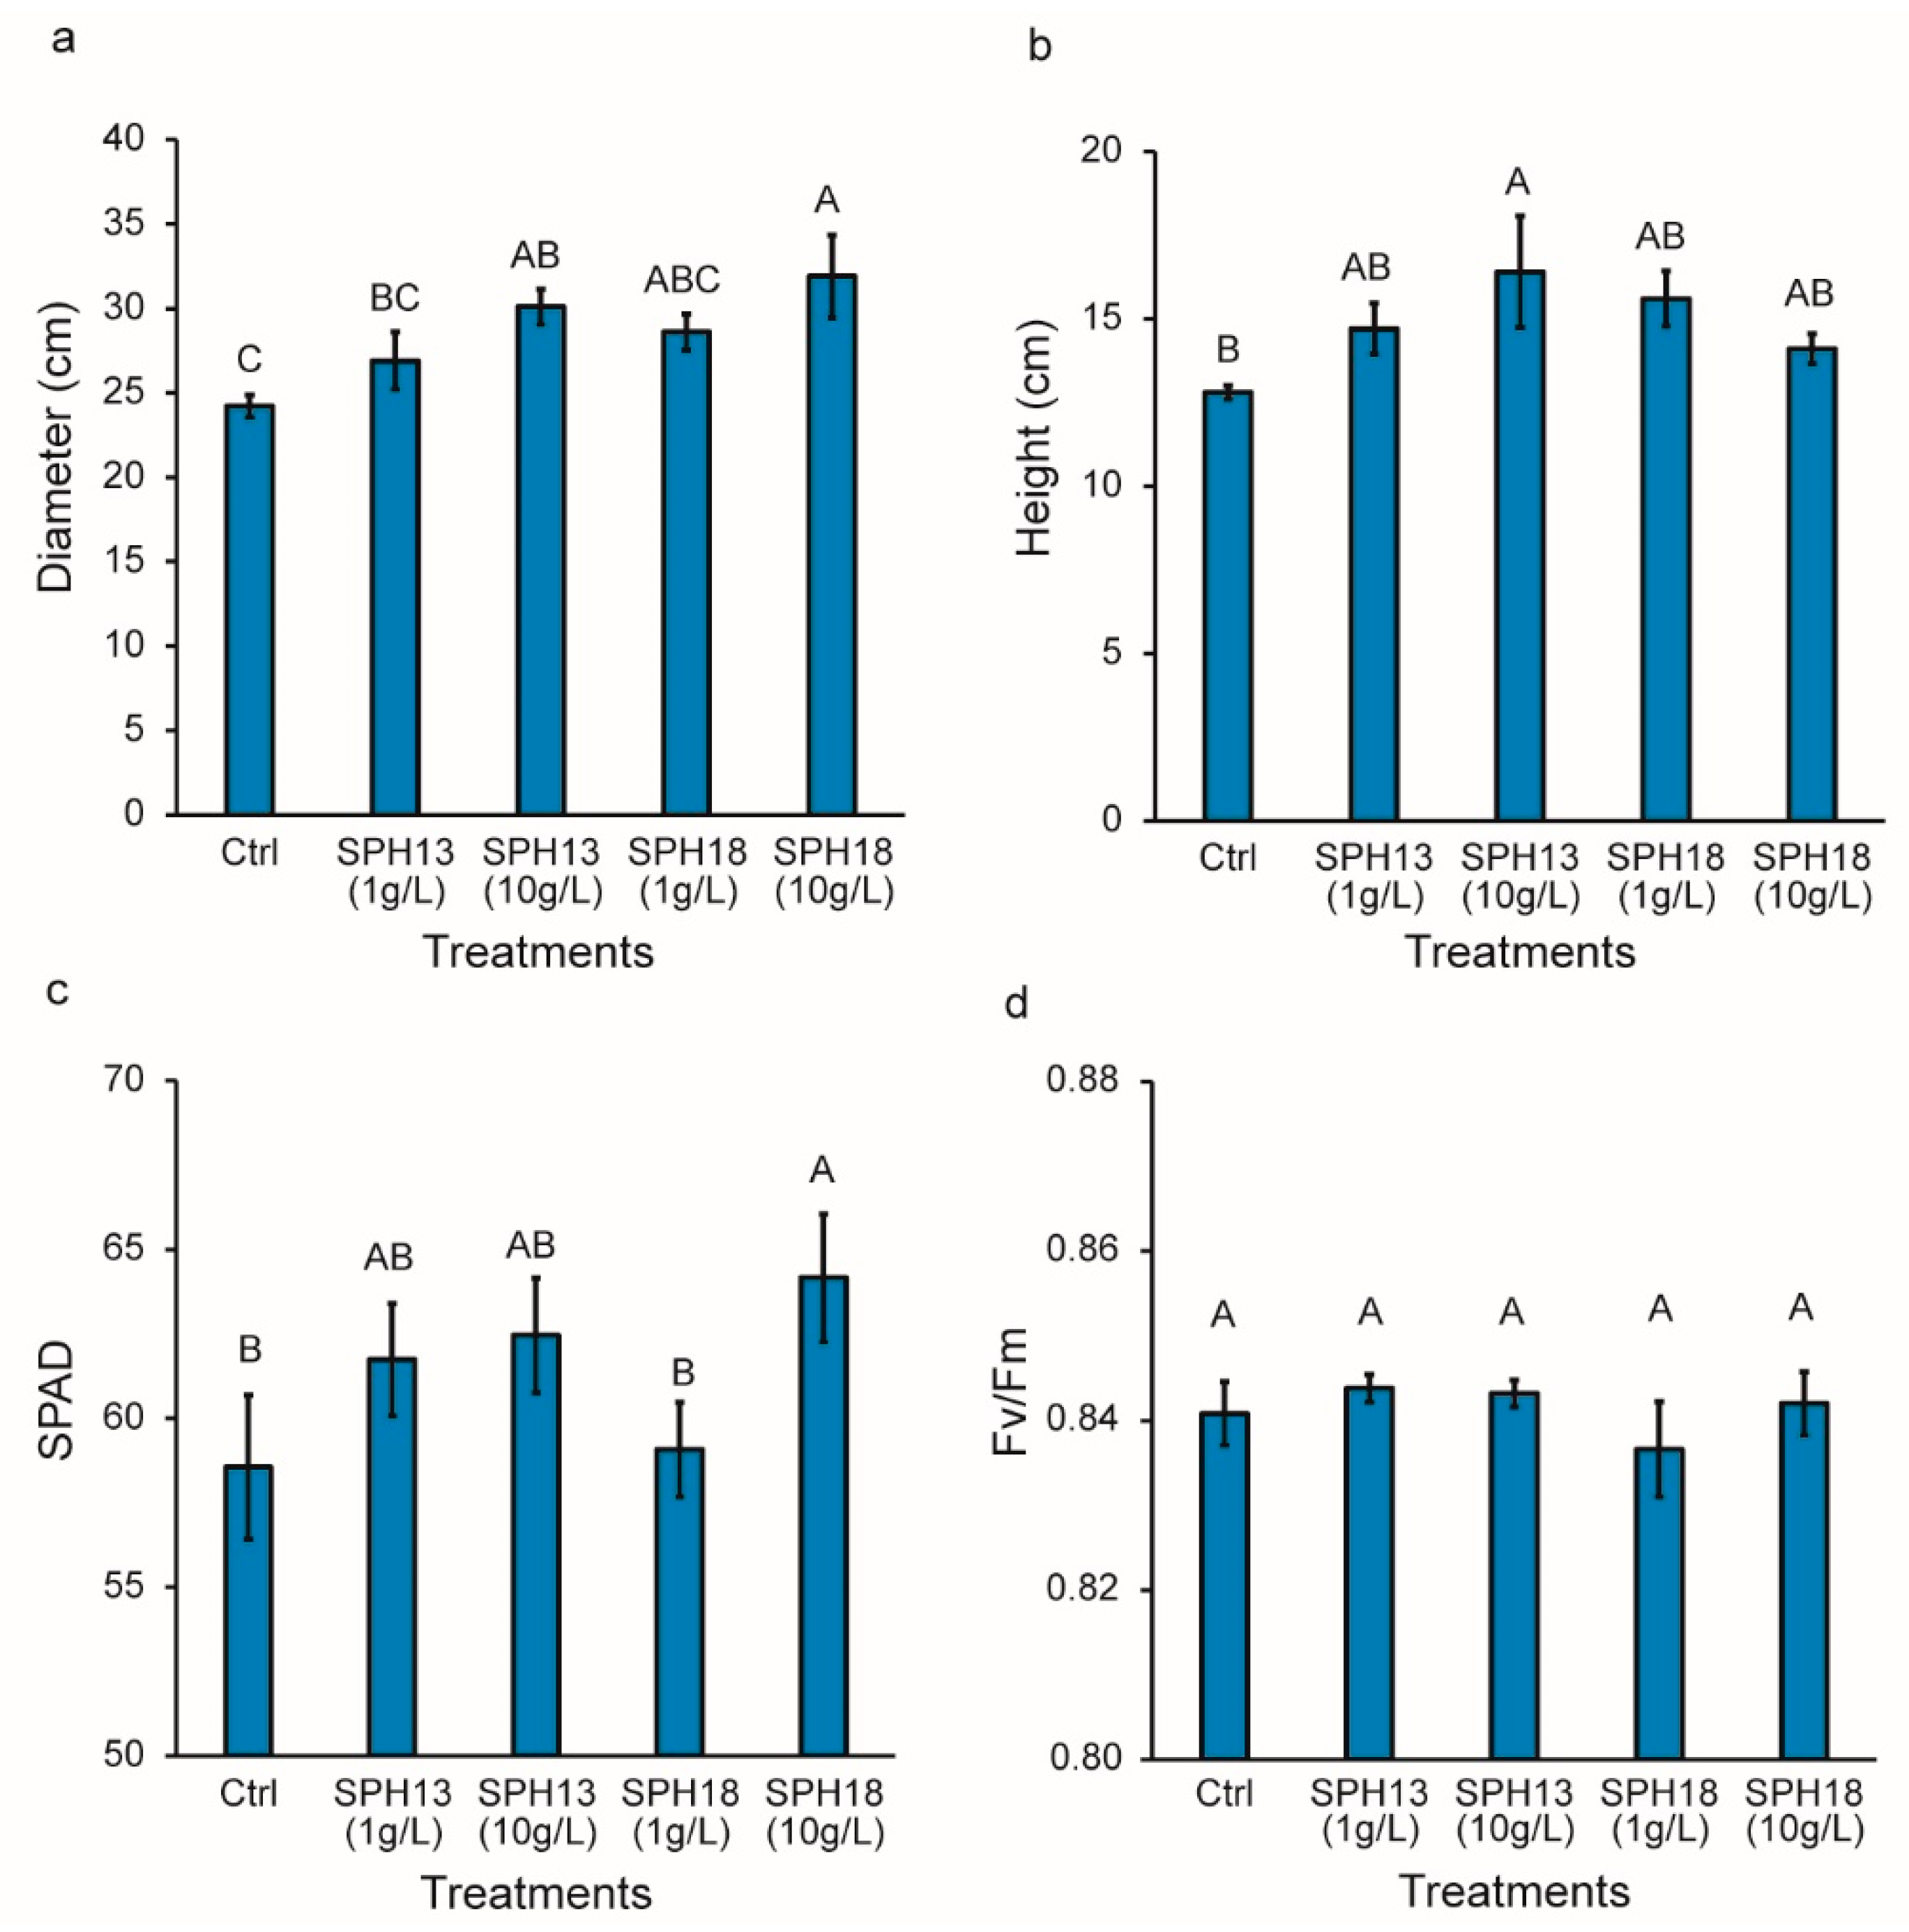
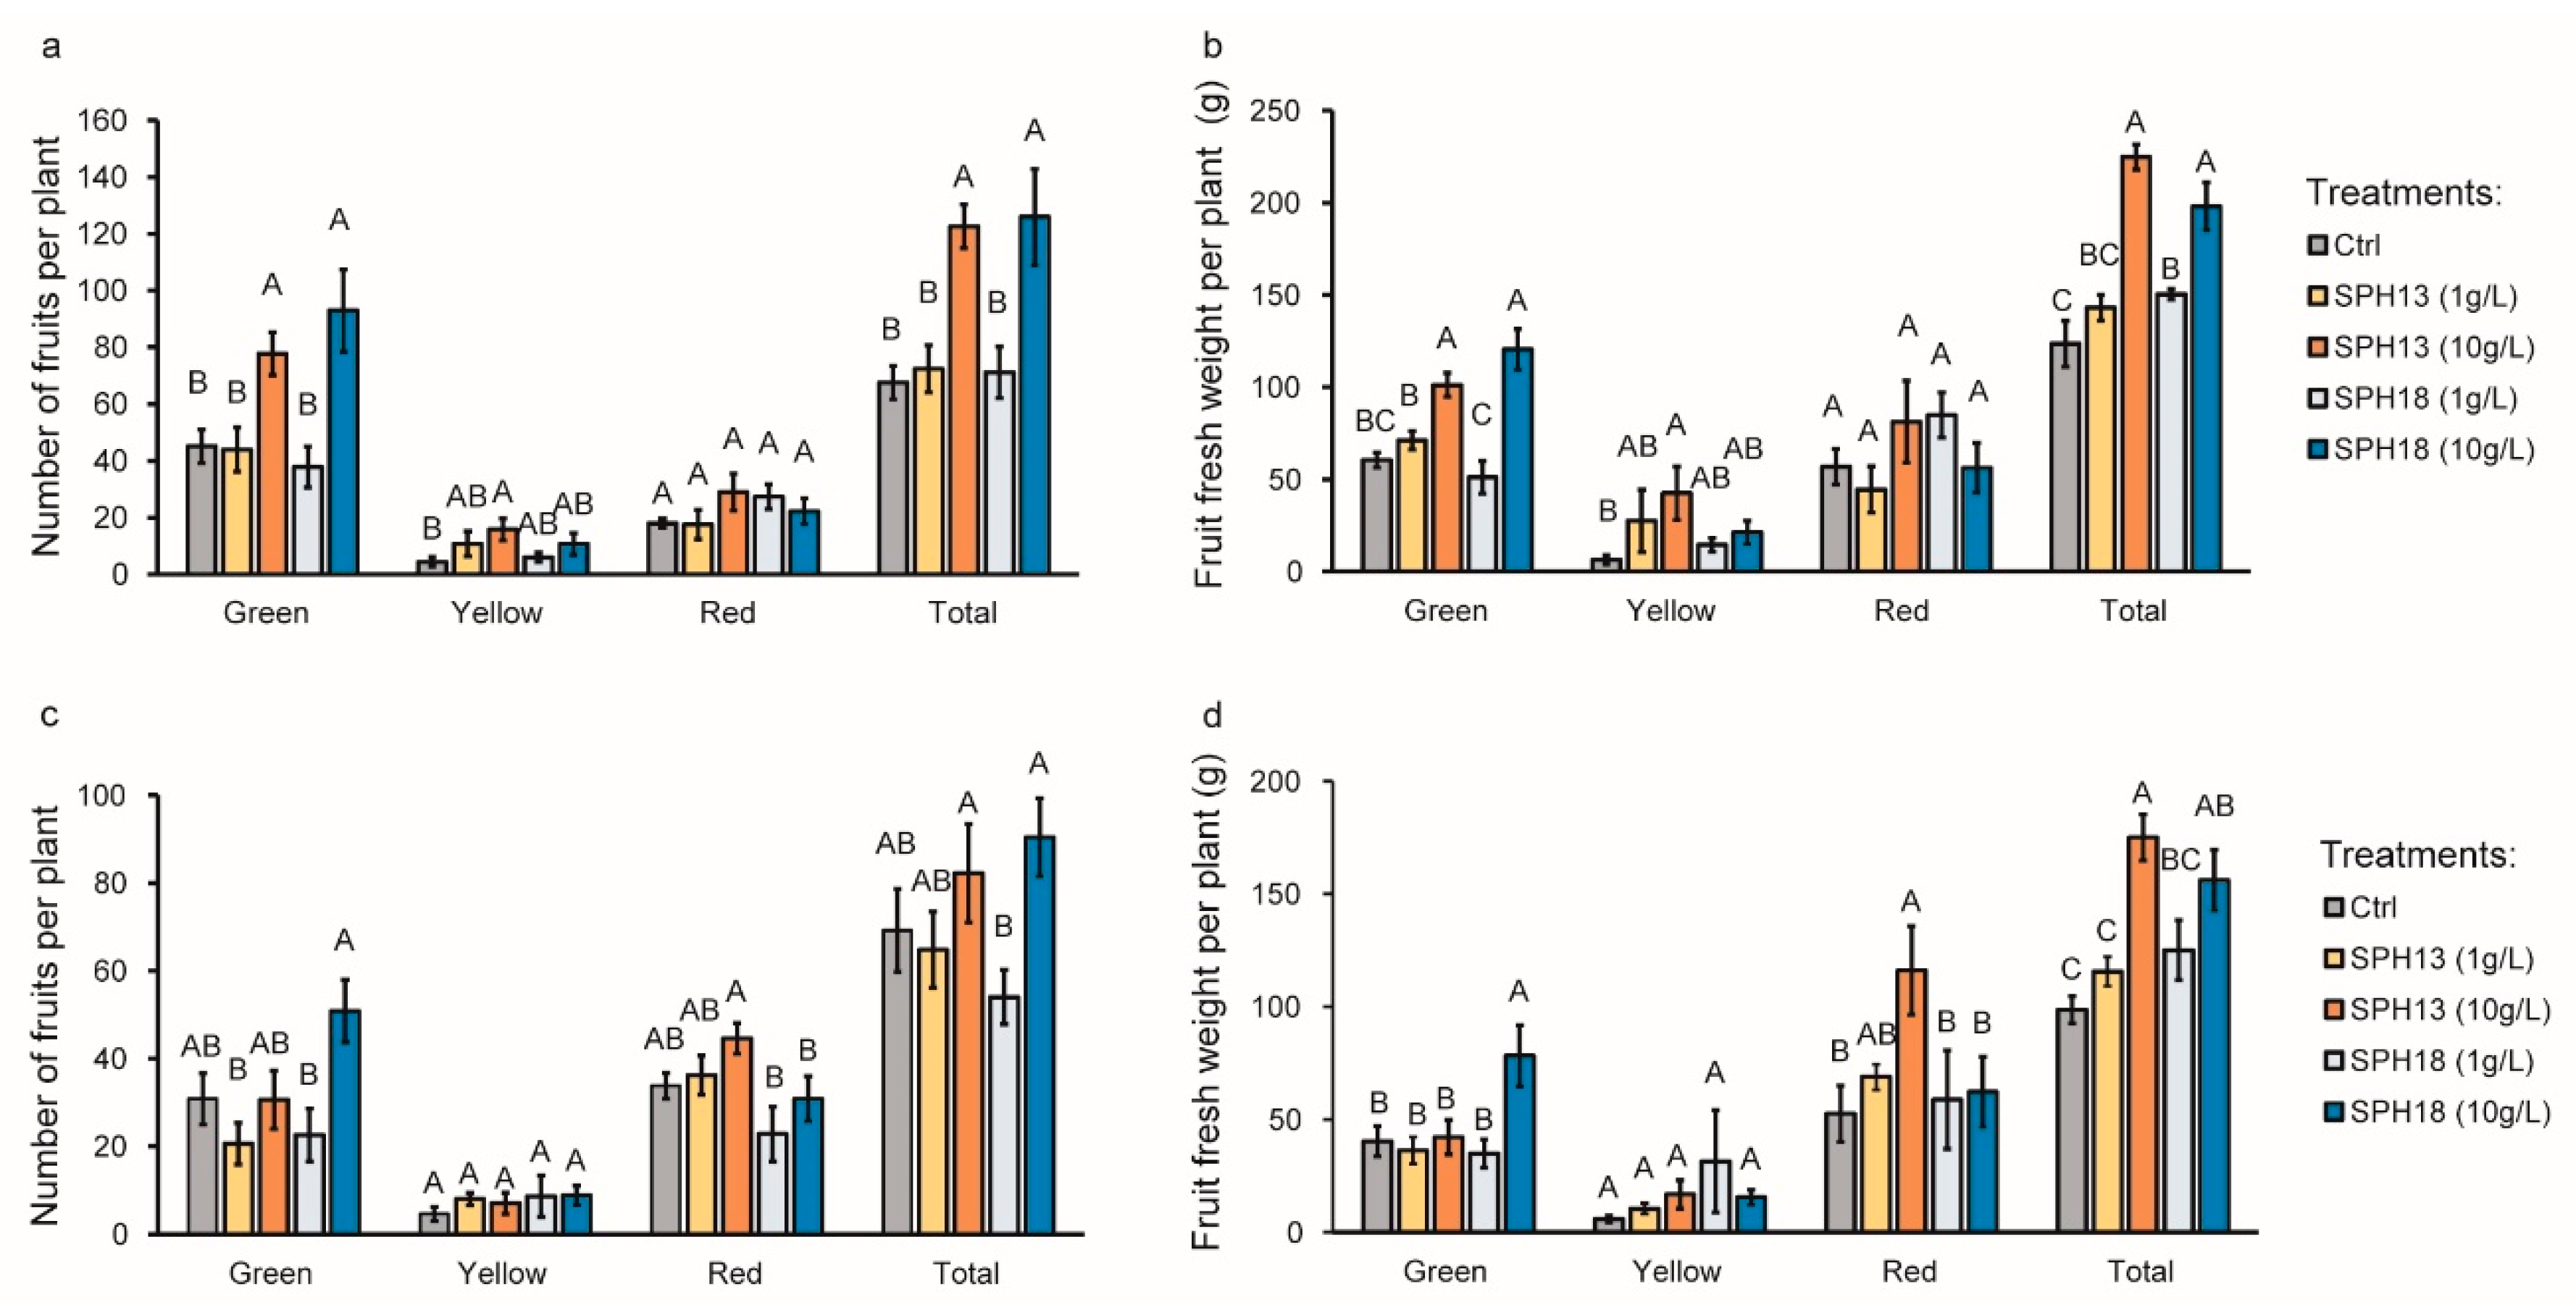
3.1. Soy Protein Hydrolysates Stimulate Growth and Fruit Productivity

The first experiment was performed to assess the short- and long-term effects of SPHs on plant growth and fruit productivity of S. lycopersicum ‘Micro Tom’. SPH13 at 10 g L−1 significantly increased the Micro Tom plant diameter by 24% (Figure 1a) and height by 28% (Figure 1b) compared with the control, while SPH18 increased the plant diameter by 32% at 10 g L−1 (Figure 1a) but did not have any significant effect on the plant height (Figure 1b). Since plant growth is tightly linked to photosynthesis, which allows for the fixation of atmospheric carbon into its organic matter, we determined the effects of SPHs on photosynthesis by measuring the chlorophyll content (SPAD index; Figure 1c) and maximum quantum yield of photosystem II (Fv/Fm, Figure 1d). When applied at 10 g L−1, SPH18 allowed for a significant increase in the chlorophyll content, as shown by the 10% increase in the SPAD index over the control treatment (Figure 1c). SPH13 also increased the chlorophyll contents at 1 and 10 g L−1, but the measured increase was not significant compared to the control (Figure 1c). The SPHs did not cause any increase in photosystem II (PSII) activity, as shown by the Fv/Fm measurements (Figure 1d). These results suggest that, under the standard growing conditions, SPHs may stimulate chlorophyll biosynthesis without affecting the photosynthetic activity, expressed by Fv/Fm.
Nine weeks after the second treatment, fruits were harvested, and the number and fresh weight of green, yellow and red tomato fruits per plant were assessed so as to determine the effect of SPHs on fruit productivity and fruit maturation. Overall, the measurements showed that, when applied at 10 g L−1, SPH13 and SPH18, both increased the total fruit numbers per plant by more than 80%, while increasing the total fruit weight by 81 and 60%, respectively (Figure 2a,b). More specifically, SPH13 and SPH18 at 10 g L−1 significantly doubled the number and the biomass of green fruits (Figure 2a,b), while no impact was observed for red ripened fruits, with an average red fruit number of 23 and an average red fruit weight of 64.7 g per plant (Figure 2a,b). However, the yellow fruit number and weight increased by 4 to 6.7-fold, respectively, for SPH13 (10 g L−1) treatment, with 16 fruits and 42.5 g per plant compared with 4 fruits and 6.3 g per plant for control-treated plants (Figure 2a,b). SPH13 treatments almost doubled the average size of yellow fruits, with 2.5 g and 2.7 g per fruit obtained with SPH13 at 1 and 10 g L−1, respectively, against 1.4 g per fruit observed with the control (data not shown). Regarding the proportions of unripe fruits, the percentages of yellow and green fruit weight increased from 54.1% for the control to 63.9 with SPH13 at 10 g L−1, and to 71.6% with SPH18 at 10 g L−1. Altogether, these data showed that drench applications of SPH increased the plant growth, fitness and overall fruit productivity of tomato plants. However, two drench applications with SPHs delayed fruit maturation time in a way that did not allow for a higher ripe fruit production nine weeks after the treatments, especially for SPH18 (Figure 2a,b).
We hypothesized that, by decreasing the quantity of SPH applied on plants, we could achieve higher red fruit production within a 16-week-long growing cycle. Therefore, the experiment was repeated but with only one soil drench application. The fruits were harvested 10 weeks after treatments to determine their effects on fruit productivity (Figure 2c,d). Interestingly, SPH13 and SPH18 at 10 g L−1 increased the total fruit number per plant by only 19 and 31% (not significant at p < 0.05), while raising significantly the total fruit weight per plant by 58 and 77%, respectively. Similarly to the first experiment, SPH18 at 10 g L−1 raised the number of green fruits per plant from 31 (control) to 51 and the total green fruit weight per plant from 40 g (control) to 78 g, corresponding to a 65% and 94% increase, respectively, and with no impact on red fruits (Figure 2c,d). Although not significant, a single application of SPH13 at 10 g L−1 allowed for a 32% increase in the red fruit number per plant. On average, plants treated with SPH13 at 10 g L−1 had 45 ripe fruits at the end of the growth cycle, whereas control-treated plants bore 34 red fruits (Figure 2c). On the other hand, plants treated with SPH13 (10 g L−1) demonstrated a significant twofold increase in red fruit biomass per plant with 116 g of red ripened fruits per plant against 52.5 g produced by control-treated plants; Figure 2d), which showed that a single application of SPH13 at 10 g L−1 has the potential to increase fruit productivity without prolonging the fruit maturation time (Figure 2c,d).

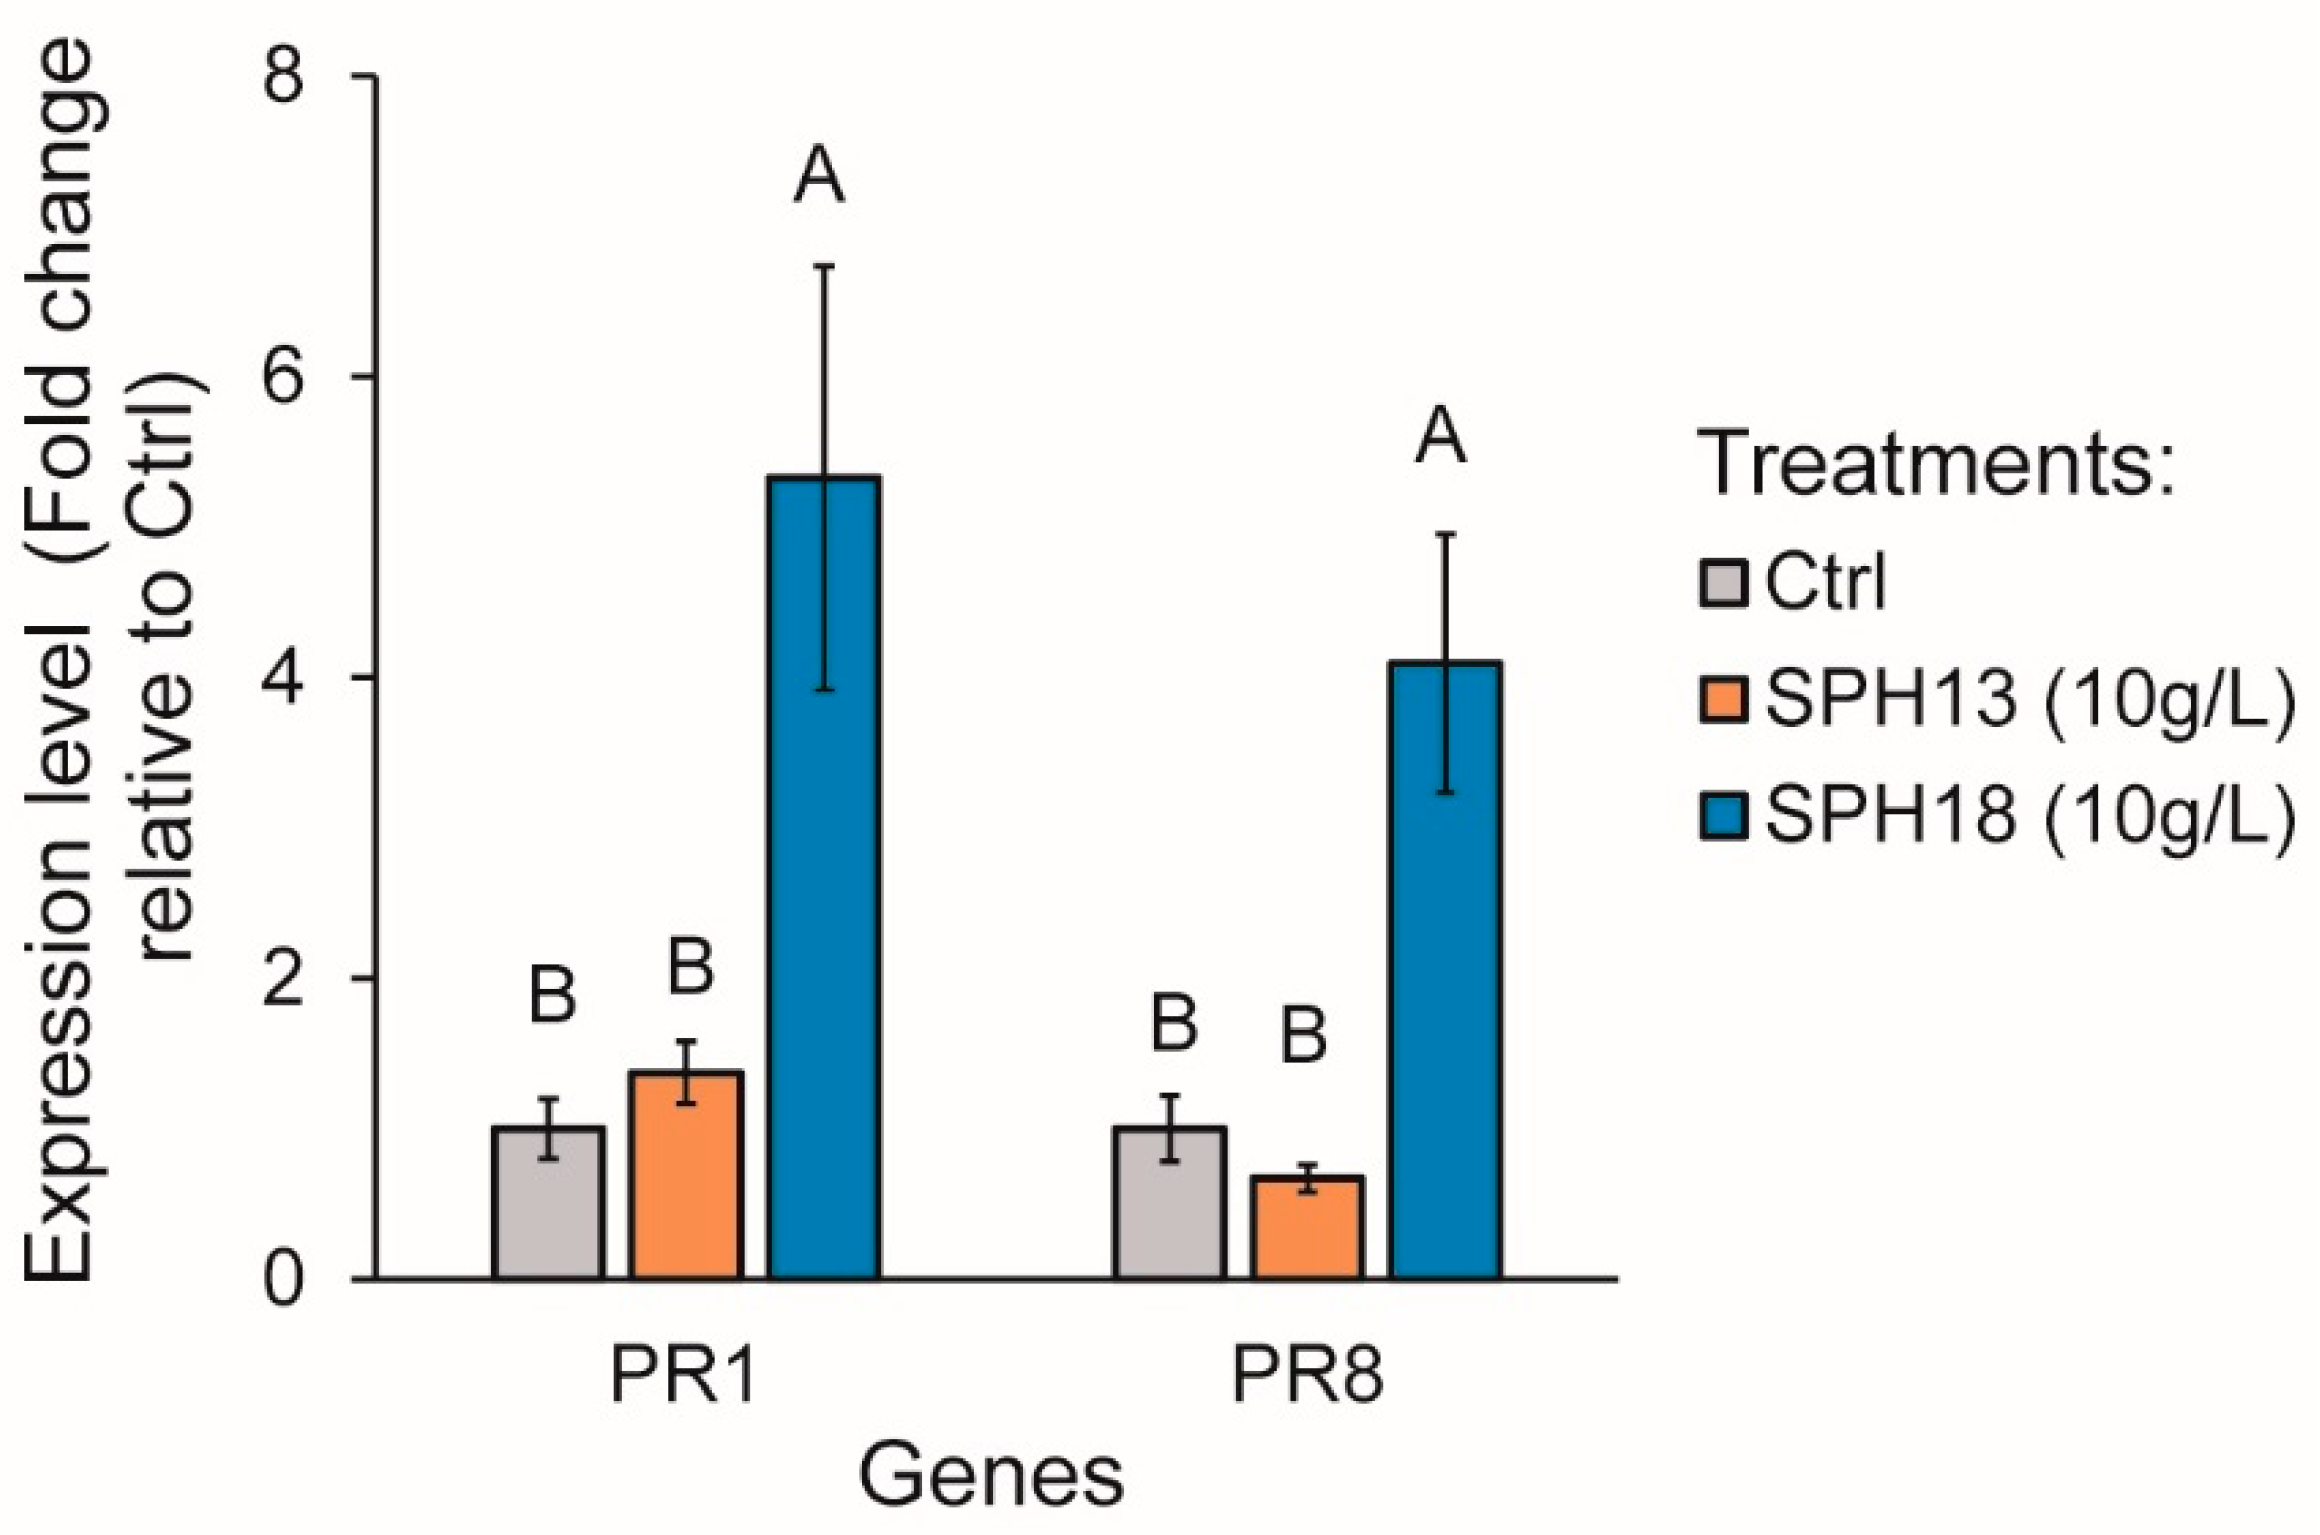
3.2. Soy Protein Hydrolysates Stimulate Defence Gene Expression

Two days after the first SPH soil drench application, leaf samples were taken for RT-qPCR in order to measure the expression levels of the defence-related genes. The tested genes were pathogenesis-related 1 (PR1), which is widely used as a marker gene for salicylic acid (SA) accumulation and the activation of systemic acquired resistance (SAR) mechanisms, and PR8, a gene encoding a chitinase protein also involved in plant disease resistance [29]. Both genes were significantly upregulated two days after the first soil drench application of SPH18 at 10 g L−1 (Figure 3). Indeed, a five- and fourfold increase in the expression levels were measured with SPH18 (10 g L−1) for PR1 and PR8, respectively, indicating that, in addition to its beneficial impact on plant growth, SPH18 stimulated defence mechanisms and, thus, acted as an elicitor.

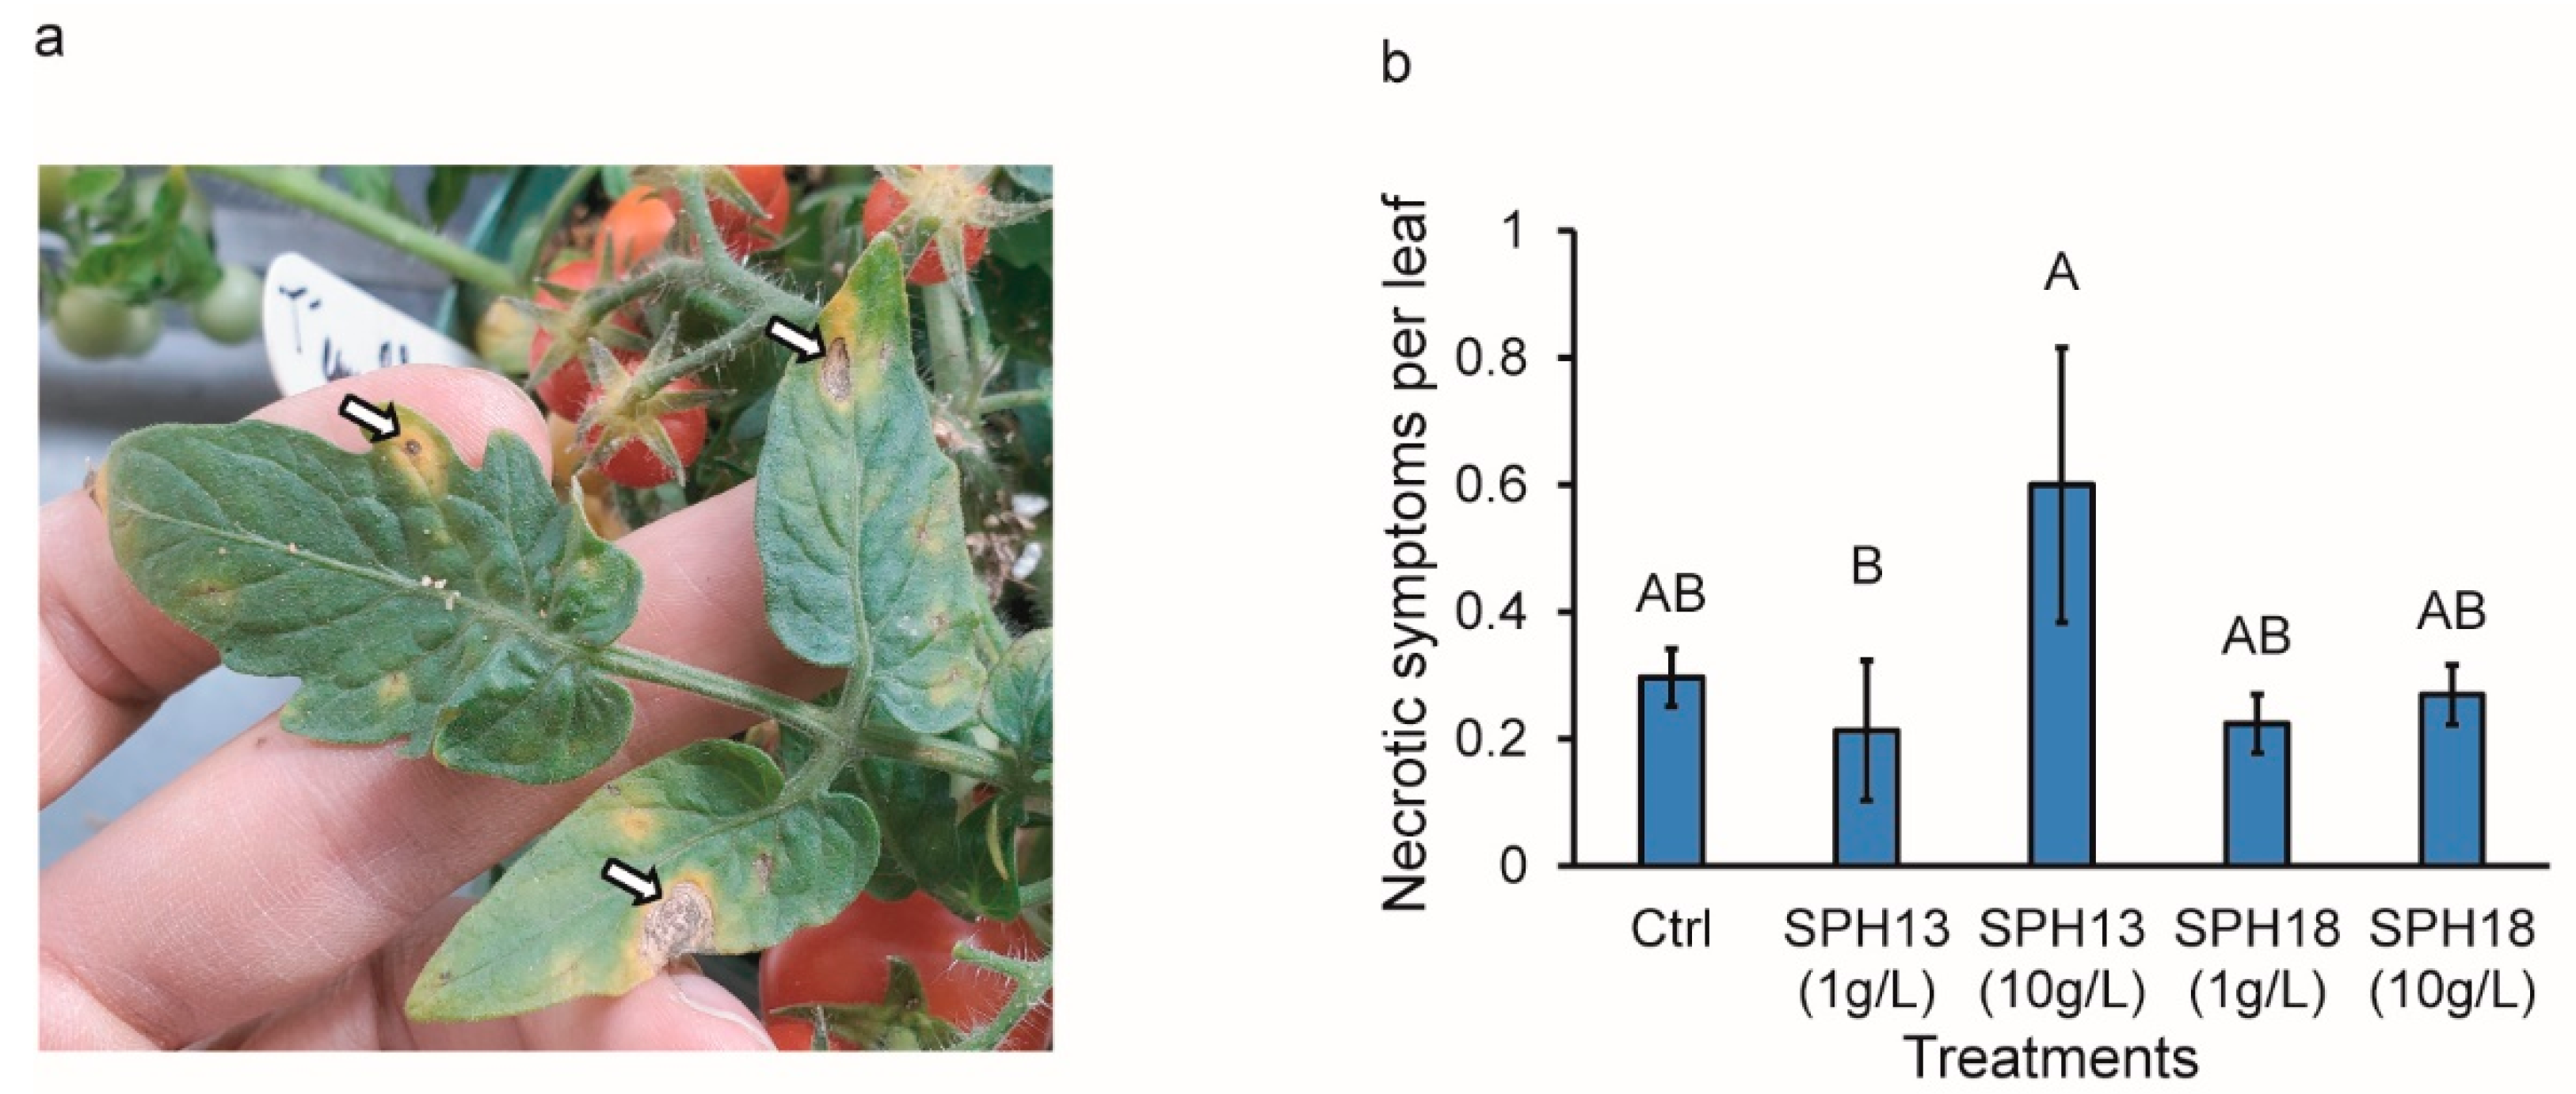
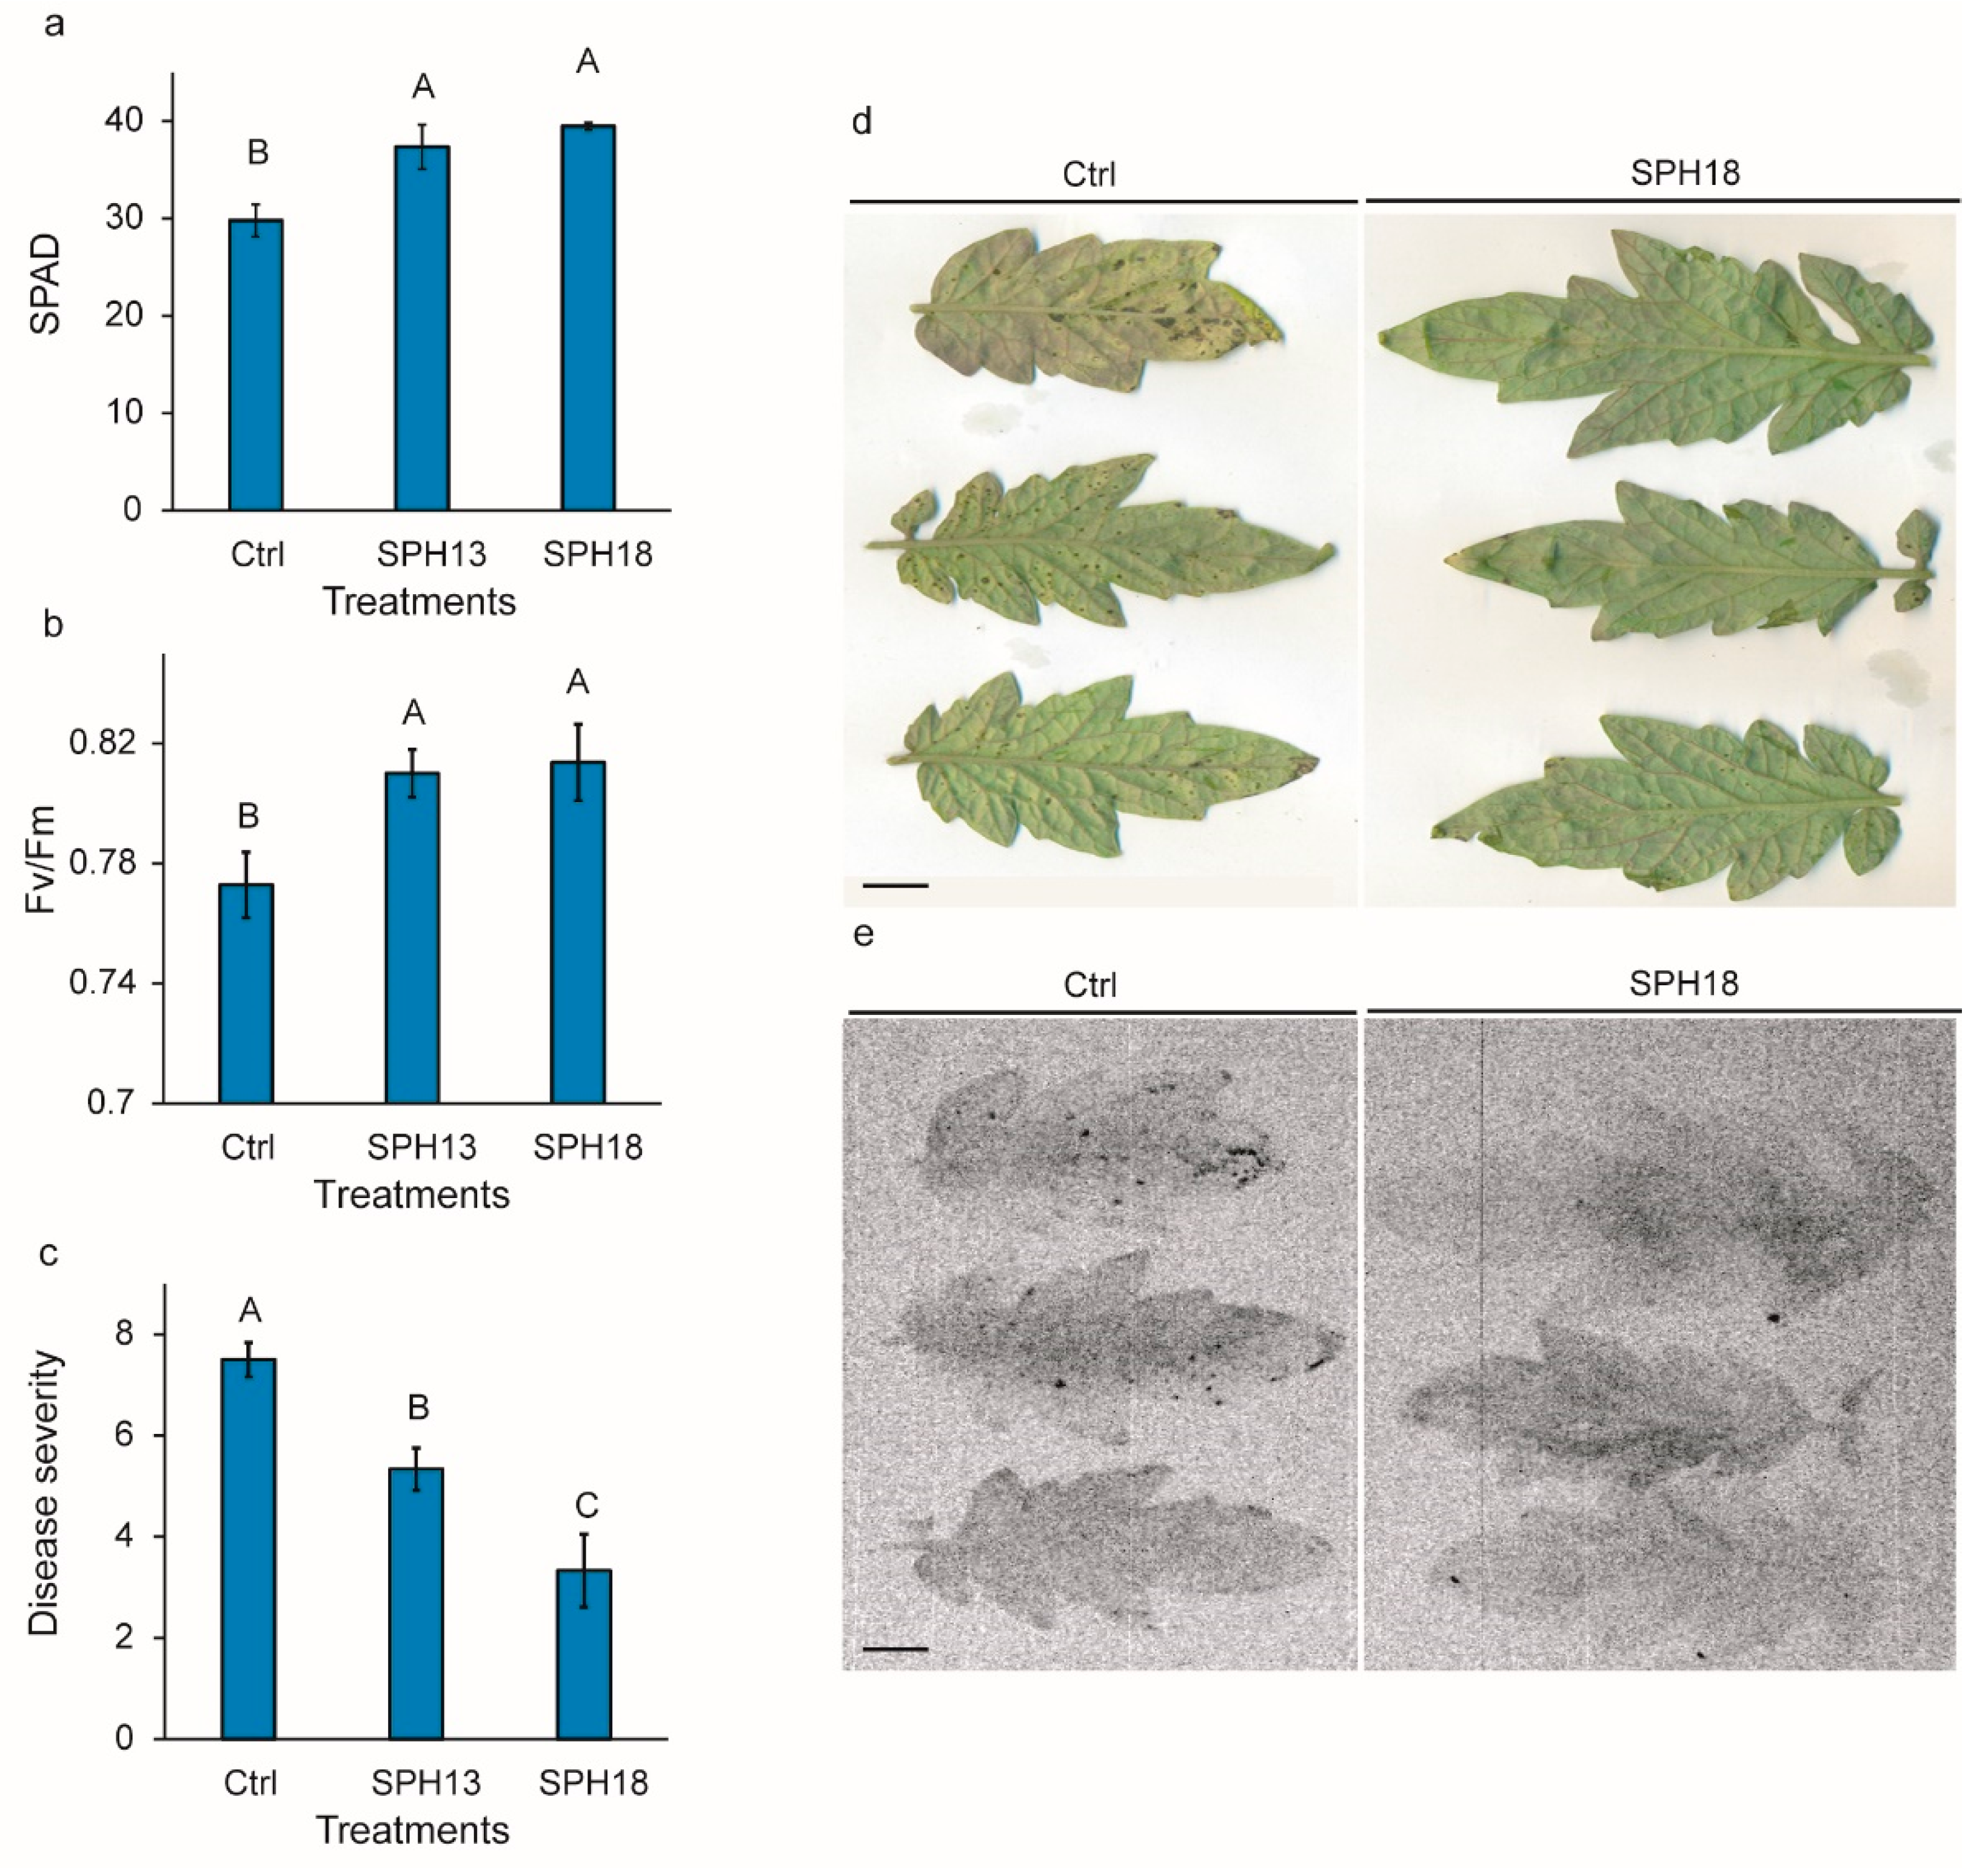
3.3. Soy Protein Hydrolysates Modulate Pathogen Resistance

To assess the protective effect of SPHs against plant pathogens, ‘Micro Tom’ plants were inoculated twice with B. cinerea. At the end of the growing cycle, fruits did not show any symptoms, while leaves showed dark circular spots, which are characteristic gray mold symptoms as shown in Figure 4a. The gray mold severity was not significantly influenced by the treatments as shown by the necrotic symptom number per leaf observed on infected plants treated or not with SPHs (Figure 4b).
With SPHs showing no protection against a necrotrophic pathogen, we decided to test whether SPHs may increase tomato plant resistance to a hemibiotrophic pathogen such as Pst-LUX. Given that cultivar Micro Tom is genetically resistant to this specific pathogen, another S. lycopersicum cultivar was used for this experiment, namely M82. Six days after inoculation with Pst-LUX, SPAD index measurements showed that SPH-treated plants had significantly higher chlorophyll contents than control plants, with values ranging between 37.4 and 39.5 for SPH13 and SPH18 at 10 g L−1 compared with 29.8 obtained for the control treatment (Figure 5a). This translated into higher PSII activity levels, as shown by the Fv/Fm values of 0.81 obtained for both SPH treatments compared with 0.77 for the control (Figure 5b), meaning that SPH treatment protected the plants from the drop of photosynthetic activity (i.e. Fv/Fm) caused by Pst-LUX and the subsequent growth-defence trade-off. Furthermore, SPH13 and SPH18 significantly increased the plant resistance to Pst-LUX, with SPH18 having the strongest effect (Figure 5c). Finally, the Pst-LUX strain used for this experiment carried the luciferase operon of Photorhabdus luminescens, allowing us to assess the in situ presence and survival of this pathogen with the luciferase assay. Scanning and bioluminescence imaging showed that the necrotic spots observed on the scans (Figure 5d) colocalized with dark spots and corresponded to luciferase activity and, therefore, the presence of living bacteria (Figure 5e), confirming that the lesions are indeed caused by Pst-LUX. Finally, the leaves taken from plants pretreated with SPH18 showed fewer bioluminescence spots (Figure 5e), indicating a lower survival rate of the pathogen.

4. Discussion

Plant nutrition and disease management are two main challenges faced by intensive agriculture, and sustainable alternatives have to be found to reduce the use of chemical fertilizers and pesticides for conventional agriculture and improve crop resilience and productivity of organic farming, while ensuring a low environmental footprint of food production systems. This study highlights the benefits of two SPHs, which are certified for organic production in North America. Indeed, on the one hand, the application of SPHs allowed for an increase in fruit productivity by the tomato ‘Micro Tom’ while, on the other hand, strongly reducing the incidence of Pst-LUX on S. lycopersicum ‘M82’.

4.1. SPHs Increase Tomato Fruit Production

The drench application of SPH13 and SPH18 had different effects on the tomato fruit yield. Indeed, in contrast to the first experiment where two SPH13 applications at 10 g L−1 did not increase the red fruit yield, a single application of SPH13 allowed for a higher red-fruit biomass per plant. Therefore, SPH13 may affect the fruit maturation time. Interestingly, two applications of SPH13 or SPH18 at 10 g L−1 increased the total fruit numbers by more than 80%, while one treatment did only increase the total fruit number by 19–30%. However, the total fruit biomass was increased by over 60% with one or two SPH treatments at 10 g L−1. This showed that two SPH applications at 10 g L−1 increased the plant flowering, expressed by a higher total number of fruits, and one SPH application only stimulated fruit growth expressed by an increased fruit biomass.
Moreover, for the number and biomass of green fruits, two applications of SPH13 (10 g L−1) at one-week intervals caused similar effects compared to SPH18 applied twice at 10 g L−1, whereas one application of SPH13 at 10 g L−1 caused an increase in red fruit biomass, which was not observed with SPH18. Considering that SPH18 is obtained from SPH13 through isoelectric focusing, we may assume that the same compound (nutrient, amino acid or peptide) causing increased flowering is present in both SPHs but at a higher concentration in SPH18. Additionally, SPH13 might contain compounds that are not present in SPH18 and that allow for increased red fruit size.
A recent study has shown that foliar applications of a legume seed-derived protein hydrolysate (named Trainer, Italpollina S.p.A., Rivoli Veronese, Italy) increased the tomato fruit productivity of two cultivars: Akyra and Sir Elyan. The PH was applied at two different concentrations nine times during the growing cycle, with 10 days between each treatment. The highest concentration used in this study (5 mL L−1) contained 0.25 g L−1 of the total N and allowed, on average, for a 21.4% increase in the marketable tomato yield [21]. In our study, a single substrate drench application of SPH13 containing 1.3 g L−1 of the total N, allowed for a 121% increase in mature fruit weight per plant, which highlights the advantages of applying PHs through a substrate drench rather than foliar spray. The higher increase in tomato fruit productivity could be explained by the addition of the nutrient input to the biostimulating effect achieved through either foliar or substrate drench applications.

4.2. SPHs as a Nutrient Source

Since our SPH treatments contained high levels of N and since plant nutrition, especially N nutrition, plays an important role in tomato fruit production, a question that arises is whether the beneficial effects of SPHs on the fruit yield were caused by an increased nutrient supply. Given that SPH13 contains 27% less total nitrogen than SPH18 (Table 2), the amount of total N supplied does not explain on its own why SPH13 (10 g L−1) allowed for higher red fruit masses than the SPH18 treatments. Moreover, the nutrients supplied by the SPHs are enclosed in complex organic molecules such as polypeptides or amino acids, which need to be broken down and mineralized by the soil microbiote in order to be efficiently absorbed by the plant. Due to the high solubility of SPHs and due to the fact that they were applied only once or twice during our experiments, it is possible that the SPHs got leached out during the daily watering that followed the treatments by a couple of days. This would mean that part of the nutrients provided by the SPHs did not stay long enough in the soil for them to be broken down by the microorganisms and absorbed by the plant. Therefore, the beneficial effects on fruit productivity obtained with our treatments were most likely not solely caused by the nutrient input they represented.

4.3. SPHs as Plant Biostimulants

Regarding the biostimulating properties of PHs, there have been many studies on tomatoes showing the stimulation of the physiological responses in plants by PHs, which could contribute to increasing fruit productivity. For instance, a study conducted by Sestili et al. [18] showed that the drench application of a legume seed-derived protein hydrolysate (Trainer) in tomato plants (‘Console F1’) grown under optimal N-fertilization (112 mg L−1) increased the expression of the genes involved in N metabolism and assimilation, as well as the genes encoding ammonium and amino acid transporters. These changes indicated that PH drench application stimulated the N metabolism, which was also reflected by the higher nitrate and total N contents in leaves [18]. Furthermore, a study by Colla et al. [17] showed an AUX-like effect with the commercially available Fabaceae-derived PH (Trainer), which stimulated root growth when applied to tomato cuttings. Increased root growth can thus allow for better nutrient absorption and higher nutrient use efficiency [35]. In another study, an untargeted metabolomic approach was used to characterize the biochemical changes in tomato roots caused by PHs. Their results showed that PH derived from Solanaceae and Malvaceae caused higher gibberellin (GA), auxin (AUX) and cytokinin (CK) accumulation levels [20]. Interestingly, exogenous applications of GA, AUX and CK have been reported to promote parthenocarpic fruit development in the tomato ‘Micro Tom’ [36,37], which demonstrates the importance of these three plant hormones during fruit development. Therefore, changes in the hormonal levels, as well as N absorption or metabolism, could be triggered by SPH13 and SPH18 and could thus be involved in the SPH-mediated stimulation of fruit productivity.

4.4. SPHs as Stimulators of Plant Defences

Our study is the first report showing the ability of SPHs to increase the expression of genes associated with plant defence mechanisms in ‘Micro Tom’ plants. This was corroborated by the fact that SPH13 and SPH18 reduced the severity of the bacterial speck on cultivar M82, with SPH18 having the strongest effect, making it an effective plant defence stimulator for tomato growers. Interestingly, untargeted metabolomics showed that tomato roots accumulated more phytoalexins after treatment with PHs from Solanaceae and Malvaceae [20], which suggests that PHs obtained from other plant species could also have the ability to stimulate plant defences. Indeed, this ability of PHs to stimulate plant defence mechanisms is potentially related to the presence of plant elicitor peptides also called phytocytokines, which are endogenous molecules capable of inducing pattern-triggered immunity [38]. Moreover, SPHs applied through foliar spray have been shown to enhance the innate immunity in grapevines, increasing their resistance to Plasmopara viticola, a biotrophic fungus [23]. Therefore, SPHs and PHs in general could potentially be used as PDS for many other crop species. Finally, since SPHs were effective against a hemibiotrophic (P. syringae) or a biotrophic [23] pathogen but had no protective effect against a necrotrophic pathogen (B. cinerea; Figure 4b), we may assume that these treatments stimulate SAR, which is regulated by the salicylic acid pathway rather than induced systemic resistance (ISR), the latter being controlled by the jasmonic acid and ethylene pathways. Indeed, plants rely on SAR to fend off biotrophic and hemibiotrophic pathogens, while necrotrophic pathogens and pests are fought using ISR [39].

5. Conclusions

In this study, we showed that drench application(s) of concentrated soy protein hydrolysates (SPH) can have long-lasting effects on plants, increasing growth and fruit production of tomato. Indeed, our data showed that two SPH applications at 10 g L−1 increased the flowering by over 80% and that one treatment was enough to increase total fruit weight by more than 60%. Although SPH18 mainly impacted unripe fruit yields, one SPH13 application at 10 g L−1 allowed for an unprecedented 121% increase in red ripened fruit production within a 16-week-long growing cycle. Besides the positive effect on fruit productivity, we showed that SPH18 at 10 g L−1 allows for a systemic induction of plant defence mechanisms, as revealed by a more than fourfold increase in the PR1 and PR8 expression levels, two genes that are involved in SAR. Finally, we demonstrated that SPH application, especially SPH18, increases plant resistance to Pst-LUX, a hemibiotrophic pathogenic bacterium, while no increase in plant resistance to a necrotrophic fungus was observed, further confirming the activation of SAR by SPH18.
Future works shall focus on determining the plant’s hormonal responses to SPH drench applications, as well as the active compounds involved. This should allow monitoring the consistency of these products and ensure a batch-to-batch reproducible production of bioactive PHs. Finally, understanding the mode of action could also give important clues on how to develop more cost-efficient ways of producing these active compounds, which could ultimately result in more affordable products for the growers.

Author Contributions

Conceptualization, A.B. and M.D.-H.; Methodology, A.B., T.T.A.N. and M.D.-H.; Software, A.B.; Formal Analysis, A.B.; Data Curation, A.B.; Writing—Original Draft Preparation, A.B.; Writing—Review and Editing, A.B., M.D.-H., R.J.T. and M.D.; Supervision, M.D.; Project Administration, M.D. and Funding Acquisition, M.D. All authors have read and agreed to the published version of the manuscript.

Funding

This research was funded by the Research Chair in Organic Greenhouses and Controlled Environment Horticulture of the Ministère de l’Agriculture, des Pêcheries et de l’Alimentation du Québec (MAPAQ) PPIA07 in partnership with Berger, Les Serres Frank Zyromski, Industries Harnois, Hydroserre Mirabel, Redsunfarms, Inno-3B and Gibio.

Institutional Review Board Statement

Not applicable.

Informed Consent Statement

Not applicable.

Data Availability Statement

The data presented in this study are available on request from the corresponding author.

Acknowledgments

The authors sincerely thank the Ministère de l’Agriculture, des Pêcheries et de l’Alimentation du Québec and the partners of the research Chair in Organic Horticulture in Greenhouse and controlled environment for their financial support: Berger, Les Serres Frank Zyromski, Industries Harnois, Hydroserre Mirabel, Redsunfarms, Inno-3B and Gibio. The authors would also like to thank Jean Martin, research professional at Laval University, for the nutritional composition analysis of the SPHs used in this study, the Laboratoire d’expertise et de diagnostic en phytoprotection (MAPAQ) and Edel Pérez-López (Université Laval, Quebec, QC, Canada) for having graciously provided the plant pathogens. Finally, the authors would like to thank EZ-GRO (Kingston, ON, Canada) for providing them with free samples of SPH13 and SPH18, as well as with very useful information about their products.

Conflicts of Interest

The authors declare no conflict of interest.

References

  1. United Nations World Population Prospects 2019-Highlights. In World Population Prospects 2019; Department of Economic and Social Affairs: New York, NY, USA, 2019; pp. 1–39.
  2. van Dijk, M.; Morley, T.; Rau, M.L.; Saghai, Y. A meta-analysis of projected global food demand and population at risk of hunger for the period 2010–2050. Nat. Food 2021, 2, 494–501. [Google Scholar] [CrossRef]
  3. Pimentel, D. Green revolution agriculture and chemical hazards. Sci. Total Environ. 1996, 188, S86–S98. [Google Scholar] [CrossRef]
  4. Jenkinson, D.S. The impact of humans on the nitrogen cycle, with focus on temperate arable agriculture. Plant Soil 2001, 228, 3–15. [Google Scholar] [CrossRef]
  5. Clark, S.; Klonsky, K.; Livingston, P.; Temple, S. Crop-yield and economic comparisons of organic, low-input, and conventional farming systems in California’s Sacramento Valley. Am. J. Altern. Agric. 1999, 14, 109–121. [Google Scholar] [CrossRef]
  6. Savci, S. Investigation of Effect of Chemical Fertilizers on Environment. APCBEE Procedia 2012, 1, 287–292. [Google Scholar] [CrossRef] [Green Version]
  7. Zhang, X.; Davidson, E.A.; Mauzerall, D.L.; Searchinger, T.D.; Dumas, P.; Shen, Y. Managing nitrogen for sustainable development. Nature 2015, 528, 51–59. [Google Scholar] [CrossRef] [Green Version]
  8. Dion, P.-P.; Jeanne, T.; Thériault, M.; Hogue, R.; Pepin, S.; Dorais, M. Nitrogen release from five organic fertilizers commonly used in greenhouse organic horticulture with contrasting effects on bacterial communities. Can. J. Soil Sci. 2020, 100, 120–135. [Google Scholar] [CrossRef]
  9. Dion, P.; Thériault, M.; Hunt, D.; Bittman, S.; Pepin, S.; Dorais, M. NLOS-OG: A management tool for nitrogen fertilization in organic greenhouses. Acta Hortic. 2020, 1296, 1093–1098. [Google Scholar] [CrossRef]
  10. Dorais, M. Advances in organic greenhouse cultivation. In Achieving Sustainable Greenhouse Cultivation; Marcelis, E.L., Heuvelink, E., Eds.; Burleigh Dodds Science Publishing: Cambridge, UK, 2019; Chapter 5; pp. 121–176. [Google Scholar]
  11. De Pascale, S.; Rouphael, Y.; Colla, G. Plant biostimulants: Innovative tool for enhancing plant nutrition in organic farming. Eur. J. Hortic. Sci. 2018, 82, 277–285. [Google Scholar] [CrossRef]
  12. Yakhin, O.I.; Lubyanov, A.A.; Yakhin, I.A.; Brown, P.H. Biostimulants in Plant Science: A Global Perspective. Front. Plant Sci. 2017, 7, 2049. [Google Scholar] [CrossRef] [Green Version]
  13. Rouphael, Y.; Colla, G. Editorial: Biostimulants in Agriculture. Front. Plant Sci. 2020, 11, 40. [Google Scholar] [CrossRef] [PubMed] [Green Version]
  14. Vargas-Hernandez, M.; Macias-Bobadilla, I.; Guevara-Gonzalez, R.G.; Romero-Gomez, S.D.J.; Rico-Garcia, E.; Ocampo-Velazquez, R.V.; Alvarez-Arquieta, L.D.L.; Torres-Pacheco, I. Plant Hormesis Management with Biostimulants of Biotic Origin in Agriculture. Front. Plant Sci. 2017, 8, 1762. [Google Scholar] [CrossRef] [PubMed]
  15. Lucas, J.A.; García-Cristobal, J.; Bonilla, A.; Ramos, B.; Gutierrez-Mañero, J. Beneficial rhizobacteria from rice rhizosphere confers high protection against biotic and abiotic stress inducing systemic resistance in rice seedlings. Plant Physiol. Biochem. 2014, 82, 44–53. [Google Scholar] [CrossRef] [PubMed]
  16. Demir, S.; Danesh, Y.R.; Boyno, G.; Najafi, S. Arbuscular mycorrhizal fungi in biotic and abiotic stress conditions: Function and management in horticulture. In Sustainable Horticulture, 1st ed.; Seymen, M., Kurtar, E., Erdinc, C., Kumar, A., Eds.; Academic Press: Cambridge, MA, USA, 2022; Chapter 7; pp. 157–183. [Google Scholar] [CrossRef]
  17. Colla, G.; Rouphael, Y.; Canaguier, R.; Svecova, E.; Cardarelli, M. Biostimulant action of a plant-derived protein hydrolysate produced through enzymatic hydrolysis. Front. Plant Sci. 2014, 5, 448. [Google Scholar] [CrossRef] [PubMed] [Green Version]
  18. Sestili, F.; Rouphael, Y.; Cardarelli, M.; Pucci, A.; Bonini, P.; Canaguier, R.; Colla, G. Protein Hydrolysate Stimulates Growth in Tomato Coupled With N-Dependent Gene Expression Involved in N Assimilation. Front. Plant Sci. 2018, 9, 1233. [Google Scholar] [CrossRef] [Green Version]
  19. Colla, G.; Hoagland, L.; Ruzzi, M.; Cardarelli, M.; Bonini, P.; Canaguier, R.; Rouphael, Y. Biostimulant Action of Protein Hydrolysates: Unraveling Their Effects on Plant Physiology and Microbiome. Front. Plant Sci. 2017, 8, 2202. [Google Scholar] [CrossRef] [Green Version]
  20. Ceccarelli, A.; Miras-Moreno, B.; Buffagni, V.; Senizza, B.; Pii, Y.; Cardarelli, M.; Rouphael, Y.; Colla, G.; Lucini, L. Foliar Application of Different Vegetal-Derived Protein Hydrolysates Distinctively Modulates Tomato Root Development and Metabolism. Plants 2021, 10, 326. [Google Scholar] [CrossRef] [PubMed]
  21. Rouphael, Y.; Colla, G.; Giordano, M.; El-Nakhel, C.; Kyriacou, M.; De Pascale, S. Foliar applications of a legume-derived protein hydrolysate elicit dose-dependent increases of growth, leaf mineral composition, yield and fruit quality in two greenhouse tomato cultivars. Sci. Hortic. 2017, 226, 353–360. [Google Scholar] [CrossRef]
  22. Matsumiya, Y.; Kubo, Y.M.A.M. Soybean Peptide: Novel Plant Growth Promoting Peptide from Soybean. In Soybean and Nutrition; El-Shemy, H., Ed.; InTechOpen: London, UK, 2011. [Google Scholar] [CrossRef] [Green Version]
  23. Lachhab, N.; Sanzani, S.M.; Adrian, M.; Chiltz, A.; Balacey, S.; Boselli, M.; Ippolito, A.; Poinssot, B. Soybean and Casein Hydrolysates Induce Grapevine Immune Responses and Resistance against Plasmopara Viticola. Front. Plant Sci. 2014, 5, 716. [Google Scholar] [CrossRef] [Green Version]
  24. Zhao, S.; Fernald, R.D. Comprehensive Algorithm for Quantitative Real-Time Polymerase Chain Reaction. J. Comput. Biol. 2005, 12, 1047–1064. [Google Scholar] [CrossRef]
  25. Vandesompele, J.; De Preter, K.; Pattyn, F.; Poppe, B.; Van Roy, N.; De Paepe, A.; Speleman, F. Accurate normalization of real-time quantitative RT-PCR data by geometric averaging of multiple internal control genes. Genome Biol. 2002, 3, research0034.1. [Google Scholar] [CrossRef] [Green Version]
  26. González-Aguilera, K.L.; Saad, C.F.; Montes, R.A.C.; Alves-Ferreira, M.; De Folter, S. Selection of Reference Genes for Quantitative Real-Time RT-PCR Studies in Tomato Fruit of the Genotype MT-Rg1. Front. Plant Sci. 2016, 7, 1386. [Google Scholar] [CrossRef] [PubMed] [Green Version]
  27. Safaie-Farahani, A.; Taghavi, S. Transcript analysis of some defense genes of tomato in response to host and non-host bacterial pathogens. Mol. Biol. Res. Commun. 2017, 6, 177–183. [Google Scholar] [CrossRef] [PubMed]
  28. Diaz, A.H.; Kovács, I.; Lindermayr, C. Inducible Expression of the De-Novo Designed Antimicrobial Peptide SP1-1 in Tomato Confers Resistance to Xanthomonas campestris pv. vesicatoria. PLoS ONE 2016, 11, e0164097. [Google Scholar] [CrossRef]
  29. Stavridou, E.; Giannakis, I.; Karamichali, I.; Kamou, N.N.; Lagiotis, G.; Madesis, P.; Emmanouil, C.; Kungolos, A.; Nianiou-obeidat, I.; Lagopodi, A.L. Biosolid-amended Soil Enhances Defense Responses in Tomato Based on Metagenomic Profile and Expression of Pathogenesis-related Genes. Plants 2021, 10, 2789. [Google Scholar] [CrossRef]
  30. Isaac, R.A.; Johnson, W.C. Determination of Total Nitrogen in Plant Tissue, Using a Block Digestor. J. AOAC Int. 1976, 59, 98–100. [Google Scholar] [CrossRef]
  31. Analytical Methods for Atomic Absorption Spectroscopy. 1996. Available online: http://www1.lasalle.edu/~prushan/Intrumental%20Analysis_files/AA-Perkin%20Elmer%20guide%20to%20all!.pdf (accessed on 15 June 2022).
  32. Nkonge, C.; Ballance, G.M. A sensitive colorimetric procedure for nitrogen determination in micro-Kjeldahl digests. J. Agric. Food Chem. 1982, 30, 416–420. [Google Scholar] [CrossRef]
  33. Tandon, H.L.S.; Cescas, M.P.; Tyner, E.H. An Acid-Free Vanadate-Molybdate Reagent for the Determination of Total Phosphorus in Soils. Soil Sci. Soc. Am. J. 1968, 32, 48–51. [Google Scholar] [CrossRef]
  34. Reidinger, S.; Ramsey, M.H.; Hartley, S.E. Rapid and accurate analyses of silicon and phosphorus in plants using a portable X-ray fluorescence spectrometer. New Phytol. 2012, 195, 699–706. [Google Scholar] [CrossRef]
  35. Kiba, T.; Krapp, A. Plant Nitrogen Acquisition Under Low Availability: Regulation of Uptake and Root Architecture. Plant Cell Physiol. 2016, 57, 707–714. [Google Scholar] [CrossRef] [Green Version]
  36. Serrani, J.C.; Fos, M.; Atarés, A.; García-Martínez, J.L. Effect of Gibberellin and Auxin on Parthenocarpic Fruit Growth Induction in the cv Micro-Tom of Tomato. J. Plant Growth Regul. 2007, 26, 211–221. [Google Scholar] [CrossRef]
  37. Matsuo, S.; Kikuchi, K.; Fukuda, M.; Honda, I.; Imanishi, S. Roles and regulation of cytokinins in tomato fruit development. J. Exp. Bot. 2012, 63, 5569–5579. [Google Scholar] [CrossRef] [PubMed]
  38. Bartels, S.; Boller, T. Quo vadis, Pep? Plant elicitor peptides at the crossroads of immunity, stress, and development. J. Exp. Bot. 2015, 66, 5183–5193. [Google Scholar] [CrossRef] [PubMed] [Green Version]
  39. Vlot, A.C.; Sales, J.H.; Lenk, M.; Bauer, K.; Brambilla, A.; Sommer, A.; Chen, Y.; Wenig, M.; Nayem, S. Systemic propagation of immunity in plants. New Phytol. 2020, 229, 1234–1250. [Google Scholar] [CrossRef]
Figure 1. (ad) Impact of SPH13 and SPH18 on plant growth parameters (plant diameter and height), chlorophyll content and maximum quantum yield of photosystem II (Fv/Fm). (ad) Growth and photosynthesis-related measurements were performed on Micro Tom plants two weeks after two successive substrate drench treatments with SPH13 or SPH18 at 1 and 10 g L−1 or with water (Ctrl). (a) Shoot diameter and (b) height measurement in cm. (c) SPAD index and (d) Fv/Fm measurements on the third fully expanded leaf from the top (n = 5, one-way ANOVA with post hoc LSD; statistical analysis was performed for each fruit colour separately, p < 0.05, means with the same letter are not significantly different). Tomato seeds were sown on 11 July 2021 for (ad).
Agronomy 12 01761 g001
Figure 2. (ad) Fruits from Micro Tom plants were harvested 9 weeks after two successive treatments (a,b) or 10 weeks after one treatment (c,d) with SPHs and sorted according to their colour. Average fruit number (a,c) and biomass in g (b,d) of the green, yellow, red, and total fruits produced per plant (n = 5, one-way ANOVA with post hoc LSD; statistical analysis was performed for each fruit colour separately, p < 0.05, means with the same letter are not significantly different). The growing cycles started on 11 July 2021 for (a,b) and on 3 February 2022 for (c,d).
Agronomy 12 01761 g002
Figure 3. Impact of the drench application of SPH13 and SPH18 on the expression of PR1 and PR8, two defence-related genes. The total RNAs were extracted from leaf samples taken from Micro Tom plants, 2 days after the treatments with SPH13 and SPH18 at 10 g L−1 or water (Ctrl). RT-qPCR analysis of pathogenesis-related 1 (PR1) and PR8 (n = 3 to 4; one-way ANOVAs and post hoc LSD tests were performed for each gene separately, p < 0.05, means with the same letter are not significantly different). Tomato seeds were sown on 11 July 2021.
Agronomy 12 01761 g003
Figure 4. (a,b) Impact of one SPH drench application on ‘Micro Tom’ plant resistance to Botrytis cinerea. (a) The picture shows B. cinerea induced necrotic lesions on leaves. (b) Average number of necrotic lesions per leaf calculated for each plant by dividing the total number of necrotic lesions by the number of leaves (n = 5, one-way ANOVA with post hoc LSD, p < 0.05, means with the same letter are not significantly different). (a,b) Tomato seeds were sown on 3 February 2022.
Agronomy 12 01761 g004
Figure 5. (ac) Impact of the SPH drench application on M82 tomato plant resistance to Pseudomonas syringae pv. tomato DC3000-LUX (Pst-LUX). Plants were inoculated with Pst-LUX 3 days after treatments with water (Ctrl), SPH13 or SPH18 at 10 g L−1. Measurements were taken six days later. (a) SPAD index and (b) Fv/Fm measurements on the fourth leaf taken from the bottom of the plants (n = 6). (c) The number of necrotic spots was counted on each plant and reported on a predefined disease severity scale: 1 = 1–10 lesions, 2 = 11–25 lesions, 3 = 26–50 lesions, 4 = 51–75 lesions, 5 = 76–100 lesions, 6 = 101–150 lesions, 7 = 151–200 lesions and 8 = over 200 lesions (n = 6, one-way ANOVA with post hoc LSD, p < 0.05, means with the same letter are not significantly different). (d) Scans of 3 randomly selected leaflets taken from plants treated with water (Ctrl) or SPH18 at 10 g L−1. (e) Bioluminescence imaging of the same leaflets (n = 3). (ae) Tomato seeds were sown on 7 March 2022.
Agronomy 12 01761 g005
Table 1. Primers used for the RT-qPCR analysis.
GenePrimer NamePrimer SequenceReferences
ACTIN2Act2_FwdCATTGTGCTCAGTGGTGGTTC[26]
Act2_RevTCTGCTGGAAGGTGCTAAGTG
TUBULINTub_FwdAACCTCCATTCAGGAGATGTTT[27]
Tub_RevTCTGCTGTAGCATCCTGGTATT
UBIQUITINUBQ_FwdTCGTAAGGAGTGCCCTAATGCTGA[28]
UBQ_RevCAATCGCCTCCAGCCTTGTTGTAA
SANDSAND_FwdTTGCTTGGAGGAACAGACG[26]
SAND_RevGCAAACAGAACCCCTGAATC
PR1PR1_FwdTCTTGTGAGGCCCAAAATTC[29]
PR1_RevATAGTCTGGCCTCTCGGACA
PR8/
CHITINASE 3
PR8_FwdTGCAGGAACATTCACTGGAG[29]
PR8_RevTAACGTTGTGGCATGATGGT
Table 2. Nutrient compositions of SPH13 and SPH18 (n = 2, average ± the standard error).
Treatment
ElementSPH13SPH18Unit
N13.551 (±0.053)18.660 (±0.018)%
P0.213 (±0.004)<0.01%
K0.364 (±0.023)<0.01%
Ca0.025 (±0.004)<0.01%
Mg0.040 (±0.004)<0.01%
S1.204 (±0.003)<0.01%
Cl1.421 (±0.001)0.577 (±0.061)%
Si0.067 (±0.002)0.032 (±0.000)%
Al<0.17<0.17%
Mo5.035 (± 0.055)6.195 (±0.565)mg/Kg
Sr4.405 (± 0.165)2.350 (±0.020)mg/Kg
Rb6.920 (± 0.170)<1mg/Kg
Pb<1<1mg/Kg
Se<2<2mg/Kg
As<2<2mg/Kg
Hg<3<3mg/Kg
Zn<3<3mg/Kg
Cu<9<9mg/Kg
Fe30.920 (±2.250)<26mg/Kg
Mn<17<17mg/Kg
Publisher’s Note: MDPI stays neutral with regard to jurisdictional claims in published maps and institutional affiliations.

