Article

Prediction of Maize Seed Vigor Based on First-Order Difference Characteristics of Hyperspectral Data

1
College of Agriculture and Biology, Zhongkai University of Agriculture and Engineering, Guangzhou 510225, China
2
College of Electromechanical Engineering, Zhongkai University of Agriculture and Engineering, Guangzhou 510225, China
3
College of Automation, Zhongkai University of Agriculture and Engineering, Guangzhou 510225, China
*
Author to whom correspondence should be addressed.
Submission received: 24 June 2022 / Revised: 26 July 2022 / Accepted: 11 August 2022 / Published: 12 August 2022
(This article belongs to the Special Issue Genetics Research and Molecular Breeding of Crops)

Abstract

:
The identification of seed vigor is of great significance to improve the seed germination rate, increase crop yield, and ensure product quality. In this study, based on a hyperspectral data acquisition system and an improved feature extraction algorithm, an identification model of the germination characteristics for corn seeds was constructed. In this research, hyperspectral data acquisition and the standard corn seed germination test for Zhengdan 958 were carried out. By integrating the hyperspectral data in the spectral range of 386.7–1016.7 nm and the first derivative information of the spectral data, the root length prediction for corn seeds was successfully completed. The data regression model and prediction relationship between the spectral characteristics and seedling root length were established by principal component regression, partial least squares, and support vector regression. The first derivative information of the hyperspectral data was obtained by comparing the prediction model results with the original spectral data, which was preprocessed by Savitzky–Golay smoothing, multiplicative scatter correction, standard normal variate, and curve fitting. The results showed that the prediction model based on the first-order differential spectral data showed better performance than the one based on the spectral data obtained by other processing algorithms. By comparing the prediction results using different data characteristics and regression models, it was found that the hyperspectral method can effectively predict the root length of the seed, with the coefficient of determination reaching 0.8319.

1. Introduction

Maize (Zea mays L.) is the third largest grain crop after rice and wheat. It is important for food and animal feed in China. As one of the indispensable raw materials for food, medical and health care, light industry, and chemical industry, the production source of corn seeds affects the development of the whole corn industry chain. However, in the process of seed cultivation, harvest, transportation, and storage, the seed vitality may decline due to the difficulty of controlling environmental conditions, which is a challenge for the corn seed industry.
The complexities of crop genetic regulation and environmental influence make evaluating seed vigor as an indicator of seed quality challenging. Traditional seed vigor evaluation methods are mainly based on seed chemical properties, such as the immunoassay test [1], polymerase chain reaction test [2,3], accelerated aging method, and germination test [4,5]. Although these methods have a high accuracy and reliability, they are generally associated with a high cost, long timeline, high requirements for operators, and irreversible damage to seeds. Therefore, seed vigor can only be tested by sampling, which makes it difficult to test a large number of seeds quickly. In recent years, some non-destructive and rapid seed vigor detection methods have been proposed and have attracted extensive attention, such as the electronic “nose” based on seed chemical characteristics [6,7], the flow rate of the H2O2- and O2-based detection method [8], seed respiration detection method [9], and conductivity measurement [10,11]. However, these methods were mainly based on single physiological and biochemical characteristics of seeds, and do not fully reflect the comprehensive changes and influence of the relationships related to seed vigor.
In recent years, non-destructive testing technologies based on crop appearance and optical characteristics have been examined, such as X-ray diffraction technology [12,13], laser speckle analysis technology [14,15], near-infrared spectroscopy [16,17,18,19,20], hyperspectral imaging technology (HSI) [19,21], and Raman spectroscopy [22,23]. Typically, by combining traditional image information with spectral technology in HSI, the reflection spectral characteristics and spatial structure information characterizing the physical and chemical properties of samples are obtained. The vigor phenotype of seeds is closely related to the composition of their main active substances: oil, sugar, protein, and starch. The changes of the seed vigor characteristics reflect the physiological and biochemical characteristics of seeds. Therefore, HSI has been successfully applied for the prediction of maize seed vigor characteristics [24,25]. For example, in Cui [25], the best spectral characteristic band related to seed vigor was optimized by kernel principal component regression, principal component regression (PCR), and partial least squares regression (PLS). The results showed that the prediction result of the seedling root length based on HSI performed well and the coefficient of determination reached 0.7805.
In Feng (2018), two varieties of maize processed with eight different aging duration times (0, 12, 24, 36, 48, 72, 96, and 120 h) were studied by combining the hyperspectral imaging and chemometrics methods [26]. The seed vigor and seed aging degree of different corn seeds were evaluated. They found that the spectral reflectance was significantly associated with the maize kernel vigor undergoing different accelerated aging times [26]. In Pang (2020), maize seed vigor detection and prediction was proposed by using the spectral and image information of hyperspectral imaging [21]. Four levels of corn seeds were predicted by deep learning, and the identification accuracy of the vitality levels reached 99.96% [21], different vitalities of Quercus variabilis seeds were investigated by the hyperspectral imaging technique and four vitality levels were estimated and forecasted by the artificially accelerated aging non-destructive method [27]. The results indicated that the prediction of seed germination processes in a shorter time was feasible [27]. In Yang (2020), vigor identification of rice seeds harvested in different years was proposed by combining near-infrared hyperspectral imaging technology and deep learning [28]. The highest accuracy of vigor identification, which was 99.5018%, verified the effectiveness of the proposed method [28].
The above non-destructive vigor testing technologies based on HSI mainly focus on the spatial distribution characteristics of spectral data while ignoring the correlation distribution structure of spectral data variables, such as the correlation between spectral data among different bands and the relationship between a band and its corresponding spectral value. Different spectral bands reflect different material characteristics of samples. For example, the spectrum data in the 660 nm band represents the content information of chlorophyll a and the spectrum data in the 640 nm band represents the content information of chlorophyll b. If the correlation characteristics and dynamic trend information between different spectra bands are ignored, the complex spectral distribution characteristics of corn seeds will be lost, resulting in incomplete spectral feature extraction and inaccurate model prediction. To make the model conform to the spectral distribution of samples, Tang (2020) proposed to divide the original average spectrum into multiple disjoint spectral intervals and use the least square algorithm to fit the local spectral curve of each segmented spectral interval [29]. The fitting coefficients of different spectral intervals were applied to characterize the original spectral features of apple samples with different damage degrees. Although the “shape” differences of apple samples under different damage degrees could be obtained by such spectral response curves, this method mainly focused on the fitting coefficient characteristics of the regression curves, and the spectral correlation information and dynamic trend information of different bands could not be characterized. These spectrum-related characteristics may carry important information useful for the prediction of seed vigor. Therefore, comprehensive analyses and research of such characteristics are needed.
The original spectral information of corn seed reflects the spatial distribution of sample data, and its first-order difference reflects the sequence characteristics of the spectral data. In other words, the location characteristics and correlation information of spectral data are both important for spectral feature acquisition. The fusion of these two aspects reflects the distribution and dynamic characteristics of the spectral data. Therefore, to obtain the complex spectral characteristics of seeds, this paper proposes a sample spectral information expression method based on the first-order difference information of spectral data. It was applied to the prediction of seed vigor phenotype. Based on the characteristic correlation between hyperspectral data and seed vigor phenotype and different spectral data distribution, three different regression models were constructed for the prediction of maize seed vigor. To evaluate the accuracy of the models, the germination test was used to determine the root length of seed seedlings as a reference [30]. The prediction accuracy and superiority of different spectral data acquisition methods and regression algorithms were compared, and the effectiveness and feasibility of non-destructive testing of seed vigor were determined.

2. Materials and Methods

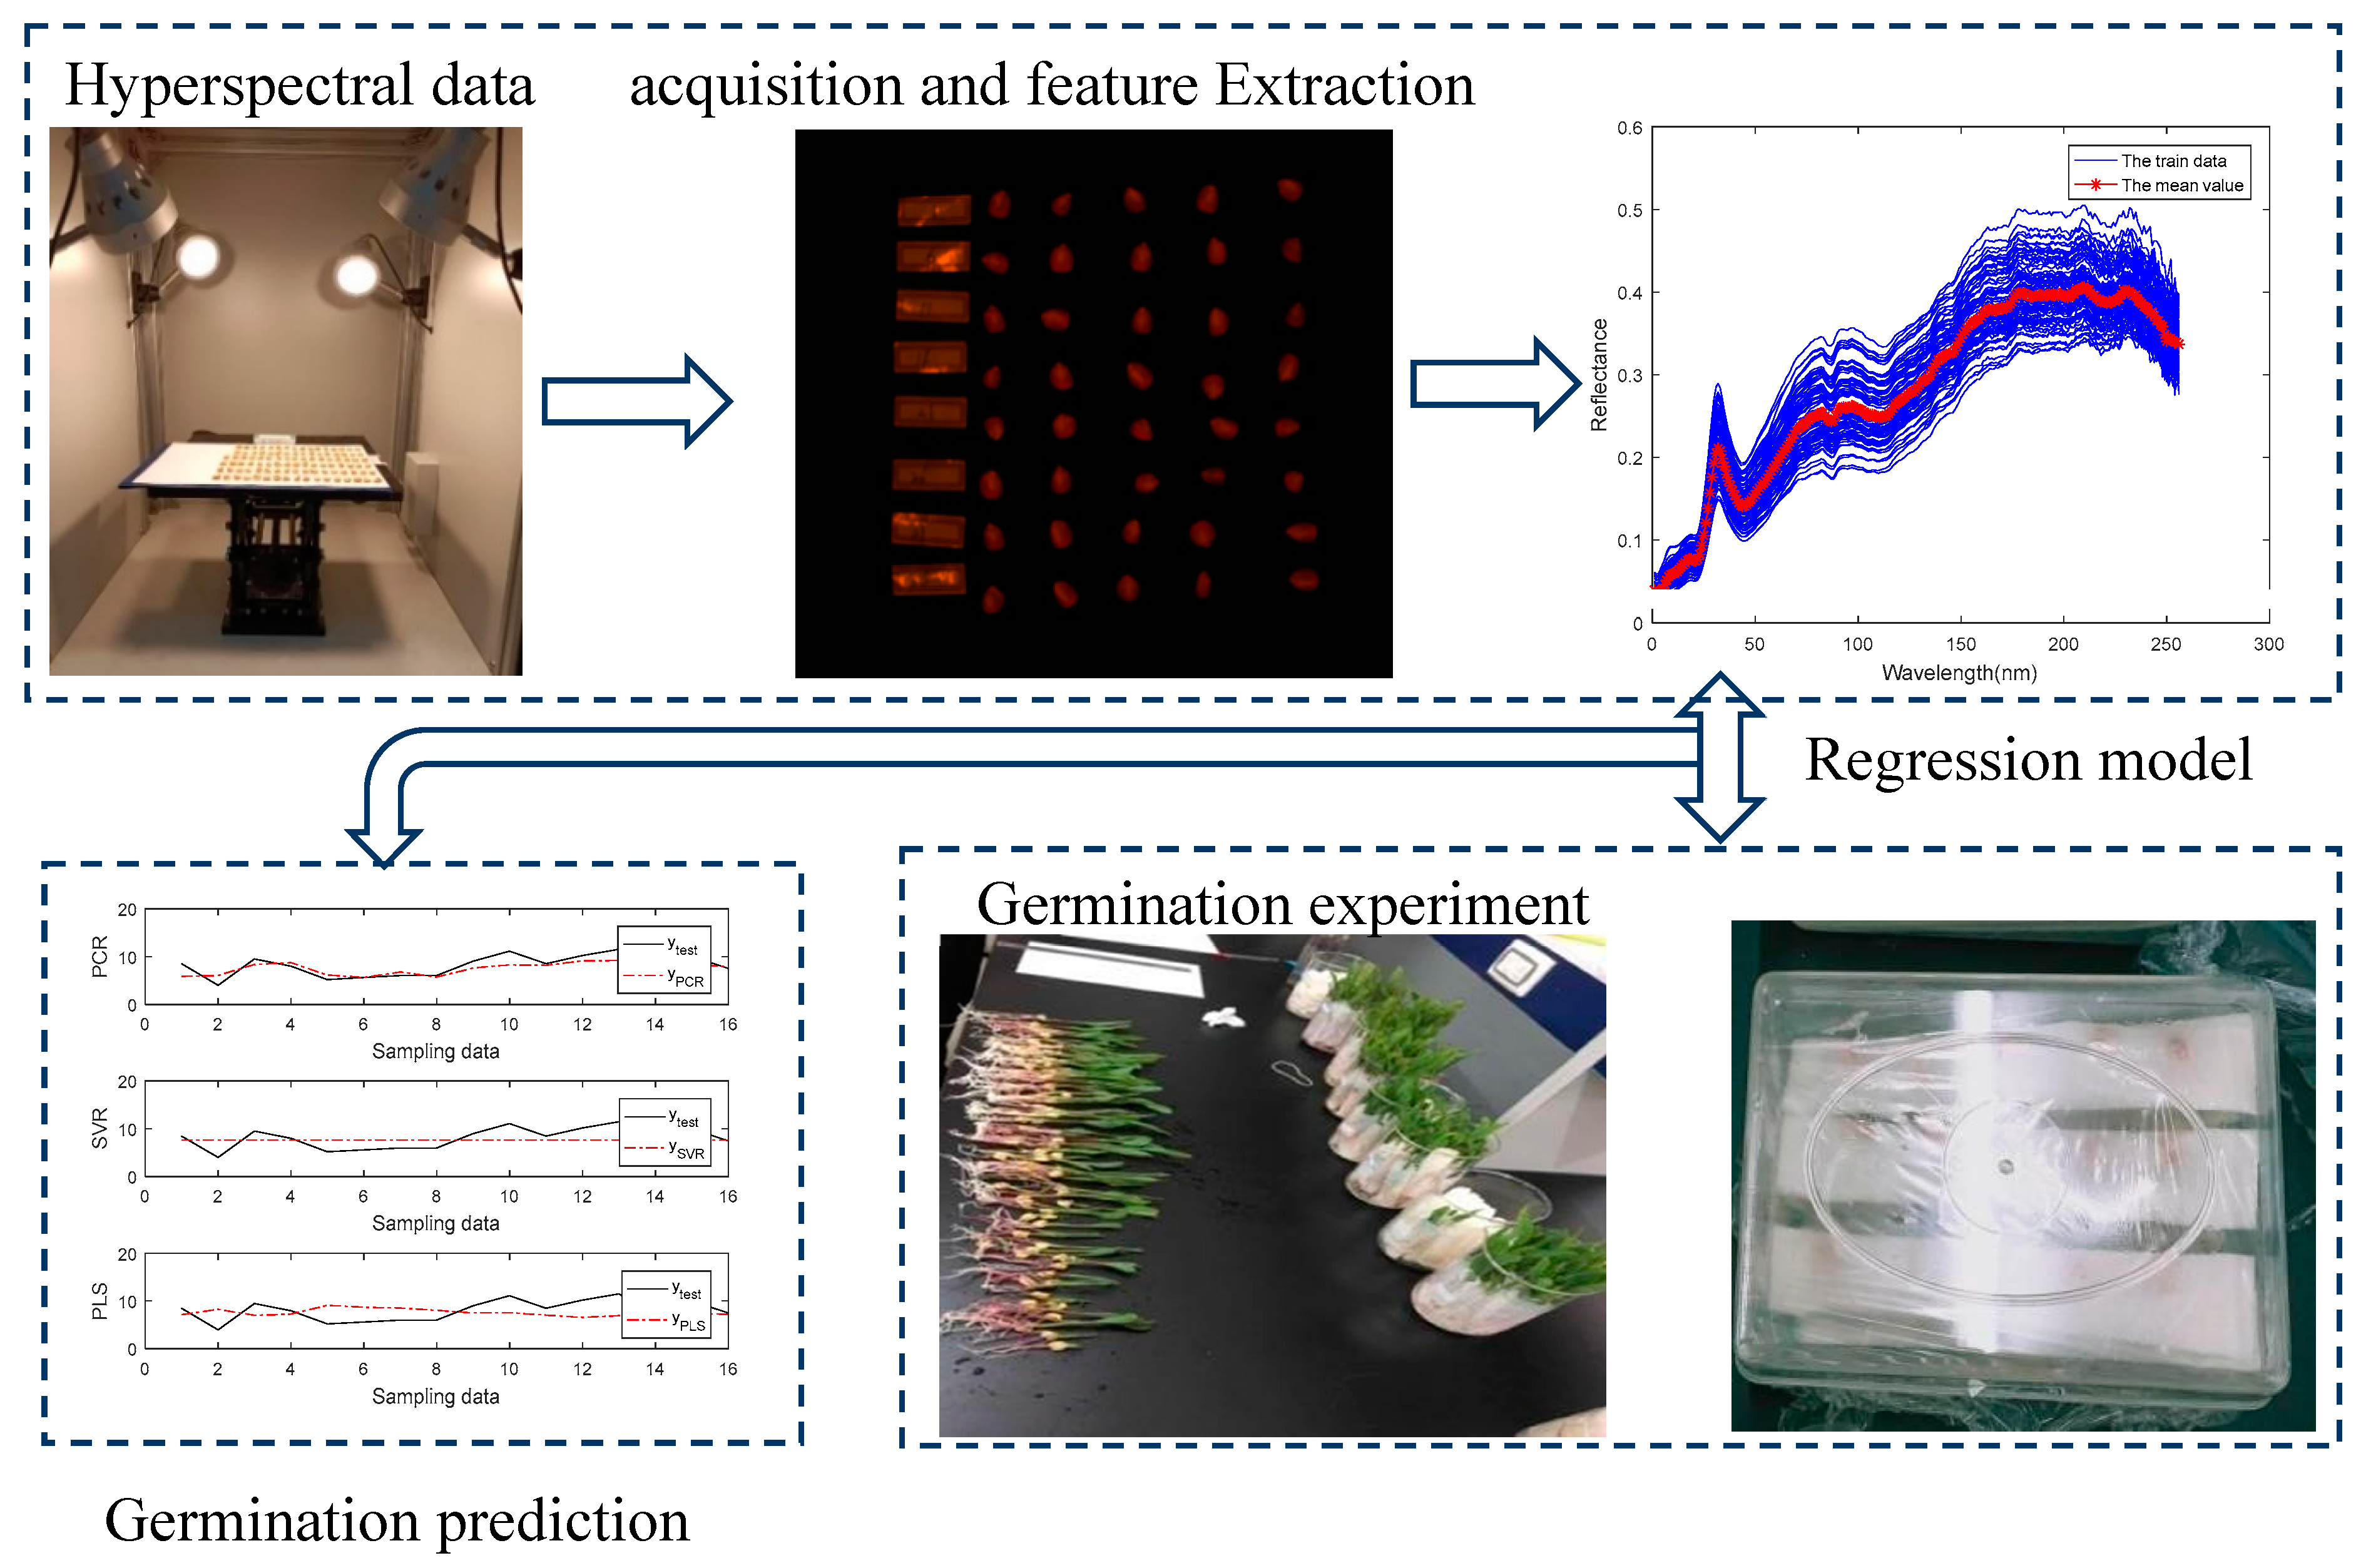
2.1. Sample Preparation and Data Collection

The GaiaSky-mini visible/near-infrared hyperspectral imaging system (Dualix Instruments Co., Ltd., Chengdu, China) with a spectral range of 386.7–1016.7 nm was used. As shown in Figure 1, the hyperspectral data acquisition system is fixed in a rectangular parallelepiped dark box (Sichuan Shuangli Hepu Technology Co., Ltd., HSIA-DB). The dark box includes a CCD camera (CCDSonyICX285, Tokyo, Japan) with a spectral resolution of 3 nm ± 0.5 nm; four halogen tungsten light sources; and a fixed lifting platform at the bottom of the dark box. In this experiment, the lifting platform was set prior so that the distance between the lens and the samples was 50 cm. Based on the hyperspectral imaging control software Spectral-View, the number of spectral bands was set to 256 and the imaging resolution was set as 1388 × 1392 pixels. The exposure time was 35 ms and the camera scan speed was 14 s.
In this paper, Zhengdan 958, a corn variety with a large planting area, is the research focus. The corn seeds were purchased from Beijing Fengming Yashi Seed Company (Beijing, China) and stored in a refrigerator at the temperature 4 °C. Eighty-four corn samples were selected and had their embryonated surfaces evenly placed on the blue gauze. The hyperspectral image data of the corn seeds were collected by keeping the stalks of each seed in the same direction; the position of the seeds for image acquisition is shown in Figure 2. In this experiment, 68 samples were selected as the training set, and the remaining 16 samples were defined as the test data.
The growth status of the seed after germination, especially the seedling root length information obtained after the standard germination experiment, reflects the vigor status of the seed. According to Cui (2020), the hyperspectral characteristics of seeds have a strong relationship to the root length characteristics of seedlings [25]. In this paper, the root length of corn seeds, which can reflect the seed vigor, was studied and predicted by the hyperspectral data acquisition system. First, the hyperspectral characteristics of the seed samples were collected. Then, the standard germination experiment was carried out, and the germination was continuously observed under the same conditions for 7 days. The longest root length of each seed sample was measured and defined as its standard seedling root length. The rang of the root length for the seedling samples in this experiment were among 5.5 cm to 27 cm. Figure 3 shows a schematic overview of the prediction process for corn seed germination, including the hyperspectral data collection, data acquisition of seed germination, regression model construction, and root length prediction.

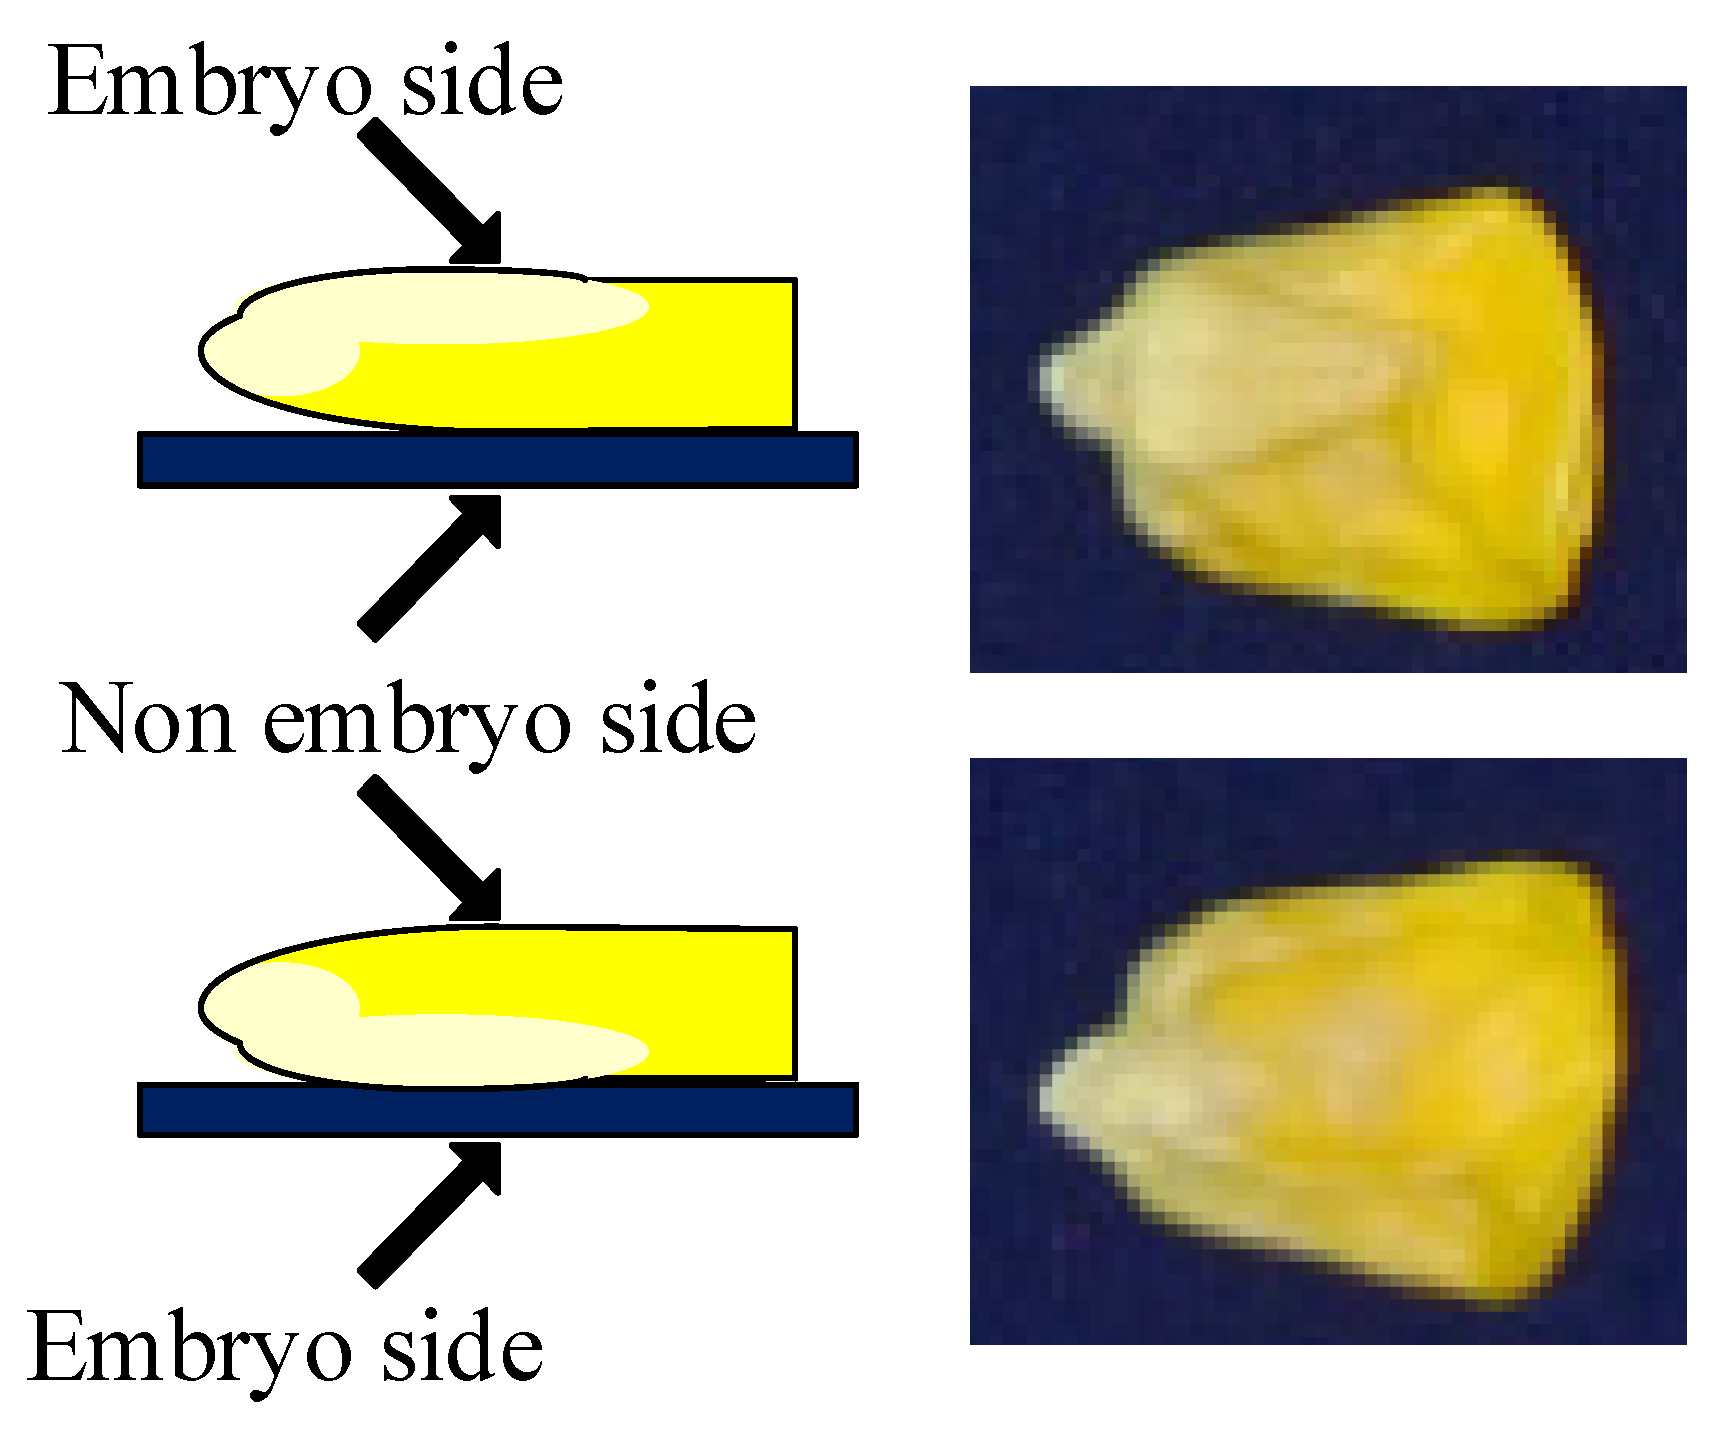
2.2. Region of Interest Extraction

When the hyperspectral images of corn seeds are collected, the spectral signal obtained by the spectrometer not only contains useful information, but also has random errors that may cause noise interference. Therefore, 220 hyperspectral bands from 430.1 nm to 971.5 nm were selected. The embryo part of the seeds was divided into an ellipse to create a region of interest (ROI), and then ENVI 5.1 (ITT Visual Information Solutions, Boulder, CO, USA) was used to extract the average spectral reflectance of the seeds within the ROI.
Black and white correction on the hyperspectral image I 0 was performed to reduce the negative effects of light source fluctuations and dark currents. The PTFE standard white calibration plate with a reflectivity of 99.99%, which was placed at the same height as the sample, was scanned to collect standard white light calibration data W . By covering the lens with a black lens cap, a dark-field standard blackboard image B was collected. According to Equation (1), the spectral data I after black and white correction was calculated [31]:
I = I 0 B W B × 100 %

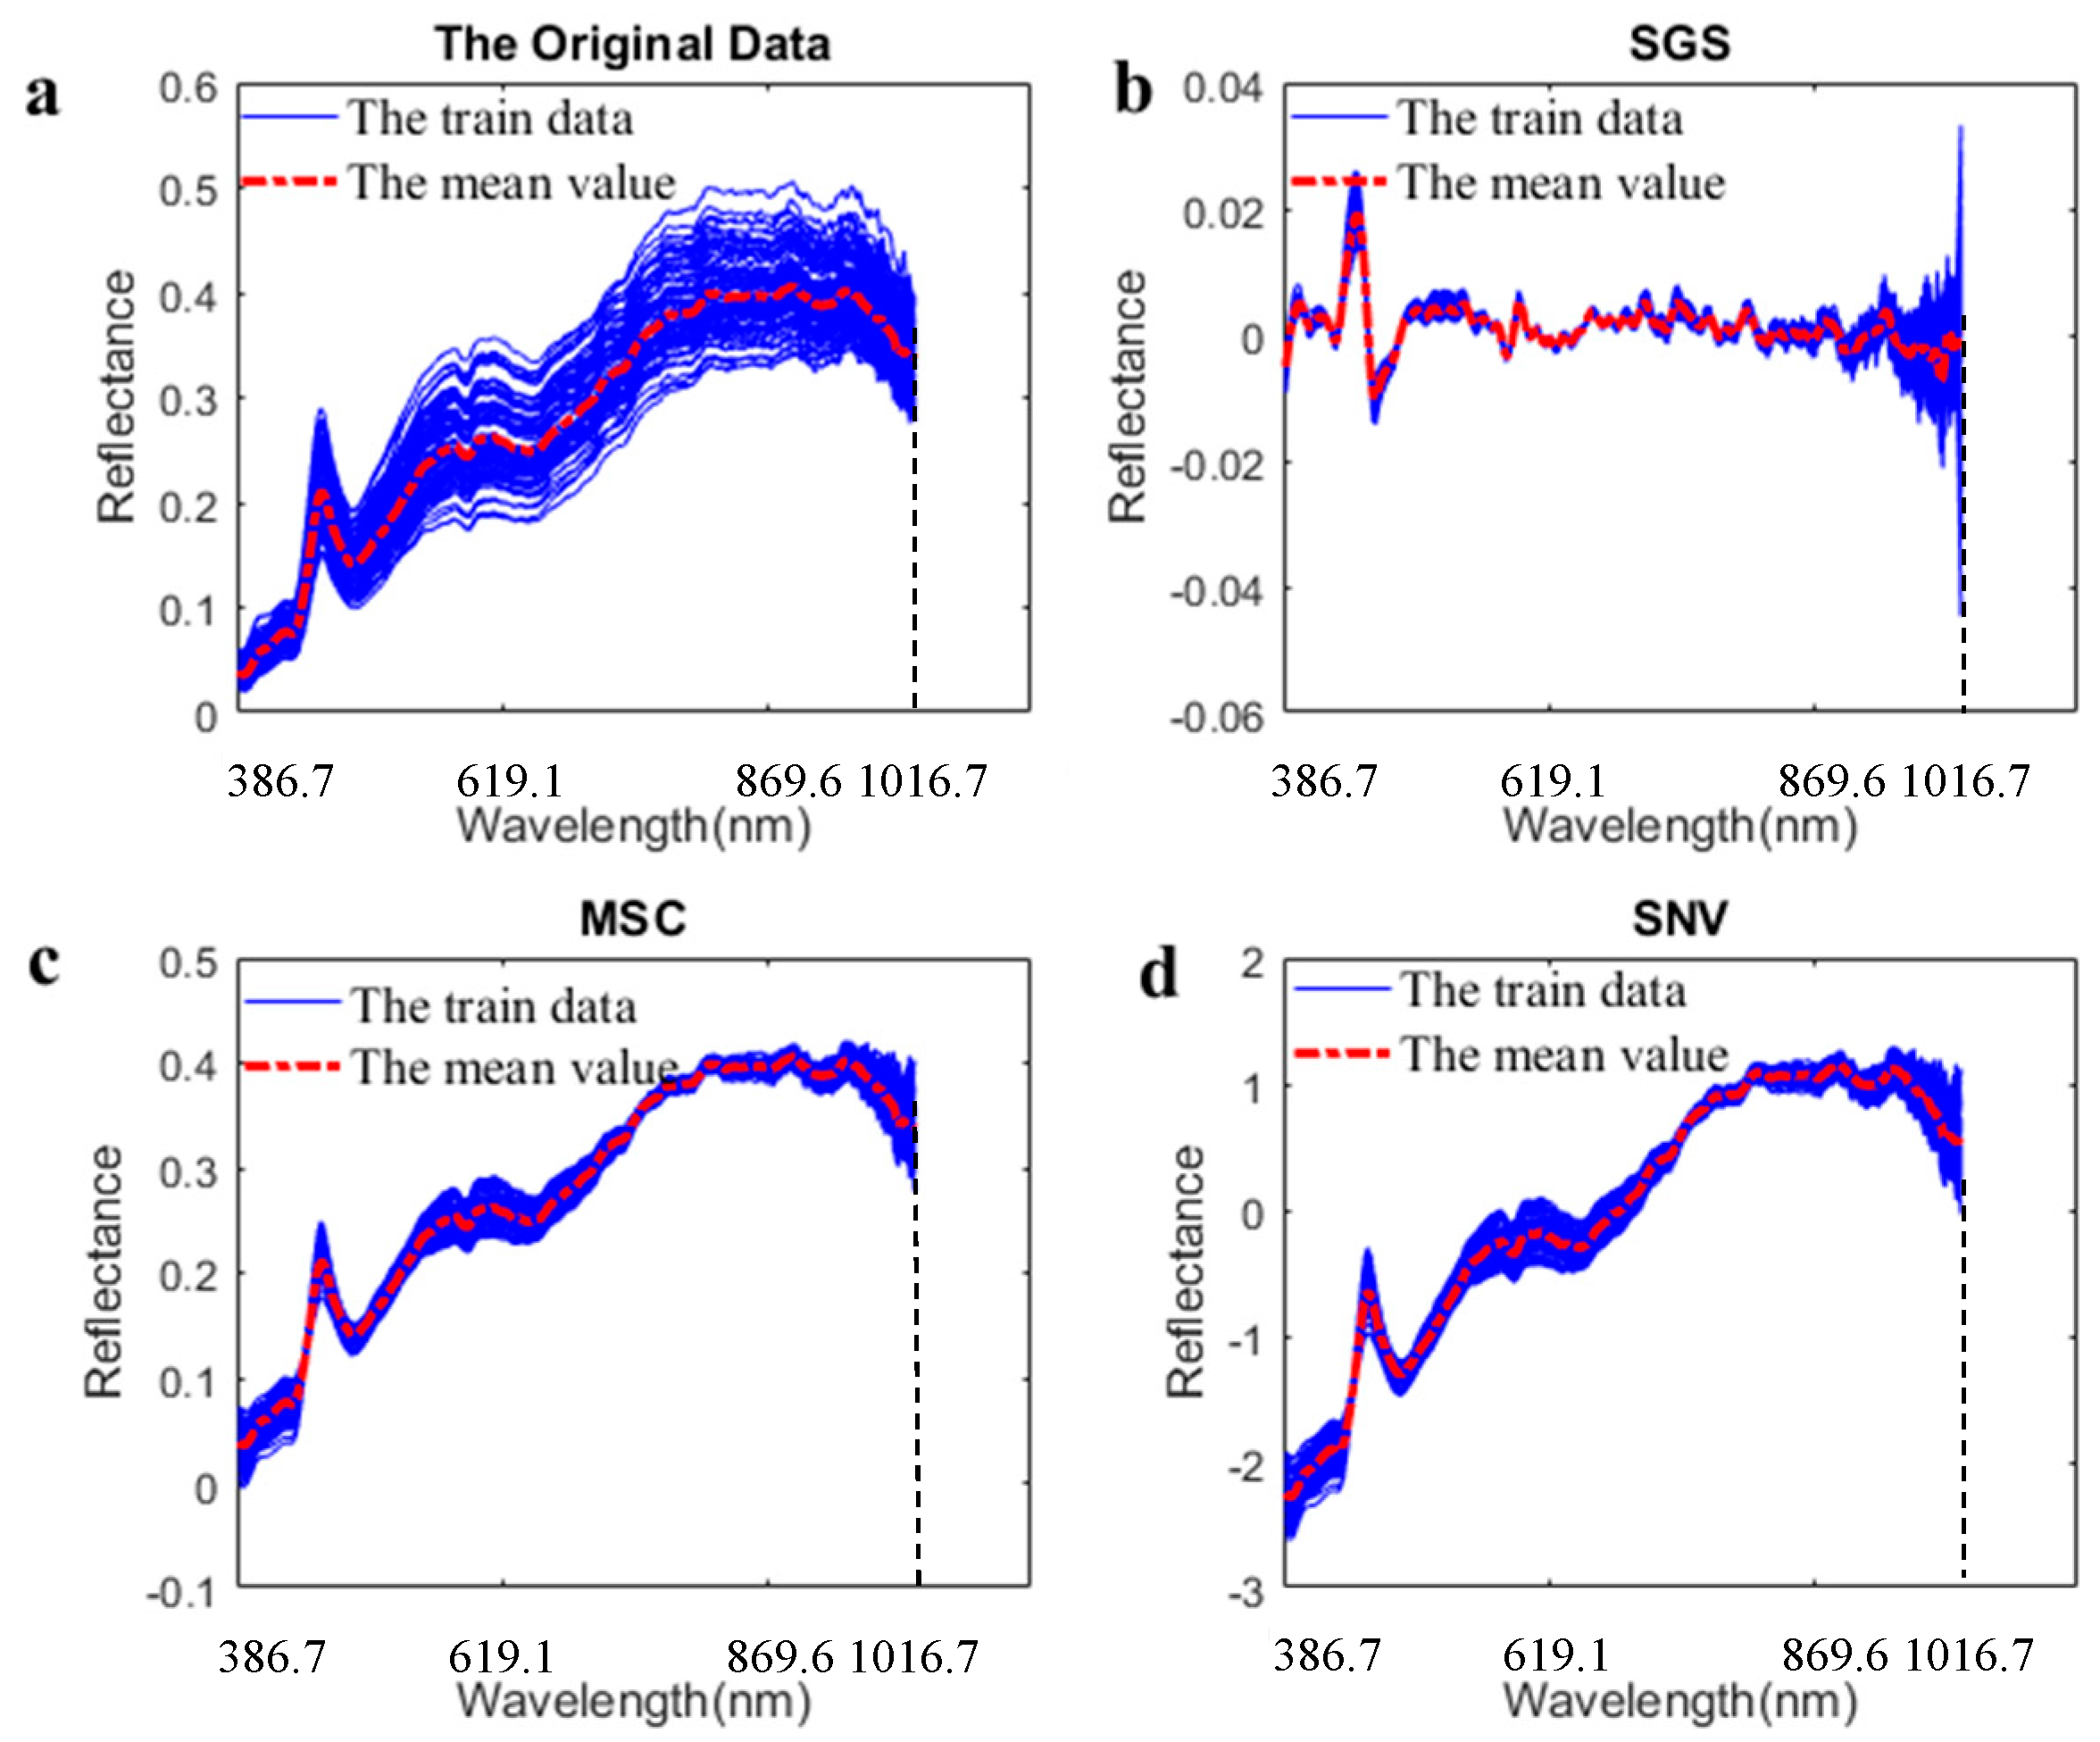
2.3. Data Analysis and Processing Methods

The commonly used hyperspectral data preprocessing methods, such as Savitzky Golay smoothing (SGS), multiplicative scatter correction (MSC), and standard normal variate (SNV), were applied in the experiment for data processing. The prediction performances after the data processing were also compared.
The data trends of the sequence data and the peak points of spectral curves can be observed through the first-order difference of the spectral data sequence. Assume that the original hyperspectral data sequence is yi (1 ≤ in). When the sequence number i changes from k to k + 1, the amount of change of y is defined as:
yk = yk + 1yk
where △yk is the first-order difference of the spectral data at point k, which is defined by the difference between the spectral values at time k + 1 and time k.
To obtain the prediction of seedling root length, the hyperspectral data of corn seeds and the corresponding germination data were used to perform data regression based on the common regression models PCR, PLS, and support vector regression (SVR) [32,33,34,35].
By projecting the hyperspectral data of corn seeds into a low-dimensional space through the PCA algorithm, a PCR-based linear regression model was established between the projection data and the germination data. The algorithm can characterize the data relationship between the hyperspectral data and the germination data while solving the problem of multicollinearity among independent variables in data regression.
In the PLS algorithm, the germination data and the spectral data were projected into a low-dimensional space so that the reduced data could represent the original data as well as possible. In addition, a strong correlation between the germination data and the spectral data was guaranteed.
The goal of the SVR algorithm is to obtain a regression plane so as to have the data characteristics among the germination data and the corresponding spectral data fit the best. An optimized model that minimized the loss and the width of the interval were obtained through the predefined linear function tolerance and slack variables.
MATLAB toolbox was applied for the data processing and model construction.

2.4. Seed Vigor Prediction

Based on the original spectral data and the first-order difference information of the corn seed, the regression relation between the seed spectral characteristics and the corresponding seedling root length was established by the PCR, PLS, and SVR algorithms. Based on these regression models, non-destructive prediction of the root length characteristics of the test samples was performed. Assume that the spectral data of the corn seed for the training data defined in real number matrix X ( x 1 , , x n ) D × n (D is the number of wavelengths for hyperspectral data). The seedling root length characteristic reflects the seed germination characteristics of the seeds. According to the regression accuracy, the model parameters of the PCR, PLS, and SVR algorithm were optimized 10 times by ten-fold cross validation.
The flowchart of the seedling root length prediction model constructed by the regression model is shown in Figure 4.

2.5. Model Evaluation Index

On the basis that the spectral data of training samples and the test samples were normalized under the same standard in the data pre-processing procedure, the coefficient of determination (R2), root mean square error (RMSE), and relative prediction deviation (RPD) were applied to test the performance of the proposed model. Assuming that the true value of the root length variable is y1, y2, …, yn, the R2, RMSE, and RPD can be calculated as follows:
R 2 = 1 i = 1 n ( y i y ^ i ) 2 i = 1 n ( y i y ¯ ) 2
RMSE = i = 1 n ( y i y ^ i ) 2 n 1
where ŷ is the predicted value of the samples by the regression model, y ¯ represents the mean of the actual measured value for the test sample, and n represents the number of test samples. In Formula (3), R2 indicates the correlation between the predicted variable and the actual value. The closer to 1 R2 is, the stronger is the ability for prediction of the model. RMSE is used to measure the quality of model fitting. The smaller the value of RMSE, the closer is the predicted value to the true value and the higher is the prediction accuracy. In Formula (3), SD represents the standard deviation of the test sample.

2.6. Algorithmic Steps

Based on the hyperspectral data characteristics, the seed vigor detection method based on the proposed model was developed. For the D (D = 256) dimensional hyperspectral data with n seed samples X1,…, Xn collected from the spectrum acquisition system, the general procedures of the model regression and root prediction were applied as follows.
(1) The SGS, MSC, and SNV were applied for the hyperspectral data preprocessing;
(2) The curve fitting fit method for data processing was applied;
(3) The first-order difference of the hyperspectral data sequence at point k was defined as △Xk = Xk + 1Xk, and the new data matrix was constructed by all the first-order difference data and the raw hyperspectral data;
(4) Model training and correction were carried out for PCR, PLS, and SVR by the preprocessed data in step (1), step (2), and step (3);
(5) The hyperspectral data for the test seeds was preprocessed by the method in step (1), step (2), and step (3);
(6) Root length prediction was performed and compared based on different processed data and different regression model.

3. Results and Analysis

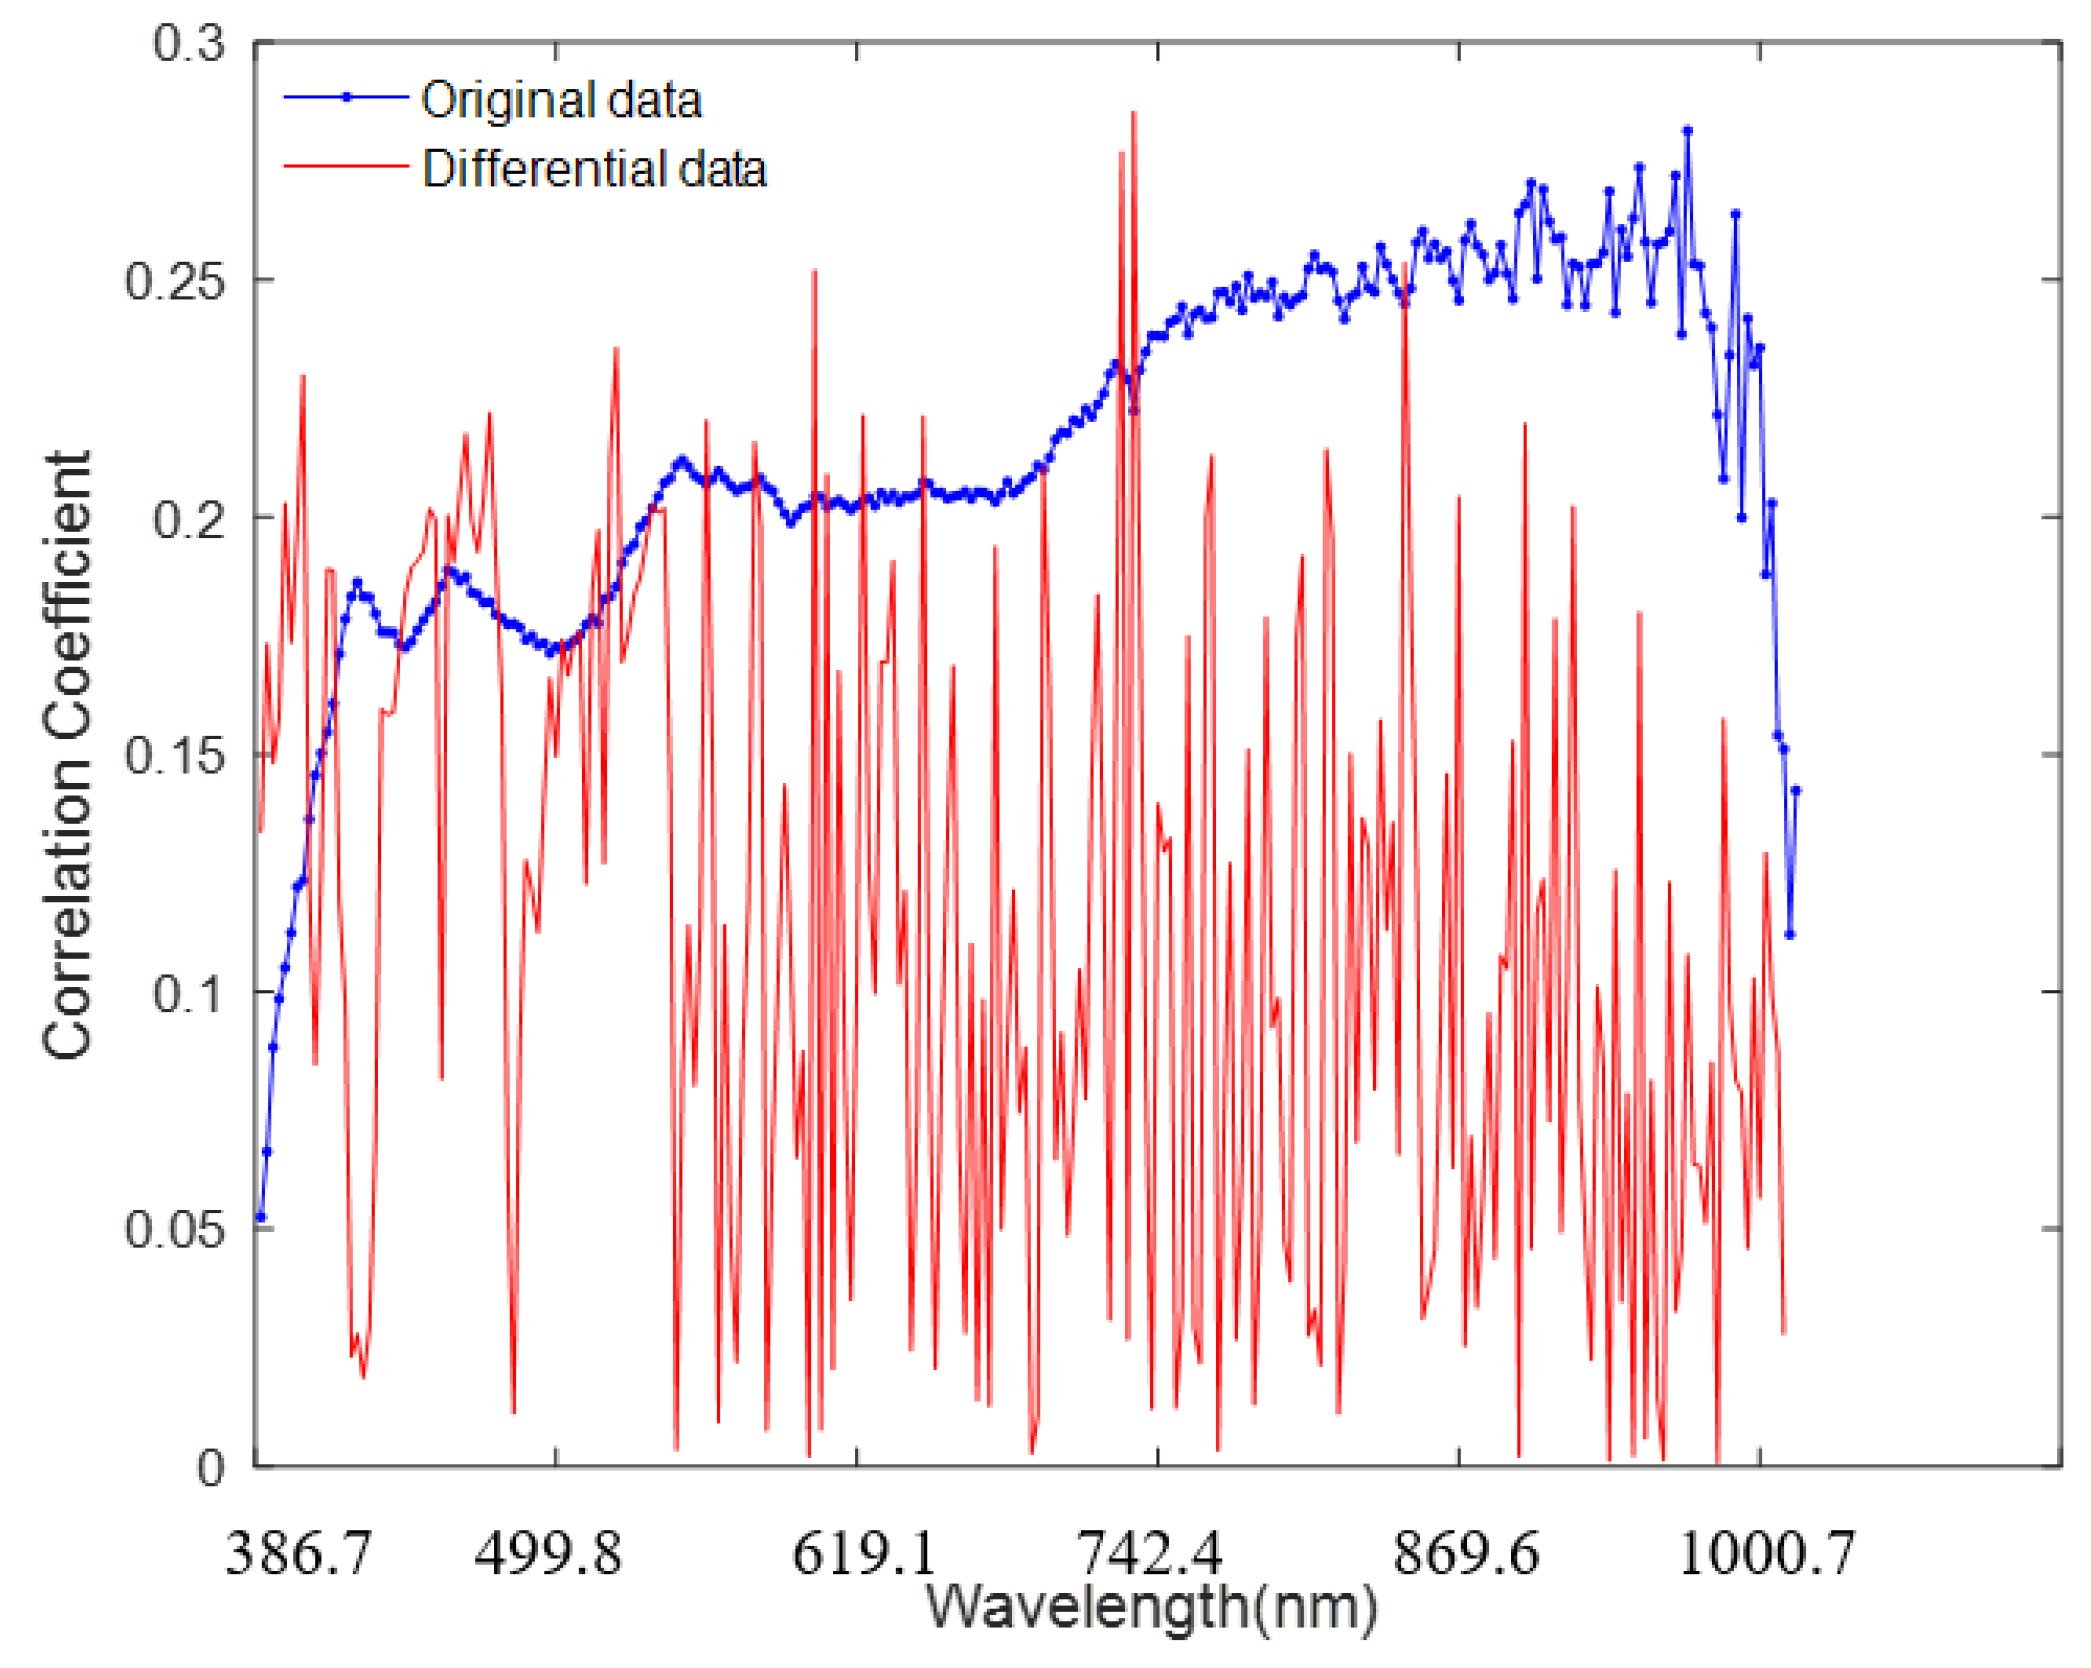
3.1. Hyperspectral Features of Corn Seeds Based on First-Order Difference

Suppose the spectral reflectance data matrix of the corn seed samples collected by the hyperspectral system is X(x1, x2,…, xD)∈ N×D, where x1 is the spectral reflectance of the first band, N is the number of samples, and D Is the number of spectral bands. Figure 5a shows the spectral reflectance and average spectral reflectance of the Zhengdan 958 for the training data in different spectral bands.
Figure 5a shows that when the spectral band changes from range 386.7 nm to 1016.7 nm, the spectral reflectance of the seeds changes discretely and dynamically. Such changes reflect the intrinsic material composition of the seed. For example, the spectral value in the 910 nm band characterizes the protein content in the sample, and the spectral value in the 660 nm band characterizes the chlorophyll a content in the sample. Therefore, the order of the spectral values with different bands cannot be exchanged. That is, when the data processing is performed, it is necessary to retain the characteristics of the dynamic correlation among different spectral bands. Traditional spectral processing methods are mainly based on the static characteristics of different spectral bands and lack the dynamic change characteristics among different bands. In particular, the commonly used hyperspectral data preprocessing methods, SGS, MSC, and SNV, may ignore such dynamic correlation features. The data distribution after data preprocessing by SGS, MSC, and SNV is shown in Figure 5b–d, respectively. It can be seen from the figure that after data preprocessing, the dynamic trend and the change of spectral reflectance among different bands will be destroyed. Thus, the spectral information that reflects the characteristics of seed vigor will be lost. In order to obtain the characteristics of the dynamic changes for the spectral data, a differential operation for the hyperspectral data to obtain the dynamic characteristics was performed. The dynamic trends of the spectral data and the data distribution, especially the extreme points, reflect the composition of the samples. Thus, both aspects of the spectral data should be extracted.
As the difference of the spectral reflectance among the adjacent bands is small, the first-order difference method, which can reflect the small variations of data, was studied to obtain the dynamic sequences of the spectral reflectance. Through the first-order difference of the spectral sequence data, the dynamic change characteristics of the spectral reflectance under different bands were characterized. The changes of the difference data also reflect the location characteristics of the mutation points. For the spectral data sequence x, the first-order difference is specifically defined as follows:
xk = {∆xk1, ∆xk2, …, ∆xki, …, ∆xk255}
where ∆xk(i) = xk(i + 1) − xk (i), (I = 1, 2, …, 256), and ∆xk(i) is the first-order difference of the spectral data for the k-th corn seed in the i-th hyperspectral band. By the first-order difference of the spectral reflectance in the adjacent wavebands, the dynamic changes and correlation characteristics of the spectral reflectance for the corn seeds under different wavebands were reflected.

3.2. Prediction of Root Length of Maize Seedlings Based on Regression Models

To realize the prediction of seed vigor, the spectral data of the corn seed Zhengdan 958 and its corresponding germination information were collected. According to Cui [25], the hyperspectral data of corn seeds is mainly related to the characteristics of seedling root length. Thus, in the standard germination experiment, the germination data of seedling root length were selected to reflect the germination vigor of the seeds. The original spectrum data and the corresponding first-order difference data were both used as the spectral characteristics of the corn seed. To illustrate the influence of the spectrum and its difference information on the root length prediction, Figure 6 shows the correlation coefficients of the spectrum data or the first-order differential spectrum data and the root length of the seedlings in each band.
Figure 6 shows that the correlation coefficients between the spectral data and the seedling root length are different. The larger the correlation coefficient, the closer is the relationship between the spectral data and the germination data. The seedling root length has a strong correlation with the spectral data in the higher waveband, and it has a strong correlation with the first-order difference spectral data in the lower waveband. In other words, the original spectral data and its first-order difference contain different information related to the length of the seedling root. The integration of the two aspects can form the complete spectral information of the whole band. Thus, they can be used for the construction of regression models and predictions of the root length of seedlings.

3.3. Quantitative Prediction of Seedling Root Length

Based on the full-band spectral data of the corn seeds and the corresponding first-order difference data, regression models for the seedling root length prediction were established by the regression algorithms of PCR, PLS, and SVR. For the regression model, the hyperspectral data of the corn seeds were selected as the observation characteristic, and the corresponding root lengths were selected as the output characteristic. The number of components used in PCR and PLS was optimized by cross validation, which were selected as 40 and 45, respectively. Gaussian kernel parameter was also optimized for SVR in the experiments through cross-validation (CV) [36]. The prediction results were compared for the test data under different regression models based on R2 and RMSE. The performance of different data processing methods, such as first-order difference, curve fitting, MSC, SGS, and SNV were also compared to test and verify the efficiency of the proposed method. The prediction results obtained by different process data and regression models are compared in Table 1. It can be seen from the table that the prediction performance based on SVR and PCR models was the best. Especially, considering the spectral data and its first-order difference, the prediction result of seedling root length based on the SVR model showed the best performance, with the regression determination coefficient reaching 0.8319.
This may be because the SVR algorithm is a non-linear regression method based on the kernel method. Therefore, this method can characterize the non-linear relationship between the hyperspectral data of corn seeds and the root length of seedlings. In other words, the non-linear regression model based on the kernel function is suitable for the prediction of the root length. Such results are consistent with those studies [34,35]. MSC, SGS, SNV, and other commonly used spectral data preprocessing methods had poor regression performance. This is because the commonly used preprocessing methods, such as MSC, always needs to correct the baseline shift and offset of spectral data, which may destroy the spatial distribution of the original spectral data. As a result, the correlation between the seed spectral value and the seed germination characteristics was damaged, which may affect the prediction performance of the seed vigor characteristics.
With the PLS and PCR algorithms, the spectral and its first-order differential data fusion-based methods achieved better performance for seedling root length prediction than the corresponding models based on the original spectral data and the first-order differential data. In particular, the PCR model based on spectrum and first-order difference data performed best, with the coefficient of determination reaching 0.8023. In the PLS algorithm, the prediction accuracy obtained based on the original spectral information, spectral difference information, and their fusion features is similar. This may be because the PLS algorithm-based regression model is constructed by the correlation analysis of the process data, and the variable correlation of the first-order difference information, which is computed by the original spectral data, is similar to the original spectral information.
In SGS pretreatment1, the number of points is 7, the polynomial order is 3, the derivative order is 1 (in SGS pretreatment2), the number of points is 3, the polynomial order is 2, and the derivative order is 1.
Table 1 shows that the hyperspectral data of corn seeds have a strong correlation with the seedling root length after seed germination. The effectiveness and feasibility of hyperspectral technology in the prediction of seed germination characteristics, identification of high-quality seeds, and selection and breeding of high-quality seeds were, thus, verified. The results verify the effectiveness of the proposed method for the germination characteristics prediction.

4. Conclusions

Based on regression models such as PCR, SVR, and PLS, the spectral data and its first-order difference were used to establish regression models between corn seedling root length and the spectral data. The prediction of the seedling root length variable was realized. The main conclusions are as follows.
(1) Through the fusion of the spectral data and its first-order difference information for maize seeds, the PCR-, SVR-, and PLS-based algorithms for the root length prediction of seed germination were proposed. Compared with the MSC-, SGS-, and SNV-based data processing methods, the first-order difference based spectral information extraction method can obtain much more accurate prediction results.
(2) There were many differences in the prediction results under different regression models. The SVR model achieved the most satisfactory prediction accuracy, which was higher than that of the PCR and PLS models. Its coefficient of determination was 0.8319.
(3) From the prediction results of the constructed regression model on the seedling root length, it can be seen that the actual root length of the seedling and its corresponding spectral data have a strong correlation, which verifies the feasibility of seed germination prediction based on hyperspectral technology.
Although the hyperspectral-based seed germination prediction proposed in this paper can achieve satisfactory results, it has some limitations. First, the vitality prediction was carried out only through statistical analysis and did not explore the characteristic relations among seed germination, seed composition characteristics, and the hyperspectral data. The seed composition information is an important aspect in seed germination, and it should be considered in further research.
Second, the vigor characteristics of only one variety of maize seed were studied, and no verification was performed on multiple varieties. How to use more varieties or samples to compare the effects of different data processing and prediction models and improve the robustness and versatility of these prediction models requires further research. Therefore, it is necessary to further study how to combine the hyperspectral data of different seed varieties to verify and develop feasible non-destructive testing methods for seed germination characteristics.

Author Contributions

Methodology, A.M.; software, H.C. and A.M.; validation, H.C., Y.B., X.Z. and Z.W.; formal analysis, H.C. and L.L.; data curation, X.Z. and Z.W.; writing, H.C., X.Z. and A.M. All authors have read and agreed to the published version of the manuscript.

Funding

This research was funded by the National Science Foundation of China (NSFC) (32102087), the Science and Technology plan of the Applied Basic Research Programs Foundation of Yunnan province (2017FB096), the Natural Science Foundation of Guangdong Province (No. 2021A1515010824), the Regional Joint Funds of the Basic and Applied Basic Research Foundation of Guangdong Province (2019A1515111023), the Yunnan Province Joint Youth Program Foundation of Local Colleges and Universities (2017FH001-116), and the Open Research Project of the State Key Laboratory of Industrial Control Technology, Zhejiang University, China (No. ICT2022B24).

Institutional Review Board Statement

This study did not require ethical approval.

Informed Consent Statement

This study did not involve humans.

Data Availability Statement

This study did not report any data.

Conflicts of Interest

The authors declare no conflict of interest.

References

  1. Casanova, N.; Palmeira-De-Oliveira, A.; Pereira, A.; Crisóstomo, L.; Travassos, B.; Costa, A.M. Cortisol, testosterone and mood state variation during an oficial female football competition. J. Sports Med. Phys. Fit. 2016, 56, 775–781. [Google Scholar]
  2. Clerkx, E.; Vries, B.D.; Ruys, G.J.; Groot, S.; Koornneef, M. Characterization of green seed, an Enhancer of abi3-1 in Arabidopsis That Affects Seed Longevity. Plant Physiol. 2003, 132, 1077–1084. [Google Scholar] [CrossRef]
  3. Izabel, C.S.N.; Edila, V.D.R.V.P.; Viviane, M.D.A.; Heloisa, O.D.S.; Danielle, R.V.; Renzo, G.V.P.; Maria, L.M.D.C. Enzyme activities and gene expression in dry maize seeds and seeds submitted to low germination temperature. Afr. J. Agric. Res. 2016, 11, 3097–3103. [Google Scholar] [CrossRef]
  4. Chen, L.T.; Sun, A.Q.; Yang, M.; Chen, L.L.; Xue-Li, M.A.; Mei-Ling, L.I.; Yin, Y.P. Seed vigor evaluation based on adversity resistance index of wheat seed germination under stress conditions. Chin. J. Appl. Ecol. 2016, 27, 2968–2974. [Google Scholar]
  5. Patin, A.L.; Gutormson, T.J. Evaluating rice (Oryza sativa L.) seed vigor. Seed Technol. 2005, 27, 115–120. [Google Scholar]
  6. Zhang, T.; Sun, Q.; Yang, L.; Yang, L.; Wang, J. Vigor detection of sweet corn seeds by optimal sensor array based on electronic nose. Trans. Chin. Soc. Agric. Eng. 2017, 33, 275–281. [Google Scholar]
  7. Zhang, T.; Zhao, B.; Yang, L.; Wang, J.; Sun, Q. Determination of wheat seeds vigor based on electronic nose. J. China Agric. Univ. 2018, 26, 413–418. [Google Scholar]
  8. Li, J.; Wang, Y.; Pritchard, H.W.; Wang, X. The fluxes of H2O2 and O2 can be used to evaluate seed germination and vigor of Caragana korshinskii. Planta 2014, 239, 1363–1373. [Google Scholar] [CrossRef]
  9. Jia, L.; Qi, H.; Zhao, G.; Hu, W.; Gao, L.; Xu, Q. Design of seed respiration measurement system using virtual instrument. Opto-Electron. Eng. 2019, 46, 190051-1. [Google Scholar]
  10. Kaya, M.D. Conformity of vigor tests to determine the seed quality of safflower (Carthamus tinctorius L.) cultivars. Aust. J. Crop Sci. 2014, 8, 455–459. [Google Scholar]
  11. Fatonah, K.; Suliansyah, I.; Rozen, N. Electrical conductivity for seed vigor test in sorghum (Sorghum bicolor). Cell Biol. Dev. 2017, 1, 6–12. [Google Scholar] [CrossRef]
  12. Ahmed, M.R.; Yasmin, J.; Collins, W.; Cho, B.K. X-ray CT image analysis for morphology of muskmelon seed in relation to germination. Biosyst. Eng. 2018, 175, 183–193. [Google Scholar] [CrossRef]
  13. Gomes, K.B.; Matos, J.M.; Martins, I.S.; Martins, R.D. X-ray test to evaluate the physiological potential of platypodium elegans seeds. Seed Sci. Res. 2016, 9, 29–35. [Google Scholar] [CrossRef]
  14. Sutton, D.B.; Punja, Z.K. Investigating biospeckle laser analysis as a diagnostic method to assess sprouting damage in wheat seeds. Comput. Electron. Agric. 2017, 141, 238–247. [Google Scholar] [CrossRef]
  15. Men, S.; Yan, L.; Qian, H.; Li, N.; Yao, J.P. Laser speckle detection system for seed viability assessment. Appl. Mech. Mater. 2014, 556–562, 3156–3159. [Google Scholar] [CrossRef]
  16. Li, W.; Li, Y.; Li, G.K.; Gao, L.; Chen, M.Z.; Lu, J.G. Seed vigor detection of sweet corn by near infrared spectroscopy under high temperature stress. J. Nucl. Agric. Sci. 2018, 32, 1611–1618. [Google Scholar]
  17. Peng, Y.; Zhao, F.; Li, L.; Xing, Y.; Fang, X. Discrimination of heat-damaged tomato seeds based on near infrared spectroscopy and PCA-SVM method. Trans. Chin. Soc. Agric. Eng. 2018, 34, 159–165. [Google Scholar]
  18. Yang, D.F. Research on Maize Vigor Intelligent Detection Based on Near Infrared Spectroscopy. J. Nucl. Agric. Sci. 2013, 27, 957. [Google Scholar]
  19. Geng, L.G.; Song, C.F.; Wang, L.N.; Xue-Song, A.N.; Sun, J. Non-destructive Identification of Soybean Seed Viability. J. Plant Genet. Resour. 2013, 14, 1208–1212. [Google Scholar]
  20. Yasmin, J.; Raju Ahmed, M.; Lohumi, S.; Wakholi, C.; Kim, M.; Cho, B.K. Classification Method for Viability Screening of Naturally Aged Watermelon Seeds Using FT-NIR Spectroscopy. Sensors 2019, 19, 1190. [Google Scholar] [CrossRef]
  21. Lei, P.; Men, S.; Yan, L.; Xiao, J. Rapid vitality estimation and prediction of corn seeds based on spectra and images using deep learning and hyperspectral imaging techniques. IEEE Access 2020, 8, 123026–123036. [Google Scholar]
  22. Ambrose, A.; Lohumi, S.; Lee, W.H.; Cho, B.-K. Comparative nondestructive measurement of corn seed viability using Fourier transform near-infrared (FT-NIR) and Raman spectroscopy. Sens. Actuators B Chem. 2016, 224, 500–506. [Google Scholar] [CrossRef]
  23. Seo, Y.W.; Ahn, C.K.; Lee, H.; Park, E.; Cho, B.K. Non-Destructive Sorting Techniques for Viable Pepper (Capsicum annuum L.) Seeds Using Fourier Transform Near-Infrared and Raman Spectroscopy. J. Biosyst. Eng. 2016, 41, 51–59. [Google Scholar] [CrossRef]
  24. He, X.; Feng, X.; Sun, D.; Liu, F.; He, Y. Rapid and Nondestructive Measurement of Rice Seed Vitality of Different Years Using Near-Infrared Hyperspectral Imaging. Molecules 2019, 24, 2227. [Google Scholar] [CrossRef]
  25. Cui, H.; Cheng, Z.; Li, P.; Miao, A. Prediction of Sweet Corn Seed Germination Based on Hyperspectral Image Technology and Multivariate Data Regression. Sensors 2020, 20, 4744. [Google Scholar] [CrossRef]
  26. Feng, L.; Zhu, S.; Zhang, C.; Bao, Y.; Feng, X.; He, Y. Identification of maize kernel vigor under different accelerated aging times using hyperspectral imaging. Molecules 2018, 23, 3078. [Google Scholar] [CrossRef]
  27. Pang, L.; Xiao, J.; Ma, J.; Yan, L. Hyperspectral imaging technology to detect the vigor of thermal-damaged Quercus variabilis seeds. J. For. Res. 2021, 32, 9. [Google Scholar] [CrossRef]
  28. Yang, Y.; Chen, J.; He, Y.; Liu, F.; Feng, X.; Zhang, J. Assessment of the vigor of rice seeds by near-infrared hyperspectral imaging combined with transfer learning. RSC Adv. 2020, 10, 44149–44158. [Google Scholar] [CrossRef]
  29. Tang, Y.; Gao, S.; Zhuang, J.; Hou, C.; Luo, S. Apple Bruise Grading Using Piecewise Nonlinear Curve Fitting for Hyperspectral Imaging Data. IEEE Access 2020, 8, 147494–147506. [Google Scholar] [CrossRef]
  30. Zhao, J.; Yang, B.; Li, W.; Sun, S.; Peng, L.; Feng, D.; Li, L.; Di, H.; He, Y.; Wang, Z. A genome-wide association study reveals that the glucosyltransferase OsIAGLU regulates root growth in rice. J. Exp. Bot. 2021, 72, 1119–1134. [Google Scholar] [CrossRef]
  31. Baranowski, P.; Mazurek, W.; Pastuszka-Wo?Niak, J. Supervised classification of bruised apples with respect to the time after bruising on the basis of hyperspectral imaging data. Postharvest Biol. Technol. 2013, 86, 249–258. [Google Scholar] [CrossRef]
  32. Wang, B.; Zhang, J. Principal Component Regression Analysis for lncRNA-Disease Association Prediction Based on Pathological Stage Data. IEEE Access 2021, 9, 20629–20640. [Google Scholar] [CrossRef]
  33. Yan, Y. Application of WOA–SVR in Seed Vigor of High-Voltage Electric Field Treatment on Aged Cotton (Gossypium spp.) Seeds. Agronomy 2021, 12, 88. [Google Scholar]
  34. Rc, A.; Jy, A.; Min, Z.B.; Cf, A.; Wz, A. Short-term hybrid forecasting model of ice storage air-conditioning based on improved SVR. J. Build. Eng. 2022, 50, 104194. [Google Scholar]
  35. Darwiche, M.; Mokhiamar, O. SVR approach for predicting vehicle velocity for comfortable ride while crossing speed humps. Alex. Eng. J. 2021, 61, 6119–6128. [Google Scholar] [CrossRef]
  36. Yamada, M.; Sugiyama, M. Dependence Minimizing Regression with Model Selection for Non-Linear Causal Inference under Non-Gaussian Noise. In Proceedings of the Twenty-Fourth AAAI Conference on Artificial Intelligence, Atlanta, GA, USA, 11–15 July 2010. [Google Scholar]
Figure 1. Hyperspectral imaging system physical map.
Agronomy 12 01899 g001
Figure 2. Position of sweet corn seeds in image acquisition.
Agronomy 12 01899 g002
Figure 3. Process diagram of the maize seed germination prediction analysis.
Agronomy 12 01899 g003
Figure 4. Flowchart of corn seedling root length prediction.
Agronomy 12 01899 g004
Figure 5. Spectral reflectance of seeds of Zhengdan 958. (a) The original data and the data preprocessed by (b) Savitzky-Golay Smoothing, (c) multiplication scatter correction, and (d) standard normal variate.
Agronomy 12 01899 g005
Figure 6. The correlation between the hyperspectral data/first-order difference and the seedling root length.
Agronomy 12 01899 g006
Table 1. Comparison of hyperspectral data and root length prediction for corn seeds.
Regression AlgorithmPLSSVRPCR
MetricsR2RMSER2RMSER2RMSE
Raw data0.79451.38610.72732.24030.40112.2611
Raw data + First difference (FOD)0.74932.83480.83191.84790.80231.5404
First difference (FOD)0.72351.89140.68142.23780.79951.5506
Curve fitting fit0.67321.81990.17992.22380.36662.1851
MSC pretreatment0.54513.42450.02492.26530.35282.2711
SGS pretreatment10.25338.15310.52465.490.55317.3434
SGS pretreatment20.48252.06290.73902.22520.73911.5214
SNV pretreatment0.54593.06220.20402.27700.34582.2807
Publisher’s Note: MDPI stays neutral with regard to jurisdictional claims in published maps and institutional affiliations.

