Article

Integrating Tillage and Mulching Practices as an Avenue to Promote Soil Water Storage, Growth, Production, and Water Productivity of Wheat under Deficit Irrigation in Arid Countries

1
Department of Plant Production, College of Food and Agriculture Sciences, King Saud University, Riyadh 11451, Saudi Arabia
2
Department of Agronomy, Faculty of Agriculture, Suez Canal University, Ismailia 41522, Egypt
3
Precision Agriculture Research Chair (PARC), College of Food and Agriculture Sciences, King Saud University, Riyadh 11451, Saudi Arabia
4
Department of Agricultural Engineering, College of Food and Agriculture Sciences, King Saud University, Riyadh 11451, Saudi Arabia
5
Agricultural Engineering Research Institute (AEnRI), Agricultural Research Centre, Giza 12618, Egypt
6
Science & Technology and Innovation Unit, King Saud University, Riyadh 11451, Saudi Arabia
*
Author to whom correspondence should be addressed.
Submission received: 1 September 2022 / Revised: 13 September 2022 / Accepted: 16 September 2022 / Published: 19 September 2022
(This article belongs to the Special Issue Crop Yield and Quality Response to Cultivation Practices)

Abstract

:
Ensuring food security with limited water resources in arid countries requires urgent development of innovative water-saving strategies. This study aimed to investigate the effects of various tillage and mulching practices on soil water storage (SWS), growth, production, irrigation water use efficiency (IWUE), and water productivity (WP) of wheat under full (FL) and limited (LM) irrigation regimes in a typical arid country. The tillage practices comprised the conventional tillage (CT) and reduced tillage (RT), each with five mulching treatments (MT), including non-mulched (NM), plastic film mulch (PFM), wheat straw mulch (WSM), palm residues mulch (PRM), and a mixture of wheat straw and palm residues at 50/50 ratio (MM). Results showed higher SWS at different measured time points in CT than RT at 20–40 cm, 40–60 cm, and 0–60 cm soil depth under FL regime, and at 40–60 cm under LM regime, while the opposite was observed at 0–20 cm and 20–40 cm soil depth under LM regime. SWS at different soil depths under MT, in most cases, followed the order of PFM > PRM ≈ MM > WSM > NM under FL, and PFM ≈ PRM > MM > WSM > NM under LM regimes. No significant differences were observed for traits related to growth between CT and RT, but RT increased the traits related to yield, IWUE, and WP by 5.9–11.6% than did CT. PFM and PRM or PRM and MM showed the highest values for traits related to growth or yield, IWUE, and WP, respectively. No significant differences in all traits between CT and RT under the FL regime were observed, however, RT increased all traits by 8.0–18.8% than did CT under the LM regime. The yield response factor (Ky) based on plant dry weight (KyPDW) and grain yield (KyGY) under RT was acceptable for four MT, while KyGY under CT was acceptable only for PRM, as the Ky values in these treatments were <1 under the LM regime. The interrelationships of plant dry weight (PDW), grain yield (GY), IWUE, and WP with evapotranspiration (ET), and of WP and IWUE with PDW and GY were best described by a second-order polynomial. SWS measured before irrigation exhibited strong linear relationships with PDW and GY (R2 range 0.57 to 0.92), while they exhibited a second order polynomial and moderate correlation with IWUE and WP (R2 range 0.29 to 0.54). Overall, combining RT with plant residue mulching, particularly using the readily available palm residues in sufficient amount is a feasible and sustainable water-saving strategy for enhancing wheat yield and WP in irrigated arid countries, such as Saudi Arabia.

1. Introduction

Although water is an inexhaustible resource that covers about 71% of earth’s surface, many research experts in the field predict that future political conflicts between countries will arise over freshwater availability. Currently, many of the world’s freshwater sources are being drained much faster than they are replenished naturally. Consequently, water shortage inevitably plagues several regions around the world, particularly in arid and semiarid countries. Water shortage in these countries is further exacerbated by erratic weather, climate change, continuous population growth, and the rising cost of living. As a result, the water shortage in these countries has gained increased attention in the political and scientific forums [1,2]. For instance, governments in Saudi Arabia have issued several regulations restricting the amount of water allocated to the agriculture sector, which consumes approximately 70–80% of the total available freshwater resources. These regulations have included moratoriums on drilling new wells and limiting groundwater pumping to extend the multiyear water allocation policy [2]. Unfortunately, these regulations have reduced the amount of water allocated for field crops as well as the cultivated area under high water-intensive crops, ultimately increasing the gap between production and consumption of several food and forage crops. Consequently, maximizing WP of food crops by optimizing GY per unit of water applied rather than GY per unit area has become the main target for scientists today [1,2]. Implementing suitable and effective agricultural strategies is more urgent in arid and semiarid countries to improve the WP of field crops and ensure adequate local food supply despite limited water resources.
Maximum GY and WP of crops can simultaneously be achieved under either limited irrigation water supplies or soil moisture stress using different agricultural strategies, including applying conservation tillage or RT practices to improve soil physical properties and quality [3]. Such practices can ultimately reduce soil water evaporation (E), increase soil water-holding capacity, increase nutrient use efficiency, and optimize the soil heat status [4,5,6,7]. Covering the soil surface with different organic and inorganic mulch materials can reduce the amount of water lost through E, especially in early and middle crop growing stages [8,9,10,11,12,13]. Modifying planting patterns can ensure collection of light rain water deep into the soil and to concentrate the limited amounts of rainfall and irrigation water within root zone of plants [14,15,16]. Drought tolerance of plant genotypes can be enhanced to ensure their effective adaptation to soil moisture stress [17]. The coupling combinations between irrigation interval and water application rate can be optimized to decrease the amount of water leach beneath the root zone and to increase the amount of available water to plants between two consecutive irrigation events [18,19]. Treatment of water-stressed plants with antitranspirant substances can help reduce the amount of water lost through canopy transpiration (T) [20]. Additionally, osmolytes, phytohormones, micronutrients, and nanofertilizers can be used to maintain turgor pressure, facilitate water uptake, and protect plant cell organelles against drought stress during soil moisture stress [21,22].
The relative importance of the aforementioned agricultural strategies varies, with some being economical, feasible, immediate, and effective for achieving improved GY and WP under soil moisture stress, while besides being expensive, tedious, and labor-consuming, others may require greater efforts over several years to achieve similar results. Additionally, some of the strategies are only effective at improving GY and WP when coupled with other agricultural strategies [23]. In this context, we speculate that the implementation of water conservation agricultural practices, such as mulching and RT could be an essential and economically feasible strategy for maximizing irrigation water use and confronting the negative impacts of deficit irrigation (DI) on growth and production of food crops.
Generally, over 90% of irrigation water is lost through evapotranspiration (ET) [24]. For wheat crop, E usually accounts for 30–60% of total ET in nonmulched soil, and implementing mulching practices can decrease this E value by 55% [25,26]. ET patterns have been shown to be very similar between different field crops, and the early and late growth stages of each crop exhibited the highest and the lowest rates of E, respectively [27,28]. Since T rather than E contribute effectively to the growth and crop production, it is necessary to alter the balance between E and T by reducing E to a minimum and converting the conserved water available to T. This could be one of the most effective ways to simultaneously obtain desirable GY and elevated WP under DI conditions.
Numerous studies show the importance of synthetic mulches, such as plastic film sheets in maintaining the soil moisture and enhancing GY and WP. Such reports might encourage plastic sheets industry and create investment opportunities for this technology in arid and semiarid countries. Previous studies have shown that mulching with plastic sheets significantly improve GY and WP of various field crops, mainly due to its capacity to reduce soil E, increase soil water storage (SWS), increase rainwater harvesting, and suppress weed growth [8,10,13,26,29,30,31,32,33,34]. Due to such benefits, the partial and full plastic film mulching have been shown to improve GY and WP of several field crops by 38.9% and 77.9%, respectively, relative to nonmulched treatments [34]. Plastic film mulch (PFM) has also been shown to improve WP and GY of three field crops, including maize, wheat, and potato by an average of 12.8–68.5% and 12–75.7%, respectively, relative to nonmulched treatment [10].
Interestingly, former studies have reported that the GY and WP of several field crops could considerably increase if DI is integrated with plastic film mulching as a strategy to reduce water loss and maintain GY at desirable level [16,26,35]. Therefore, plastic film mulching is a potentially effective agricultural practice for improving WUE and crop production in arid countries with freshwater shortage, such as Saudi Arabia. However, plastic film mulching have a few drawbacks, such as (1) manual installation or removal of plastic sheets is labor-intensive and time-consuming (2) it cause several negative impacts on the environment quality, soil physical characteristics, and soil fertility due to large amounts of residual plastic film after crop harvesting, which can be up to 72–259 kg ha−1 in long-term mulching farmlands [36,37], and (3) it increases the temperature around the root zone of plants when air temperature is high, resulting in root and leaf senescence, and low GY [7,38]. Consequently, the balance between the benefits and limitations of plastic film mulching has produced inconsistent results on the importance of this technique in improving GY and WP under DI conditions. While plastic film mulching is often shown to enhance GY, a reduction in GY has been reported [29,39]. Such discrepancies could be associated with the differences in factors investigated among studies, such as crops, soils, climatic conditions, agricultural management practices, and the mulching period [29]. Therefore, there is need to further test plastic film mulching technique with different materials, crops, and climatic conditions to maximize their benefits and minimize their drawbacks. Overall, given their numerous advantages, plastic film mulching technique with appropriate disposal strategy could be an effective agriculture practice for improving WP in irrigated farms and arid agroecosystem.
In recent years, direct burning of crop residues in open field to clean the soil, which causes serious environmental pollution, has widely been replaced with using theses residues as mulch to conserve soil water and improve crop production in arid and semiarid regions [40,41,42]. In northern China for example, about 90% of harvested wheat residues are used as mulch [39,43]. The total production of crop residues in the world is estimated at 3.5 to 4.0 billion tons per year, of which 75, 10, 8, 5 and 3% come from cereals, sugar, legumes, tubers, and oil crops, respectively [44]. Similarly, there are about 20 million date palm trees in Saudi Arabia, with each tree generating about 20 kg of dry leaves annually [45], indicating that the country generates approximately 400,000 tons of date palm residues each year. Thus, sufficient amount of palm residues is available in Saudi Arabia and can be used as mulching.
At the global level, several studies have reported that application of crop residue mulch can not only reduce soil E, but also has a number of benefits, including improved soil fertility, soil water adsorption capacity, soil microbial activity, soil chemical properties, soil permeability, and nutrients uptake, as well protection of soil from water erosion, modification soil physical properties, buffering changes in soil temperature, and decreased soil degradation [46,47,48]. For example, Chatterjee et al. [46] reported that application of wheat residue mulch at the rate of 10 ton ha−1 significantly increased the total organic carbon concentration by 14.9% at 0–5 cm soil depth compared to the nonmulched treatment. Das et al. [47] also reported a significant increase in the soil organic carbon stock at 0–30 cm soil depth under maize–wheat cropping system due to crop residue mulch. Moreover, most crop residues contain excellent amounts of macronutrients, for example, a 2.7 ton ha−1 of spring wheat straw contains on average about 28, 4.5, 52, and 6 kg ha−1 of nitrogen (N), phosphorus (P), potassium (K), and sulfur (S), respectively [49]. Similarly, the straws of three main cereal crops (rice, wheat, and maize) were shown to contain 40, 0.8, 0.1 and 1.3% of carbon (C), N, P, and K, respectively [50]. The concentrations of C, N, P, K, Ca, and Mg in leaflets, rachis, and fronds of palm leaf can reach 509.0, 23.3, 1.12, 13.4, 19.9, and 1.63 g kg−1; 487.9, 4.41, 0.24, 17.18, 4.19, and 0.29 g kg−1; and 499.4, 12.36, 0.54, 15.07, 6.38, and 0.71 g kg−1, respectively [51]. In addition to these benefits, crop residues have the ability to reduce soil E, with 100% soil cover with plant residues reducing soil E by about 50% [52], which ultimately enhancing the soil moisture content (SWC), GY, and WP under DI conditions. For example, in a three-year field experiment, wheat straw mulching increased GY and WP of wheat by 13–23% and 24–33%, respectively, compared to no mulching [53]. Wang et al. [25] reported that wheat straw mulching at a rate of 4.5 or 9.0 ton ha−1 improved the growth and yield attributes of wheat compared to nonmulched treatment only under low soil water content, while it did not increase the GY and WP in high precipitation years (>500 mm). These results were later confirmed by Yang et al. [54] who observed that straw mulching was more effective at enhancing the GY and WP in dry climate during growth period than under humid climate during fallow period. A study in an area receiving 305.1 mm of precipitation during the entire spring maize showed that about 106.9 mm water (35.0% of the precipitation) could be stored in the 0–200 cm soil layer in wheat straw mulch (WSM) treatments [55]. Additionally, Zhao et al. [56] also reported that SWC values of WSM treatments were 17.7–75.9% greater than that of nonmulching treatment. However, published literature still show contradictory reports on the impacts of plant residue mulching on soil water content, growth, yield attributes, and WP. For example, although WSM increased the GY of maize, the maize straw mulch caused a marked decrease in the GY of winter wheat by reducing soil temperature during the germination and seedling stages [54,57]. No significant differences in GY and WP between straw mulching and nonmulching treatments in the dry land was observed by Lafond et al. [58], however, straw mulching increased GY and WP under the same conditions in other studies [25,54]. This suggest that adopting the best mulching practices for crop production requires site-specific testing with different crops under different growth and climatic conditions.
Combination of tillage and mulching is another effective water-saving agricultural strategy practiced in several countries around the world. Integration of no tillage or RT with crop residue mulching is considered as an advanced and effective strategy with several benefits, including reduced soil E, improved physical, chemical, and biological proprieties of soil, increased soil moisture, increased soil water infiltration and conservation. The strategy can also coordinate water demand of crop during the entire growing season, decrease accumulated soil temperature, and reduce amount of resources required for crop production. These benefits contribute to improved overall growth, GY, and WP [5,6,7,59,60,61]. Su et al. [62] found that combining no tillage and straw mulching could increase GY and WP of winter wheat in the Loess Plateau of China by 13 and 7.6%, respectively, compared to nonmulched conventional tillage (CT). Additionally, Peng et al. [60] observed that integrating no tillage with straw mulching, no tillage with plastic mulching, and CT with plastic mulching could significantly reduce the soil–leaf water potential gradient by 35, 35 and 48% at 0–10 cm soil depth at the seedling growth stage and by 62, 65 and 46% at the 30–50 cm soil depth during flowering stage of spring wheat, respectively, compared to the nonmulched CT treatments. Moreover, they also reported that the treatments increased GY by 28, 24 and 22%, biological yield by 18, 40 and 36%, and WP by 24, 24 and 26%, respectively, compared to the nonmulched CT treatments. A study on the effects of integrated tillage with mulching practices on SWC, GY, and WP of maize in a dryland farming observed that the average SWS under the integrate treatments (straw mulching, plastic film mulching, and straw–plastic film mulching) were higher than of CT or no tillage without mulching [5]. Additionally, no tillage combined with straw–plastic film mulching or with plastic film mulching increased GY of maize by 36.5 and 34.1%, respectively, while no tillage alone decreased GY by 14.8%, compared to CT alone. However, growth and GY responses to no tillage alone or in combination with mulching particularly straw mulching remain inconsistent [5,63,64]. Some studies have reported that the GY of integrated no tillage with straw mulching were lower than that of no tillage alone as this treatment significantly decreased soil temperature [54]. However, other study observed that no tillage alone could reduce GY by 2.1%, and this decrease could further drop to 1.9% when crop residue mulching was combined with no tillage [63]. These inconsistent results could be due to the fact that the effectiveness of no tillage practices is associated with several factors, including soil and crop types, climatic conditions, irrigation method, and time of no tillage use [63,64]. This suggest that adopting the best integrated tillage and mulching practices for crop production requires site-specific testing with different crops under different growth and climatic conditions.
Considering the aforementioned issues, we speculated that the effectiveness of the integrated tillage and mulching practices for enhancing the SWC, growth, GY, and WP of wheat would potentially be affected by the mulching materials, climatic conditions, crop types, and irrigation regimes water in irrigated areas or regions where these practices are yet to be widely promoted. Consequently, this study was undertaken with the following objectives (1) to investigate the effects of separate and integrated tillage practices and mulching materials on SWS, growth, yield, IWUE, and WP of spring wheat under two irrigation regimes in arid conditions, and (2) to identify the most effective combination between tillage practices and mulching materials for achieving maximum GY and simultaneously elevated IWUE and WP for irrigated spring wheat under arid conditions using Ky, yield–ET relationship, and WUE–yield relationship. The findings of this study could potentially provide a cost-effective agricultural strategy for enhancing wheat production and reducing the required amount of irrigation water for producing food crops in arid countries with limited water resources.

2. Materials and Methods

2.1. Experimental Site and Conditions

Field experiments were conducted during the 2019–2020 and 2020–2021 at the College of Food and Agriculture Sciences, King Saud University Experimental Farm, Saudi Arabia (46°39′30″ E, 24°25′30″ N and 400 m above mean sea level). The experimental site has a typical arid climate with annual precipitation of approximately 30 mm. Average monthly climatic parameters at the experimental site during wheat growing periods of the seasons are shown in Table 1. Soil texture is sandy loam (68.8% sand, 22.1% silt, and 9.1% clay), with soil bulk density at 0–100 cm soil depth averaging 1.38 g cm−3. The initial physiochemical properties of the experimental soil include: pH, 7.85; electrical conductivity, 3.5 dS m−1; organic matter, 0.46%; Walkley–Black C, 0.34%; available N, 45.2 mg kg−1; available P, 7.44 mg kg−1; and available K, 186.9 mg kg−1; and SWC of 18.58% and 7.12% at field capacity (gravimetric) and permanent wilting point, respectively.

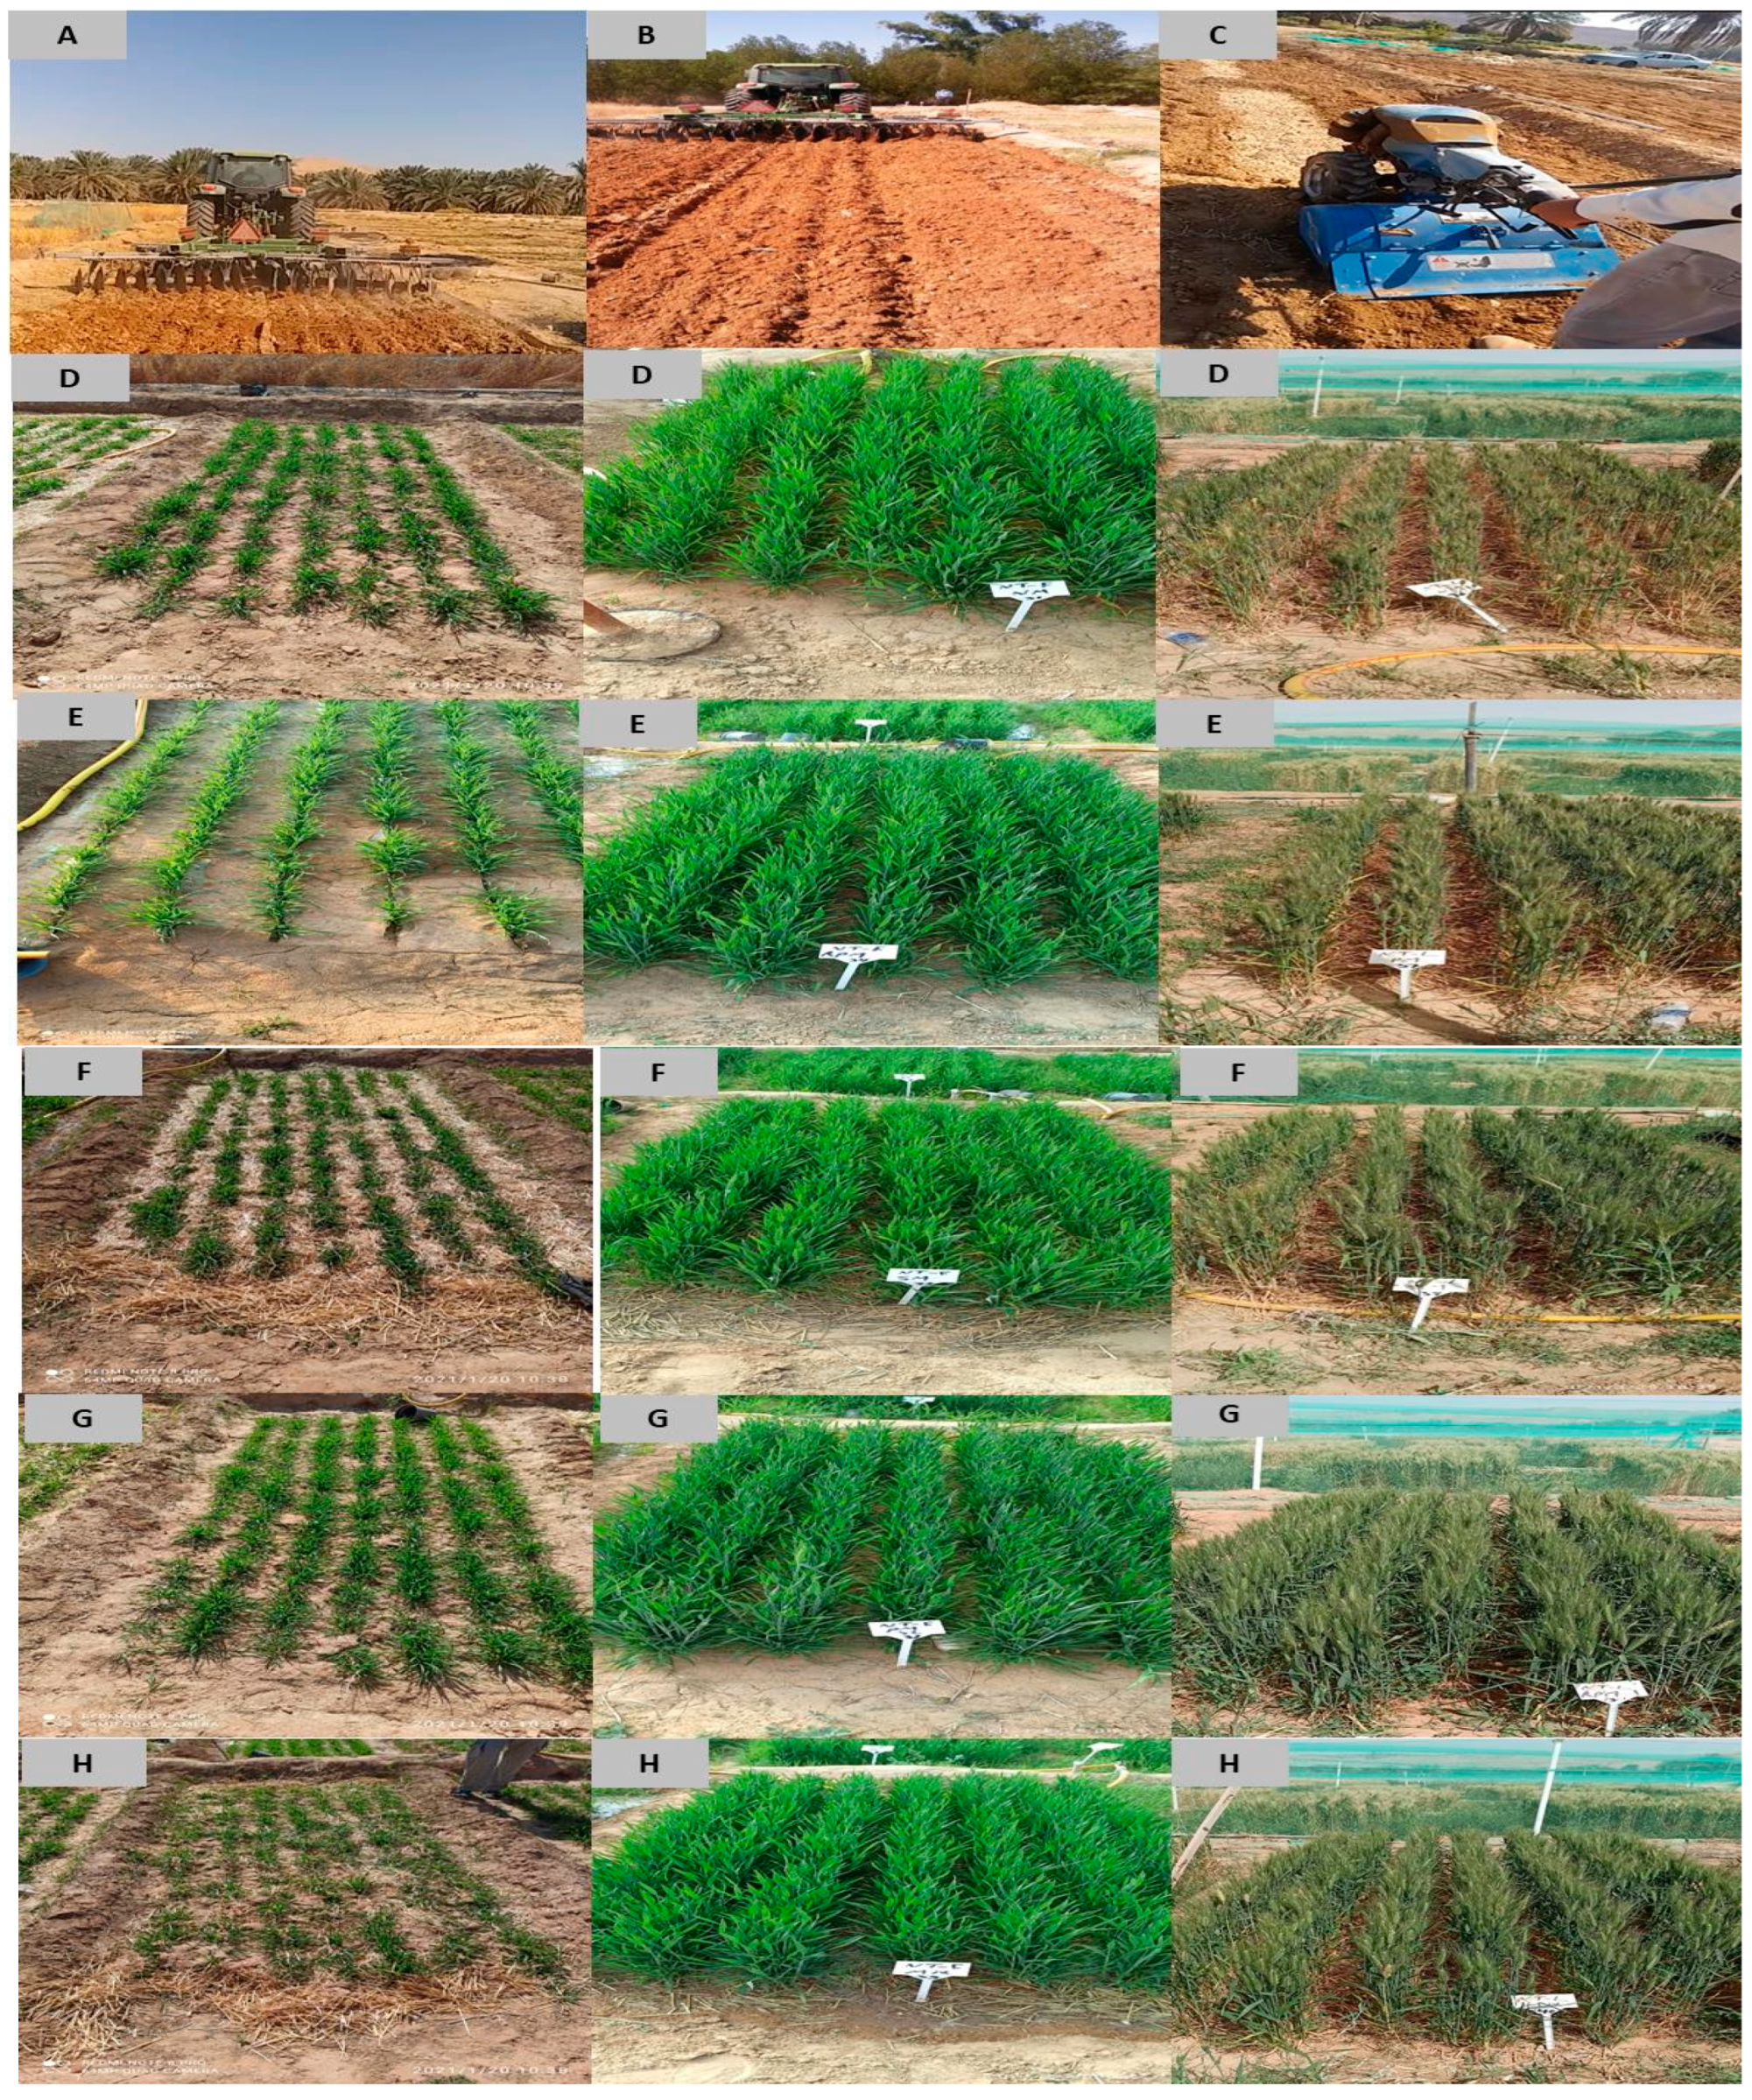
2.2. Treatments, Experimental Design, and Field Management

The treatments in this study comprised of two types of tillage practices as main plot factor (CT and RT), two regimes of irrigation as sub plot factor (1.00 and 0.50 of the estimated crop evapotranspiration; ETc), and five levels of mulching as sub subplot factor, (NM, PFM, WSM, PRM, and MM). The experiment was performed in a randomized complete block design with split–split plot arrangement. Each treatment was carried out in triplicates.
The size of the experimental plot for each individual tillage practice was 168 m2 (42 m × 4 m) each with an in-between 3-m buffer zone. The experimental plot of each tillage practice was divided into two subplots of 21 m × 4 m, each with an in-between 3-m buffer zone; two irrigation regimes were allocated for these subplots. Each subplot was divided into three replicates of 7 m × 4 m size, then each replicate further divided into five sub-subplots of 1.4 m × 4 m, with an in-between 1-m buffer zone between two adjacent sub subplots; these sub-subplots were allocated for mulching treatments (MT).
The CT practice was done by three chisel plowing to a depth of 20–25 cm (Figure 1A) and two 60-cm diameter of narrow disking harrowing to a depth of 15 cm (Figure 1B), while the RT practice was done by perturbing the soil to a depth of 5 cm using a hand rotary cultivator (Figure 1C).
The control treatment (NM) plot containing seven wheat rows with 0.20 m spacing was not mulched during the entire wheat growing seasons (Figure 1D). For PFM, the entire sub-subplot area was manually covered with a 0.12-mm transparent polyethylene film before planting, and seven longitudinal incisions for sow the seeds were made in the plastic film at 20-cm intervals (Figure 1E). For WSM (Figure 1F) and PRM (Figure 1G), air-dried wheat straw and palm leaves were chopped into 5–10 cm and ~0.5 cm pieces, respectively, then evenly distributed over the soil surface between rows at a rate of 6000 kg ha−1 immediately after seedling emergence. For MM (Figure 1H), about ~0.5 cm pieces of palm residues were evenly distributed over the soil surface at a rate of 3000 kg ha−1, and then the 5–10 cm pieces of wheat straw were evenly distributed over the palm residues at a rate of 3000 kg ha−1. Each WSM, PRM, and MM treatment also contained seven wheat rows with a 0.20 m spacing (Figure 1F–H).
The spring wheat cultivar, Summit, was sown at a seeding rate of 150 kg ha−1 in 19 December 2019 and 15 December 2020, and harvested in 28 April 2020 and 22 April 2021. The N, P, and K fertilizers were applied to each treatment at 180, 90, and 60 kg ha−1 in the form of ammonium nitrate (33.5% N), calcium superphosphate (18.5% P2O5), and potassium sulfate (50% K2O), respectively. The entire amount of P and one-third dose of N were applied as basal fertilizers prior to sowing. Plants were refertilized during mid tillering stage with half dose of K and one-third dose of N. The remaining half dose of K and one-third dose of N were applied at the heading growth stage. Weeding was performed manually during the growing period.

2.3. Irrigation Treatments

The amount of irrigation water applied (I) for the full irrigation (FL) regime (1.00 ETc) was estimated using the following equation:
I = E T o × K c
where, E T o is the reference evapotranspiration rate calculated according to the modified Penman–Monteith equation [65] using the different daily meteorological data of the experimental site, such as air temperature, net solar radiation, wind speed, relative humidity, soil heat flux density, psychrometric constant, saturation and actual vapor pressure, and slope of the saturation vapor pressure curve. K c represented the spring wheat crop coefficient values.
The FAO-56 recommended K c values were corrected based on the specific relative humidity and wind speed values at the experimental site. Based on equation 1 above, the estimated cumulative irrigation water for the FL regime was approximately 670.0 mm ha−1. Half of this amount was applied in the limited irrigation (LM) regime (0.50 ETc).
Irrigation water was applied with a low-pressure water transportation surface irrigation system consisting of a main water plastic pipe (76 mm in diameter) for transferring water from the main water source to the sub-subplots. To control the amount of water applied to each sub-subplot; this main line branched off into submain hoses, each equipped with a manual control valve.

2.4. Calculation and Measurement

2.4.1. Evapotranspiration (ET) Estimation

Evapotranspiration (ET, in mm) under different treatments was calculated using the soil water-balance equation as follows [27]:
E T = I + P D ± S W C
where, I represent the amount of irrigation water applied (mm); P is the precipitation (mm) during the growing season; D is the downward drainage out of the root zone (mm), and SWC is the soil water content (mm) at harvest mines SWC at sowing in the 0–100 cm soil layer. Because there is no capillary rise of groundwater to the root zone and no surface runoff, the values of both parameters were considered to be zero and omitted in the above equation. SWC was measured using gravimetric method (oven dry basis).

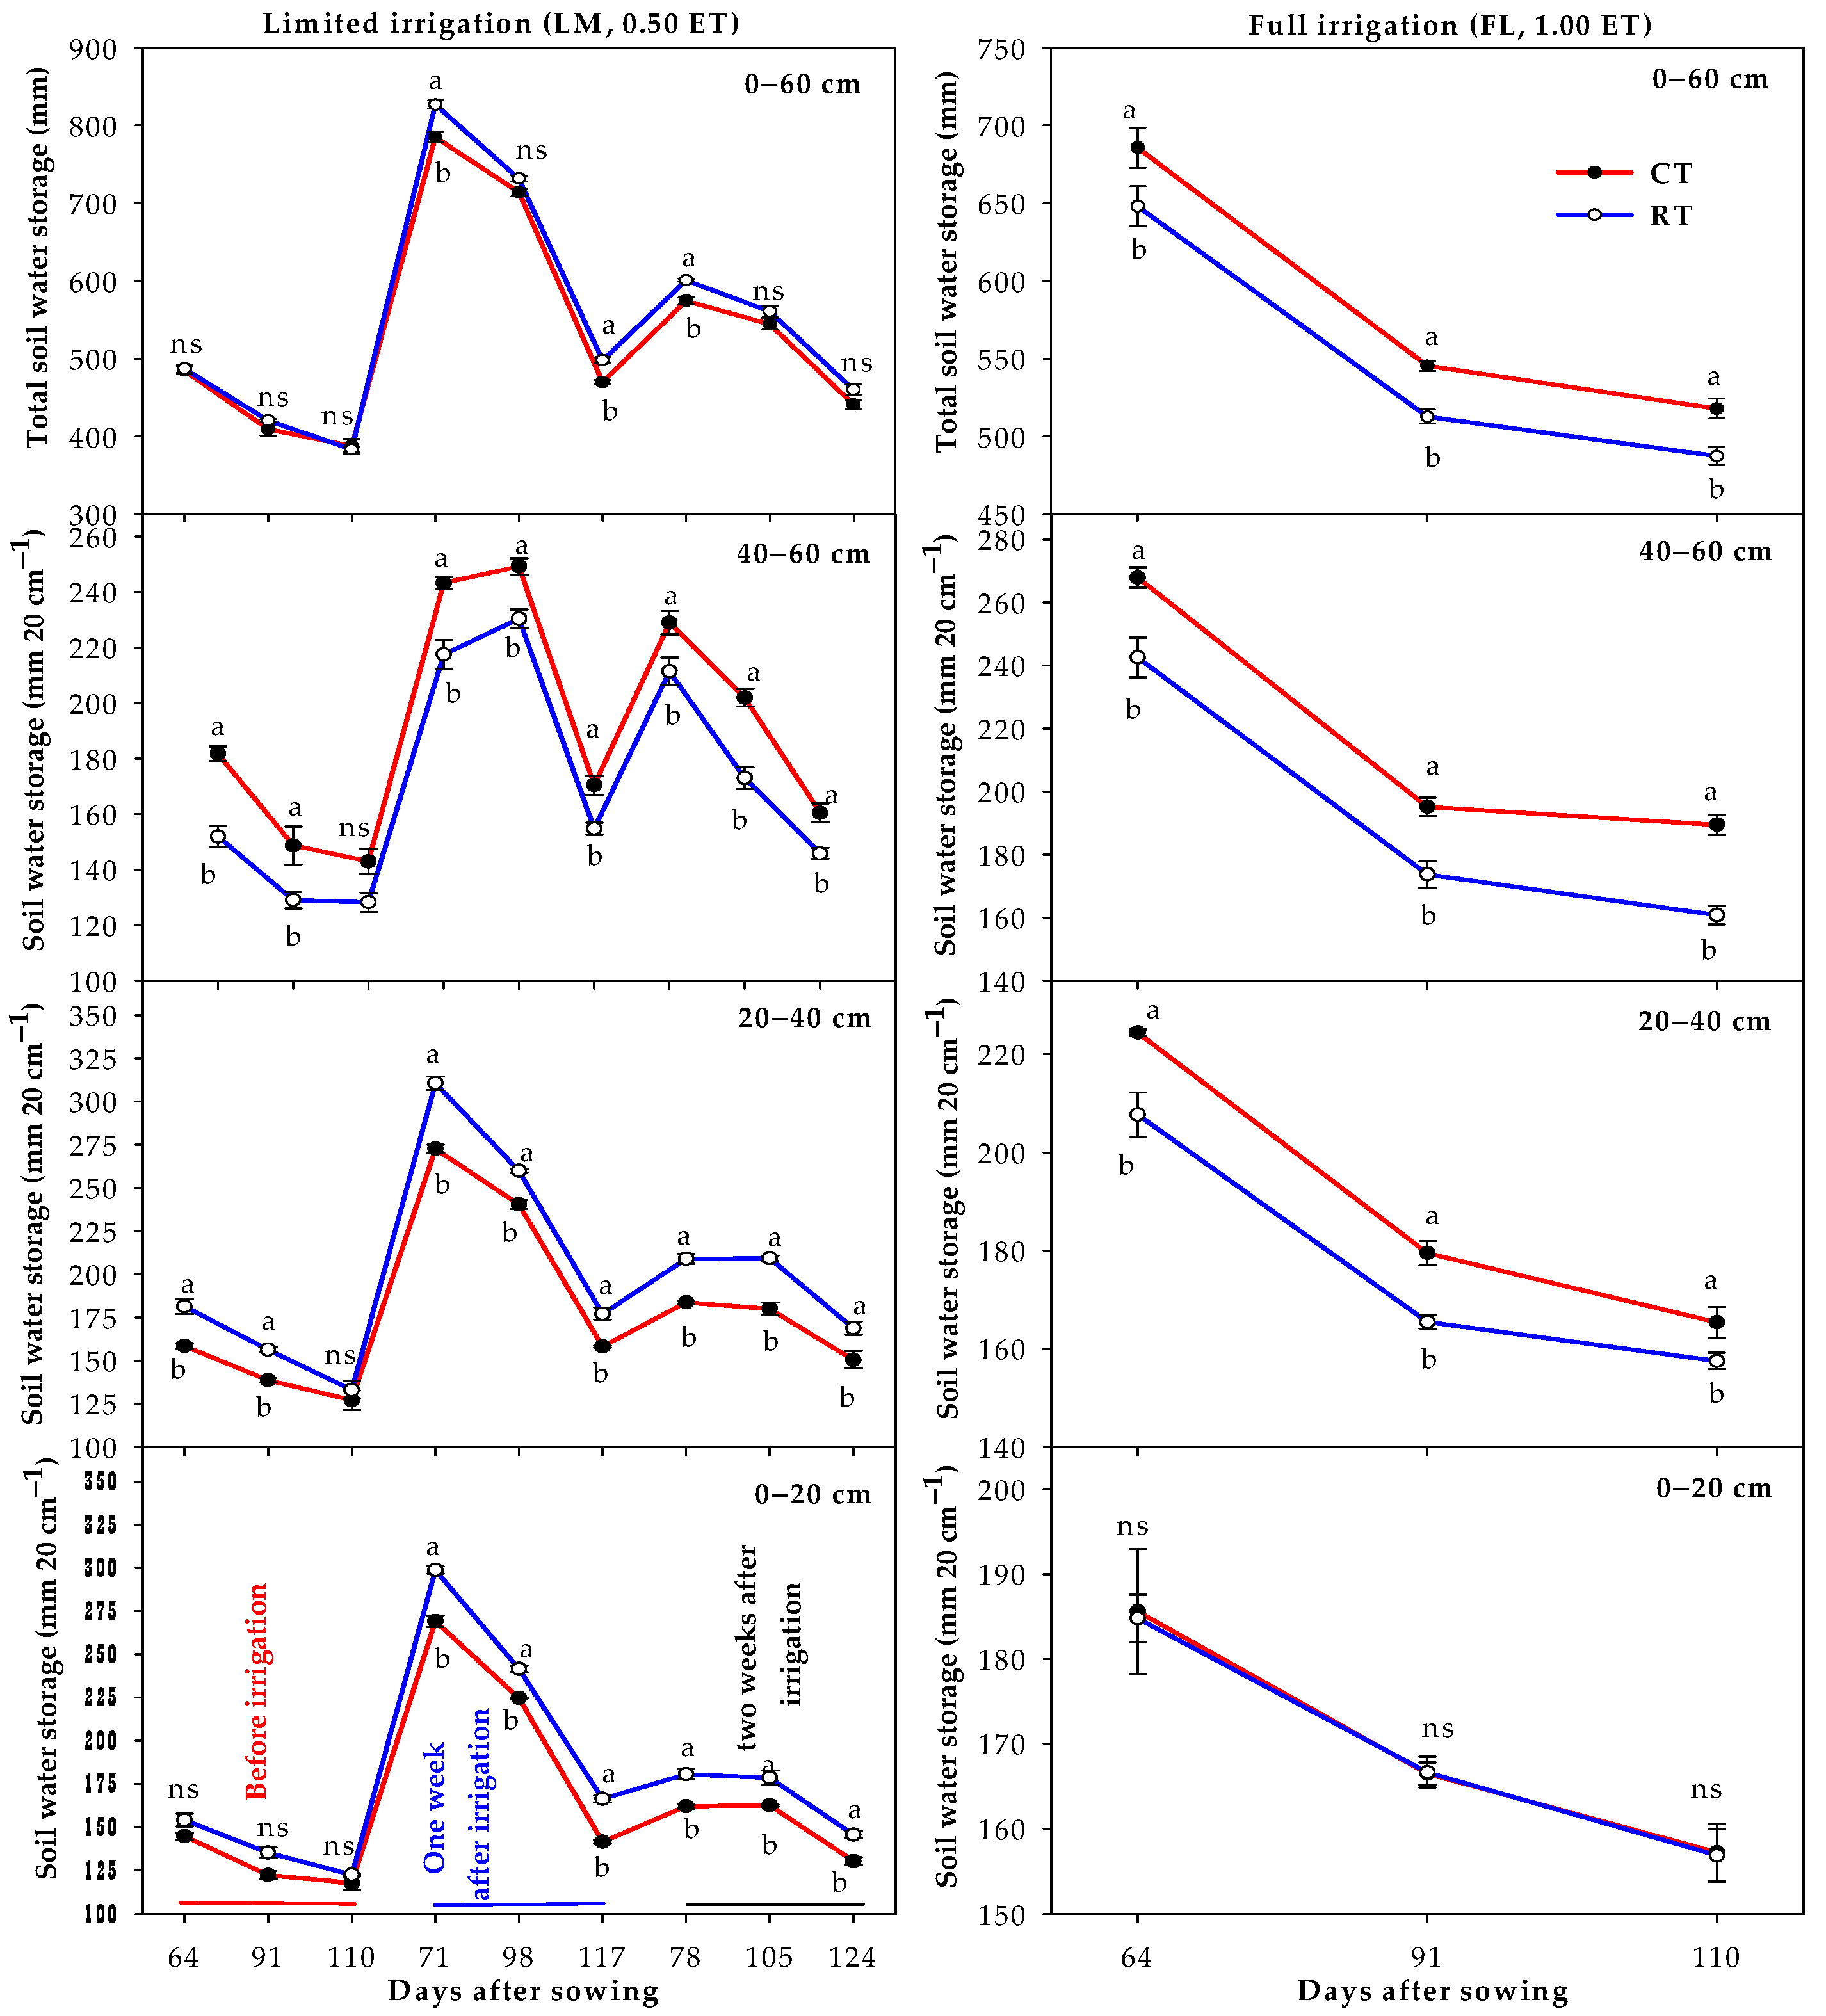
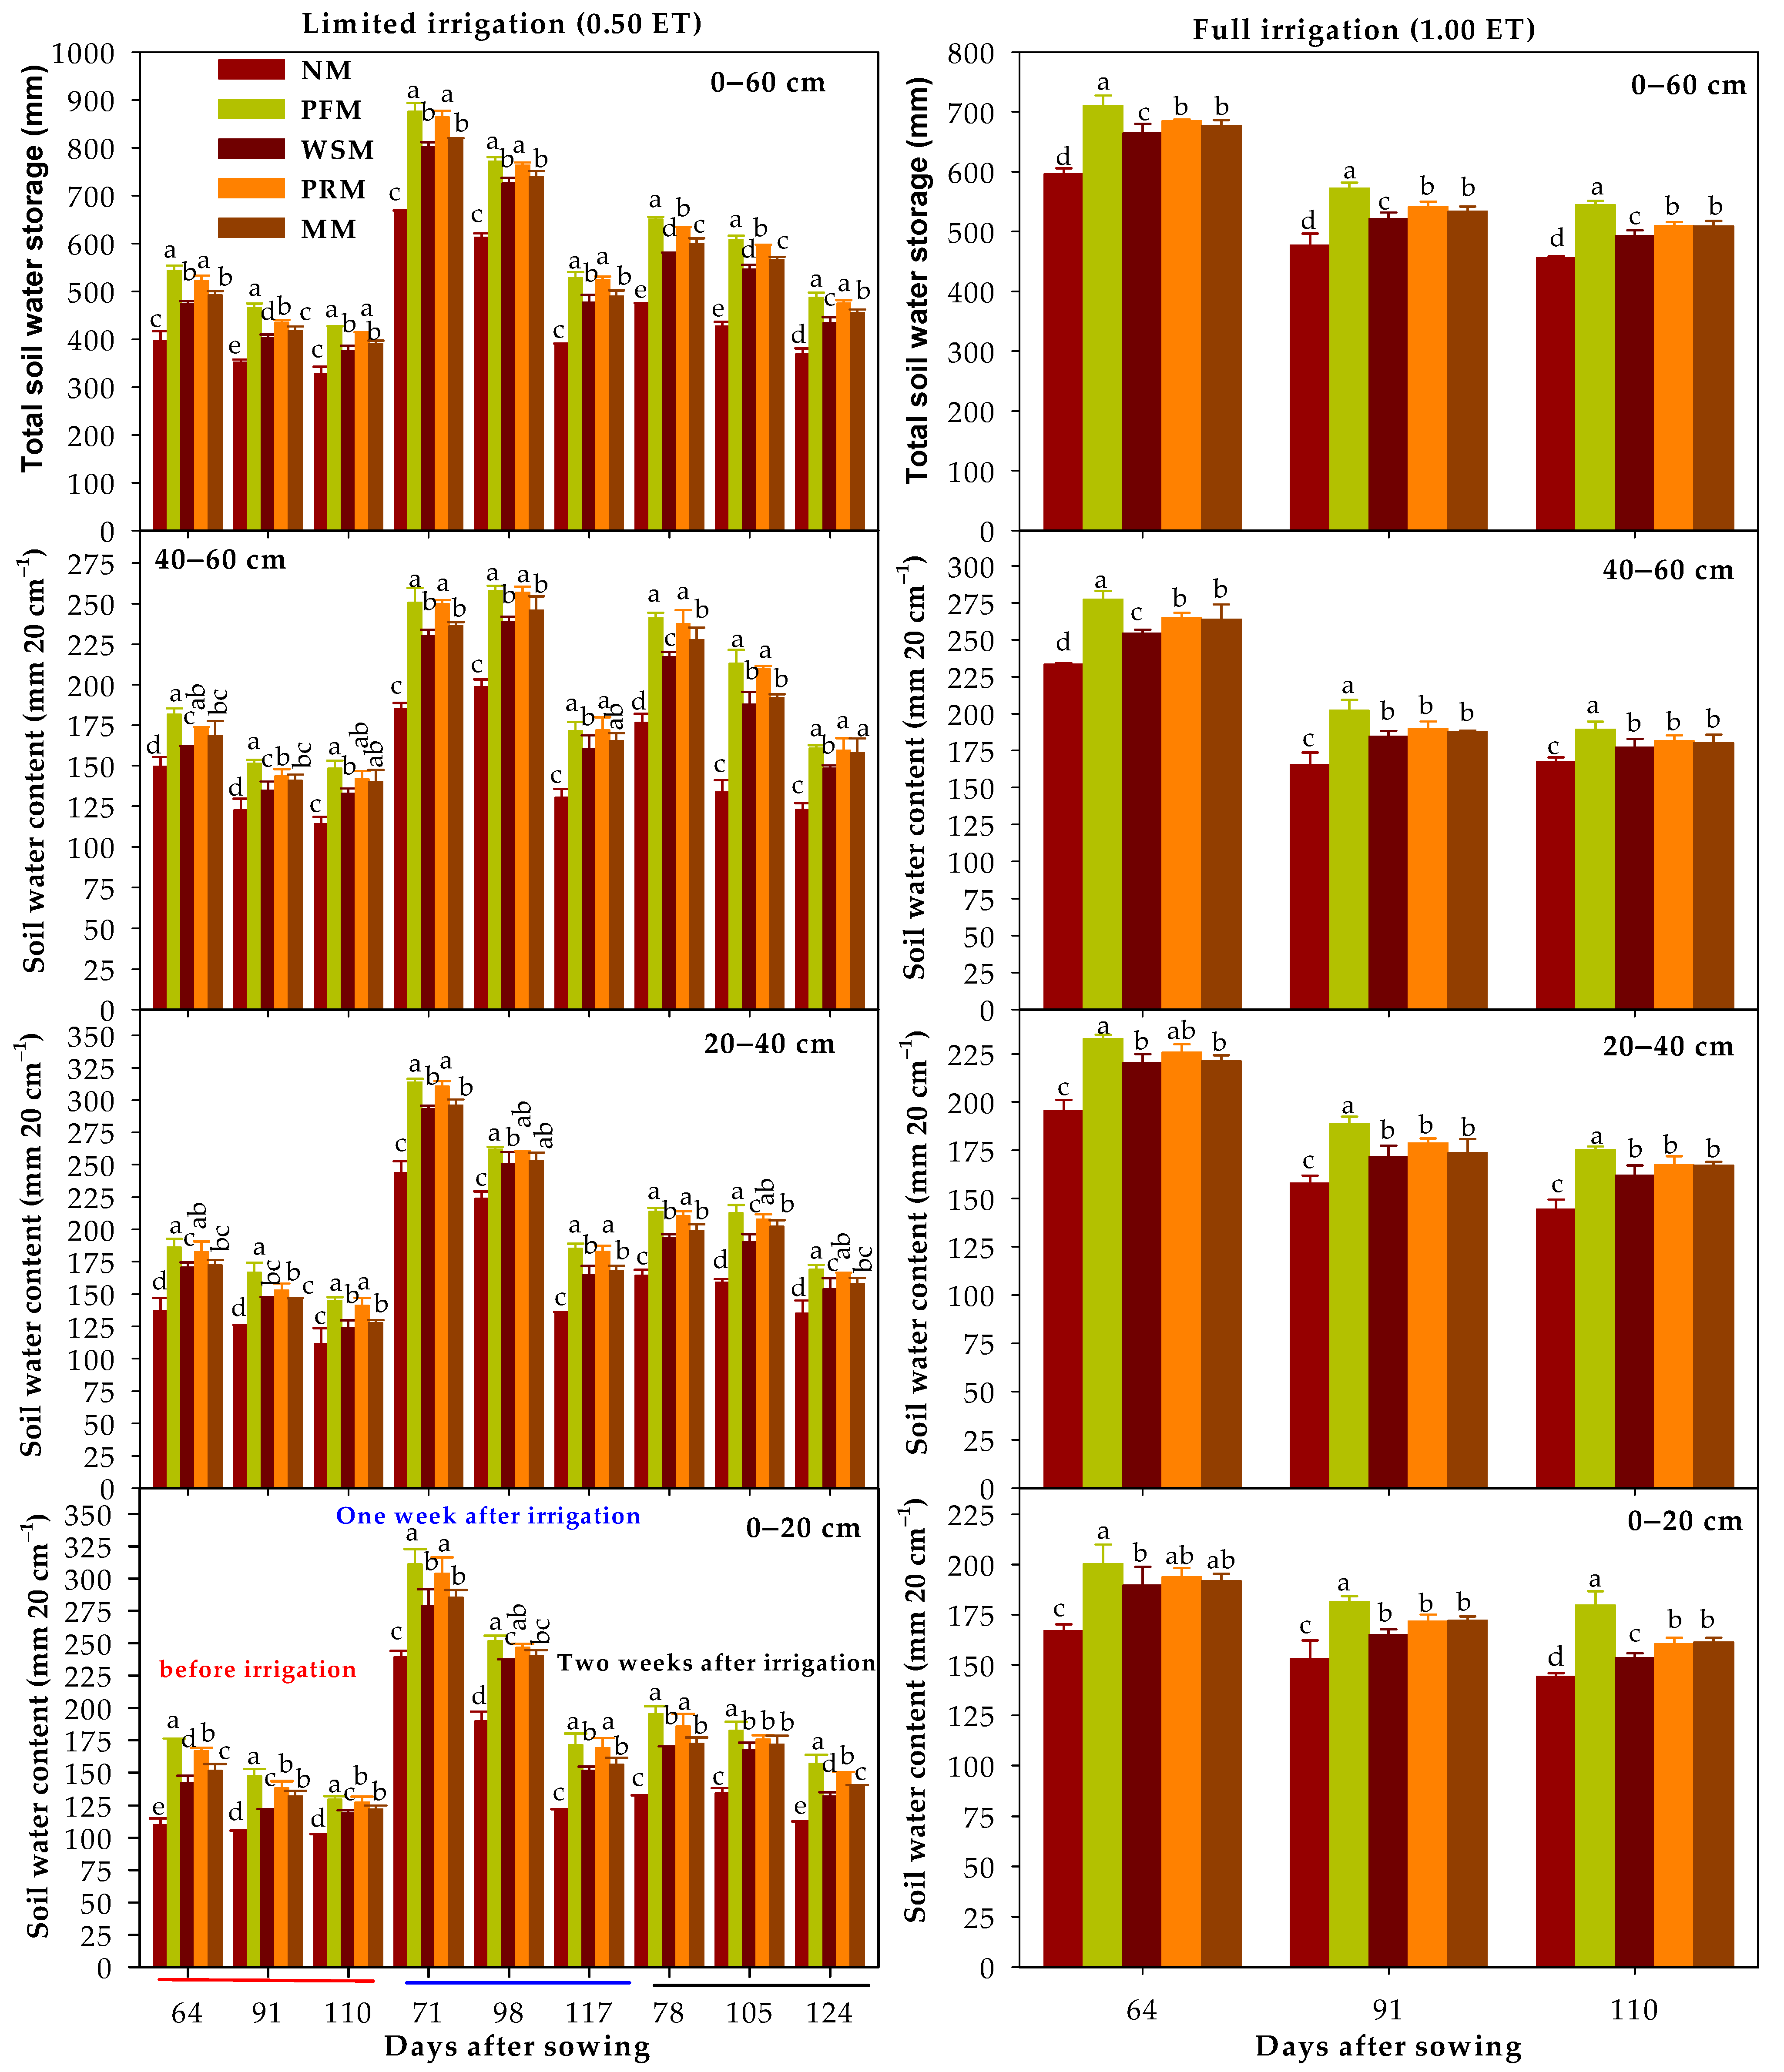
2.4.2. Evaluation of Soil Water Storage

SWS was monitored before irrigation in both irrigation regimes, and after one and two weeks after irrigation in the LM regime. Soil samples were collected from each sub-subplot using a soil ferric auger at the depth intervals of 0–20, 20–40, and 40–60 cm. SWC (%) was determined with the gravimetric method (oven dry basis). The SWS (mm) for each soil depth was calculated using the following equation:
S W S = i = 1 i S W C i × H i × D i  
where ,   S W C i is the gravimetric soil water (%) of the soil layer i, H i is the depth of soil layer i (cm), and D i is the soil bulk density (g cm−3) of each respective ith soil layer. Undisturbed core samples were collected at the soil depths of 0–20, 20–40, and 40–60 cm using cores of 5.0-cm deep and 5.0-cm diameter to determine the soil bulk density for each depth. Two cores were collected from each depth per replicate. The gravimetric SWC was measured by drying the soil samples in a forced convection drying oven (54 L, SH Samheung Science Machinery Manufacturing Co. Yeondong-myeon, Sejong, South Korea) at 105 °C for 24 h.

2.4.3. Measurements of Traits Related to Wheat Growth and Production

Three traits related to growth, including green leaf area per plant (GLA), plant dry weight per plant (PDW), and relative water content (RWC) were measured at 75 days after sowing. Five representative plants were collected from each sub-subplot, then all the green leaf blades were separated and run through an area meter (LI 3100; LI-COR Inc., Lincoln, NE, USA) to measure GLA. Subsequently, all parts of five plants were oven-dried at 80 °C to a constant weight to obtain PDW, whereas the RWC was calculated using the following equation:
R W C = F W D W T W D W × 100
where, FW is the fresh weight of an area of approximately 7–10 cm2 excised from the flag leaf, TW is the turgid weight of the same leaf samples after rehydration in deionized water at 25 °C until full turgidity, and DW is the dry weight of the same leaf samples after oven drying at 80 °C for 72 h.
At physiological maturity, 20 main spikes were randomly selected from each sub-subplot then threshed to measure grain number per spike (GNPS) and 1000-grain dry weight (TGW). Thereafter, an area of 2.8 m2 (four 3.5 m consecutive middle rows in each sub-subplot) were manually harvested using sickles at 5 cm above ground. The aboveground biomass of the harvested area was air-dried for 7 days and weighed to determine the biological yield (BY). Subsequently, GY was determined after threshing the harvested spikes and collecting, cleaning, and air drying the grains to a 14% moisture content. Finally, both BY and GY were expressed as ton ha−1, then their ratio (GY/BY) used to calculate the harvest index (HI).

2.4.4. Estimation of WP and IWUE

The GY (kg ha−1), ET (mm ha−1), and I (mm ha−1) values were used in the following equations to calculate WP (kg ha−1 mm) and IWUE (kg ha−1 mm):
W P = G Y E T
I W U E = G Y I

2.4.5. Evaluation of Yield Response Factor

The impact of LM regime on the growth and production of wheat under mulching and tillage practices was quantified using the Ky. The Ky based on GY and PDW for each season as well as for each mulching treatment under each tillage practice was calculated using the following equation [66]:
( 1 Y a Y m ) = K y ( 1 E T a E T m )
where, Y m   and E T m are the maximum PDW or GY and maximum ET, respectively, which were obtained from the FL regime; Y a and E T a are the actual PDW or GY and actual ET, respectively, for the LM regime.

2.4.6. Determination of Yield–ET and WUE–Yield Relationships

Regression analysis was conducted to test whether the relationships between ET and either PDW, GY, IWUE, or WP, as well as between PDW or GY and either IWUE and WP were significant.

2.5. Data Analysis

All data were initially checked for normality of distribution and homoscedasticity using SPSS 22.0 software (IBM Inc., Chicago, IL, USA) and Levene’s test with general linear model, respectively. The impact of different tillage practices, irrigation regime, and mulching on SWS and different traits related to growth, production, IWUE, and WP were tested with analysis of variance (ANOVA) ideal for the split–split plot design, with tillage practices, irrigation regime, and MT being not only considered as the main plot, subplot, and sub-subplot, respectively, but also as fixed factors. When the F-values of ANOVA were significant, the differences among the means of treatments were compared using Duncan’s multiple range test at 0.05 significance level. The relationships between traits were tested using linear and quadratic regression, and the results as well as for Ky were both plotted using SigmaPlot (v. 11.0; SPSS, Chicago, IL, USA).

3. Results

3.1. Response of Soil Water Storage to Tillage and Mulching Practices

SWS response at different soil depths to tillage practices under the FL and LM regimes is shown in Figure 2. The responses were measured at three time points, including before irrigation (at 64, 91, and 110 days after sowing, DAS) in both irrigation regimes, a week after irrigation (at 71, 98, and 117 DAS), and two weeks after irrigation (at 78, 105, and 124 DAS) in the LM regime. In the FL regime, SWS at 0–20 cm soil depth did not differ between the two tillage practices, while at other soil depths (20–40 cm, 40–60 cm, and 0–60 cm), it was significantly higher by 5.5–8.0%, 6.0–10.2%, and 3.7–12.5% at 64, 91, and 110 DAS before irrigation, respectively in CT than in RT (Figure 2).
In the LM regime, SWS was always higher in RT than in CT at 0–20 cm, 20–40 cm, and 0–60 cm soil depths, while the opposite was true at 40–60 cm soil depth (Figure 2). Before irrigation, no significant differences in SWS between two tillage practices were observed at the three tested time points at 0–20 cm and 0–60 cm soil depths, while its values were significantly higher by 4.5–12.6% in RT than in CT at 20–40 cm soil depth, and significantly higher by 10.3–16.4% in CT than in RT at 40–60 cm soil depth (Figure 2). At one week or two weeks after irrigation, SWS at the three tested time points in RT was significantly higher than those of CT by 7.0–15.0% or 9.0–10.6% at 0–20 cm soil depth, and by 7.5–12.2% or 10.9–14.0% at 20–40 cm soil depth, respectively. The opposite result was observed at 40–60 cm soil depth, with SWS in CT than RT being significantly higher by 7.6–10.6% and 7.7–14.4% at one week or two weeks after irrigation, respectively (Figure 2).
SWS responses at different soil depths to various mulching treatments before irrigation in both the FL and LM regimes, and at one week or two weeks after irrigation in LM regime are shown in Figure 3. Generally, different MT produced greater SWS relative to NM treatment at different tested time points in both irrigation regimes. In the FL regime, SWS of MT in most cases followed the order of PFM > PRM ≈ MM > WSM > NM, whereas they ranked in the order of PFM ≈ PRM > MM > WSM > NM under the LM regime (Figure 3). The SWS under PFM, PRM, MM, and WSM in the FL regime increased by 11.7–18.8%, 7.8–13.9%, 7.2–13.6%, and 5.6–11.9%, respectively, at all different soil layers before irrigation compared to NM. Compared with NM in LM regime, SWS at all different soil layers under PFM, PRM, MM, and WSM was significantly higher by 17.7–37.4%, 13.3–34.1%, 11.3–27.4%, and 9.0–22.7% before irrigation, 14.6–29.6%, 13.9–28.8%, 11.6–22.9%, and 10.8–20.5% at one week after irrigation, and 20.1–37.2%, 18.6–36.2%, 14.5–30.3%, and 12.1–28.8% at two weeks after irrigation, respectively (Figure 3).

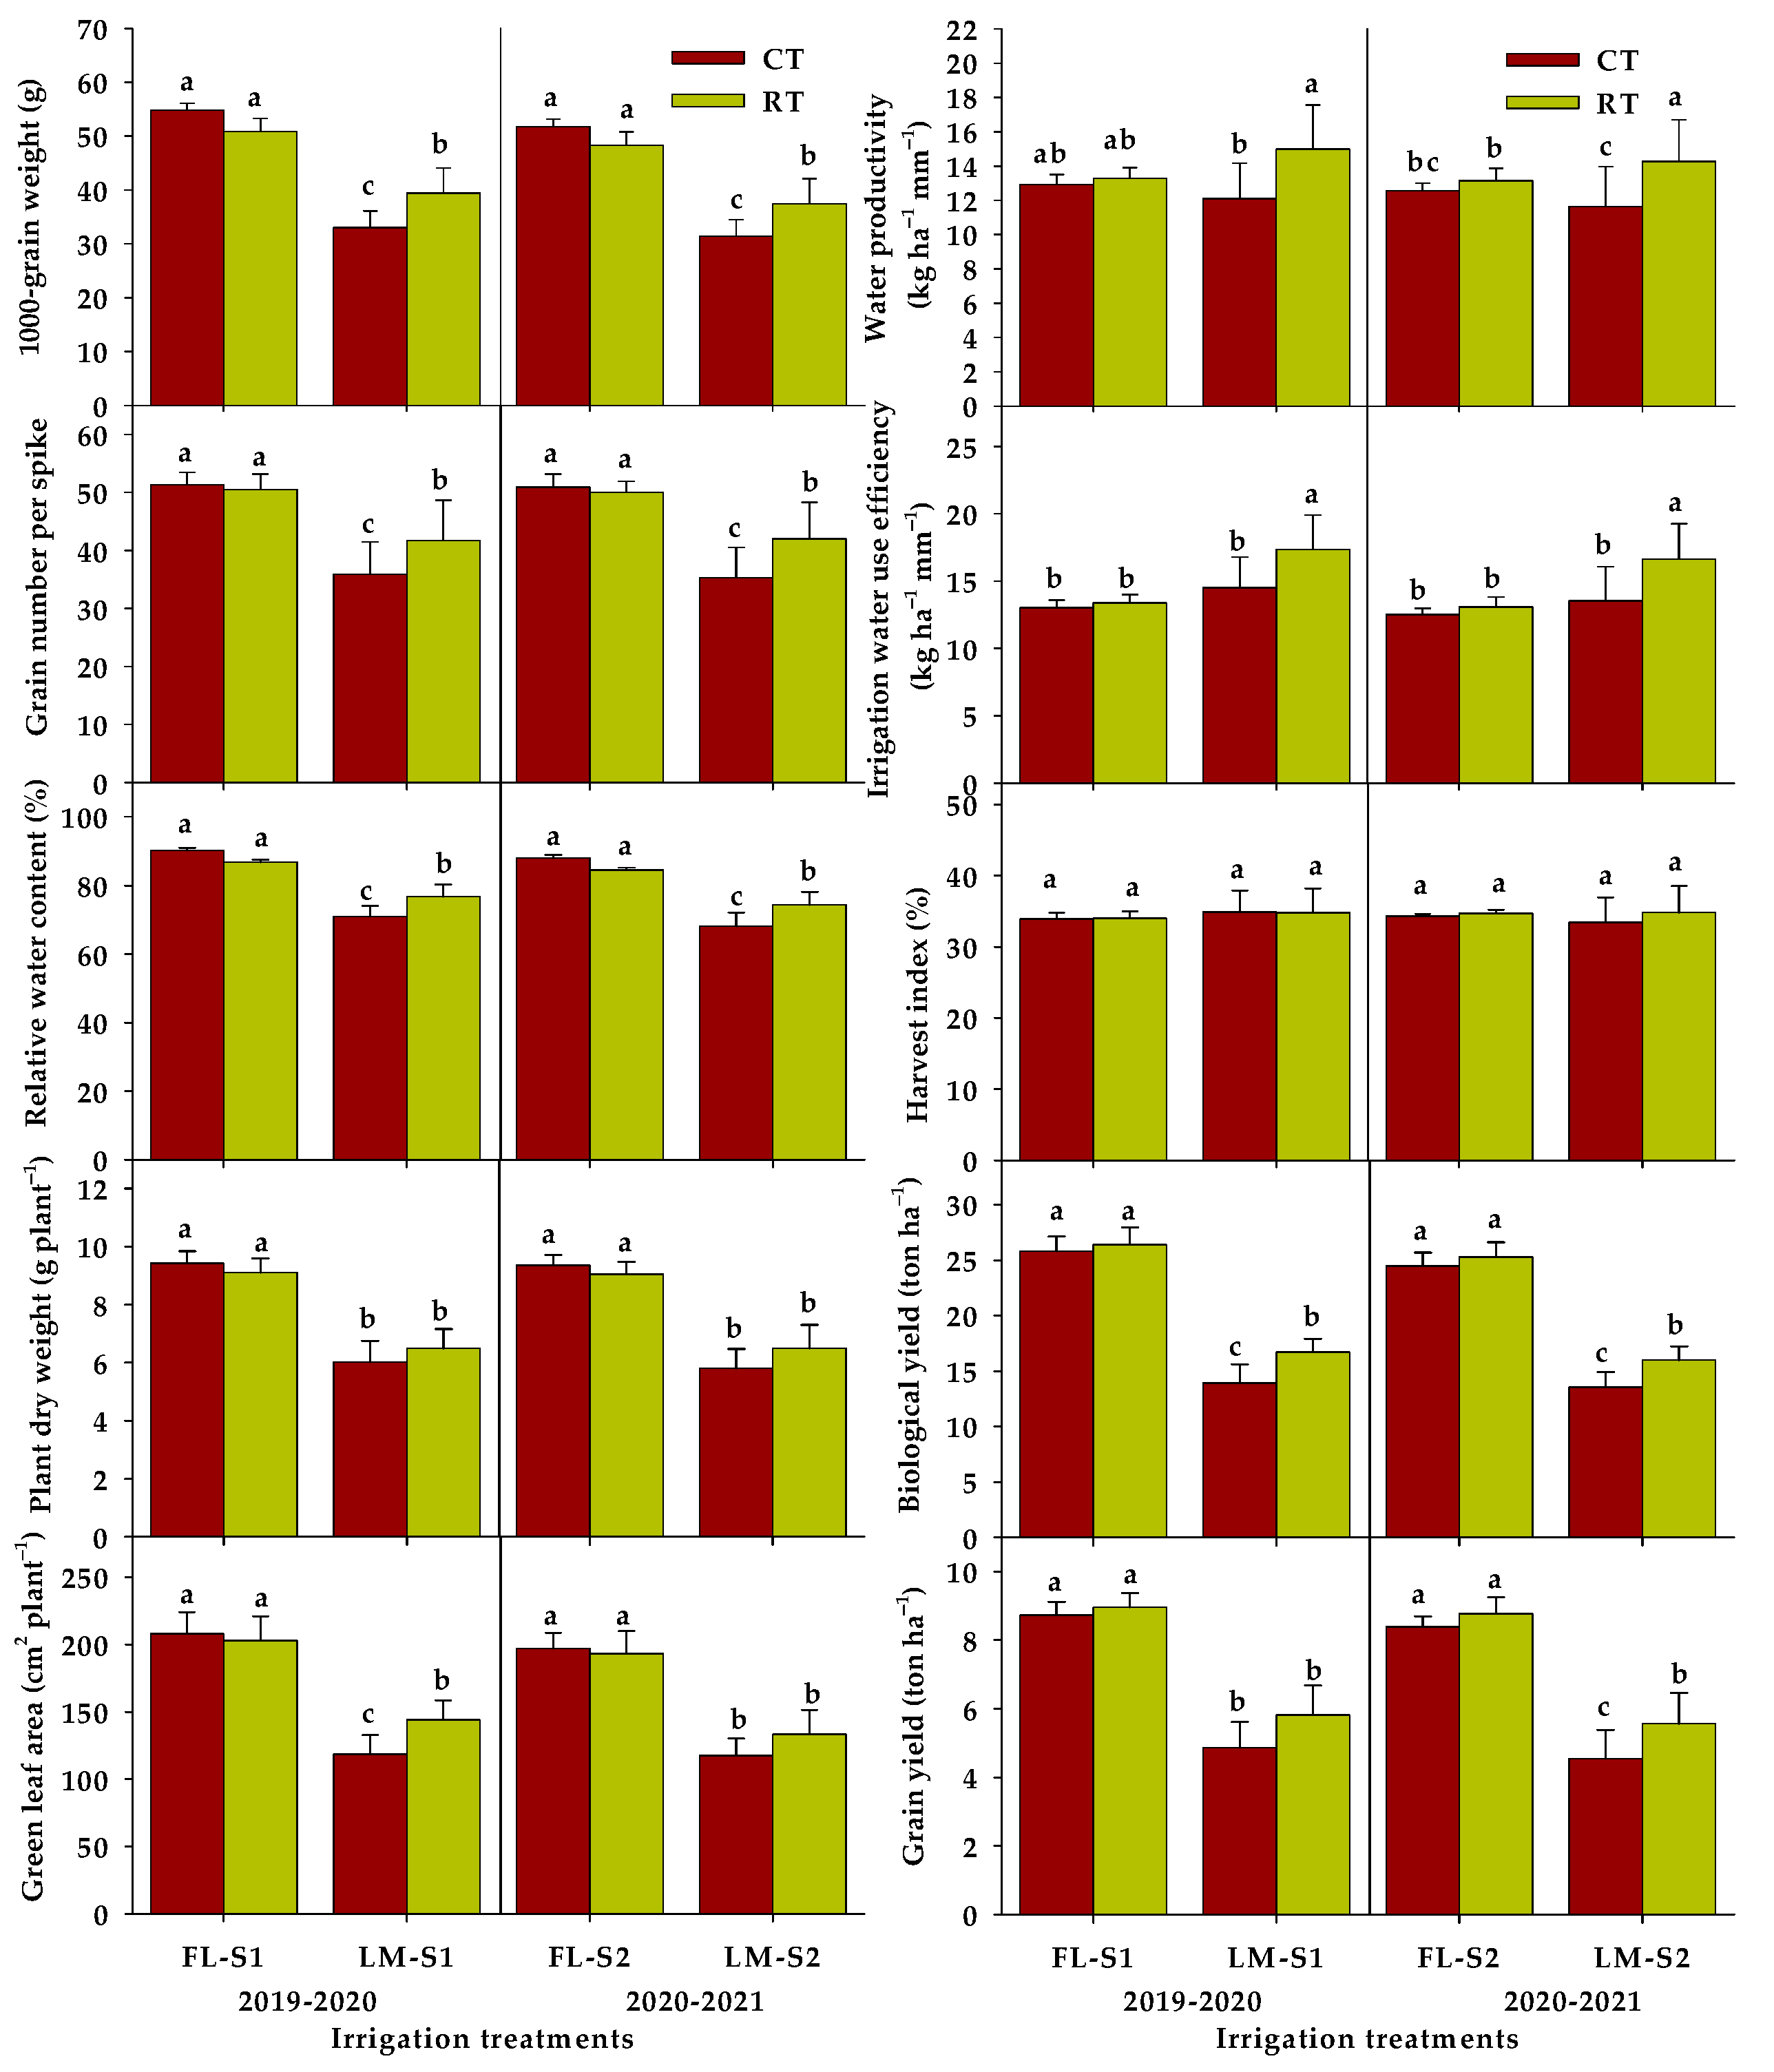
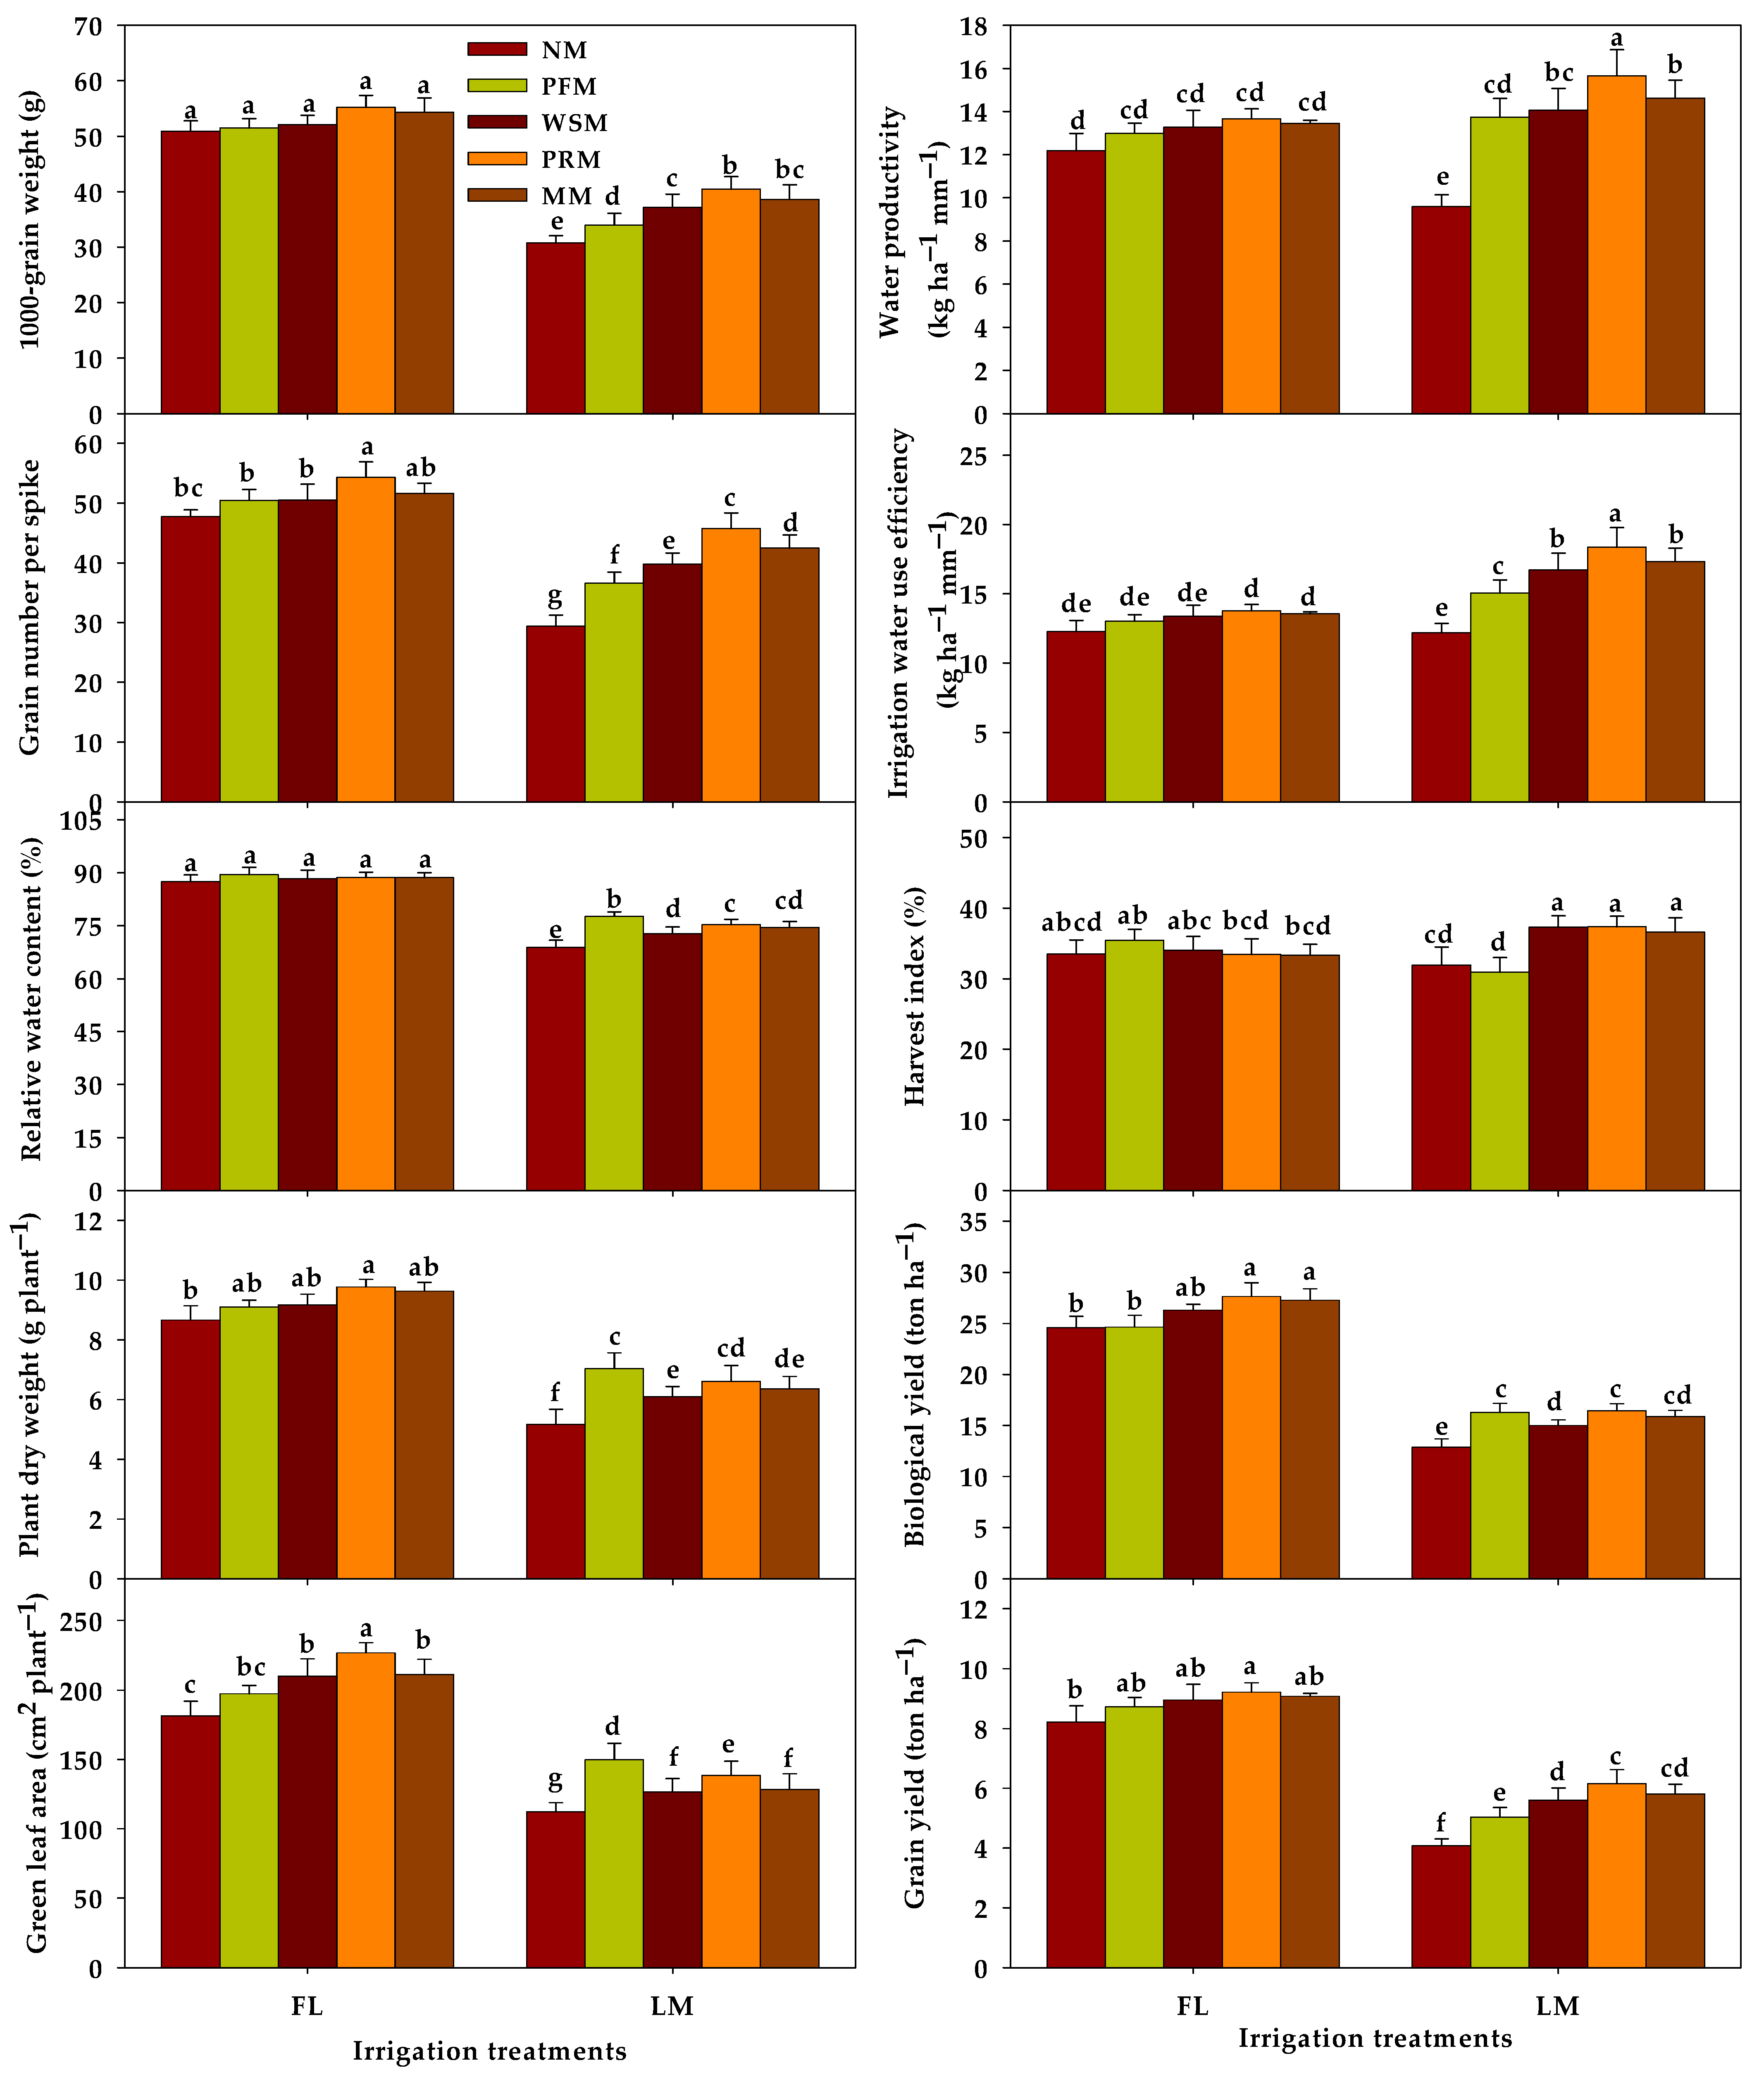
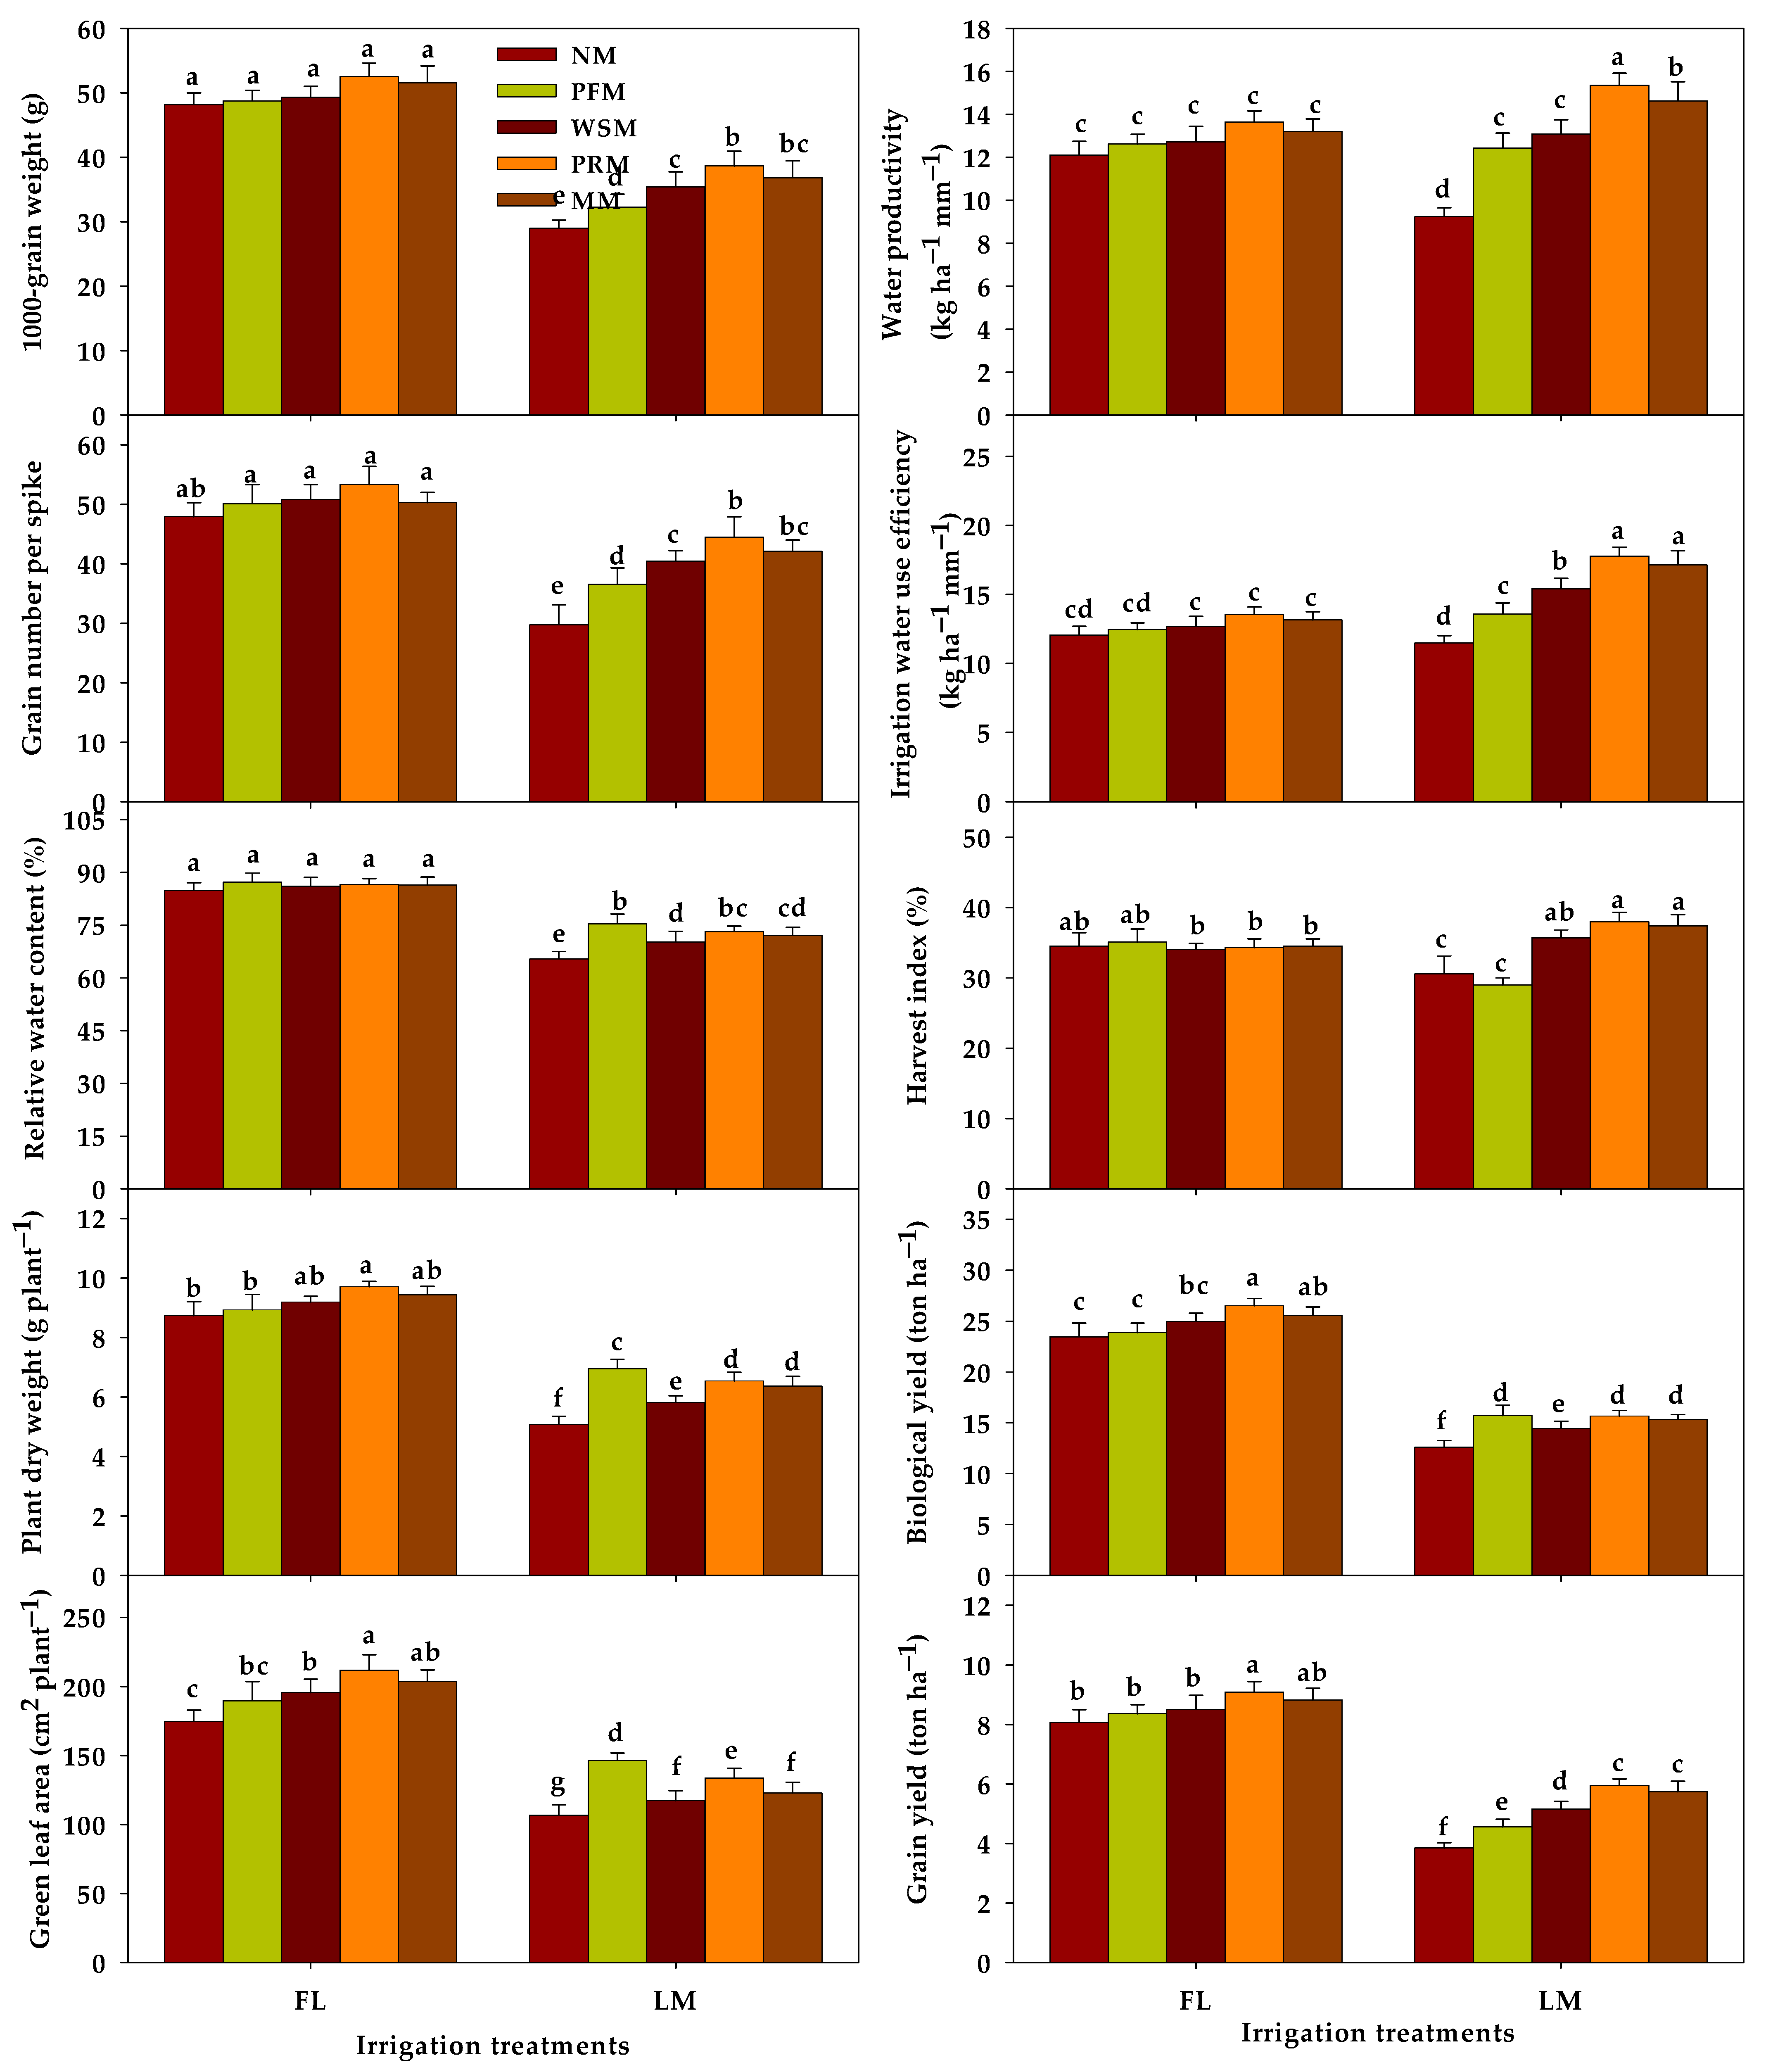
3.2. Variation in Different Traits Related to Growth, Production, and Water Use Efficiency under Tillage and Mulching Practices

Variation results based on ANOVA test for measured wheat traits during the two growing seasons under tillage (T), irrigation (I), mulching (M), and their possible interactions are shown in Table 2. Strong significant effect (p ≤ 0.05 and 0.01) of I and M on all traits in the two growing seasons was observed, except for HI and WP, which showed insignificant variation between the I treatment. There was no significant effect (p > 0.05) of T treatment on the traits related to wheat growth, including green leaf area per plant (GLA), PDW, and RWC. However, traits related to yield components, except HI and TGW, yield, IWUE, and WP were significantly affected by T treatment (Table 2). The I × T and I × M interaction had significant effect on all measured traits, except for HI in the I × T interaction, while the M × T and M × T × I interactions showed insignificant effect on all traits in the two growing seasons (Table 2).
Among the measured traits, GNPS, GY/ha, BY/ha, IWUE, and WP were superior in RT than in CT practice (Table 3). Over the two seasons, GNPS, GY, BY, IWUE, and WP were 5.9, 9.0, 7.8, 10.9 and 11.6% higher in RT than CT, respectively (Table 3). Except for HI and WP, other traits were significantly different between the two irrigation regimes (Table 3). Average GLA, PDW, RWC, GNPS, TGW, GY, and BY in the LM regime across the two seasons were significantly lower by 35.9, 32.9, 17.0, 23.6, 31.3, 40.4 and 41.0%, respectively than in the FL regime, conversely, IWUE and WUE in former regime were 16.2 and 2.0% higher than those in latter regime, respectively (Table 3).
The different MT affected all measured traits in the two growing seasons. Generally, NM treatment always exhibited the lowest values for all traits, whereas PFM and PRM exhibited the highest values for traits related to wheat growth, including GLA, PDW, and RWC. Similarly, PRM and MM exhibited the highest values for IWUE, WP, and traits associated with wheat production, including GNPS, TGW, GY, BY, and HI (Table 3). Traits related to growth in different MT followed the order of PRM ≈ PFM ≈ MM > WSM > NM, whereas those related to production and water use efficiency appeared in order of PRM ≈ MM > WSM > PFM > NM (Table 3).
Figure 4 shows the response of different wheat traits to two tillage practices under each irrigation regime. Generally, no significant difference in all traits was observed between CT and RT under FL regime, whereas the values of most traits were significantly higher in RT than in CT under LM regime. Over the two seasons, GLA, PDW, RWC, GNPS, TGW, GY, BY, IWUE, and WP values were 14.9, 9.0, 8.0, 14.9, 16.1, 17.4, 15.9, 17.4 and 18.8% higher in RT than in CT under LM regime, respectively (Figure 4).
The responses of different wheat traits to five MT under each irrigation regime in the first and second seasons are shown in Figure 5 and Figure 6, respectively. In both irrigation regimes, the values of different traits were significantly higher in the four MT (PFM, WSM, PRM, and MM) than in the NM treatment, with the differences being mostly apparent under LM treatment. Average GLA, PDW, RWC, GNPS, TGW, GY, BY, IWUE, and WP values across the two seasons were higher for four MT than for NM treatment by 8.0–18.8%, 3.5–10.7%, 1.1–2.4%, 4.9–11.2%, 1.1–8.0%, 4.6–11.0%, 1.1–11.4%, 4.6–11.0%, and 5.2–11.1% under the FL regime, and 10.2–26.1%, 14.0–26.7, 6.3–12.4%, 19.2–34.5%, 9.9–24.6%, 17.3–34.5%, 13.4–20.6%, 17.3–34.5%, and 27.9–39.3% under the LM regime, respectively. Based on these range values, the highest increase in the three growth traits (GLA, PDW, and RWC) was observed with PRM under the FL regime, and with PFM under the LM regime, while the highest increase in traits related to production and water use efficiency was observed with PRM. In contrast, the lowest increase was detected with PFM under both irrigation regimes.

3.3. Evaluation of Tillage and Mulching Practices under LM Regime Using Yield Response Factor

The ky values representing the relationship between the relative decrease in PDW (KyPDW) or final GY (KyGY) and the corresponding relative ET deficits were calculated based on the pooled data of T, I, and M treatments (Figure 7), as well as based on individual MT for each tillage practice under the LM regime (Table 4). The KyPDW values based on the pooled data were <1.0, with 0.88 and 0.89 in the first and second season, respectively (Figure 7A), while the KyGY values were greater 1.00, with 1.04 and 1.11 in the first and second season, respectively (Figure 7B).
Different MT in each tillage practice also had significant effects on KyPDW and KyGY under the LM regime, with NM and PRM values in both tillage practices being > 1.0 and <1.00, respectively, in both seasons (Table 4). KyPDW and KyGY values for the four MT were <1.00 in RT, while the values in CT varied with the measured traits. KyPDW and KyGY values for PFM and MM were <1.00, whereas KyGY values for both MT and KyPDW and KyGY values for WSM were > 1.00 (Table 4).

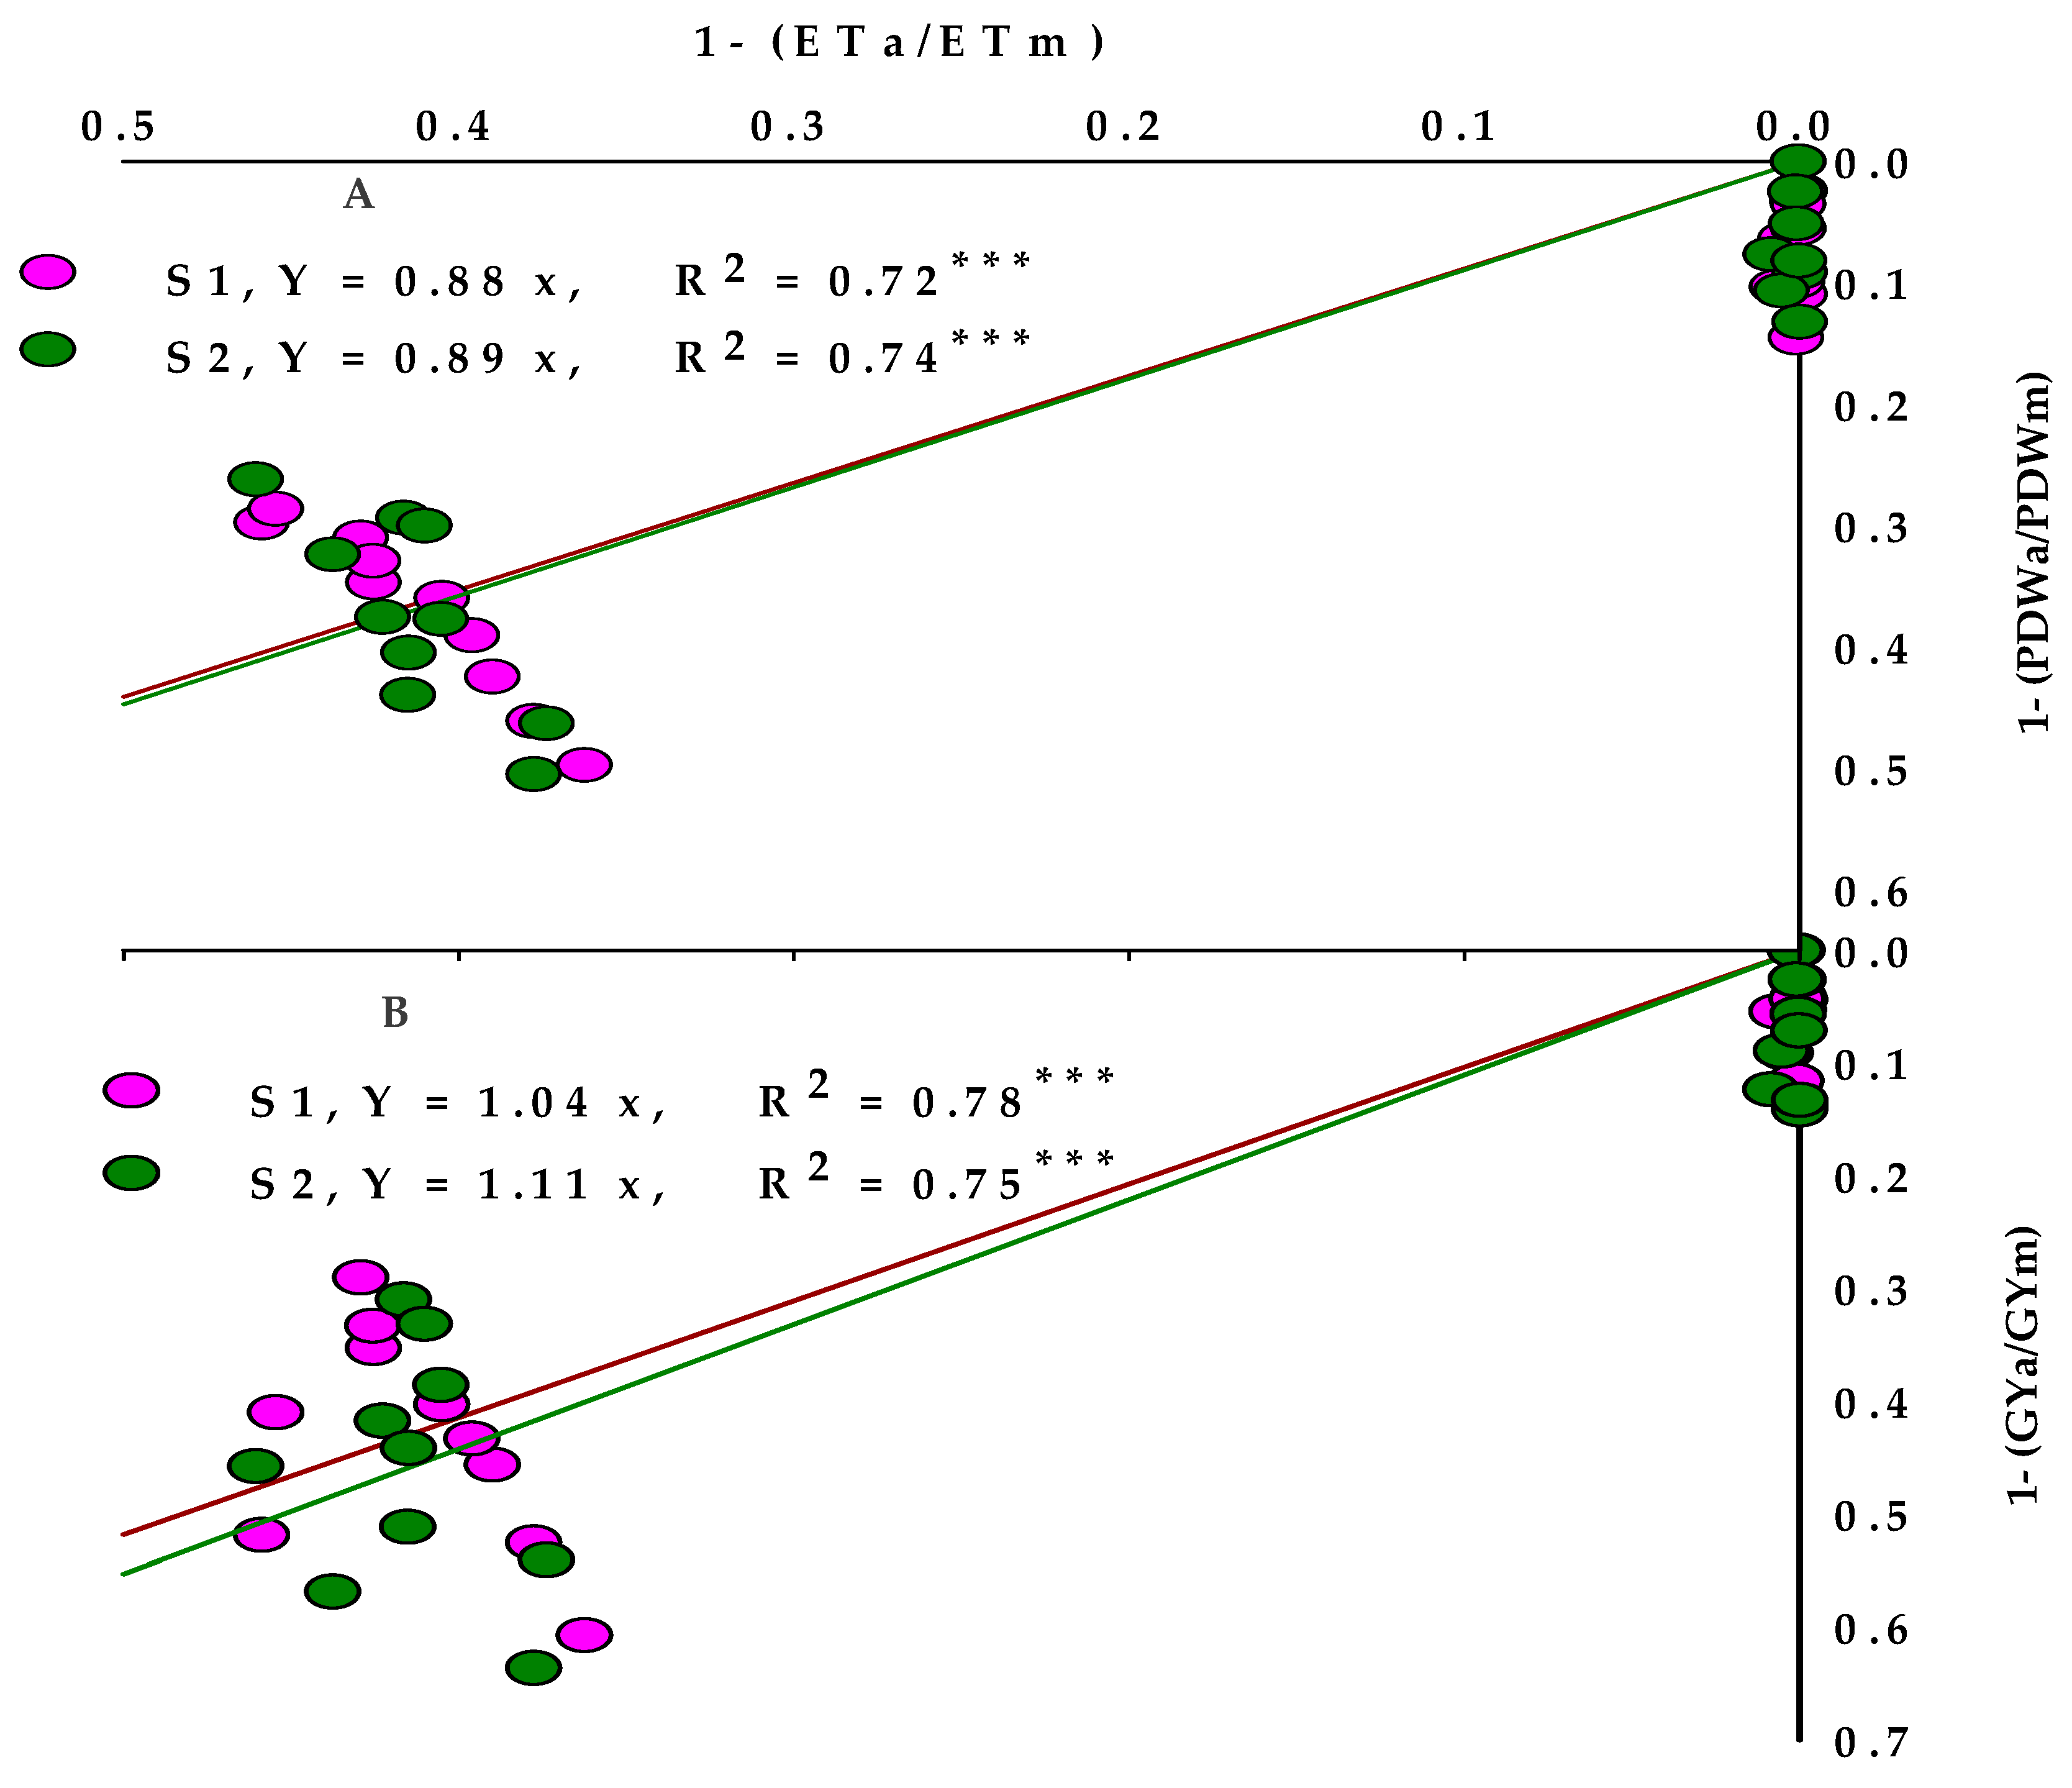
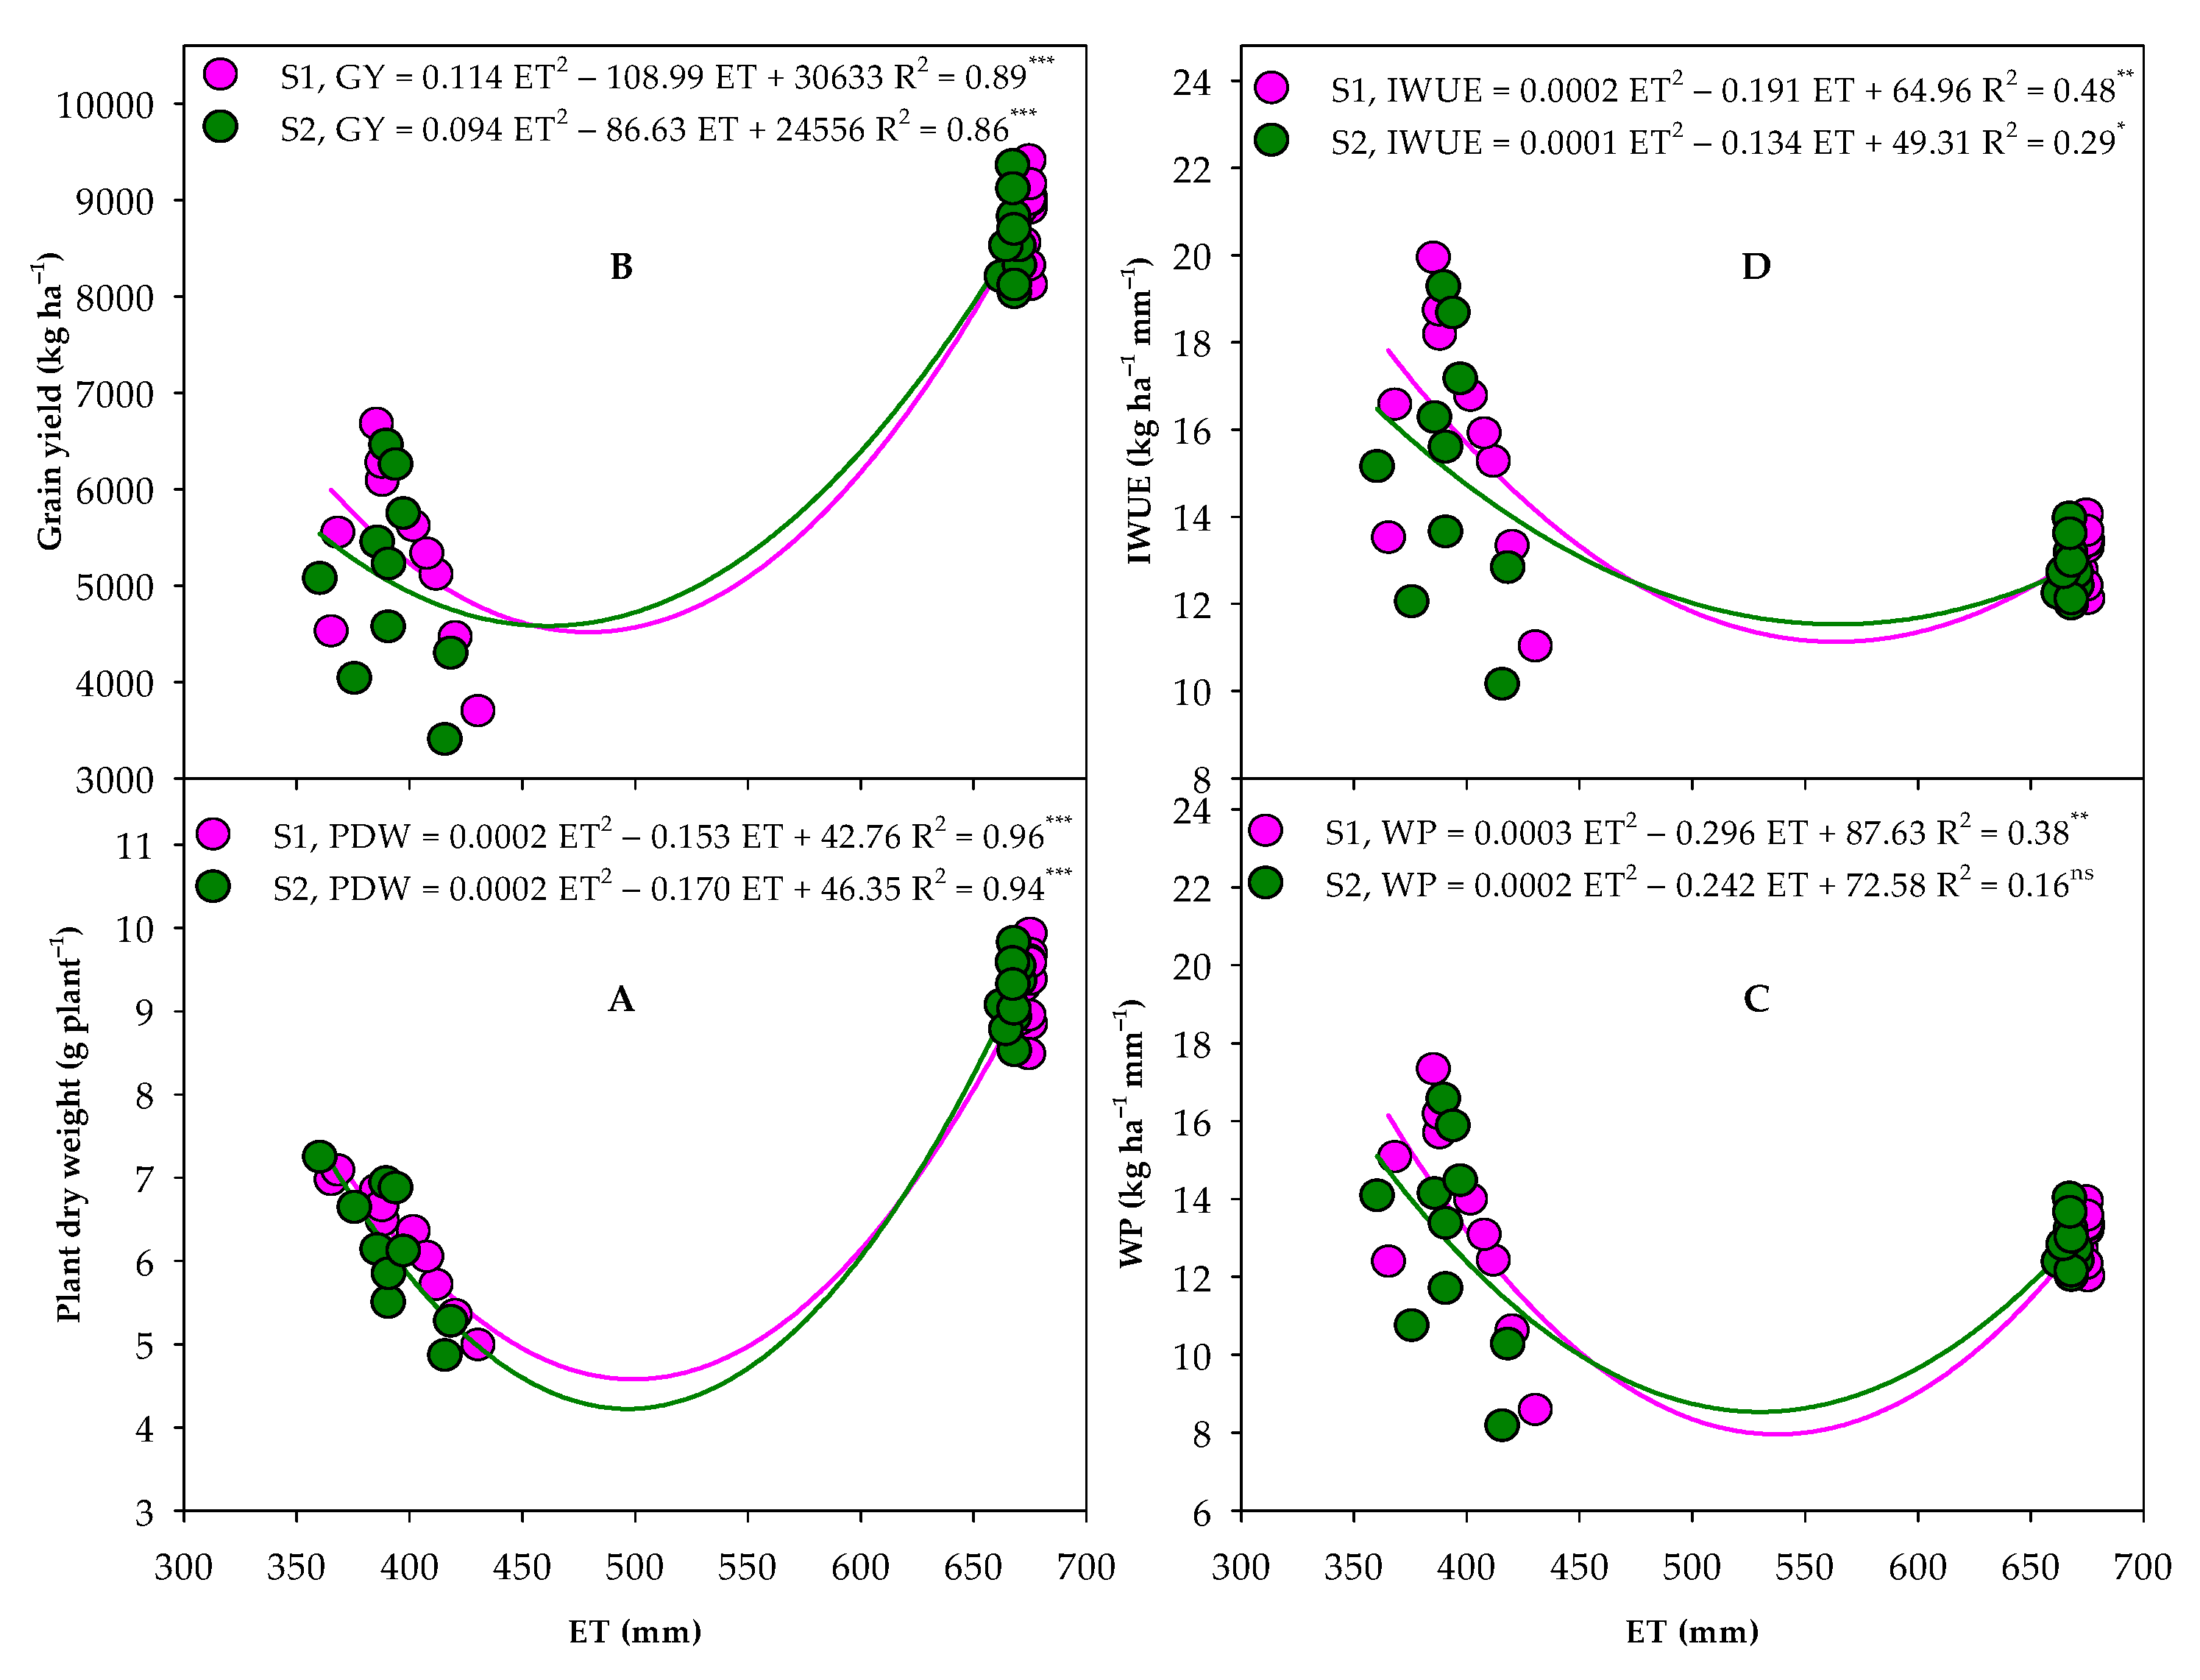
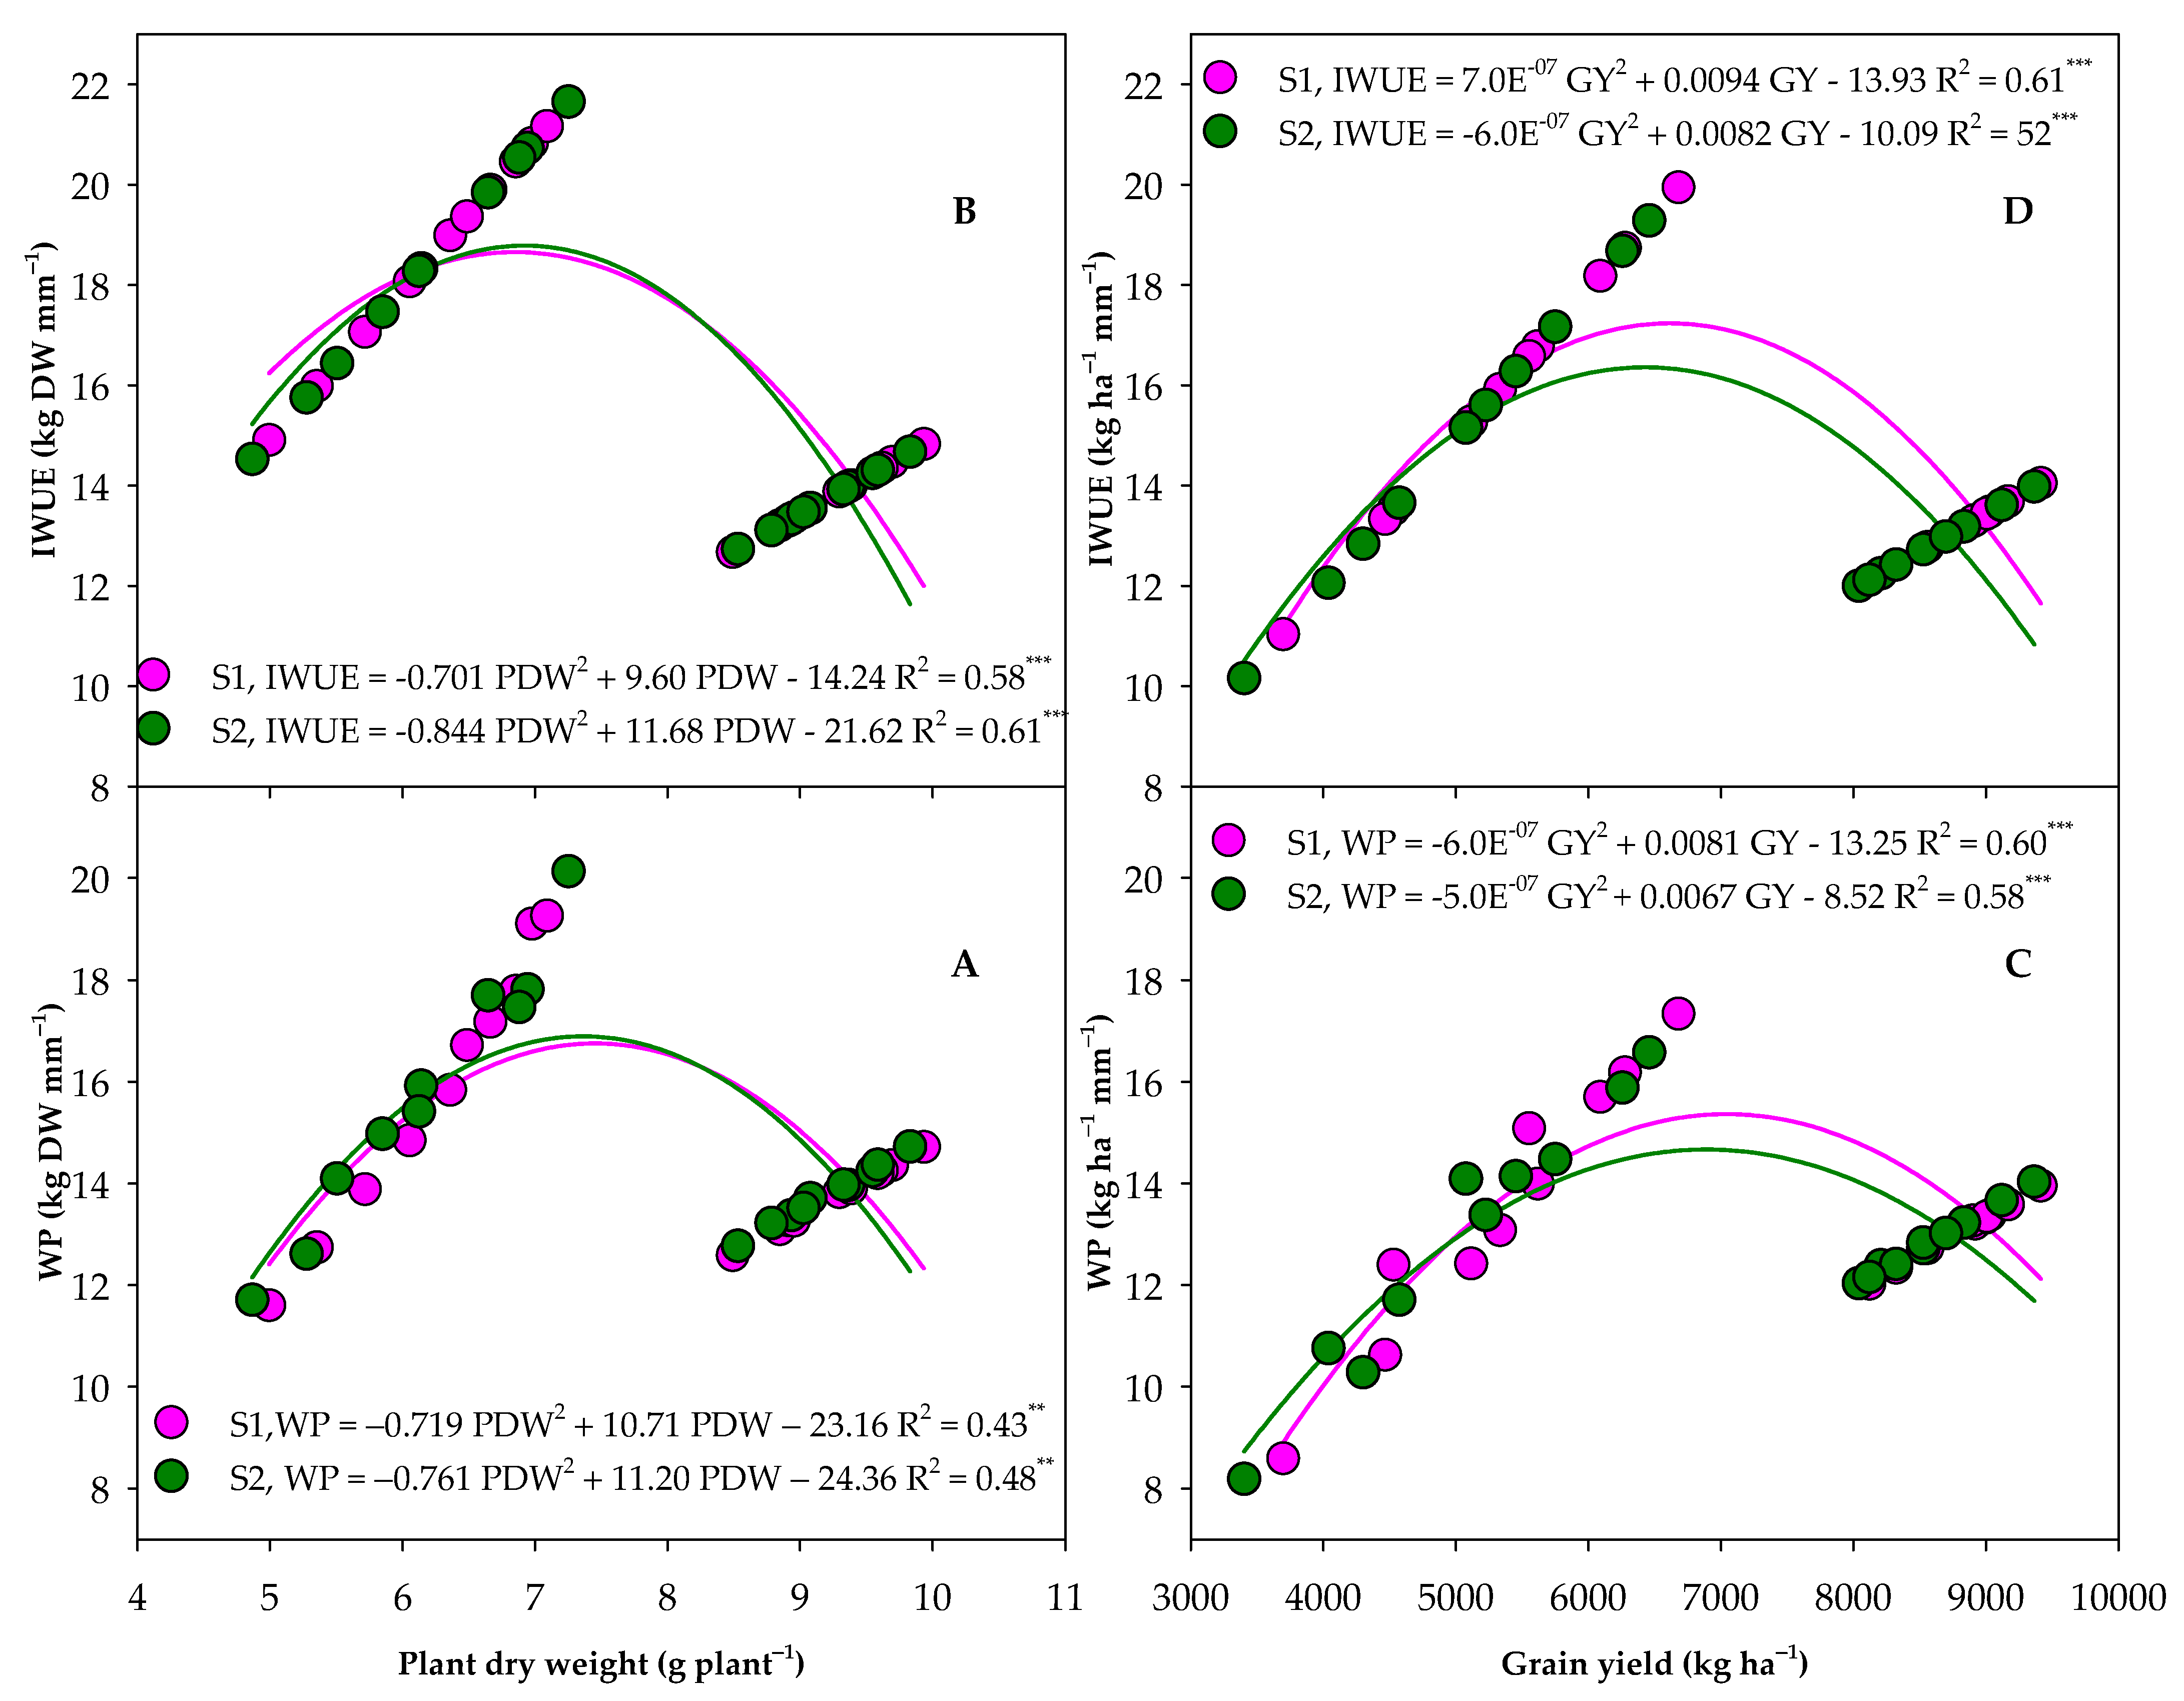
3.4. Evaluation of the Relationships between PDW, GY, IWUE, WP, and ET

The relationships between ET and PDW, GY, WP, and IWUE are shown in Figure 8. The quadratic parabola was selected as the model that best describes these relationships after pooling all of the datasets. These results showed that about 94–96%, 86–89%, 16–38% and 29–48% of the variation in PDW, GY, WP, and IWUE, respectively, could be attributed to the variations in ET. Additionally, wheat required minimum ET of 382.5 mm, 478.0 mm, 493.3 mm, and 477.5 mm in the first season and 425.0 mm, 460.8 mm, 526.1 mm, and 558.3 mm in the second season to reach the maximum values of PDW, GY, WP, and IWUE, respectively, under different tillage and mulching practices (Figure 8A–D).
Regression analysis also showed that a quadratic function could fit the relationships of WP and IWUE with PDW and GY (Figure 9), with PDW explaining 43–48% and 58–61% (Figure 9A,B), while GY explaining 58–60% and 52–61% (Figure 9C,D) of the variation in WP and IWUE, respectively. Additionally, maximum WP was achieved at 7.45 and 7.36 g plant−1 (Figure 9A) and 6750.0 and 6700.0 kg ha−1 (Figure 9C), while maximum IWUE was obtained at 6.85 and 6.92 g plant−1 (Figure 9B) and 6714.3 and 6833.3 kg ha−1 (Figure 9C) in the first and second seasons, respectively, followed by a significant decrease in both WP and IWUE.

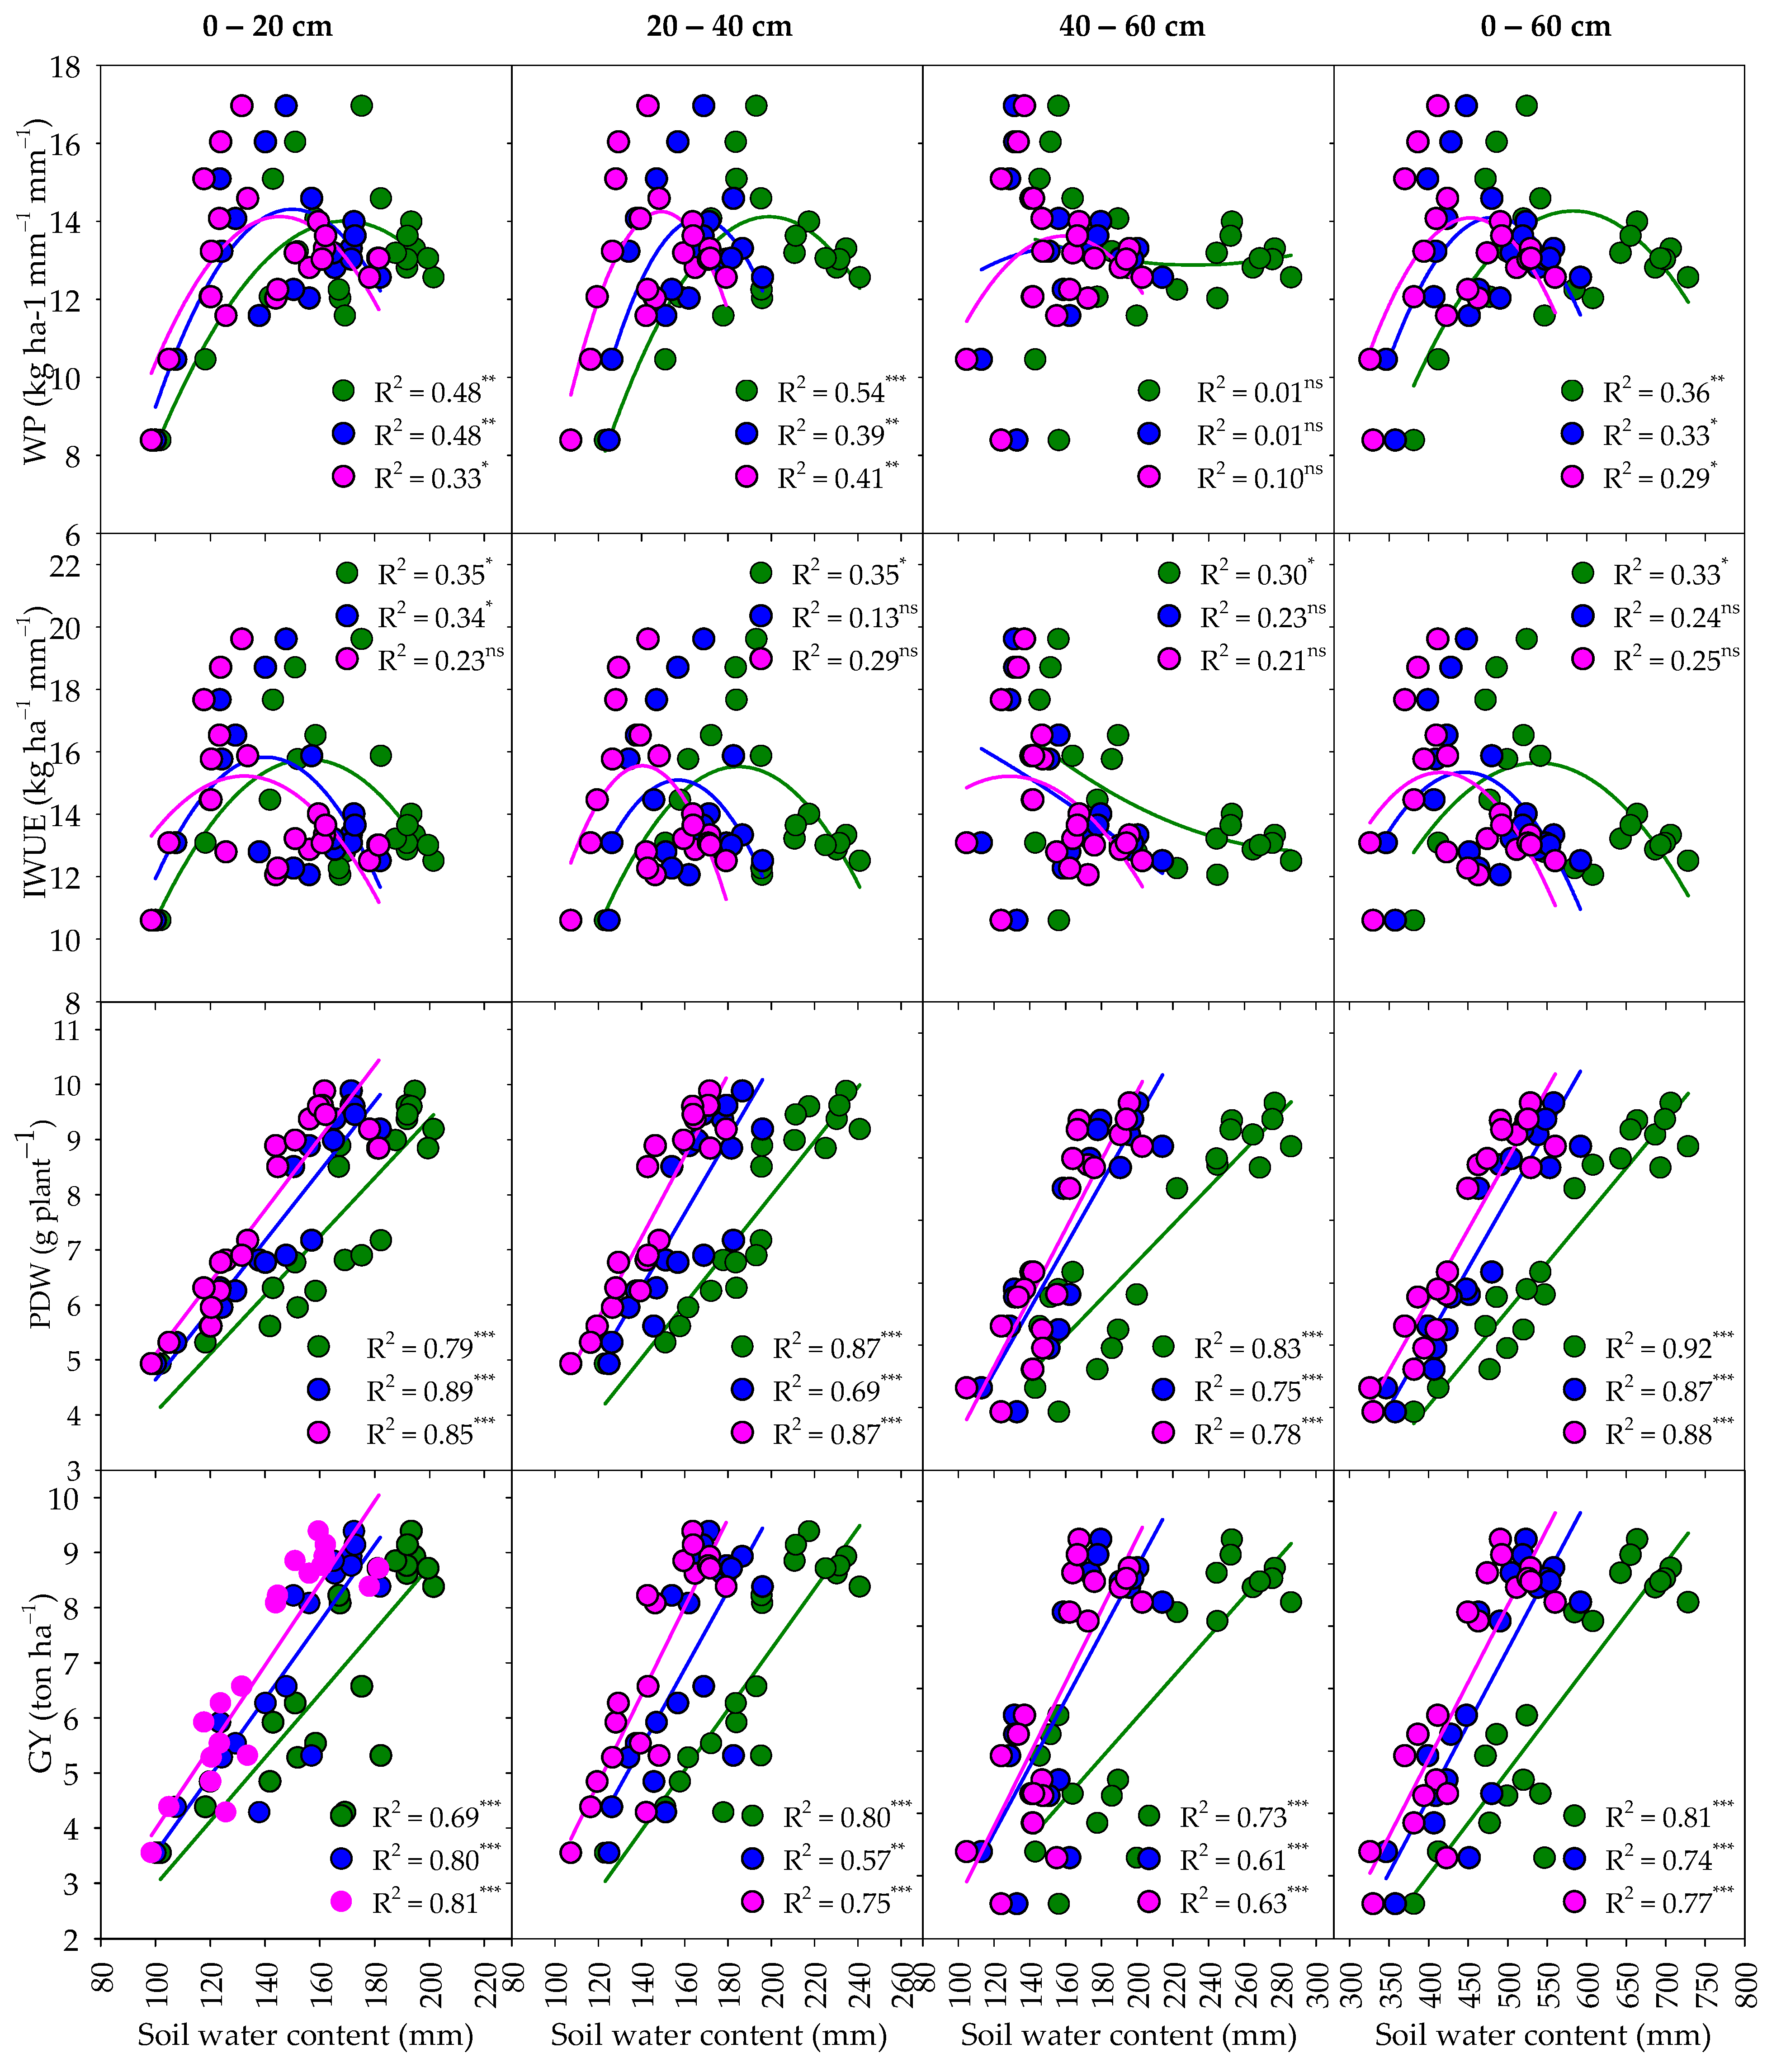
3.5. Relationship of SWS with PDW, GY, IWUE, and WP

The functional relationships of SWS with PDW, GY, IWUE, and WP at different soil depths measured prior to the next irrigation using the pooled data of T, I, and M treatments are shown in Figure 10 and Table 5. Generally, the relationship of SWS with PDW and GY at different soil depths and measured time points was linear, while its association with IWUE and WP was quadratic. Additionally, SWS at different soil depths and measured time points showed strong and significant with PDW (R2 range 0.69 to 0.92) and GY (R2 range 0.57 to 0.81). In contrast, SWS at different soil depths and measured time points had moderate to strong relationship with WP (R2 range 0.29 to 0.54), with the exception of SWS at 40–60 cm soil depth, which showed insignificant relationship with WP. Moreover, SWS at different soil depths at 64 DAS, or at 40–60 cm soil depth at 91 DAS showed a moderate relationship with IWUE (R2 range 0.30 to 0.35). In contrast, other SWS showed weak and insignificant relationship with IWUE (Figure 10).
Based on the relationship slopes of SWS with PDW and GY, the results in Table 5 indicated that at different measured time points of SWS, a 10 mm increase in SWS at the 0–20 cm, 20–40 cm, and 40–60 cm soil depths caused an increase of 0.53–0.66, 0.49–0.74, and 0.30–0.55 g plant−1 in PDW, and an increase of 0.58–0.74, 0.55–0.80, and 0.32–0.58 ton ha−1 in GY, respectively. Quadratic relationships of SWS with IWUE and WP indicated that IWUE and WP increased with the increase in SWS until SWS values reached 130.3–152.4 mm and 147.5–172.1 mm at the 0–20 cm soil depth, 142.7–189.6 mm and 148.0–208.0 mm at the 20–40 cm soil depth, and 137.5–217.5 mm and 143.3–243.1 mm at the 40–60 cm soil depth. Both IWUE and WP subsequently decreased with the increase in SWS (Table 5).

4. Discussion

Maximizing WP via innovative water-saving measures has emerged as a viable strategy to tackle the water shortage problem in arid and semiarid countries. Generally, unproductive water loss through E, which accounts for 30–60% of total ET in wheat crops [25], and through infiltration under the root zone are the key factors causing low WP under traditional agronomic practices, such as the nonmulching CT [67]. It is likely that no tillage or at least RT practice combined with mulching using different materials is a promising and a potentially efficient strategy for improving WP at field scale. This is because the combination between both practices have numerous merits, including improved several soil physiochemical and biological properties, reduced daily changes in soil temperature, and reduced amount of water lost through E and percolation under the root zone [33,34,40,41,42,43,44,45,46,47,48,68,69]. Due to these aforementioned benefits, combining two agronomic practices can lead to enhanced SWS in the root zone, consequently increasing the available water for plants, thus, simultaneously promoting crop growth, yield, and WP under DI conditions.

4.1. Effects of Tillage and Mulching Practices on SWS

Previous studies have shown that RT is more effective at increasing SWS by inhibiting soil E and water infiltration beneath the root zone, resulting in minimum water consumption compared to CT [5,6,7,64,70,71]. In this study, the effects of tillage practice on SWS strongly correlated with irrigation regimes. SWS at the 20–40, 40–60, and 0–60 cm soil depths were significantly higher in CT than that in RT under the FL regime, while under the LM regime, SWS was always higher in RT than in CT at the 0–20, 20–40, and 0–60 cm soil depths, with the opposite result being true at 40–60 cm soil depth (Figure 2). These results indicated that RT rather than CT was more effective at improving SWS under DI conditions, while the opposite was true under sufficient irrigation water supply. The ability of RT to conserve soil water under the LM regime could be due to its capacity to reduce topsoil surface disturbance, resulting in reduced amount of water lost through E and infiltration beneath the root zone. In normal water supply, CT practice is principally used to increase soil porosity and establish channels in the soil surface layer to increase SWS in deep soil layers and avoid water loss through E from the upper soil surface.
We also observed that SWS at different soil depths and measured time points were significantly affected by MT, with different MT producing greater SWS relative to NM under both irrigation regimes (Figure 3). Additionally, SWS of different MT followed the order of PFM > PRM ≈ MM > WSM > NM under the FL regime, whereas they ranked in the order of PFM ≈ PRM > MM > WSM > NM under the LM regime (Figure 3). These results demonstrated that PFM and PRM were most effective followed by MM and SM at conserving soil water than NM. Previous studies have reported that compared to bare soil cultivation, mulching the soil surface significantly promote SWS by improving the soil structure, thereby reducing ineffective soil E, and raising the soil water level from deeper to the crop-available layer. Additionally, various mulching materials show different effects on SWS [5,7,16,55,72]. This study compared SWS between three types of mulching treatment and the results showed that PFM could store more water under both irrigation regimes than crop residue mulching. This may be attributed to the fact that plastic film material forms a thin barrier between the soil surface and atmosphere, thus blocking water vapor escape from the soil into the atmosphere, consequently improving the ineffective soil E status and storing more water in the root zone [8,13,16,73]. PRM and to an extent WSM, and integration of both materials (MM) produced competitive performance with those of PFM in enhancing SWS (Figure 3). The ability of different plant (palm and wheat straw) residues to conserve soil water might be attributed to the fact that the thickness of plant residue mulch decreases the rate of water loss via E by lowering the rate of water loss through vapor flux from the soil water. Mulch thickness creates shading and insulator material, thus reducing solar radiation reaching the soil surface, thereby reducing soil temperature and the amount of latent heat flux required to convert soil water to vapor, which is lost from the soil surface through E. Decomposition of these plant materials can also improve several soil physical and biological properties, particularly those related to improved water storage capacity and increased soil water infiltration [3,5,55,73,74,75].

4.2. Effects of Tillage and Mulching Practices on Different Wheat Traits

Different traits related to wheat growth and production was significantly lower under the LM regime than FL regime, while the opposite was true for IWUE and WP traits (Table 3). A significant reduction of 17.0–41.0% in different traits were observed in the LM regime than in the FL regime (Table 3), which indicated that wheat is very sensitive to DI. On the other hand, IWUE in the LM regime increased by 16.1%, which suggested that DI is a key strategy that could be used to reduce irrigation water amounts and increase WP in the arid and semiarid countries. It has been reported that the WP of different cereal crops can be increased by approximately 10%–42% under the LM regime than the FL regime [2,76,77,78]. However, the LM regime caused a significant decrease in GY by 40.4% (Table 3), which suggested the complexity of applying this treatment to wheat crop without an accompanying reduction in their production. Therefore, coupling DI strategy with other agronomic practices is imperative in order to reduce amount of water lost through soil E and/or by leaching under the root zone. Overall, this study show that both tillage and mulching practices play vital roles in enhancing the growth, production, and WUE of the wheat crop as a general effect and as a specific impact when both practices are combined with irrigation regimes (Table 3 and Figure 4, Figure 5 and Figure 6).
This study showed that tillage practices had significant effects on GY and their component except for TGW and HI, as well as on IWUE and WP, but not on traits related to wheat growth (Table 2), with the values of these traits under RT being 5.9–11.6% higher than their corresponding values in CT (Table 3). Additionally, no significant differences were detected in all traits between CT and RT under the FL regime, whereas their values in RT were 8.0–18.8% higher than in CT under the LM regime (Figure 4). These findings clearly demonstrate that RT is potentially an effective practice for mitigating the negative impacts of DI on wheat production, by enhancing IWUE and WP. The higher efficiency of RT in enhancing the production and WUE of wheat under the LM regime could be attributed to the fact that RT practice can change crop water consumption pattern and increase plant-available water. This is because it can increase water storage in the root zone, reduce the amount of water lost through both evaporation and leaching, decrease soil temperature, increase root surface area, increase nutrient and water uptake, enhance quantity and quality of soil organic matter, and reduce soil–leaf water potential gradient [5,6,7,60,71,79,80,81]. These benefits associated with RT might explain why the practice was more effective than CT at improving different wheat traits related to the growth, production, and WUE under the LM regime.
Different MT also showed significant effects on all measured traits (Table 2), with the highest values being obtained for wheat traits associated growth (GLA, PDW, and RWC) under PFM and PRM. In contrast, PRM and MM exhibited the highest values of traits related to production, IWUE, and WP (Table 3). Moreover, the response of different traits to MT varied with irrigation regime. For example, compared with NM treatment, the highest increase in the three growth traits was observed with PRM under the FL regime and with PFM under the LM regime, while the highest increase in traits of wheat production, IWUE, and WP was found with PRM, and the lowest increase was observed with PFM under both irrigation regimes (Figure 5 and Figure 6). These findings demonstrated that (1) PFM is likely to be an effective practice during the early growth stages when the air temperature is low. However, its performance failed to compete with those of the three plant residue MT (PRM, WSM, and MM) during the reproductive growth stages under the LM regime when the air temperature is high, (2) compared to PFM, the different MT using plant residues slightly improved the growth, production, and WUE of wheat under the FL regime, (3) PRM is more effective at improving growth and production of wheat than WSM, while the latter is more effective than PFM but less effective than MM at enhancing the production and WUE of wheat under FL and LM regimes, and (4) the NM treatment failed to compete with any MT, particularly MT with plant residues, under both irrigation regimes. These findings can be explained as follows. First, due to low air temperature during early growth stage, plastic film mulching often significantly increase the moisture and temperature of the topsoil [7,39,82,83,84], which are necessary for enhancing the early seedling growth of wheat. However, prolonged retention of high temperature underneath the plastic film during reproductive growth stages with the high air temperature, leading to root and leaf senescence and subsequent poor wheat seed development as was evidenced by less GNPS, and low TGW and HI, particularly under the LM regime (Figure 5 and Figure 6). This might explain why the positive impact of PFM treatment on wheat tended to be higher in their early than late growth stages. Second, MT using different plant residues performed better than PFM under the FL regime, probably because mulching with plant residues not only sustains an optimum soil water content in the root zone, but also improves various soil physical, chemical, and biological proprieties, as well as nutrient use efficiency by promoting their slow releasing and providing additional nutrient source for plants [39,40,41,42,43,44,45,46,85,86,87]. Decomposition rate of plant residue, which is always rapid under high soil moisture content, and the type of plant residues are the two key factors determining the amounts of nutrients and the type of minerals it releases into the soil, thus, contributing to the benefits of plant residue mulching [48,88]. This might explain why plant residue mulching was more effective than PFM at enhancing the production, IWUE, and WP of wheat under the FL regime. Additionally, it might explain why palm residues mulch alone (PRM) or in combination with wheat straw (MM) were more effective than WSM alone at improving the growth and production of wheat under both irrigation regimes. Third, the end crop production is closely associated with soil temperature and water content, especially at relatively sensitive growth stages. Crop residue mulching typically forms a physical barrier between the soil surface and atmosphere, blocking the solar radiation reaching the topsoil surface, and reducing both available energy for soil evaporation and air convection on the soil surface. Therefore, this practice ultimately maintains favorable soil water content and soil temperature in the crop root zone during high air-temperature conditions [6,81,84]. Maintaining these favorable conditions during wheat reproductive growth stages when air temperature is high could explain why crop residue mulch rather than plastic film or bare soil treatments was more effective at enhancing the production, IWUE, and WP of wheat, particularly under the LM regime.

4.3. Optimal Combinations between Tillage and Mulching Practices for Enhanced Growth, Production, and WP under DI Conditions

Determining the optimal combinations between tillage and mulching practices could further enhance the growth, production, and WP of wheat, particularly under the LM regime. Ky values, which determines the acceptance or rejection of reduction degree in growth and/or yield caused by decreased irrigation water supply [66,89], represent a practical way to identify optimal couplings between tillage and mulching practices under the LM regime. Generally, Ky values < 1 indicate that a decrease in growth and yield caused by decline in irrigation water supply is insignificant and can be ignored, and vice versa when Ky values are > 1 [2,90]. The results from the two growing seasons in this study showed that Ky values for pooled data based on PDW (KyPDW) were < 1, while those based on GY (KyGY) were slightly > 1 (1.04 and 1.11 in first and second seasons, respectively) (Figure 7), which were still comparatively lower than the 1.15 reported by Doorenbos and Kassam [66] for spring wheat. This finding indicates that the growth and production of wheat could be improved under the LM regime in arid and semiarid countries through optimal combinations of tillage and mulching practices. This hypothesis was supported by the wide range of Ky values observed among the different mulching practices in both tillage practices under the LM regime (Table 4). Generally, mulching the soil surface helped cushion against the negative impacts of DI on wheat growth and production, while the effectiveness of mulching materials for cushioning against the adverse DI effects depended on tillage practices (Table 4). All mulched treatments helped cushion against the negative impacts of DI on plant growth and GY (KyPDW and KyGY < 1) when integrated with RT practice. However, under CT, MT with wheat straw (WSM) failed to cushion against the negative impacts of DI on growth and GY (KyPDW and KyGY > 1). In contrast, mulching with PFM and a mixture of palm residues and wheat straw (MM) cushioned against the negative impacts of DI on plant growth (KyPDW < 1) under CT, but failed to cushion against the adverse DI effects on GY (KyGY > 1). KyPDW and KyGY values for NM treatment were significantly > 1, but significantly < 1 for PRM under both tillage practices (Table 4). These findings indicate that tillage practices and mulching materials are crucial for cushioning against the adverse impacts of the LM regime on growth and production of wheat crop under arid conditions. The effectiveness of RT at improving different soil physical, chemical, and biological properties, for optimum moisture and soil heat status [5,6,60,61,71,80,81,84] could explain why this practice is more effective than CT at cushioning the negative impacts of the LM regime on growth and production of wheat crop when integrated with MT. The gradual weakening of WSM effectiveness at reducing soil evaporation and maintaining soil water content over time through natural decomposition process [5,6,60], could explain why wheat straw is a less effective mulching material for mitigating the adverse impacts of the LM regime on both wheat growth and production under CT practice, which further contributes to increased soil evaporation and reduced soil water content. Integrating plastic film mulching with CT significantly increased soil temperature, especially in the middle and late growth stages when the air temperature is high. This could explain why PFM treatment failed to mitigate the negative impacts of the LM regime on GY (KyGY > 1).
Crop water production function, which define the response of growth and GY to varying levels of ET, also represent a practical way of assessing the efficiency of different water management practices that aimed at enhancing growth and production of a given crop under varying levels of water input [91,92,93]. Our results indicated a curvilinear relationship of PDW, GY, WP, and IWUE with ET for pooled data of T, M, and I treatments (Figure 8). This indicates that different tillage and mulching practices have significant impacts on the growth, production, and WP of wheat under arid conditions by indirectly impacting ET and directly influencing SWS, soil temperature, and soil evaporation, particularly during the sensitive phenological crop stages. These observations are consistent with those reported by Yang et al. [26] for dryland wheat under PFM and DI practices. Similarly, our results agree with those of dryland wheat [94] and dryland potato [95] under tillage and mulching practices, which showed that quadratic polynomial relationship could best describe the relationship between yield and ET. The observed curvilinear relationship in this study indicates that PDW, GY, IWUE, and WP of wheat under different tillage and mulching practices does not always increase with increasing ET and amount of irrigation. In this study, PDW, GY, IWUE, and WP were decreased when ET values exceeded a certain critical value, which was 382.5 mm, 478.0 mm, 493.3 mm, and 477.5 mm in the first season and 425.0 mm, 460.8 mm, 526.1 mm, and 558.3 mm in the second season, respectively (Figure 8). These findings suggest that wheat crop required about 400–500 mm of water during the entire growth period. Thus, this obtained ET amount could form a reference for adjusting the irrigation quota to improve the sustainability of wheat production and WUE in arid and semiarid conditions. The ET values reported in this study are comparable with those of Yang et al. [26], who reported that 400 mm is the recommended input of spring wheat during the entire growth period under the combination of film mulching practice and regulated irrigation in Northwest China.
The association of PDW and GY with WP is another practical way of determining the optimal water management practices in arid and semiarid regions [92,96]. Linear and to some extent curvilinear have been reported as the best models for describing the relationship between GY and WP. Based on R2 values obtained in this study, the polynomial model was selected as the best model to describe the relationship of PDW and GY with WP and IWUE for pooled data of T, M, and I treatments (Figure 9). The curvilinear relationship implied that WP and IWUE did not always increase with increasing PDW or GY. About 40–60% of the variation in WP and IWUE was not explained by PDW or GY in this study (Figure 9), suggesting that other factors could explain the remaining variation under tillage and mulching practices. The combination of RT and mulching practices tended to simultaneously maximize GY and WUE by reducing water loss through soil E and leaching beneath the root zone, as well as enhancing soil water-holding capacity and optimizing soil heat status. This suggested that SWS and soil temperature in the root zone could potentially be other additional factors explaining the variation in WP and IWUE under different tillage and mulching practices.
A linear and significant relationship between SWS at different soil depth measured before irrigation, and PDW and GY was observed in this study, while curvilinear relationships existed between SWS, and IWUE and WP (Figure 10). These findings indicate that improving the growth and production of wheat under the LM regime directly depends on the effectiveness of the integrated tillage and mulching practices for conserving more soil moisture. Thus, SWS changes in the root zone could result in corresponding linear changes in wheat growth and production. The relationship slope of SWS with PDW or GY indicated that PDW and GY increased by 0.30–0.74 g plant−1 and 0.32–0.80 ton ha−1, respectively, for each 10 mm increase in SWC in the root zone (Table 5). However, the curvilinear relationships of the root zone SWS with IWUE or WP indicated that the WUE of wheat varied substantially and significantly under different combinations of tillage and mulching practices, and the variation was not only dependent on the ability of combinations to conserve more soil moisture in the root zone, but also their capacity to achieve high GY. For instance, although PFM conserved more soil moisture at different soil depth than the three plant residue MT (WSW, PRM, and MM; Figure 3), the GY of plant residue MT was higher than those for PFM, which produced grater IWUE and WP in the three plant residue MT than in PFM treatment (Table 3). The reduction in GY under PFM relative to plant residue MT might be because PFM caused higher soil temperature in the root zone during reproductive growth stages, which together with high air temperature during this stage led to root and leaf senescence and subsequent poor seed development and lower crop production [7,84]. Additionally, high soil temperature underneath the plastic film during early growth stage caused rapid growth of wheat as evidenced by high GLA and PDW under PFM treatment (Table 3). Such rapid growth cause more nutrients uptake during early wheat growth stage, resulting in depleted nutrients in the late growth stage and subsequent low wheat production. However, plant residue MT not only improved SWS by reducing soil evaporation, but also helped decrease the surface soil temperature during high air temperature. Plant residue mulching also improved the nutrient availability for plants during reproductive growth stages, which ultimately caused higher GY as well as greater IWUE and WP. Overall, these observations indicated that SWS is not the only reason for enhancing IWUE and WP under MT. This might explain why the relationship of SWS with IWUE and WP was quadratic and while the variation in IWUE and WP under MT could be explained by SWS, GY, and other factors.

5. Conclusions

This study was conducted during two seasons to evaluate the effects of different tillage and mulching practices on sustainable production and WP of wheat in Saudi Arabia as a typical arid country. Based on the overall results of this study, we found that the different tillage and mulching practices had significant effects on SWS at different soil depths and measured time points, with RT storing more water than CT in the top 40 cm soil layer, while different MT followed the order of PFM ≈ PRM > MM > WSM > NM under the LM regime. PFM effectively increased SWS and improved the traits related to wheat growth, however, it generated lower values for traits related to production, IWUE, and WP compared to treatments mulched with plant residues. The two tillage practices showed no significant difference in all traits under the FL regime, while all traits increased by 8.0–18.8% in RT than in CT under the LM regime. Ky values indicated that the combination of any tillage practices with PRM or combination of RT with any mulching practices could effectively improve growth and enhance wheat production under the LM regime as the treatments produced KyPDW and KyGY values < 1. The relationship of ET with PDW, GY, WP, and IWUE indicated that wheat required an ET of 403.8, 469.4, 509.7, and 517.9 mm, respectively to achieve the highest values for these traits under different tillage and mulching practices. PDW and GY were linearly and strongly correlated (R2 range: 0.57–0.92), while IWUE and WP were characterized by a second-order polynomial and moderate correlation (R2 range: 0.29–0.54) with SWS at different soil depths measured before irrigation. Overall, soil conservation practices, including RT integrated with plant residues mulching, particularly palm residues, which are available in sufficient amount in Saudi Arabia, can serve as a feasible and sustainable strategy for sustaining crop production system in a typical arid country, such as Saudi Arabia.

Author Contributions

Conceptualization, S.E.-H., Y.R., B.A., M.A.M., and E.T.; methodology, S.E.-H., B.A., S.M., M.A.M., and Y.R.; software, S.E.-H., B.A., S.M., and E.T.; validation, S.E.-H., Y.R., B.A., M.A.M., and E.T.; formal analysis, S.E.-H., B.A., Y.R., S.M., and E.T.; investigation, S.E.-H., Y.R., B.A., M.A.M., and E.T.; resources, S.E.-H., Y.R., E.T., S.M., and M.A.M.; data curation, S.E.-H., B.A., E.T., S.M., M.A.M., and Y.R.; writing—original draft preparation, S.E.-H., and B.A.; writing—review and editing, S.E.-H.; visualization, S.E.-H., B.A., M.A.M., Y.R., and E.T.; supervision, S.E.-H.; project administration, S.E.-H.; funding acquisition, S.E.-H. All authors have read and agreed to the published version of the manuscript.

Funding

This project was funded by the National Plan for Science, Technology, and innovation (MAARIFAH), King Abdul-Aziz City for Science and Technology, Kingdom of Saudi Arabia, Award Number (12-AGR2901-02).

Institutional Review Board Statement

Not applicable.

Informed Consent Statement

Not applicable.

Data Availability Statement

All data are presented within the article.

Acknowledgments

The authors extend their appreciation to the National Plan for Science, Technology, and innovation (MAARIFAH) at the King Abdul-Aziz City for Science and Technology, Saudi Arabia for funding this work through Award Project No. (12-AGR2901-02).

Conflicts of Interest

The authors declare no conflict of interest.

References

  1. Wei, T.; Dong, Z.; Zhang, C.; Ali, S.; Chen, X.; Han, Q.; Zhang, F.; Jia, Z.; Zhang, P.; Ren, X. Effects of rainwater harvesting planting combined with deficiency irrigation on soil water use efficiency and winter wheat (Triticum aestivum L.) yield in a semiarid area. Field Crops Res. 2018, 218, 231–242. [Google Scholar] [CrossRef]
  2. El-Hendawy, S.E.; Al-Suhaibani, N.; Elsayed, S.; Refay, Y.; Alotaibi, M.; Dewir, Y.H.; Hassan, W.; Schmidhalter, U. Combining biophysical parameters, spectral indices and multivariate hyperspectral models for estimating yield and water productivity of spring wheat across different agronomic practices. PLoS ONE 2019, 14, e0212294. [Google Scholar]
  3. Akhtar, K.; Wang, W.; Khan, A.; Ren, G.; Afridi, M.Z.; Feng, Y.; Yang, G. Wheat straw mulching offset soil moisture deficient for improving physiological and growth performance of summer-sown soybean. Agric. Water Manag. 2019, 211, 16–25. [Google Scholar] [CrossRef]
  4. Abdallah, A.M.; Jat, H.S.; Choudhary, M.; Abdelaty, E.F.; Sharma, P.C.; Jat, M.L. Conservation agriculture effects on soil water holding capacity and water-saving varied with management practices and agroecological conditions: A Review. Agronomy 2021, 11, 1681. [Google Scholar] [CrossRef]
  5. Dai, Z.; Hu, J.; Fan, J.; Fu, W.; Hao, M. No-tillage with mulching improves maize yield in dryland farming through regulating soil temperature, water and nitrate-N. Agric. Ecosyst. Environ. 2021, 309, 107288. [Google Scholar] [CrossRef]
  6. Ding, J.; Wu, J.; Ding, D.; Yang, Y.; Gao, C.; Hu, W. Effects of tillage and straw mulching on the crop productivity and hydrothermal resource utilization in a winter wheat-summer maize rotation system. Agric. Water Manag. 2021, 254, 106933. [Google Scholar] [CrossRef]
  7. Yin, W.; Chai, Q.; Guo, Y.; Fan, H.; Fan, Z.; Hu, F.; Zhao, C.; Yu, A.; Coulter, J.A. No tillage with plastic re-mulching maintains high maize productivity via regulating hydrothermal effects in an arid region. Front. Plant Sci. 2021, 12, 649684. [Google Scholar] [CrossRef] [PubMed]
  8. Kader, M.A.; Singha, A.; Begum, M.A.; Jewel, A.; Khan, F.H.; Khan, N.I. Mulching as water-saving technique in dryland agriculture: Review article. Bull. Natl. Res. Cent. 2019, 43, 147. [Google Scholar] [CrossRef]
  9. Shen, Q.; Ding, R.; Du, T.; Tong, L.; Li, S. Water use effectiveness is enhanced using film mulch through increasing transpiration and decreasing evapotranspiration. Water 2019, 11, 1153. [Google Scholar] [CrossRef]
  10. Mak-Mensah, E.; Obour, P.B.; Essel, E.; Wang, Q.; Ahiakpa, J.K. Influence of plastic film mulch with biochar application on crop yield, evapotranspiration, and water use efficiency in northern China: A meta-analysis. PeerJ 2021, 9, e10967. [Google Scholar] [CrossRef]
  11. Mirzaei, M.; Gorji Anari, M.; Razavy-Toosi, E.; Asadi, H.; Moghiseh, E.; Saronjic, N.; Rodrigo-Comino, J. Preliminary Effects of crop residue management on soil quality and crop production under different soil management regimes in corn-wheat rotation systems. Agronomy 2021, 11, 302. [Google Scholar] [CrossRef]
  12. Akhtar, K.; Wang, W.; Khan, A.; Ren, G.; Afridi, M.Z.; Feng, Y.; Yang, G. Wheat straw mulching with fertilizer nitrogen: An approach for improving soil water storage and maize crop productivity. Plant Soil Environ. 2018, 64, 330–337. [Google Scholar]
  13. Zhang, R.; Lei, T.; Wang, Y.; Xu, J.; Zhang, P.; Han, Y.; Hu, C.; Yang, X.; Sadras, V.; Zhang, S. Responses of yield and water use efficiency to the interaction between water supply and plastic film mulch in winter wheat-summer fallow system. Agric. Water Manag. 2022, 266, 107545. [Google Scholar] [CrossRef]
  14. Zhang, X.; Kamran, M.; Xue, X.; Zhao, J.; Cai, T.; Jia, Z.; Zhang, P.; Han, Q. Ridge-furrow mulching system drives the efficient utilization of key production resources and the improvement of maize productivity in the Loess Plateau of China. Soil Tillage Res. 2019, 190, 10–21. [Google Scholar] [CrossRef]
  15. Liu, Y.; Zhang, X.; Xi, L.; Liao, Y.; Han, J. Ridge-furrow planting promotes wheat grain yield and water productivity in the irrigated sub-humid region of China. Agric. Water Manag. 2020, 231, 105935. [Google Scholar] [CrossRef]
  16. El-Hendawy, S.; Alsamin, B.; Mohammed, N.; Al-Suhaibani, N.; Refay, Y.; Alotaibi, M.; Tola, E.; Mattar, M.A. Combining planting patterns with mulching bolsters the soil water content, growth, yield, and water use efficiency of spring wheat under limited water supply in arid regions. Agronomy 2022, 12, 1298. [Google Scholar] [CrossRef]
  17. Nepolean, T.; Kaul, J.; Mukri, G.; Mittal, S. Genomics-enabled next-generation breeding approaches for developing system-specific drought tolerant hybrids in maize. Front. Plant Sci. 2018, 9, 361. [Google Scholar] [CrossRef]
  18. Hokam, E.M.; El-Hendawy, S.E.; Schmidhalter, U. Drip irrigation frequency: The effects and their interaction with nitrogen fertilization on maize growth and nitrogen use efficiency under arid conditions. J. Agron. Crop Sci. 2011, 197, 186–201. [Google Scholar] [CrossRef]
  19. Ma, S.; Tong, L.; Kang, S.; Wang, S.; Wu, X.; Cheng, X.; Li, Q. Optimal coupling combinations between dripper discharge and irrigation interval of maize for seed production under plastic film-mulched drip irrigation in an arid region. Irrig. Sci. 2022, 40, 131–133. [Google Scholar] [CrossRef]
  20. Mphande, W.; Kettlewell, P.S.; Grove, I.G.; Farrell, A.D. The potential of antitranspirants in drought management of arable crops: A review. Agric. Water Manag. 2020, 236, 106143. [Google Scholar] [CrossRef]
  21. Tayyab, N.; Naz, R.; Yasmin, H.; Nosheen, A.; Keyani, R.; Sajjad, M.; Hassan, M.N.; Roberts, T.H. Combined seed and foliar pre-treatments with exogenous methyl jasmonate and salicylic acid mitigate drought induced stress in maize. PLoS ONE 2020, 15, e0232269. [Google Scholar] [CrossRef] [PubMed]
  22. Ghosh, U.K.; Islam, M.N.; Siddiqui, M.N.; Khan, M.A.R. Understanding the roles of osmolytes for acclimatizing plants to changing environment: A review of potential mechanism. Plant Signal. Behav. 2021, 16, e1913306. [Google Scholar] [CrossRef] [PubMed]
  23. Fahad, S.; Bajwa, A.A.; Nazir, U.; Anjum, S.A.; Farooq, A.; Zohaib, A.; Sadia, S.; Nasim, W.; Adkins, S.; Saud, S.; et al. Crop production under drought and heat stress: Plant responses and management options. Front. Plant Sci. 2017, 8, 1147. [Google Scholar] [CrossRef] [PubMed]
  24. Liu, G.; Liu, Y.; Hafeez, M.; Xu, D.; Vote, C. Comparison of two methods to derive time series of actual evapotranspiration using eddy covariance measurements in the southeastern Australia. J. Hydrol. 2012, 6, 454–455. [Google Scholar] [CrossRef]
  25. Wang, J.; Zhang, Y.; Gong, S.; Xu, D.; Juan, S.; Zhao, Y. Evapotranspiration, crop coefficient and yield for drip-irrigated winter wheat with straw mulching in North China Plain. Field Crops Res. 2018, 217, 218–228. [Google Scholar] [CrossRef]
  26. Yang, J.; Mao, X.; Wang, K.; Yang, W. The coupled impact of plastic film mulching and deficit irrigation on soil water/heat transfer and water use efficiency of spring wheat in Northwest China. Agric. Water Manag. 2018, 201, 232–245. [Google Scholar] [CrossRef]
  27. Rana, G.; Katerji, N. Measurement and estimation of actual evapotranspiration in the field under Mediterranean climate: A review. Eur. J. Agron. 2000, 13, 125–153. [Google Scholar] [CrossRef]
  28. Chen, S.; Zhang, X.; Sun, H.; Ren, T.; Wang, Y. Effects of winter wheat row spacing on evapotranpsiration, grain yield and water use efficiency. Agric. Water Manag. 2010, 97, 1126–1132. [Google Scholar] [CrossRef]
  29. Ma, D.; Chen, L.; Qu, H.; Wang, Y.; Misselbrook, T.; Jiang, R. Impacts of plastic film mulching on crop yields, soil water, nitrate, and organic carbon in Northwestern China: A meta-analysis. Agric. Water Manag. 2018, 202, 166–173. [Google Scholar] [CrossRef]
  30. Wang, X.; Wang, N.; Xing, Y.; Yun, J.; Zhang, H. Effects of plastic mulching and basal nitrogen application depth on nitrogen use efficiency and yield in maize. Front. Plant Sci. 2018, 9, 1446. [Google Scholar] [CrossRef]
  31. Gao, H.; Yan, C.; Liu, Q.; Li, Z.; Yang, X.; Qi, R. Exploring optimal soil mulching to enhance yield and water use efficiency in maize cropping in China: A meta-analysis. Agric. Water Manag. 2019, 255, 105741. [Google Scholar] [CrossRef]
  32. Wang, L.; Coulter, J.A.; Palta, J.A.; Xie, J.; Luo, Z.; Li, L.; Carberry, P.; Li, Q.; Deng, X. Mulching-induced changes in tuber yield and nitrogen use efficiency in potato in China: A meta-analysis. Agronomy 2019, 9, 793. [Google Scholar] [CrossRef] [Green Version]
  33. Prem, P.; Ranjan, P.; Seth, N.; Patle, G.T. Mulching techniques to conserve the soil water and advance the crop production—A Review. Curr. World Environ. 2020, 15, 10–30. [Google Scholar]
  34. Sun, D.; Li, H.; Wang, E.; He, W.; Hao, W.; Yan, C.; Li, Y.; Xurong Mei, X.; Zhang, Y.; Sun, Z.; et al. An overview of the use of plastic-film mulching in China to increase crop yield and water-use efficiency. Natl. Sci. Rev. 2020, 7, 1523–1526. [Google Scholar] [CrossRef]
  35. Zhou, L.M.; Li, F.M.; Jin, S.L.; Song, Y.J. How two ridges and the furrow mulched with plastic film affect soil water, soil temperature and yield of maize on the semiarid Loess Plateau of China. Field Crops Res. 2009, 113, 41–47. [Google Scholar] [CrossRef]
  36. Liu, E.; He, W.; Yan, C. ‘White revolution’ to ‘white pollution’—Agricultural plastic film mulch in China. Environ. Res. Lett. 2014, 9, 091001. [Google Scholar] [CrossRef]
  37. Yan, C.; Liu, E.; Shu, F.; Liu, Q.; Liu, S.; He, W. Review of agricultural plastic mulching and its residual pollution and prevention measures in China. J. Agric. Resour. Environ. 2014, 31, 95–102. [Google Scholar]
  38. Hou, X.Y.; Wang, F.X.; Han, J.J.; Kang, S.Z.; Feng, S.Y. Duration of plastic mulch for potato growth under drip irrigation in an arid region of Northwest China. For. Meteorol. 2010, 150, 115–121. [Google Scholar] [CrossRef]
  39. Dong, Q.; Yang, Y.; Yu, K.; Feng, H. Effects of straw mulching and plastic film mulching on improving soil organic carbon and nitrogen fractions, crop yield and water use efficiency in the Loess Plateau, China. Agric. Water Manag. 2018, 201, 133–143. [Google Scholar] [CrossRef]
  40. Akhtar, K.; Wang, W.; Ren, G.; Khan, A.; Nie, E.; Khan, A.; Feng, Y.; Yang, G.; Wang, H. Straw mulching with inorganic nitrogen fertilizer reduces soil CO2 and N2O emissions and improves wheat yield. Sci. Total Environ. 2020, 741, 140488. [Google Scholar] [CrossRef]
  41. Kong, D.; Liu, N.; Wang, W.; Akhtar, K.; Li, N.; Ren, G.; Feng, Y.; Yang, G. Soil respiration from fields under three crop rotation treatments and three straw retention treatments. PLoS ONE 2019, 14, e0219253. [Google Scholar]
  42. Wang, W.; Akhtar, K.; Ren, G.; Yang, G.; Feng, Y.; Yuan, L. Impact of straw management on seasonal soil carbon dioxide emissions, soil water content, and temperature in a semi-arid region of China. Sci. Total Environ. 2019, 652, 471–482. [Google Scholar] [CrossRef] [PubMed]
  43. Akhtar, K.; Wang, W.; Ren, G.; Khan, A.; Feng, Y.; Yang, G.; Wang, H. Integrated use of straw mulch with nitrogen fertilizer improves soil functionality and soybean production. Environ. Int. 2019, 132, 105092. [Google Scholar] [CrossRef]
  44. Bhattacharyya, P.; Barman, D. Crop residue management and greenhouse gases emissions in tropical rice lands. In Soil Management and Climate Change; Elsevier: Amsterdam, The Netherlands, 2018; pp. 323–335. [Google Scholar]
  45. Faiad, A.; Alsmari, M.; Ahmed, M.M.Z.; Bouazizi, M.L.; Alzahrani, B.; Alrobei, H. Date palm tree waste recycling: Treatment and processing for potential engineering applications. Sustainability 2022, 14, 1134. [Google Scholar] [CrossRef]
  46. Chatterjee, S.; Bandyopadhyay, K.K.; Pradhan, S.; Singh, R.; Datta, S.P. Effects of irrigation, crop residue mulch and nitrogen management in maize (Zea mays L.) on soil carbon pools in a sandy loam soil of indo-gangetic plain region. Catena 2018, 165, 207–216. [Google Scholar] [CrossRef]
  47. Das, T.K.; Sahrawat, Y.S.; Bhattacharyya, R.; Sudhishri, S.; Bandyopadhyay, K.K.; Sharma, A.R.; Jat, M.L. Conservation agriculture effects on crop and water productivity, profitability and soil organic carbon accumulation under a maize-wheat cropping system in the North-western Indo-Gangetic Plains. Field Crop Res. 2018, 215, 222–231. [Google Scholar] [CrossRef]
  48. Sarkar, S.; Skalicky, M.; Hossain, A.; Brestic, M.; Saha, S.; Garai, S.; Ray, K.; Brahmachari, K. Management of crop residues for improving input use efficiency and agricultural sustainability. Sustainability 2020, 12, 9808. [Google Scholar] [CrossRef]
  49. Schoenaul, J.J.; Campbell, C.A. Impact of crop residues on nutrient availability in conservation tillage systems. Can. J. Plant Sci. 1996, 76, 621–626. [Google Scholar] [CrossRef]
  50. Adimassu, Z.; Alemu, G.; Tamene, L. Effects of tillage and crop residue management on runoff, soil loss and crop yield in the humid highlands of ethiopia. Agric. Syst. 2019, 168, 11–18. [Google Scholar] [CrossRef]
  51. Moradi, A.; Teh, C.B.S.; Goh, K.J.; Husni, M.H.A.; Ishak, C.F. Decomposition and nutrient release temporal pattern of oil palm residues. Ann. Appl. Biol. 2014, 164, 208–219. [Google Scholar] [CrossRef]
  52. Raes, D.; Steduto, P.; Hsiao, T.C.; Fereres, E. Aquacrop-The FAO crop model to simulate yield response to water: II. Main algorithms and software description. Agron. J. 2009, 101, 438–447. [Google Scholar] [CrossRef]
  53. Zhang, P.; Wei, T.; Wang, H.; Wang, M.; Meng, X.; Mou, S.; Zhang, R.; Jia, Z.; Han, Q. Effects of straw mulch on soil water and winter wheat production in dryland farming. Sci. Rep. 2015, 5, 10725. [Google Scholar]
  54. Yang, H.; Wu, G.; Mo, P.; Chen, S.; Wang, S.; Xiao, Y.; Ma, H.A.; Wen, T.; Guo, X.; Fan, G. The combined effects of maize straw mulch and no-tillage on grain yield and water and nitrogen use efficiency of dry-land winter wheat (Triticum aestivum L.). Soil Tillage Res. 2020, 197, 104485. [Google Scholar] [CrossRef]
  55. Li, S.X.; Wang, Z.H.; Li, S.Q.; Gao, Y.J.; Tian, X.H. Effect of plastic sheet mulch, wheat straw mulch, and maize growth on water loss by evaporation in dryland areas of China. Agric. Water Manag. 2013, 116, 39–49. [Google Scholar] [CrossRef]
  56. Zhao, H.; Liu, J.; Chen, X.; Wang, Z. Straw mulch as an alternative to plastic film mulch: Positive evidence from dryland wheat production on the Loess Plateau. Sci. Total Environ. 2019, 676, 782–791. [Google Scholar] [CrossRef]
  57. Chen, S.; Zhang, X.; Sun, H.; Shao, L. Cause and mechanism of winter wheat yield reduction under straw mulch in the North China Plain. Chin. J. Eco-Agric. 2013, 21, 519–525. [Google Scholar] [CrossRef]
  58. Lafond, G.P.; Stumborg, M.; Lemke, R.; May, W.E.; Holzapfel, C.B.; Campbell, C.A. Quantifying straw removal through baling and measuring the long-term impact on soil quality and wheat production. Agron. J. 2009, 101, 529–537. [Google Scholar] [CrossRef]
  59. Liu, J.; Liu, L.; Fu, Q.; Zhang, L.; Xu, Q. Effects of straw mulching and tillage measures on the photosynthetic characteristics of maize leaves. Trans. ASABE 2019, 62, 851–858. [Google Scholar] [CrossRef]
  60. Peng, Z.; Wang, L.; Xie, J.; Li, L.; Coulter, J.A.; Zhang, R.; Luo, Z.; Kholova, J.; Choudhary, S. Conservation tillage increases water use efficiency of spring wheat by optimizing water transfer in a semi-arid environment. Agronomy 2019, 9, 583. [Google Scholar] [CrossRef]
  61. Guo, Y.; Yin, W.; Chai, Q.; Yu, A.; Zhao, C.; Fan, Z.; Fan, H.; Coulter, J.A. No tillage and previous residual plastic mulching with reduced water and nitrogen supply reduces soil carbon emission and enhances productivity of following wheat in arid irrigation areas. Field Crops Res. 2021, 262, 108028. [Google Scholar] [CrossRef]
  62. Su, Z.; Zhang, J.; Wu, W.; Cai, D.; Lv, J.; Jiang, G.; Huang, J.; Gao, J.; Hartmann, R.; Gabriels, D. Effects of conservation tillage practices on winter wheat water-use efficiency and crop yield on the Loess Plateau, China. Agric. Water Manag. 2007, 87, 307–314. [Google Scholar] [CrossRef]
  63. Zhao, X.; Liu, S.; Pu, C.; Zhang, X.; Xue, J.; Ren, Y.; Zhao, X.; Chen, F.; Lal, R.; Zhang, H. Crop yields under no-till farming in China: A meta-analysis. Eur. J. Agron. 2017, 84, 67–75. [Google Scholar] [CrossRef]
  64. Xiao, L.G.; Zhao, R.Q.; Kuhn, N.J. Straw mulching is more important than no tillage in yield improvement on the Chinese Loess Plateau. Soil Tillage Res. 2019, 194, 104314. [Google Scholar] [CrossRef]
  65. Allen, R.; Pereira, L.; Raes, D.; Smith, M. Crop Evapotranspiration. Guidelines for Computing Crop Water Requirements; Irrigation and Drainage Paper no. 56; FAO: Rome, Italy, 1998; 300p. [Google Scholar]
  66. Doorenbos, J.; Kassam, A. Yield Response to Water; Irrigation and Drainage Paper no. 33; FAO: Rome, Italy, 1979. [Google Scholar]
  67. Zhang, Q.P.; Wang, Z.N.; Miao, F.H.; Wang, G.L. Dryland maize yield and water use efficiency responses to mulching and tillage practices. Agron. J. 2017, 109, 1196–1209. [Google Scholar] [CrossRef]
  68. Muñoz, K.; Buchmann, C.; Meyer, M.; Schmidt-Heydt, M.; Steinmetz, Z.; Diehl, D.; Thiele-Bruhn, S.; Schaumann, G.E. Physicochemical and microbial soil quality indicators as affected by the agricultural management system in strawberry cultivation using straw or black polyethylene mulching. Appl. Soil Ecol. 2017, 113, 36–44. [Google Scholar] [CrossRef]
  69. Mondal, M.; Garai, S.; Banerjee, H.; Sarkar, S.; Kundu, R. Mulching and nitrogen management in peanut cultivation: An evaluation of productivity, energy trade-off, carbon footprint and profitability. Energy Ecol. Environ. 2021, 6, 133–147. [Google Scholar] [CrossRef]
  70. Daryanto, S.; Wang, L.X.; Jacinthe, P.A. Impacts of no-tillage management on nitrate loss from corn, soybean, and wheat cultivation: A meta-analysis. Sci. Rep. 2017, 7, 12117. [Google Scholar] [CrossRef]
  71. Liu, S.; Li, J.; Zhang, X. Simulations of soil water and heat processes for no tillage and conventional tillage systems in mollisols of China. Land 2022, 11, 417. [Google Scholar] [CrossRef]
  72. Wu, Y.; Huang, F.Y.; Zhang, C.; Jia, Z.K. Effects of different mulching patterns on soil moisture, temperature, and maize yield in a semi-arid region of the Loess Plateau, China. Arid Land Res. Manag. 2016, 30, 490–504. [Google Scholar] [CrossRef]
  73. Yin, W.; Fan, Z.; Hu, F.; Yu, A.; Zhao, C.; Qiang Chai, Q.; Coulter, J.A. Innovation in alternate mulch with straw and plastic management bolsters yield and water use efficiency in wheat-maize intercropping in arid conditions. Sci. Rep. 2019, 9, 6364. [Google Scholar] [CrossRef]
  74. Ibrahim, M.; Khan, A.; Anjum Ali, W.; Akbar, H. Mulching techniques: An approach for offsetting soil moisture deficit and enhancing manure mineralization during maize cultivation. Soil Tillage Res. 2020, 200, 104631. [Google Scholar] [CrossRef]
  75. Lan, X.; Chai, S.; Coulter, J.A.; Cheng, H.; Chang, L.; Huang, C.; Li, R.; Chai, Y.; Li, Y.; Ma, J.; et al. Maize straw strip mulching as a replacement for plastic film mulching in maize production in a semiarid region. Sustainability 2020, 12, 6273. [Google Scholar] [CrossRef]
  76. El-Hendawy, S.E.; Abd El-Lattief, E.A.; Ahmed, A.S.; Schmidhalter, U. Irrigation rate and plant density effects on yield and water use efficiency of drip-irrigated corn. Agric. Water Manag. 2008, 95, 836–844. [Google Scholar] [CrossRef]
  77. Soundharajan, B.; Sudheer, K.P. Deficit irrigation management for rice using crop growth simulation model in an optimization framework. Paddy Water Environ. 2009, 7, 135–149. [Google Scholar] [CrossRef]
  78. M’hamed, H.C.; Rezig, M.; Mbarek, B.N. Water use efficiency of durum wheat (Triticum durum Desf) under deficit irrigation. J. Agric. Sci. 2015, 7, 238–249. [Google Scholar]
  79. Salem, H.M.; Valero, C.; Muñoz, M.Á.; Rodríguez, M.G.; Silva, L.L. Short-term effects of four tillage practices on soil physical properties, soil water potential, and maize yield. Geoderma 2015, 237, 60–70. [Google Scholar] [CrossRef]
  80. Jug, D.; Đurđević, B.; Birkás, M.; Brozović, B.; Lipiec, J.; Vukadinović, V.; Jug, I. Effect of conservation tillage on crop productivity and nitrogen use efficiency. Soil Tillage Res. 2019, 194, 104327. [Google Scholar] [CrossRef]
  81. Saurabh, K.; Rao, K.K.; Mishra, J.S.; Kumar, R.; Poonia, S.P.; Samal, S.K.; Roy, H.S.; Dubey, A.K.; Choubey, A.K.; Mondal, S.; et al. Influence of tillage based crop establishment and residue management practices on soil quality indices and yield sustainability in rice-wheat cropping system of Eastern Indo-Gangetic Plains. Soil Tillage Res. 2021, 206, 104841. [Google Scholar] [CrossRef]
  82. Ghosh, P.K.; Dayal, D.; Bandyopadhyay, K.K.; Mohanty, M. Evaluation of straw and polythene mulch for enhancing productivity of irrigated summer groundnut. Field Crops Res. 2006, 99, 76–86. [Google Scholar] [CrossRef]
  83. Qin, W.; Hu, C.; Oenema, O. Soil mulching significantly enhances yields and water and nitrogen use efficiencies of maize and wheat: A meta-analysis. Sci. Rep. 2015, 5, 16210. [Google Scholar] [CrossRef]
  84. Yin, W.; Chai, Q.; Guo, Y.; Fan, Z.; Hu, F.; Fan, H.; Zhao, C.; Yu, A.; Coulter, J.A. Straw and plastic management regulate air-soil temperature amplitude and wetting-drying alternation in soil to promote intercrop productivity in arid regions. Field Crops Res. 2020, 249, 107758. [Google Scholar] [CrossRef]
  85. Xie, J.; Wang, L.; Li, L.; Anwar, S.; Luo, Z.; Zechariah, E.; Kwami Fudjoe, S. Yield, economic benefit, soil water balance, and water use efficiency of intercropped maize/potato in responses to mulching practices on the semiarid loess plateau. Agriculture 2021, 11, 1100. [Google Scholar] [CrossRef]
  86. Guan, X.K.; Wei, L.; Turner, N.C.; Ma, S.C.; Yang, M.D.; Wang, T.C. Improved straw management practices promote in situ straw decomposition and nutrient release, and increase crop production. J. Clean. Prod. 2020, 250, 119514. [Google Scholar] [CrossRef]
  87. Qin, X.; Huang, T.; Lu, C.; Dang, P.; Zhang, M.; Guan, X.K.; Wen, P.F.; Wang, T.C.; Chen, Y.; Siddique, K.H.M. Benefits and limitations of straw mulching and incorporation on maize yield, water use efficiency, and nitrogen use efficiency. Agric. Water Manag. 2021, 256, 107128. [Google Scholar] [CrossRef]
  88. Torma, S.; Vilček, J.; Lošák, T.; Kužel, S.; Martensson, A. Residual plant nutrients in crop residues—An important resource. Acta Agric. Scand. 2018, 68, 358–366. [Google Scholar] [CrossRef]
  89. Lovelli, S.; Perniola, M.; Ferrara, A.; di Tommaso, T. Yield response factor to water (Ky) and water use efficiency of Carthamus tinctorius L. and Solanum melongena L. Agric. Water Manag. 2007, 92, 73–80. [Google Scholar] [CrossRef]
  90. Steduto, P.; Hsiao, T.C.; Fereres, E.; Raes, D. Crop Yield Response to Water; FAO Irrigation and Drainage Paper 66; Food and Agriculture Organization of the United Nations: Rome, Italy, 2012; p. 503. [Google Scholar]
  91. Liu, W.Z.; Hunsaker, D.J.; Li, Y.S.; Xie, X.Q.; Wall, G.W. Interrelations of yield, evapotranspiration, and water use efficiency from marginal analysis of water production functions. Agric. Water Manag. 2002, 56, 143–151. [Google Scholar] [CrossRef]
  92. El-Hendawy, S.E.; Schmidhalter, U. Optimal coupling combinations between irrigation frequency and rate for drip-irrigated maize grown on sandy soil. Agric. Water Manag. 2010, 97, 439–448. [Google Scholar] [CrossRef]
  93. Greaves, G.E.; Wang, Y.M. Yield response, water productivity, and seasonal water production functions for maize under deficit irrigation water management in southern Taiwan. Plant Prod. Sci. 2017, 20, 353–365. [Google Scholar] [CrossRef]
  94. Wang, L.; Shangguan, Z. Water–use efficiency of dryland wheat in response to mulching and tillage practices on the Loess Plateau. Sci. Rep. 2015, 5, 12225. [Google Scholar] [CrossRef]
  95. Li, Q.; Li, H.; Zhang, S. Yield and water use efficiency of dryland potato in response to plastic film mulching on the Loess Plateau. Acta Agric. Scand. Sect. B Soil Plant Sci. 2018, 68, 175–188. [Google Scholar]
  96. Huang, M.; Gallichand, J.; Zhong, L. Water-yield relationships and optimal water management for winter wheat in the Loess Plateau of China. Irrig. Sci. 2004, 23, 47–54. [Google Scholar] [CrossRef]
Figure 1. Plot layouts of different tillage and mulching practices. (A) conventional tillage practice prepared by chisel plowing; (B) conventional tillage practice prepared by disk harrowing to a depth of 15 cm; (C) reduced tillage practice prepared by perturbing the soil to a depth of 5 cm using a hand rotary cultivator; (D) non-mulched (NM); (E) plastic film mulch (PFM); (F) wheat straw mulch (WSM); (G) palm residues mulch (PRM); and (H) mixture of wheat straw and palm residues at 50/50 ratio (MM). The pictures from D to H present the wheat growth under different mulching practices at the different wheat growth stages.
Agronomy 12 02235 g001
Figure 2. Comparison of soil water storage before irrigation, one week after irrigation, and two weeks after irrigation between conventional tillage (CT) and reduced tillage (RT) practices at different soil depths under limited (LM) and full irrigation (FL) regimes. Bars with different letters are significantly different from each another on the basis of Duncan’s multiple range test at p ≤ 0.05.
Agronomy 12 02235 g002
Figure 3. Comparison of soil water storage before irrigation, one week after irrigation, and two weeks after irrigation between different mulching practices at different soil depths under limited (LM)and full irrigation (FL) regimes. Bars with different letters are significantly different from each another on the basis of Duncan’s multiple range test at p ≤ 0.05. Abbreviations in the figure indicate no mulch (NM), plastic film mulch (PFM), wheat straw mulch (WSM), palm residues mulch (PRM), and a mixture of wheat straw and palm residues at 50/50 ratio (MM). Bars with different letters are significantly different from each another on the basis of Duncan’s multiple range test at p ≤ 0.05.
Agronomy 12 02235 g003
Figure 4. Response of different traits of wheat to the interaction between tillage practices and irrigation regimes in 2019−2020 (S1) and 2020−2021 (S2) growing seasons. Abbreviations in the figure indicate conventional tillage (CT), reduced tillage (RT), full irrigation regime (FL, 1.00 ET) and limited irrigation regime (LM, 0.50 ET). The different letters indicate statistical significance at the 0.05 level.
Agronomy 12 02235 g004
Figure 5. Response of different traits of wheat to the interaction between mulching practices and irrigation regimes in 2019−2020 growing season. Abbreviations in the figure indicate no mulch (NM), plastic film mulch (PFM), wheat straw mulch (WSM), palm residues mulch (PRM), and a mixture of wheat straw and palm residues at 50/50 ratio (MM), full irrigation regime (FL, 1.00 ET) and limited irrigation regime (LM, 0.50 ET). The different letters indicate statistical significance at the 0.05 level.
Agronomy 12 02235 g005
Figure 6. Response of different traits of wheat to the interaction between mulching practices and irrigation regimes in 2020−2021 growing season. Abbreviations in the figure indicate no mulch (NM), plastic film mulch (PFM), wheat straw mulch (WSM), palm residues mulch (PRM), and a mixture of wheat straw and palm residues at 50/50 ratio (MM), full irrigation (FL, 1.00 ET) and limited irrigation (LM, 0.50 ET) regimes. The different letters indicate statistical significance at the 0.05 level.
Agronomy 12 02235 g006
Figure 7. Yield response factor (ky) for pooled data of tillage, irrigation, and mulching treatments shown as the relationship between the relative decrease in plant dry weight (PDW) (A) or grain yield GY (B) and the corresponding relative decrease in evapotranspiration (ET) for 2019−2020 (S1) and 2020−2021 (S2) growing seasons. *** indicate significant at p < 0.001.
Agronomy 12 02235 g007
Figure 8. The fit regression models between seasonal evapotranspiration (ET) and plant dry weight (A), grain yield (B), water productivity (WP, C), and irrigation water use efficiency (IWUE, D) in the first season (S1) and second season (S2). *, **, and *** indicate significant at p < 0.05, 0.01, and 0.001, respectively; ns indicates not significant.
Agronomy 12 02235 g008
Figure 9. The fit regression models between of plant dry weight (A,B) and grain yield (C,D) with water productivity (WP) and irrigation water use efficiency (IWUE) in the first season (S1) and second season (S2). **, and *** indicate significant at p < 0.01 and 0.001, respectively.
Agronomy 12 02235 g009
Figure 10. Functional relationship between the soil water storage measured before irrigation at 64 (circle green), 91 (circle blue), and 110 (circle pink) days after sowing at deferent soil depth and grain yield (GY), plant dry weight (PDW), irrigation water use efficiency (IWUE), and water productivity (WP) using the pooled data of tillage, mulching, and irrigation treatments. *, **, and *** indicate significant at p < 0.05, 0.01, and 0.001, respectively; ns indicates not significant.
Agronomy 12 02235 g010
Table 1. Average monthly climatic data at the experimental site during the growing period of wheat in 2019-2020 (S1) and 2020-2021 (S2).
MonthsTemperature (°C)Precipitation
(mm)
Relative
Humidity
(%)
MinimumMaximumAverage
S1S2S1S2S1S2S1S2S1S2
December10.409.8323.9423.0717.1716.450.371.1444.3248.17
January6.978.3121.2722.3414.1215.321.443.6638.9741.96
February10.0210.0825.7524.1417.8817.110.001.4727.8440.59
March13.4214.9529.3732.3021.4023.630.020.3224.6520.23
April19.5019.9534.0635.5226.7827.746.251.7232.1616.65
Table 2. Analysis of variance (F-values) on the effects of tillage, irrigation, mulching, and their interaction on different plant traits of wheat for two growing seasons.
SourcedfGLAPDWRWCGNPSTGW
2019–2020
Tillage (T)16.18 ns0.531 ns3.69 ns25.62 *2.78 ns
Irrigation (I)1635.45 ***6933.9 ***5249.7 ***369.8 ***2917.7 ***
I × T126.71 **118.96 ***523.73 ***27.27 **282.44 *
Mulch (M)423.40 ***16.33 ***13.65 ***24.67 ***47.86 ***
M × T40.444 ns0.350 ns0.190 ns0.693 ns0.318 ns
M × I49.17 ***4.72 **5.81 **10.62 ***0.563 **
M × I × T40.853 ns0.252 ns0.263 ns0.170 ns0.718 ns
2020–2021
Tillage (T)115.19 ns7.66 ns12.89 ns22.88 *3.06 ns
Irrigation (I)1454.27 ***901.1 ***356.85 ***298.34 ***2589.9 ***
I × T19.45 *23.84 **37.71 **30.68 **236.35 ***
Mulch (M)427.48 ***24.94 ***10.48 ***20.52 ***18.17 ***
M × T41.43 ns0.607 ns0.399 ns0.099 ns0.977 ns
M × I410.66 ***10.76 ***4.25 **6.10 ***2.93 *
M × I × T40.470 ns0.183 ns0.368 ns0.50 ns0.464 ns
SourcedfGYBYHIIWUEWP
2019–2020
Tillage (T)169.28 *48.44 *0.006 ns228.46 **233.02 **
Irrigation (I)1911.25 ***1211.7 ***23.21ns124.93 ***3.61 ns
I × T19.51 *12.01 *0.248 ns26.05 **31.60 **
Mulch (M)428.48 ***23.27 ***5.06 **33.54 ***39.85 ***
M × T40.204 ns0.186 ns0.440 ns0.192 ns0.384 ns
M × I43.45 *0.828 ***9.65 ***12.49 ***14.67 ***
M × I × T40.070 ns0.511 ns0.608 ns0.080 ns0.396 ns
2020–2021
Tillage (T)150.24 *1113.26 ***3.82 ns87.03 *76.67 *
Irrigation (I)12947.8 ***1854.3 ***1.31 ns368.6 ***0.770 ns
I × T125.11 **12.34 *2.32 ns110.68 ***84.60 ***
Mulch (M)434.74 ***19.35 ***16.66 ***47.01 ***50.39 ***
M × T40.375 ns0.080 ns0.386 ns0.303 ns0.504 ns
M × I45.25 **4.61 **21.68 ***19.01 ***19.32 ***
M × I × T40.181 ns0.322 ns0.122 ns0.118 ns0.411 ns
Abbreviations in the table indicate green leaf area per plant (GLA), plant dry weight (PDW), relative water content (RWC), number of grains per spike (GNPS), 1000-grain weight (TGW), grain yield per ha (GY), biological yield per ha (BY), harvest index (HI), irrigation water use efficiency (IWUE), and water productivity (WP). *, **, ***, ns: significant at p ≤ 0.05, 0.01, 0.001, or not significant, respectively, in the F-test.
Table 3. Impacts of tillage, irrigation, and mulching treatments on different plant traits of wheat in two growing seasons.
TreatmentsGLAPDWRWCGNPSTGWGYBYHIIWUEWP
2019/2020
NM146.9 c6.92 c78.15 c38.57 d40.83 d6.15 d18.73 c32.72 b12.23 d10.90 d
PFM173.7 ab8.07 a83.57 a43.52 c42.73 c6.89 c20.47 b33.19 b14.04 c13.37 c
WSM168.4 b7.64 b80.55 b45.16 c44.64 b7.28 b20.65 b35.70 a15.05 b13.67 bc
PRM182.7 a8.19 a81.96 b50.04 a47.84 a7.69 a22.04a35.39 a16.06 a14.67 a
MM169.9 b8.00 ab81.57 b47.05 b46.49 ab7.44 ab21.57a34.97 a15.44 ab14.04 ab
FL205.4 a9.27 a88.50 a50.92 a52.80 a8.84 a26.08a33.96 a13.20 b13.12 a
LM131.2 b6.25 b73.82 b38.81 b36.21 b5.34 b15.30b34.82 a15.92 a13.54 a
CT163.2 a7.73 a80.54 a43.62 b43.90 a6.79 b19.85b34.39 a13.76 b12.52 b
RT173.4 a7.80 a81.78 a46.11 a45.11 a7.39 a21.53a34.40 a15.36 a14.14 a
2020/2021
NM140.6 d6.90 c75.10 c38.81 d38.56 d5.97 d18.02 c32.56 b11.78 d10.67 c
PFM168.1 ab7.94 a81.28 a43.32 c40.46 c6.46 c19.79 b32.03 b13.05 c12.52 b
WSM156.5 c7.51 b78.14 b45.60 bc42.37 b6.84 b19.71 b34.86 a14.05 b12.91 b
PRM172.7 a8.13 a79.85 ab48.89 a45.57 a7.53 a21.09 a36.15 a15.68 a14.50 a
MM163.2 bc7.90 a79.23 ab46.19 b44.22 ab7.28 a20.44 ab35.97 a15.15 a13.91 a
FL195.0 a9.20 a86.21 a50.48 a50.05 a8.58 a24.87 a34.50 a12.80 b12.85 a
LM125.4 b6.15 b71.23 b38.65 b34.42 b5.05 b14.75 b34.13 a15.09 a12.95 a
CT157.2 a7.58 a78.05 a43.10 b41.60 a6.46 b19.00 b33.86 a13.03 b12.10 b
RT163.2 a7.77 a79.40 a46.03 a42.88 a7.17 a20.61 a34.77 a14.85 a13.70 a
Abbreviations in the table indicate green leaf area per plant (GLA), plant dry weight (PDW), relative water content (RWC), number of grains per spike (GNPS), 1000-grain weight (TGW), grain yield per ha (GY), biological yield per ha (BY), harvest index (HI), irrigation water use efficiency (IWUE), water productivity (WP), no mulch (NM), plastic film mulch (PFM), wheat straw mulch (WSM), palm residues mulch (PRM), and a mixture of wheat straw and palm residues at 50/50 ratio (MM), conventional tillage (CT), reduced tillage (RT), full irrigation regime (FL), and limited irrigation regime (LM). The different letters indicate statistical significance at the 0.05 level.
Table 4. Yield response factor (ky) shown as the relationship between the relative decrease in plant dry weight (KyPDW) and grain yield (KyGY) and the corresponding relative decrease in evapotranspiration for different mulching treatments under conventional tillage (CT) and reduced tillage (RT) practices in the 0.50 ET treatment in two growing seasons.
TillageMulchingKyPDWKyGY
2019–20202020–20212019–20202020–2021
CTNM1.371.341.681.69
PFM0.650.741.131.30
WSM1.091.061.171.23
PRM0.890.890.990.99
MM0.990.981.091.06
RTNM1.221.241.391.45
PFM0.630.570.900.99
WSM0.820.930.830.95
PRM0.720.700.680.74
MM0.770.730.780.81
Abbreviations in the table indicate no mulch (NM), plastic film mulch (PFM), wheat straw mulch (WSM), palm residues mulch (PRM), and a mixture of wheat straw and palm residues at 50/50 ratio (MM).
Table 5. Functional relationship between plant dry weigh (PDW), grain yield (GY), irrigation water use efficiency (IWUE), and water productivity (WP) (Y) and total soil water storage before irrigation (x) at different soil depths and measured time points.
Days after SowingSoil DepthsEquation Equation
An Increase in PDW and GY for each 10 mm Increase in SWS
PDWg plant−1GYton ha−1
640–20Y = 0.053x − 1.280.53Y = 0.058x − 2.820.58
20–40Y = 0.049x − 1.860.49Y = 0.055x − 3.720.55
40–60Y = 0.030x − 1.390.30Y = 0.032x − 0.0560.32
910–20Y = 0.063x − 1.680.63Y = 0.070x − 3.450.70
20–40Y = 0.068x − 3.140.68Y = 0.071x − 4.490.71
40–60Y = 0.051x − 0.4960.51Y = 0.053x − 1.700.53
1100–20Y = 0.066x − 1.450.66Y = 0.074x − 3.460.74
20–40Y = 0.074x − 3.130.74Y = 0.080x − 4.800.80
40–60Y = 0.055x − 0.9380.55Y = 0.058x − 2.130.58
Days after SowingSoil DepthsOptimal SWS for Maximizing IWUE and WP
IWUEmmWPmm
640–20Y = −0.0017x2 + 0.518x − 24.58152.35Y = −0.0012x2 + 0.413x − 20.88172.08
20–40Y = −0.0012x2 + 0.455x − 26.51189.58Y = −0.001x2 + 0.416x − 27.27208.00
40–60Y = 0.0002x2 −0.087x + 25.79217.50Y = 0.00008x2 − 0.0389x + 17.38243.13
910–20Y = −0.0024x2 + 0.672x − 31.31140.00Y = −0.002x2 + 0.610x − 31.42152.50
20–40Y = −0.002x2 + 0.638x − 34.95159.50Y = −0.0022x2 + 0.731x − 46.94166.14
40–60Y = −0.00006x2 − 0.0194x + 19.07161.67Y = −0.0003x2 − 0.086x + 6.50143.33
1100–20Y = −0.0017x2 + 0.443x − 14.07130.29Y = −0.0018x2 + 0.531x − 24.48147.50
20–40Y = −0.0028x2 + 0.799x − 40.51142.68Y = −0.0027x2 + 0.799x − 45.37147.96
40–60Y = −0.0006x2 + 0.165x + 4.64137.50Y = −0.0007x2 + 0.236x − 5.13168.57
Publisher’s Note: MDPI stays neutral with regard to jurisdictional claims in published maps and institutional affiliations.

