Article

Soil Moisture, Nutrients, Root Distribution, and Crop Combination Benefits at Different Water and Fertilizer Levels during the Crop Replacement Period in an Apple Intercropping System

1
School of Soil and Water Conservation, Beijing Forestry University, Beijing 100083, China
2
Forest Ecosystem Studies, National Observation and Research Station, Jixian 042200, China
*
Author to whom correspondence should be addressed.
Submission received: 22 September 2023 / Revised: 14 October 2023 / Accepted: 24 October 2023 / Published: 27 October 2023
(This article belongs to the Special Issue Influence of Irrigation and Water Use on Agronomic Traits of Crop)

Abstract

:
Uneven soil moisture and nutrient distribution before and after intercropping limits apple cropping system productivity in the western Shanxi–Loess Plateau area. To address this issue, a field trial was conducted between 2020 and 2021 to study the effects of different water and fertilizer management practices on soil moisture, nutrients, and root distribution, as well as the overall effectiveness of the apple–maize and apple–soybean intercropping systems during crop replacement. The experiment involved two irrigation methods: drip (D) and flood (M) irrigation. Three irrigation levels included rain-fed without irrigation (W0), and 50% (W1) and 80% (W2) of field capacity (Fc). Three fertilizer treatments included no additional fertilizer application (F0), 375 kg∙hm−2 (F1), and 750 kg∙hm−2 (F2), in addition to a control (CK) without irrigation or fertilization. The soil water content (SWC) decreased after the crop replacement. Additionally, nitrate nitrogen (NN), ammonium nitrogen (AN), and organic matter (OM) content levels in all treatments increased, whereas total phosphorus (TP) content decreased. The soil layer with crop roots moved downward after crop replacement, and partial fertilizer productivity (PFP), irrigation water use efficiency (IWUE), and water use efficiency (WUE) were decreased under both irrigation treatments. Principal component analysis showed that the W2F2 treatment had the highest benefit from crop combination across both irrigation treatments during the crop replacement period. According to our results, to optimize the benefits of apple-crop intercropping, drip irrigation with complete water supply and flood irrigation with incomplete water supply are recommended during crop replacement. In addition, an upper irrigation limit of 80% Fc with 750 kg∙hm−2 fertilization is recommended for optimal water and fertilizer regulation.

1. Introduction

Intercropping fruit trees and crops is a typical type of agroforestry practice in the Loess Plateau area of western Shanxi Province which is essential for soil erosion control, restoration of ecological balance, and increase in local incomes. As a tree species of economic importance, apple trees are widely planted in the Loess Plateau region of western Shanxi Province; however, the fruit trees take a long time to reach reproductive maturity, thereby delaying the economic benefits [1]. To compensate for the economic losses, fruit growers often opt to plant maize between rows of young apple trees that have not yet fruited because maize production has a high economic efficiency. However, long-term intercropping of maize with apple trees causes soil compaction, pests, and diseases, impairs the soil nutrient balance, and reduces yields. Competition between aboveground and belowground parts of both apple trees and maize increases during the growing season [2], in turn reducing the comprehensive benefits of the intercropping system. In contrast, competition between aboveground and belowground parts of soybean and apple trees is relatively low; therefore, local fruit farmers often intercrop apples with soybean during the fourth year in an apple–maize intercropping system.
Root system types directly determine the capacity of a crop to absorb soil water and nutrients [3], and the spatial distribution characteristics of root systems in the soil affect crop water and fertilizer regulation [4]. Maize has a shallow, fibrous root system [5,6], whereas soybean has a deep taproot system [7]. Consequently, intercropping systems are susceptible to uneven distribution of water and nutrients due to variations in root distributions of intercrops after changing crops. The coexistence of fruit trees and crops in the Loess Plateau region of western Shanxi is typically associated with the uneven distribution of rainfall and low soil fertility, which affect the stability of intercropping systems and their benefits, thereby adversely affecting the incomes of fruit farmers and leading to land degradation [8,9].
Uneven distribution of soil water and nutrients can further alter root distribution and growth of intercrops during the intercrop replacement period, which thereby affects interactions between intercrops and overall intercropping efficiency, and, in present practice, currently needs to be reduced by implementing water and fertilizer management practices during the critical period. Researchers have investigated the distribution patterns of water and nutrients under different water and fertilizer conditions in continuous cropping systems, such as variations in soil water content (SWC) with distance from apple trees and soil depth in an apple–soybean intercropping system under straw and film mulching conditions [10,11]. Some scholars have also studied the law of change of soil moisture and available nutrients relative to distance from the tree and soil depth in apple–maize and apple–soybean intercropping systems under the coupled control of irrigation and fertilization [12,13]. Crop replacement not only alters the number and diversity of soil microbes [14], but also modifies the distribution of root systems. The distributions of soil microbial communities and plant root systems are crucial for water and nutrient uptake, as well as the synthesis of various substances in plants [15], which in turn, affect water and nutrient distributions, and alter interactions among subsurface species. Furthermore, water and nutrient distributions influence effective management of both water and fertilizer, which has an effect on the overall efficiency of an intercropping system. However, the relationship between soil moisture and nutrient distribution, their underlying mechanisms, and the overall benefits during the intercrop replacement period under controlled irrigation and fertilizer application remain unclear.
In addition, water supply conditions in the Loess Plateau area of western Jin vary considerably, and most water supply facilities in the region are inadequate. Only a few agricultural parks have relatively well-developed water supply systems, and the main water replenishment methods are drip and flood irrigation [16]. According to a previous systematic study conducted by our research team to determine the effects of different irrigation methods on the overall benefits of intercropping systems under apple–maize intercropping systems in this region, film mulching under flood irrigation provides greater overall benefits than does straw mulching in an apple–maize intercropping system [17], while drip irrigation at 50–65% of the field water holding capacity (Fc), combined with 70% fertilizer application, resulted in higher overall benefits [12]. However, the mechanisms underlying the effects of different water and fertilizer management practices on soil moisture, nutrients, root distribution, and overall intercropping efficiency during the intercropping replacement period remain unclear. The optimal water and fertilizer management practices during this period require further research.
This study adopted two water replenishment methods (drip and flood irrigation) and two fertilizer application rates to investigate the effects of different water and fertilizer management practices on: (1) the spatial distribution of soil moisture, nutrients, and roots in intercropping systems during the crop replacement period; and (2) aboveground dry matter quality (ADMQ), water use efficiency (WUE), and overall benefits during the intercropping period. Based on the results of the above analysis of relevant influencing factors, optimization measures for water and fertilizer management of apple intercropping systems in Loess Plateau areas of western Shanxi Province during the crop replacement period are proposed.

2. Materials and Methods

2.1. Experimental Site

The experimental site was located at the Shishanwan Experimental Base (36°53′10″–36°21′02″ N, 110°27′30″–111°07′20″ E) of the National Field Scientific Observatory of Forest Ecosystems in Jixian County, Shanxi Province, China (Figure 1). The site is part of the loess residual plateau gully area, with the top layer consisting of Quaternary wind-accumulated loess; the soil pH is 7.9. The soil in the area is poor, with less than 1% organic matter, and has an average dry bulk weight of 1.34 g/cm3. The climate of the area is described as a warm temperate continental monsoon climate with adequate sunshine, an average annual rainfall of 522.8 mm, and uneven distribution of rainfall between years. Rainfall is mainly distributed within a range extending from June through August, accounting for more than 80% of the annual rainfall. The average annual frost-free period is approximately 170 days, the average air temperature is 10 °C, and the average cumulative temperature is 3357.9 °C.

2.2. Experimental Design

The experimental site was located in Sanhou Village, Jixian County, Shanxi Province, and the study was conducted on a typical apple–maize intercropping system in 2020 and an apple–soybean intercropping system on the same plot in 2021. Apple trees which had not begun to bear fruits were planted in 2018 at a spacing of 3.5 m × 5 m in an east–west direction, and the plant height was 3.3 m. Apple trees were intercropped with a maize crop for two years before 2020, with maize and soybean rows being spaced at 0.3 m × 0.4 m in both 2020 and 2021. The apple trees were planted at a distance of 0.6 m from the crop rows. Each plot had one fruit tree, which was 2 m away from the edge of the plot, and the plot areas were 14 m2. Maize planting was delayed due to the COVID-19 outbreak in 2020. Maize was sown on 13 August 2020 and soybean was sown on 17 May 2021. Both maize and soybean were sown manually by placing two seeds per hole.
Three factors (irrigation method, irrigation level, and fertilizer application rate) were included as variables in the field experiment, based on the results of our previous studies on apple–maize intercropping systems in the area [2,10,12]. The appropriate water and fertilizer treatment ranges for apple–maize and apple–soybean intercropping systems were selected for the experiment (Table 1). The irrigation methods applied to this study included drip (D) and flood (M) irrigation; irrigation upper limits were rainfed (no irrigation, W0), 50% of the field water holding capacity (Fc)-W1, and 80% of the field water holding capacity (Fc)-W2. Fertilizer treatments included F0 (no fertilizer added), F1 (N 206.2 kg∙hm−2 + P2O5 84.4 kg∙hm−2 + K2O 84.4 kg∙hm−2), and F2 (N 412.4 kg∙hm−2 + P2O5 168.8 kg∙hm−2 + K2O 168.8 kg∙hm−2); areas with no irrigation and no topdressing were included as controls (CK). As both drip and flood irrigation–rainfed (without irrigation, W0), and drip and flood irrigation–no irrigation and no fertilizer treatments were the same, drip and flood irrigation treatments shared the W0F1, W0F2, and CK treatments, resulting in a total of 15 treatments with three replications for a total of 45 experimental plots. All plots were mulched with films and the spacing between two rows of crops was 40 cm. The flow rate of the drippers was 1.38 L/h, the spacing of the drip heads was 0.3 m, and the spacing between drip tapes was 0.7 m. Water was sourced from local farmers, and a water meter was installed at the inlet position of each irrigation treatment to regulate the amount of water used for irrigating crops. Before plowing, 75 kg∙hm−2 of N/P/K compound fertilizer was applied evenly to all treatments as a base fertilizer. The plot layout and sampling points are illustrated in Figure 2.

2.3. Data Collection and Measurements

2.3.1. Rainfall and Temperature

Precipitation and temperature data recorded at one-hour intervals were obtained from automated weather monitoring stations (Figure 3). The graphs included rainfall, temperature, and irrigation data collected during the maize and soybean growing seasons. The amount of rainfall received during the maize seedling stage in 2020 was 175.2 mm, or 83.7% of the total rainfall received during the reproductive period of maize (209.2 mm). Five heavy rainfall events (a total of 27.6–45.8 mm in 24 h) and one storm rainfall event (a total of 63.4 mm in 24 h) were recorded in 2021. The total number of days with rain was 24, implying that the total rainfall received during the soybean reproductive period was substantially higher than that received during the maize reproductive period. The rainfall received during the soybean maturity period was 356.2 mm, which accounted for 58.4% of the total rainfall received during the reproductive period of soybean (609.9 mm).

2.3.2. Soil Water Measurements

Soil moisture content was measured via an oven-drying method, using an auger (5 cm in diameter, the auger was used to collect soil samples) to determine soil mass moisture content at 0.3 m, 0.8 m, 1.25 m, and 1.7 m distance from the trees. Soil moisture content was measured at 7-day intervals for 0–10 cm, 10–20 cm, 20–30 cm, 30–40 cm, 40–50 cm, 50–60 cm, 60–80 cm, and 80–100 cm (total of 8 layers), and soil bulk moisture content was measured, with additional measurements taken after irrigation and rainfall, three samples were taken from each layer to calculate the average.

2.3.3. Soil Nutrient Measurements

Soil nutrient sampling was carried out at the seeding stage and jointing stage of maize in 2020, and the podding stage and maturing stage of soybean in 2021. Soil samples were taken at 0.3 m, 0.8 m, 1.25 m, and 1.7 m from the trunks of the trees using the soil auger method in four layers of soil samples of 0–20 cm, 20–40 cm, 40–60 cm, and 60–100 cm; in total, three samples from each layer were tested. To make the samples representative of the average nutrient levels in the field, soil samples from three points equidistant from the tree rows were mixed as soil samples from one of the layers of a sample point, naturally shade-dried and sieved through sieves of different mesh sizes, and then analyzed in indoor tests. The indicators included nitrate nitrogen, ammonium nitrogen, organic matter, and total phosphorus. Nitrate nitrogen and ammonium nitrogen were measured by extraction with KCl solution and a Smartchem automatic chemical analyzer; organic matter was measured by concentrated sulphonic acid and potassium dichromate plus thermal oxidation [18]; and total phosphorus was measured by digestion and a Smartchem automatic chemical analyzer.

2.3.4. Root Measurements

The root system was sampled, using the root auger sampling method (10 cm diameter, 1570 cm3 volume), in 2020 at the jointing stage of maize and in 2021 at the maturing stage of soybean. The sampling points were selected in the same way as those selected for soil moisture and nutrients, and the sampling depths were the same as for soil nutrients, i.e., 4 layers of 0–20 cm, 20–40 cm, 40–60 cm, and 60–100 cm. Removed root systems were carefully selected and cleaned of any soil on the root system surface by continuous rinsing in clean water using a 2 mm sieve. Soybean and apple roots were carefully distinguished by their different appearance and finally scanned and analyzed for root-length density using a WinRHIZO root scanner (ver. 2003b, Reagent Instruments Inc., Quebec, Canada).

2.3.5. Determination of Aboveground Dry Matter Quality and Yield of Maize (Soybean)

Three plants representative of the treatments’ growth were taken from each treatment at the jointing and maturing stages of maize and soybean. The stems and leaves were divided into two parts and desiccated in an oven at 105 °C for 30 min, followed by drying until the samples were of constant weight. The dried dry matter mass was converted to hectare dry matter mass by taking the mean value. Due to frost damage to the crop in early October 2020 (maize jointing stage), which resulted in a lack of crop yield, the maize yield for 2020 in this study was calculated from an empirical model (R2 = 0.80, p < 0.01) which had been determined at the same location under the same climatic conditions (Zhou et al., 2019 [2]). The yield of soybean was determined as the seed yield in each plot at the maturing stage in 2021.

2.4. Statistical Analyses

2.4.1. Water Consumption (ET)

Water consumption (ET) levels during the growth of intercropped maize (soybean) were estimated using the water balance approach, as follows [19]:
ET = I + P + U     R     F   ±   Δ W
where ET is the water consumption of each growth stage (mm), I is the amount of irrigation water during the stage (mm), P is the amount of effective rainfall during the stage (mm), U is the amount of groundwater recharge (mm), R is the amount of surface runoff (mm), F is the amount of deep seepage (mm), and ΔW is the difference in the consumption of water stored in the 0–100 cm soil at the beginning and at the end of the stage. As the test site was flat, the visible surface runoff was 0. The groundwater burial depth was about 50 m, so the recharge from the surface layer of groundwater was also assumed to be 0. Deep seepage was assumed to be 0, as the SWC at 50–60 cm after each irrigation round or rainfall was less than Fc; consequently, the values of R, U, and F were considered negligible.

2.4.2. Irrigation Water Use Efficiency (IWUE)

Irrigation water use efficiency (IWUE) is the ratio of the GY to the amount of irrigation per unit area of intercropped maize (soybean), and was calculated as follows.
IWUE = GY / I
where IWUE is irrigation water use efficiency (kg/m3), GY is seed yield (kg/hm2), and I is irrigation water volume (m3/hm2) [2].

2.4.3. Water Use Efficiency (WUE)

WUE in the intercropping system was expressed as the ratio of maize (soybean) yield to ET across the intercropping area.
WUE = GY / ET
where WUE is water use efficiency (g/L), GY is the seed yield of maize (soybean) (kg/hm2), and ET is water consumption (mm) [20].

2.4.4. Partial Fertilizer Productivity (PFP)

The PFP is the ratio of economic yield per unit area of intercropped maize (soybean) to fertilizer application per unit area, calculated as follows:
PFP = GY / F
where GY is the maize (soybean) seed yield and F is the total amount of fertilizer applied (kg/hm2) [13].

2.4.5. Comprehensive Benefits

The composite score for each treatment was calculated using principal component analysis (PCA), with the following equation:
Y = aY 1 + bY 2 + cY 3
where Y is the composite score for each treatment using PCA, including soil moisture, nitrate nitrogen, ammoniacal nitrogen, organic matter, and total phosphorus content; root-length density for maize, soybean, and apple; and above-ground dry matter quality and yield for maize and soybean. Here the three principal components (PC1, PC2, and PC3) could explain more than 75% of the variance in the first year and more than 73% of the variance in the second year. Y1, Y2, and Y3 are the scores of PC1, PC2, and PC3 for each treatment, and a, b, and c are the weights of the contributions of PC1, PC2, and PC3 to the cumulative variables.

2.5. Statistical Analyses

Statistical analyses were performed using Microsoft Excel 2016 (Microsoft Corp., Redmond, WA, USA). Origin 2021 (OriginLab Corp., Northampton, MA, USA) was used to plot graphs and perform principal component analysis of variables, including soil moisture, soil nutrients, aboveground dry matter, and yield. Structural equation modeling (SEM) was carried out using IBM SPSS Amos 24.0 (SPSS Inc., Chicago, IL, USA) to assess the direct and indirect effects of soil moisture and nutrients on water use (ET), WUE, partial fertilizer productivity (PFP), root-length density (RLD), and yield (Yd). Analysis of variance and the least significant difference test were used to determine significant differences in soil water and nutrient contents among treatments at p = 0.05 using IBM SPSS Statistics 26.0 (IBM Corp., Armonk, NY, USA).

3. Results

3.1. Spatial Distribution of Soil Water Content

Based on horizontal distribution, SWC under drip irrigation treatments initially increased, which was followed by a decrease, and then it increased with increasing distance from the apple trees. However, SWC under flood irrigation treatments increased with increasing distance from apple trees, and peaked at 1.7 m away from the apple trees (Figure 4). In 2021, SWC under drip and flood irrigation treatments decreased considerably, by 5.2% and 3.4%, respectively, after crop replacement when compared to levels in 2020 (Figure 4). The maximum SWC values under both drip and flood irrigation treatments were observed in the W2F2 treatment, whereas the minimum values were observed in CK (Figure 4). SWC generally increased with increased irrigation and fertilizer application, and was higher under drip irrigation treatments than under flood irrigation treatments when irrigation and fertilizer application levels were the same. SWC increased gradually during maize growth, but exhibited a contrasting trend after crop replacement. SWC of maize was greater than that of soybean at all distances from the apple trees. SWC at the F2 level was higher than that at the F1 level under drip and flood irrigation treatments in both years, indicating that the balance between SWC and ET was maintained at the F2 fertilizer level.
Based on vertical distribution, SWC initially increased and then decreased with soil depth (Figure 5). SWC in the 0–60 cm soil layer increased with soil depth and reached a maximum value at a depth of 50–60 cm, whereas SWC in the 60–100 cm soil layer decreased with soil depth. The increase in SWC with soil depth was more notable in the 0–40 cm soil layer and higher under the drip irrigation treatment than under the flood irrigation treatment in the apple–maize intercropping system. Slight differences were observed in SWC between drip and flood irrigation treatments in the 40–100 cm soil layer, and no significant differences were observed between drip and flood irrigation treatments after crop replacement. SWC in all soil layers decreased in 2021 when compared to those in 2020, with a substantial decrease being observed in the 0–30 cm soil layer. Differences in distances from apple trees and soil depths exerted highly significant effects (p < 0.01) on both horizontal and vertical distributions of SWC during the crop replacement period. Based on horizontal SWC distribution, the interactive effects of irrigation and fertilizer application, as irrigation–fertilizer application, on SWC distribution were highly significant (p < 0.01). Based on vertical SWC distribution, irrigation, fertilizer application, and soil depth exerted highly significant effects (p < 0.01) on SWC distribution. The interactive effect of irrigation and fertilizer application on SWC distribution was highly significant (p < 0.01) only during the podding stage of soybean, and had no significant effect on SWC distribution during the rest of the soybean growth period. The interactive effects of irrigation, fertilizer application, and soil depth on SWC distribution during the rest of the reproductive growth stages were significant (p < 0.05), except during soybean maturity.

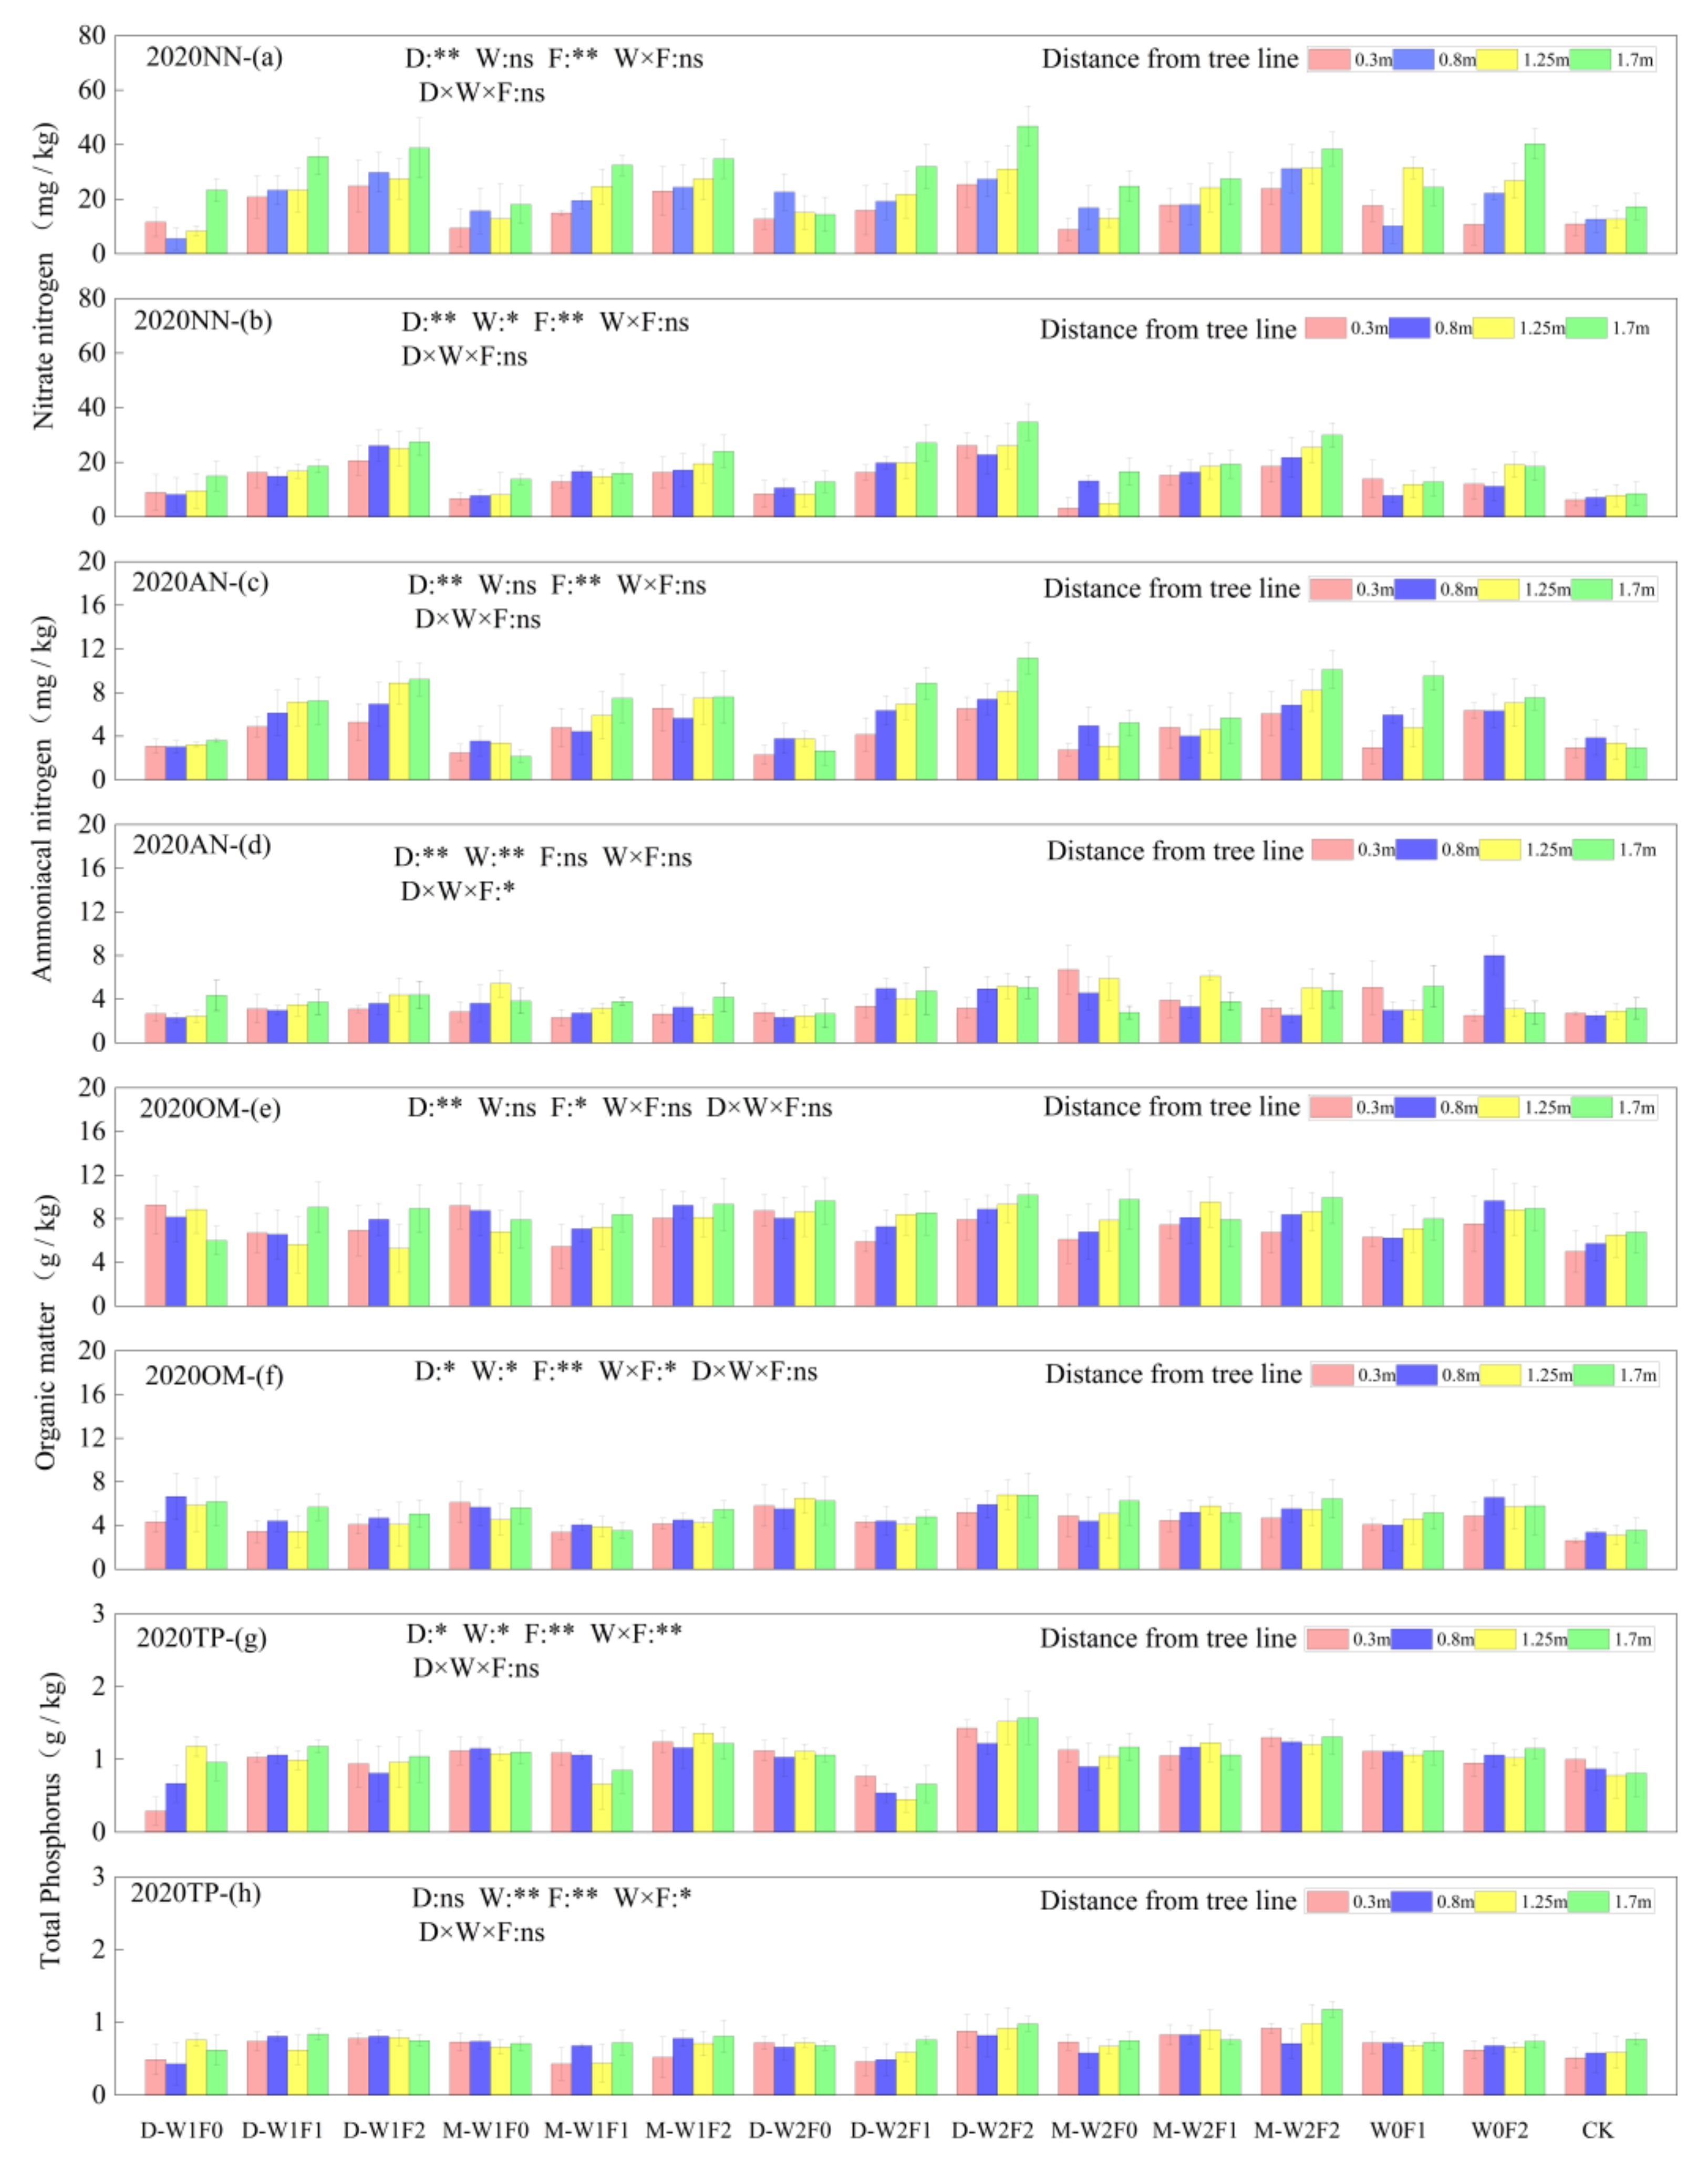
3.2. Spatial Distribution of Nutrients

Regarding the horizontal distribution of soil nutrients, nitrate nitrogen (NN), ammonium nitrogen (AN), and organic matter (OM) contents exhibited increasing trends with increased distance from apple trees, with maximum values being observed at 1.7 m away from the apple trees (Figure 6 and Figure 7). Variation in total phosphorus (TP) content along the horizontal direction with increasing distance from the apple trees was insignificant. Overall, NN and AN contents under drip irrigation treatments were higher than those under flood irrigation treatments in 2020 and 2021. No significant differences were observed in OM content between the treatments. TP content under drip irrigation treatments was lower than that under flood irrigation treatments in 2020, but higher than that under flood irrigation treatments in 2021. All soil nutrient contents were highest in the D-W2F2 treatment, except for TP during the maize seeding stage, TP during the soybean podding stage, and OM during the soybean maturity stage, which were higher in controlled irrigation and fertilizer application treatments than in the control. Overall, the contents of NN, AN, OM, and TP increased with increasing irrigation and fertilizer application. The contents of NN, AN, and OM under drip and flood irrigation treatments increased by 19–69% and 21–67%, respectively, after crop replacement. TP content under drip and flood irrigation treatments decreased by 17% and 26%, respectively (Figure 6 and Figure 7). All soil nutrients decreased gradually during crop growth before crop replacement, but increased gradually during crop growth after crop replacement. The rest of the nutrient contents remained the same.
Regarding the vertical distribution of soil nutrients, NN, AN, and OM contents in the 0–100 cm soil layer during the crop replacement period were significantly higher in all treatments than those in CK (p < 0.05). The NN, AN, and OM contents decreased with increasing soil depth, and nutrient contents in the topsoil (0–20 cm soil layer) were highest (Figure 8 and Figure 9). No significant difference was observed in TP content with increased soil depth before crop replacement; however, TP content decreased gradually with increasing soil depth after crop replacement. In 2020, NN content in the 0–60 cm soil layer under drip irrigation treatment was higher than that under flood irrigation treatment. Moreover, NN content in the 60–100 cm soil layer under drip irrigation treatment was lower than that under flood irrigation treatment and a similar trend was observed after crop replacement in 2021. In 2020 and 2021, AN content in the 0–100 cm soil layer under drip irrigation treatment was higher than that under flood irrigation treatment, whereas OM content did not differ significantly between drip and flood irrigation treatments. TP content before crop replacement in the 0–100 cm soil layer under drip irrigation treatment was lower than that under flood irrigation treatment. However, after crop replacement, TP content under the drip irrigation treatment was higher than that under flood irrigation treatment. The highest soil nutrient contents during each reproductive period were mainly observed in the 0–20 cm soil layer of the W2F2 treatment. Soil NN content was mainly concentrated in the 0–40 cm soil layer before crop replacement, and mainly concentrated in the 0–60 cm soil layer after crop replacement (Figure 8 and Figure 9). No significant differences were observed in other nutrient contents in different soil layers during the crop replacement period. Distances from apple trees and soil depths had highly significant effects (p < 0.01) on nutrient distribution in 2020 and 2021. Irrigation and fertilizer application had significant effects (p < 0.05) on nutrient distribution; the interactive effects of irrigation and fertilizer application at different distances from apple trees and irrigation and fertilizer application at various soil depths on nutrient distribution were insignificant. The interactive effects of irrigation and fertilizer application on the horizontal and vertical distribution of TP content before crop replacement were significant (p < 0.05), whereas the effects on those of other nutrient distributions were insignificant. The interactive effects of irrigation and fertilizer application on the horizontal distribution of nutrients after crop replacement were insignificant.

3.3. Spatial Distribution of Roots

Based on horizontal root distribution, it was determined that distances from apple trees, irrigation levels, and fertilizer application levels had highly significant effects (p < 0.01) on maize and soybean RLDs. Maize and soybean RLDs increased gradually with increasing distance from apple-tree rows, with a maximum value being observed at 1.7 m from the trees. RLD under drip irrigation treatment was higher than that under flood irrigation treatment, with maximum values being observed in the W2F2 treatment, whereas the minimum values were observed in CK (Figure 10). Based on vertical root distribution, maize and soybean RLDs decreased with increasing soil depth, indicating that competition for water between apple trees and maize and apple trees and soybean decreased with increasing soil depth. Soil depth exerted a highly significant effect (p < 0.01) on RLD distribution during the crop replacement period. RLD decreased with increasing soil depth during the crop replacement period, with a maximum value being observed at a soil depth of 0–20 cm. Most of the maize roots were concentrated in the 0–40 cm soil layer before crop replacement, accounting for 81.9–99.2% of the total root length. Fewer roots were present in the 40–100 cm soil layer and most of the soybean roots were present in the 0–60 cm soil layer after crop replacement, accounting for 87.4–99.0% of the total root length. Fewer soybean roots were present in the 60–100 cm soil layer. Soybean roots were distributed in deeper soil layers than those of maize after crop replacement and RLD under drip and flood irrigation treatments increased by 18.2% and 1.7%, respectively.
Apple tree RLD decreased with increases in tree distance between 2020 and 2021 (Figure 10). In 2020, the apple tree root system was mainly distributed within a horizontal distance of 0.3–1.25 m from the trees and fine roots in this region accounted for 66.0–90.0% of the total root length in the whole area (within a radius of 1.7 m from the apple tree). The corresponding proportion in 2021 was 75.6–93.6%, indicating that the horizontal extension of the apple tree root system increased with an increase in planting years after crop replacement. With regard to the vertical direction, apple tree RLD in both years increased gradually with an increase in soil depth. Apple tree RLD in the 0–60 cm soil layer under drip irrigation treatment was higher than that under flood irrigation treatment, whereas that in the 60–100 soil layer under flood irrigation treatment was higher than that under drip irrigation treatment. The maximum RLD values for apple trees in both years were observed in the D-W2F2 treatment, whereas the minimum RLD value was observed in CK. Distances from apple trees and soil depth had highly significant effects (p < 0.01) on the distribution of apple tree roots. With regard to the horizontal direction, irrigation level, amount of fertilizer applied, and the interaction between irrigation and fertilizer application had highly significant effects (p < 0.01) on the distribution of apple tree roots. However, the interaction between irrigation and fertilizer application had no significant effect on the distribution of apple tree roots.

3.4. Water Consumption, Aboveground Dry Matter Quality, and Yield

In 2020, drip irrigation treatments consumed less water (ET) than did flood irrigation treatments when irrigation and fertilizer application levels were the same. Furthermore, ADMQ, Yd, PFP, IWUE, and WUE under drip irrigation treatments were higher than those under flood irrigation treatments (Table 2). A similar observation was made after crop replacement in 2021. ET during the maize seeding stage accounted for 75.5% of the total ET during the reproductive period of maize, and it increased with an increase in irrigation water, but it decreased gradually with an increase in fertilizer application before crop replacement. ET during the maturing stage of soybean accounted for 67.6% of the total ET during its reproductive period, and it increased gradually with an increase in irrigation water after crop replacement. No significant difference was observed in ET with an increase in fertilizer application. Overall, ADMQ increased with an increase in irrigation water; however, it initially decreased and then increased with an increase in fertilizer application under drip irrigation treatments and increased with an increase in fertilizer application under flood irrigation treatments. In 2020, maize Yd increased with increases in irrigation water and fertilizer application, and a similar trend was observed for soybean Yd after crop replacement. The highest Yd values were observed in the D-W2F2 treatments, and a significant difference was observed in Yd between drip and flood irrigation treatments after crop replacement. Yds under drip irrigation treatments in 2020 and 2021 were 1.6% and 11.8%, respectively, higher than those under flood irrigation treatments. PFP, IWUE, and WUE under drip and flood irrigation treatments decreased by 74.3–94.6% and 79.3–95.0%, respectively, after crop replacement. PFP increased with increases in irrigation water and decreased significantly (p < 0.05) with increases in fertilizer application during both years. IWUE and WUE increased with increases in fertilizer application before crop replacement; however, IWUE initially increased and then decreased with increases in fertilizer application after crop replacement. No significant differences were observed in IWUE in the remaining treatments, except for a few treatments in which WUE increased with increases in fertilizer application. Irrigation had highly significant effects (p < 0.01) on ET, ADMQ, Yd, and IWUE during the two years of crop replacement, but had no significant effect on PFP and WUE. Fertilizer application and year-of-planting had highly significant effects (p < 0.01) on ET, ADMQ, Yd, PFP, IWUE, and WUE. Moreover, the interactive effects of irrigation and fertilizer application on ET and ADMQ were highly significant (p < 0.01), but those on Yd, PFP, IWUE, and WUE were not significant.

3.5. Correlations between Crop Characteristics and Soil Nutrients

To assess the impacts of different water and fertilizer treatments on the combined benefits of intercropping systems, nine indices of maize and soybean (ADMQ, RLD, Yd, apple RLD, SWC, NN, AN, OM, and TP) were subjected to principal component analysis (PCA). According to the results, PC1, PC2, and PC3 explained 42.5%, 18.7%, and 12.2% and 44.9%, 20.6%, and 9.6% of the total variance observed in 2020 and 2021, respectively, with a cumulative explanatory contribution of more than 73% (Figure 11). Therefore, the three principal components were used as composite variables to assess the combined benefits of apple–maize and apple–soybean intercropping systems. The composite benefits of the intercropping systems increased gradually with an increase in irrigation and fertilizer application during the crop replacement period. All composite benefits of intercropping systems under drip irrigation treatments were higher than those under flood irrigation treatments, with the benefits increasing after crop replacement. Significant differences were observed in the composite benefits between drip and flood irrigation treatments. The impacts of MRLDs on PC1 were insignificant in 2020, but the impacts on PC1 for all nine indices were significant in 2021. The W2F2 treatment had the highest composite score for both apple–maize and apple–soybean intercropping systems under drip and flood irrigation treatments with different water and fertilizer management practices. The CK treatment had the lowest composite score in both years.
SEM results are illustrated in Figure 11. Overall, irrigation and fertilizer management practices had effects on soil water, nutrient contents, and distribution of apple tree, maize, and soybean root systems, which in turn affected ET and Yd of the intercropping systems, as well as water and fertilizer use efficiency. Apple tree and maize RLDs had no significant effects on ET and WUE before crop replacement, and maize RLD was significantly positively correlated with Yd. Soybean RLD had no significant effect on Yd after crop replacement, and apple tree and soybean RLDs were significantly positively correlated with ET, but negatively correlated with WUE. Maize and soybean RLDs were not significantly negatively correlated with PFP, and apple tree RLD and ET were significantly positively correlated with Yd after crop replacement. Yd was significantly positively correlated with WUE and PFP. The results suggest that the effects of irrigation and fertilizer application on growth and interactions between aboveground and belowground components of the intercropping systems were modified after crop replacement, which in turn, affected the overall benefits.

4. Discussion

4.1. Spatial Distribution of Soil Water and Nutrients

The results of this study revealed that different irrigation water and fertilizer treatments significantly increased SWC in the apple–maize and apple–soybean intercropping systems, and that drip irrigation had a better performance than did flood irrigation. Our findings are consistent with those of a previous study which revealed that drip irrigation can effectively reduce soil water evaporation when compared to flood irrigation [21,22]. Therefore, SWC content was higher under drip irrigation treatments than under flood irrigation treatments. Based on horizontal distribution, SWC under drip irrigation treatments initially exhibited an increasing trend, followed by a decrease, and then increased with increasing distance from apple tree rows, which could be attributed to the drip irrigation belts that were placed at marks 0.8 m and 1.7 m away from the trees. The decrease in SWC at 1.25 m could be due to the temperature differences between the inner and outer parts of the mulching films. Covering the soil surface with mulch films is more efficient than leaving the soil bare, as the films reduce soil water evaporation [23], leading to a decrease in SWC at 0.8–1.25 m. SWC under flood irrigation treatments increased with increasing distance from apple tree rows and reached a maximum value at 1.7 m. This could be because 1.7 m was the farthest distance from the sampling point, and the roots of apple trees and crops overlapped to a great extent near the trees [10,24], thereby absorbing more soil moisture. In addition, the observation could be explained by the exposure of four- and five-year-old apple trees to stress, high crop density, and shading between intercropped species, which reduces soil water evaporation and leads to a high SWC. The results are consistent with the findings of a previous study on fruit trees of the same age and within the same area [25]. SWC increased gradually with crop growth and decreased after crop replacement, which could be because maize planting was delayed. Temperature is a key factor that influences crop growth, and as the maize grew, the temperature gradually decreased, leading to reduced plant growth and decreased water consumption. Irrigation was carried out during the jointing stage of maize, in turn resulting in a gradual increase in SWC. After crop replacement, water and heat stress experienced by the soybean from the podding to maturing stages were simultaneous, leading to increased water consumption. Soybean crops were irrigated during the podding stage rather than during the maturity stage, resulting in a gradual decrease in SWC. The overall decrease in SWC after crop replacement could be due to the following reasons: late planting of maize, gradual decrease in temperature during the early growth stage of maize (Figure 3), delayed growth of maize, and the fact that soybean ET was significantly higher than that of maize during the same reproductive period (Table 2). Another reason could be that the increase in rainfall after crop replacement, as well as the increase in irrigation, led to a more rapid growth of fruit trees and the extension of the apple trees’ fine roots in all directions, which resulted in more intense water competition with the crop, leading to more water depletion in the soybean belt, and hence a smaller SWC for soybeans than for maize. The effects of the two irrigation methods on SWC after crop replacement also differed. The decrease in SWC after crop replacement was greater under drip irrigation treatments than under flood irrigation treatments, which could be due to the more precise distribution of SWC under drip irrigation treatment, which improved access to water by the apple tree and crop root systems, in addition to increasing transpiration. Plant roots under flood irrigation treatments could not easily absorb sufficient water from the soil due to the high amounts of soil water and inadequate air, thereby resulting in relatively low transpiration rates. SWC increased with fertilizer application at the same irrigation level, and the maximum SWC value was observed in the W2F2 treatment, suggesting that rational regulation of water and fertilizer can increase SWC and reduce competition for water [13]. Regarding vertical SWC distribution, a substantial decrease in SWC was observed in the 0–30 cm soil layer after crop replacement, which could be due to the overlapping of apple tree and soybean root systems in the 0–30 soil layer, resulting in high water use. SWC of each treatment after crop replacement initially exhibited an increasing and then a decreasing trend with soil depth. The maximum SWC value was observed in the 50–60 cm soil layer, whereas the minimum value was observed in the surface soil layer, which could be associated with high evaporation and root distribution in the surface soil layers (Figure 10). SWC at the F2 level was higher than that at the F1 level, which could be because plant growth was more vigorous at the F2 level, in turn leading to increased plant cover, reduced surface temperatures, and reduced evaporation of soil moisture [2]. Moreover, this observation could have been determined by the increase in the amount of fertilizer applied improved the soil structure, increasing the soil porosity and stability of the unit, which in turn led to an increase in the soil water storage capacity.
The soil nutrient contents in all irrigation and fertilizer application control treatments increased significantly when compared to those of the control, and nutrient contents increased with increases in the amount of fertilizer applied and irrigation. Based on horizontal distribution, soil nutrient contents increased with increasing distance from apple trees and reached a minimum value at 0.3 m (Figure 6 and Figure 7), which could be because apple tree roots overlapped with maize and soybean roots at 0.3 m. Most roots overlapped at 0.3 m, where they grow vigorously, thereby increasing competition for nutrients [26]. A similar trend was observed with the increase in the distance between the intercrops and apple trees [8], which gradually decreased the influence of the apple trees. Based on the vertical distribution of soil nutrients, the highest nutrient contents were observed in the 0–20 cm soil layer, and gradually decreased with soil depth (Figure 8 and Figure 9). The finding could be attributed to fertilizer application to the topsoil of the planting rows and the gradual decomposition of plant residues from the previous growing season. Decomposition products usually accumulate in the topsoil, thereby resulting in relatively high nutrient contents in the topsoil [27]. The main aggregation depth of NN content shifted downwards after crop replacement, probably because the sources of N absorbed by maize are mainly crop residues from the previous growing season and fertilizer additions, whereas the N absorbed by soybean is derived from N fixed by root nodules [28]. In addition, the soybean root system is capable of penetrating deeper soil layers than is that of maize, which directly affects the accumulation and transport of NN [29]. No significant differences were observed in TP content with soil depth before crop replacement; however, TP content gradually decreased with increasing soil depth after crop replacement. The results could be explained by the continuous cultivation of maize before crop replacement, low abundance of soil microbiota, and tilling of soil before planting maize. The soil’s microbial environment was modified, microbial abundance increased, and P uptake and use by the crops was enhanced after crop replacement [30]. Consequently, the distribution of the root system became a major influencing factor, leading to a gradual decrease in TP content with soil depth. TP content of soil under drip irrigation was lower than that of soil under flood irrigation before crop replacement, but higher than that of soil under flood irrigation after crop replacement. This observation could be explained by enhanced nutrient supply to plants under drip irrigation treatments when compared to those under flood irrigation treatments before crop replacement [31]. However, after crop replacement, the heavy rainfall received during the reproductive period of soybean (Figure 3), together with flood irrigation, caused nutrient leaching from the soil, resulting in a lower TP content under flood irrigation than that under drip irrigation. After crop replacement, NN, AN, and OM contents were higher in 2021 than in 2020, but TP content was higher in 2020 than in 2021. This could be due to microbial decomposition of maize stover and soybean stubble residues in the soil in 2020, which, in turn, increased soil OM content [32], as well as the establishment of a symbiotic relationship between soybean and N-fixing bacteria in the soil (rhizobia) in 2021 [33]. Nodulation is a crucial process for N fixation in soybean, which consumes high amounts of P [34]. Therefore, P fertilizer supplementation is recommended after soybean replacement.

4.2. Plant Growth, Water Use, and Fertilizer Use

Crop growth, development, and yield are influenced by the growth status of the root system [15]. As one of the key organs required for plants to absorb water and nutrients, roots not only promote aboveground dry matter accumulation, but also increase Yd [35]. In this study, the analysis of the horizontal distribution of root systems revealed that maize and soybean RLDs generally exhibited increasing trends, and maximum RLD values were observed at a distance of 1.7 m from the apple trees (Figure 10), which was consistent with the soil moisture and nutrient distribution patterns (Figure 4, Figure 6 and Figure 7); this latter determination may also be associated with the state of radiation distribution in the intercropping system. The distribution of water and nutrients in the soil is a key factor influencing the growth of crop root systems, and 1.7 m was the farthest distance from the apple trees in our experimental setup. The horizontal root distances of apple trees increased after crop replacement, which could be due to the increased overlapping of apple tree and maize roots, especially in near-surface soils. Maize is a tall crop [36] and has a higher competitive advantage for light over apple trees, which, in turn, affects the growth and development of apple trees. Overlapping of apple and soybean roots reduced after crop replacement because soybean has short stems [36], which decreases their competition for light with apple trees. Regarding the vertical distribution of root systems, maize and soybean RLDs decreased considerably with soil depth. The maize root system was shallow, and the soybean root system was deep (Figure 10), which enhanced competition for water and nutrients between apple trees and crops. According to our results, ADMQ increased after crop replacement, which could have been because of increased moisture uptake by intercrops in the apple–soybean intercropping system and improved soil nutrient use efficiency after crop replacement (Figure 4), resulting in increased plant root biomass. Most soybean roots were distributed in the deeper soil layers (Figure 10), thereby occupying a larger soil volume [37], which facilitated crop growth, ultimately increasing aboveground dry matter accumulation [38].
Crop Yd decreased after crop replacement; that is, maize Yd was greater than that of soybean, which is consistent with previous findings [39]. The high Yd observed under drip irrigation treatments when compared to those under flood irrigation treatments could be due to the increase in soil nutrients and soil microbial abundance after crop replacement [14]. Furthermore, it is possible that within the interval of positive water–fertilizer beneficial effects on Yd, water–fertilizer use efficiency under drip irrigation was higher than that under flood irrigation, resulting in the considerable differences observed in Yd between drip and flood irrigation treatments. A possible explanation for the significant increase in ET after crop replacement (Table 2) is that maize has a fibrous root system and soybean has a taproot system [6,7]. The high soybean RLD allowed soybean to absorb and use water from deeper soil layers more efficiently. Maize was planted late, and temperatures were low during its reproductive period, leading to an overall delay in crop growth and a reduction in ET. The high soybean ET was associated with the five heavy rainfall events and one storm event (total rainfall of 356.2 mm) that occurred during the soybean maturity period. PFP, IWUE, and WUE values of the intercropping systems before crop replacement were higher than those observed after crop replacement. The observation could be because of delayed maize planting before crop replacement and delayed crop fertility, thereby resulting in stunted growth and low WUE. In addition, the maize Yd was higher than that of soybean because maize roots have a higher nutrient uptake capacity than do soybean roots [40]; therefore, local farmers prefer to plant maize during the early stages of intercropping.

4.3. Impact of Water and Fertilizer Regulation on the Overall Benefits of Intercropping during the Crop Replacement Period

The root system has a high degree of plasticity and can be modified under different water and fertilizer regimes that alter roots’ characteristics, as well as water and nutrient uptake and use [41]. SEM results revealed that apple and maize RLDs did not have significant effects on water and fertilizer use efficiency and ET before crop replacement. However, apple and soybean RLDs were negatively correlated with water and fertilizer use efficiency, but significantly positively correlated with ET after crop replacement (Figure 12), suggesting that crop replacement altered interspecific competition between fruit trees and crops in the intercropping system. This may be due to the fact that the apple trees were young before crop replacement and the interactive effect between apple trees and maize had minimal influence. The observation could also be attributed to variations in the root systems of the intercrops. Maize has a fibrous root system that occurs within the shallow soil layers, whereas the apple tree root system penetrates deeper in the soil and can absorb water from the deeper soil layers. According to our results, apple and maize RLDs had insignificant effects on water and fertilizer use efficiency. Water and nutrient use efficiency in the two intercropping systems were independent and complemented each other due to the variations in the shapes and distributions of the root systems, which, in turn, reduced water–fertilizer interactions. The effects of apple tree and maize RLDs on ET were not significant, which could be attributed to the delayed planting of maize, and the main factor influencing maize ET was temperature. The interactive effect between apple trees and soybean in the apple–soybean intercropping system was enhanced after crop replacement due to the increase in intercropping years. The soybean root system was able to penetrate deeper soil layers, thereby increasing competition with apple trees for water and nutrients. Apple tree and soybean RLDs had a significant negative correlation with WUE and PFP, which enhanced competition between plant root systems, resulting in an increase in the ET of the intercropping system [42]. Therefore, the demand and supply of water in an intercropping system should be taken into consideration after crop replacement as the number of intercropping years increase.
PCA results showed that the optimal integrated benefits of the W2F2 treatment did not change after crop replacement, although this differed from those in the treatment with the highest integrated benefits under continuous cropping conditions of 80% Fc (upper irrigation limit) and N fertilizer application rate of 92 kg·ha−1 [12], which could be due to the variation in the ages of the apple trees. Overall, benefits derived from all treatments increased (Table 3). The results could be attributed to maize residues in the soil that improved the soil structure and provided favorable conditions for soybean growth and development. Soil water and nutrients are essential for crop growth and development. Another reason could be that the differences in water consumption by the intercropping systems were not significant after crop replacement (3.4–5.2%). However, rainfall, soil nutrients, and RLDs increased in 2021 (Figure 6, Figure 7 and Figure 10), leading to increased accumulation of ADMQ in soybean and an increase in the overall benefits of the intercropping systems. After crop replacement, the comprehensive benefits of drip irrigation treatments were higher than those of flood irrigation treatments. The reason for the observation could be that drip irrigation can effectively improve water and nutrient utilization efficiency when compared to flood irrigation [43], which enhances the growth and development of crops, as well as ADMQ accumulation, and increases crop yield, thereby resulting in higher RLDs under drip irrigation treatments than those observed under flood irrigation treatments. Maize RLD did not contribute significantly toward PC1 in 2020, although all nine indicators contributed significantly toward PC1 in 2021. The observation could be because of delayed maize planting in 2020 and low temperatures during the reproductive period of maize, which reduced maize growth. The effect of RLD on overall efficiency at the beginning of the maize reproductive period was weaker than that at the end of the reproductive period. The combined benefits of the intercropping systems increased with increases in irrigation and fertilizer application, which could be due to the experimental setting of irrigation and fertilizer application intervals within the range of their positive effects. Nevertheless, the effects of further increases in irrigation and fertilizer application on the combined benefits of intercropping systems remain unknown and require further studies. Drip irrigation was selected under situations with complete water supply facilities, and flood irrigation under situations with incomplete water supply facilities, based on the soil moisture, nutrient, root distribution patterns, comprehensive benefit analysis, and combined local natural and economic conditions. Based on our findings, drip and flood irrigation with an upper irrigation limit of 80% Fc and fertilizer application rate of N 412.4 kg∙hm−2 + P2O5 168.8 kg∙hm−2 + K2O 168.8 kg∙hm−2 are recommended for optimal water and fertilizer regulation.

5. Conclusions

The results of this study revealed that total SWC decreased after crop replacement and the decrease in SWC was greater under drip irrigation treatments than under flood irrigation treatments. No significant difference was observed in TP content with soil depth before crop replacement; however, TP content decreased gradually with an increase in soil depth after crop replacement. TP contents under drip irrigation treatments were lower than those under flood irrigation treatments before crop replacement, but higher than those under flood irrigation treatments after crop replacement. In addition, NN, AN, and OM contents increased after crop replacement, whereas TP content decreased. Therefore, P fertilizer should be applied after soybean replacement. Horizontal extension of the apple-tree root system and aboveground dry matter accumulation increased. A significant difference was observed in Yd between drip and flood irrigation treatments. Apple tree and maize RLDs did not have significant effects on WUE, PFP, or ET before crop replacement. Apple tree and soybean RLDs exhibited significant negative correlations with WUE, nonsignificant negative correlations with PFP, and significant positive correlations with ET after crop replacement. Therefore, water demand and supply after crop replacement in intercropping systems should be taken into consideration. The combined benefits of all treatments increased after crop replacement, with the benefits being higher under drip irrigation treatments than under flood irrigation treatments. Drip irrigation was selected in situations with complete water supply facilities, whereas flood irrigation was selected in situations with incomplete water supply facilities, based on soil moisture, nutrients, root distribution patterns, comprehensive benefit analysis, and local natural and economic conditions of the study area. Drip and flood irrigation with an upper irrigation limit of 80% Fc and a fertilizer application rate of N 412.4 kg∙hm−2 + P2O5 168.8 kg∙hm−2 + K2O 168.8 kg∙hm−2 are recommended for efficient water and fertilizer regulation.

Author Contributions

Conceptualization, C.X. and R.W.; methodology, C.X. and R.W.; software, X.D. and C.L.; validation, R.W.; formal analysis, X.W.; investigation, W.X. and Q.W.; resources, C.X.; data curation, C.X.; writing—original draft preparation, C.X.; writing—review and editing, C.X. and R.W.; visualization, C.X.; supervision, R.W.; project administration, R.W. All authors have read and agreed to the published version of the manuscript.

Funding

This research was funded by National Key Research and Development Program of China (2022YFE0115300) and National Natural Science Fund (32271960).

Data Availability Statement

The data presented in this study are available on request from the corresponding author. The data are not publicly available due to ethical restrictions.

Acknowledgments

We are grateful for the support from the Forest Ecosystem Studies, National Observation and Research Station, Jixian, Shanxi, China.

Conflicts of Interest

The authors declare no conflict of interest.

Abbreviations

NNNitrate nitrogen
ETWater use
WUEWater use efficiency
ARLDApple root length density
ANAmmonium nitrogen
SWCSoil water content
RLDRoot length density
ADMQAboveground dry matter quality
OMOrganic matter
PFPPartial fertilizer productivity
MRLDMaize root length density
GYSeed yield
TPTotal phosphorus
IWUEIrrigation water use efficiency
SRLDSoybean root length density
PCAPrincipal component analysis

References

  1. Yun, L.; Bi, H.; Gao, L.; Zhu, Q.; Ma, W.; Cui, Z.; Wilcox, B.P. Soil Moisture and Soil Nutrient Content in Walnut-Crop Intercropping Systems in the Loess Plateau of China. Arid Land Res. Manag. 2012, 26, 285–296. [Google Scholar] [CrossRef]
  2. Zhou, X.; Wang, R.; Gao, F.; Xiao, H.; Xu, H.; Wang, D. Apple and maize physiological characteristics and water-use efficiency in an alley cropping system under water and fertilizer coupling in Loess Plateau, China. Agric. Water Manag. 2019, 221, 1–12. [Google Scholar] [CrossRef]
  3. Moran, J.F.; Becana, M.; Iturbe-Ormaetxe, I.; Frechilla, S.; Klucas, R.V.; Aparicio-Tejo, P. Drought induces oxidative stress in pea plants. Planta Int. J. Plant Biol. 1994, 194, 346–352. [Google Scholar] [CrossRef]
  4. Meng, W.; Xing, J.; Niu, M.; Zuo, Q.; Wu, X.; Shi, J.; Sheng, J.; Jiang, P.; Chen, Q.; Ben-Gal, A. Optimizing fertigation schemes based on root distribution. Agric. Water Manag. 2023, 275, 107994. [Google Scholar] [CrossRef]
  5. Jiang, X.J.; Liu, W.; Chen, C.; Liu, J.; Yuan, Z.-Q.; Jin, B.C.; Yu, X.Y. Effects of three morphometric features of roots on soil water flow behavior in three sites in China. Geoderma 2018, 320, 161–171. [Google Scholar] [CrossRef]
  6. Wang, H.; Zhu, X.; Zakari, S.; Chen, C.; Liu, W.; Jiang, X.-J. Assessing the Effects of Plant Roots on Soil Water Infiltration Using Dyes and Hydrus-1D. Forests 2022, 13, 1095. [Google Scholar] [CrossRef]
  7. Cao, X.; Wu, T.; Sun, S.; Wu, C.; Wang, C.; Jiang, B.; Tao, J.; Yao, W.; Hou, W.; Yang, W.; et al. Evaluation by grafting technique of changes in the contribution of root-to-shoot development and biomass production in soybean (Glycine max) cultivars released from 1929 to 2006 in China. Crop Pasture Sci. 2019, 70, 585–594. [Google Scholar] [CrossRef]
  8. Gao, L.; Xu, H.; Bi, H.; Xi, W.; Bao, B.; Wang, X.; Bi, C.; Chang, Y. Intercropping Competition between Apple Trees and Crops in Agroforestry Systems on the Loess Plateau of China. PLoS ONE 2013, 8, e70739. [Google Scholar] [CrossRef] [PubMed]
  9. Ling, Q.; Gao, X.; Zhao, X.; Huang, J.; Li, H.; Li, L.; Sun, W.; Wu, P. Soil water effects of agroforestry in rainfed jujube (Ziziphus jujube Mill.) orchards on loess hillslopes in Northwest China. Agric. Ecosyst. Environ. 2017, 247, 343–351. [Google Scholar] [CrossRef]
  10. Zheng, C.; Wang, R.; Zhou, X.; Li, C.; Dou, X. Effects of mulch and irrigation regimes on water distribution and root competition in an apple-soybean intercropping system in Loess Plateau, China. Agric. Water Manag. 2021, 246, 106656. [Google Scholar] [CrossRef]
  11. Yu, Y.-Y.; Turner, N.C.; Gong, Y.-H.; Li, F.-M.; Fang, C.; Ge, L.-J.; Ye, J.-S. Benefits and limitations to straw- and plastic-film mulch on maize yield and water use efficiency: A meta-analysis across hydrothermal gradients. Eur. J. Agron. 2018, 99, 138–147. [Google Scholar] [CrossRef]
  12. Dou, X.; Wang, R.; Li, C.; Zheng, C.; Zhou, X. Spatial distribution of soil water, plant roots, and water use pattern under different drip fertigation regimes in an apple-soybean intercropping system on the Loess Plateau, China. Agric. Water Manag. 2022, 269, 107718. [Google Scholar] [CrossRef]
  13. Dou, X.; Wang, R.; Zhou, X.; Gao, F.; Yu, Y.; Li, C.; Zheng, C. Soil water, nutrient distribution and use efficiencies under different water and fertilizer coupling in an apple-maize alley cropping system in the Loess Plateau, China. Soil Tillage Res. 2022, 218, 105308. [Google Scholar] [CrossRef]
  14. Venter, Z.S.; Jacobs, K.; Hawkins, H.-J. The impact of crop rotation on soil microbial diversity: A meta-analysis. Pedobiologia 2016, 59, 215–223. [Google Scholar] [CrossRef]
  15. Chen, Y.L.; Palta, J.; Clements, J.; Buirchell, B.; Siddique, K.H.; Rengel, Z. Root architecture alteration of narrow-leafed lupin and wheat in response to soil compaction. Field Crops Res. 2014, 165, 61–70. [Google Scholar] [CrossRef]
  16. Yang, S.R.; Di, F. Research on Countermeasures for High-Quality Development of Agricultural Water-saving Irrigation in Shanxi Province. Water Resour. Dev. Manag. 2020, 57, 57–63. [Google Scholar]
  17. Zheng, C.; Wang, R.; Zhou, X.; Li, C.; Dou, X. Photosynthetic and growth characteristics of apple and soybean in an intercropping system under different mulch and irrigation regimes in the Loess Plateau of China. Agric. Water Manag. 2022, 266, 107595. [Google Scholar] [CrossRef]
  18. Parton, W.J.; Scurlock, J.; Ojima, D.S.; Gilmanov TG Scholes, R.J.; Schimel, D.S.; Kirchner, T.; Menaut, J.C.; Seastedt, T.; Moya, E.G. Observations and modeling of biomass and soil organic matter dynamics for the grassland biome worldwide. Glob. Biogeochem. Cycle 1993, 7, 785–809. [Google Scholar] [CrossRef]
  19. Kang, S.Z.; Shi, P.; Pan, Y.H.; Liang, Z.S.; Hu, X.T.; Zhang, J. Soil water distribution, uniformity, and water-use efficiency under alternate furrow irrigation in arid areas. Irrig. Sci. 2000, 19, 181–190. [Google Scholar] [CrossRef]
  20. Yan, Q.; Yang, F.; Dong, F.; Lu, J.; Li, F.; Duan, Z.; Zhang, J.; Lou, G. Yield loss compensation effect and water use efficiency of winter wheat under double-blank row mulching and limited irrigation in northern China. Field Crops Res. 2018, 216, 63–74. [Google Scholar] [CrossRef]
  21. Hou, X.-Y.; Wang, F.-X.; Han, J.-J.; Kang, S.-Z.; Feng, S.-Y. Duration of plastic mulch for potato growth under drip irrigation in an arid region of Northwest China. Agric. For. Meteorol. 2010, 150, 115–121. [Google Scholar] [CrossRef]
  22. Yaghi, T.; Arslan, A.; Naoum, F. Cucumber (Cucumis sativus L.) water use efficiency (WUE) under plastic mulch and drip irrigation. Agric. Water Manag. 2013, 128, 149–157. [Google Scholar] [CrossRef]
  23. Awodoyin, R.O.; Ogbeide, F.I.; Oluwole, O. Effects of Three Mulch Types on the Growth and Yield of Tomato (Lycopersicon esculentum Mill.) and Weed Suppression in Ibadan, Rainforest-savanna Transition Zone of Nigeria. Trop. Agric. Res. Ext. 2007, 10, 53–60. [Google Scholar] [CrossRef]
  24. Yun, L.; Bi, H.; Ren, Y.; Ma, W.; Tian, X. Soil Moisture Distribution at Fruit-Crop Intercropping Boundary in the Loess Region of Western Shanxi. J. Northeast For. Univ. 2009, 37, 70–78. [Google Scholar]
  25. Gao, L.B.; Bi, H.X.; Xu, H.S.; Bao, B.; Liao, W.C.; Wang, X.Y.; Bi, C.; Cheng, J.G. Characteristics of spatial and temporal dis-tribution of soil moisture in young apple + peanut intercropping sites in the loess area of western Jinjiang. China Soil Water Conserv. Sci. 2013, 11, 93–98. [Google Scholar]
  26. Isaac, M.E.; Borden, K.A. Nutrient acquisition strategies in agroforestry systems. Plant Soil 2019, 444, 1–19. [Google Scholar] [CrossRef]
  27. Lv, L.; Gao, Z.; Liao, K.; Zhu, Q.; Zhu, J. Impact of conservation tillage on the distribution of soil nutrients with depth. Soil Tillage Res. 2023, 225, 105527. [Google Scholar] [CrossRef]
  28. Vollmann, J.; Rischbeck, P.; Pachner, M.; Đorđević, V.; Manschadi, A.M. High-throughput screening of soybean di-nitrogen fixation and seed nitrogen content using spectral sensing. Comput. Electron. Agric. 2022, 199, 107169. [Google Scholar] [CrossRef]
  29. Zhang, H.; Hu, K.; Zhang, L.; Ji, Y.; Qin, W. Exploring optimal catch crops for reducing nitrate leaching in vegetable greenhouse in North China. Agric. Water Manag. 2019, 212, 273–282. [Google Scholar] [CrossRef]
  30. Owen, D.; Williams, A.P.; Griffith, G.W.; Withers, P.J.A. Use of commercial bio-inoculants to increase agricultural production through improved phosphrous acquisition. Appl. Soil Ecol. 2015, 86, 41–54. [Google Scholar] [CrossRef]
  31. Gärdenäs, A.I.; Hopmans, J.W.; Hanson, B.R.; Šimůnek, J. Two-dimensional modeling of nitrate leaching for various fertigation scenarios under micro-irrigation. Agric. Water Manag. 2005, 74, 219–242. [Google Scholar] [CrossRef]
  32. Zhao, J.; Wang, X.; Zhuang, J.; Cong, Y.; Lu, Y.; Guo, M. Fine-Crush Straw Returning Enhances Dry Matter Accumulation Rate of Maize Seedlings in Northeast China. Agronomy 2021, 11, 1144. [Google Scholar] [CrossRef]
  33. Oldroyd, G.E.D. Speak, friend, and enter: Signalling systems that promote beneficial symbiotic associations in plants. Nat. Rev. Microbiol. 2013, 11, 252–263. [Google Scholar] [CrossRef]
  34. Du, M.; Gao, Z.; Li, X.; Liao, H. Excess nitrate induces nodule greening and reduces transcript and protein expression levels of soybean leghaemoglobins. Ann. Bot. 2020, 126, 61–72. [Google Scholar] [CrossRef]
  35. Qi, D.; Hu, T.; Song, X.; Zhang, M. Effect of nitrogen supply method on root growth and grain yield of maize under alternate partial root-zone irrigation. Sci. Rep. 2019, 9, 8191. [Google Scholar] [CrossRef] [PubMed]
  36. Raza, M.A.; Yasin, H.S.; Gul, H.; Qin, R.; Din, A.M.U.; Bin Khalid, M.H.; Hussain, S.; Gitari, H.; Saeed, A.; Wang, J.; et al. Maize/soybean strip intercropping produces higher crop yields and saves water under semi-arid conditions. Front. Plant Sci. 2022, 13, 1006720. [Google Scholar] [CrossRef]
  37. Gao, Y.; Duan, A.; Qiu, X.; Liu, Z.; Sun, J.; Zhang, J.; Wang, H. Distribution of roots and root length density in a maize/soybean strip intercropping system. Agric. Water Manag. 2010, 98, 199–212. [Google Scholar] [CrossRef]
  38. Wang, E.; Smith, C.J. Modelling the growth and water uptake function of plant root systems: A review. Aust. J. Agric. Res. 2004, 55, 501–523. [Google Scholar] [CrossRef]
  39. Goldenberg, M.G.; Burian, A.; Seppelt, R.; Ossa, F.A.S.; Bagnato, C.E.; Satorre, E.H.; Martini, G.D.; Garibaldi, L.A. Effects of natural habitat composition and configuration, environment and agricultural input on soybean and maize yields in Argentina. Agric. Ecosyst. Environ. 2022, 339, 108133. [Google Scholar] [CrossRef]
  40. Abaidoo, R.C.; Kessel, C.V. 15N-uptake, N2-fixation and rhizobial interstrain competition in soybean and bean, inter-cropped with maize. Soil Biol. Biochem. 1989, 21, 155–159. [Google Scholar] [CrossRef]
  41. Liu, Y.-X.; Zhang, W.-P.; Sun, J.-H.; Li, X.-F.; Christie, P.; Li, L. High morphological and physiological plasticity of wheat roots is conducive to higher competitive ability of wheat than maize in intercropping systems. Plant Soil 2015, 397, 387–399. [Google Scholar] [CrossRef]
  42. Wang, Y.; Yin, W.; Hu, F.; Fan, Z.; Zhao, C.; Yu, A.; Chai, Q. Interspecies interaction intensity influences water consumption in wheat-maize intercropping by regulating root length density. Crop Sci. 2022, 62, 441–454. [Google Scholar] [CrossRef]
  43. Li, Z.; Zong, R.; Wang, T.; Wang, Z.; Zhang, J. Adapting Root Distribution and Improving Water Use Efficiency via Drip Ir-rigation in a Jujube (Zizyphus jujube Mill.) Orchard after Long-Term Flood Irrigation. Agriculture 2021, 11, 1184. [Google Scholar] [CrossRef]
Figure 1. Geographical location of the study area.
Agronomy 13 02706 g001
Figure 2. Experimental plots and indicator-monitoring points in 2020 and 2021.
Agronomy 13 02706 g002
Figure 3. Precipitation, irrigation, and temperature in the growth period from 2020 to 2021. The numbers in the graph represent the total amount of rainfall (mm) in 24 h.
Agronomy 13 02706 g003
Figure 4. The soil water content of apple–maize and apple–soybean intercropping systems in the horizontal direction from 2020 to 2021. D, W, F, W × F, and D × W × F represent the effect of horizontal distance from apple trees; irrigation; fertilizer application; two interactions, of irrigation and fertilizer application; and three interactions, of horizontal distance, irrigation and fertilizer application, on soil water content for each year, respectively. * Indicates significant, at the 0.05 level; ** indicates very significant, at the 0.01 level; and ns indicates not significant. (ad) represent soil water content at maize seeding stage and jointing stage, and soybean podding stage and maturity stage, respectively; the letters D and M in the horizontal axis represent drip and flood irrigation, respectively; W0, W1, and W2 represent rainfed without irrigation and irrigation at the upper limits of 50% and 80% of the field holding capacity, respectively; and F0, F1, and F2 represent a lack of additional fertilizer application and 50% and 100% of the farmers’ usual levels of fertilizer application, respectively.
Agronomy 13 02706 g004
Figure 5. Soil water content in the vertical direction in apple–maize and apple–soybean intercropping systems from 2020 to 2021. S, W, F, W × F, and S × W × F represent the effects of soil depth, irrigation, fertilizer application, the interaction of both irrigation and fertilizer application, and the interaction of the three factors of soil depth, irrigation, and fertilizer application on the soil water content in each year, respectively. * Indicates significant, at the 0.05 level; ** indicates very significant, at the 0.01 level; and ns indicates not significant. (ad) represent soil water content at maize seeding stage and jointing stage, and soybean podding stage and maturity stage, respectively; the letters D and M in the horizontal axis represent drip and flood irrigation, respectively; W0, W1, and W2 represent rainfed without irrigation and irrigation at the upper limits of 50% and 80% of field holding capacity, respectively; and F0, F1, and F2 represent a lack of additional fertilizer application and 50% and 100% of farmers’ usual levels of fertilizer application, respectively.
Agronomy 13 02706 g005
Figure 6. Soil nutrient content of the apple–maize intercropping system in the horizontal direction, where D, W, F, W × F and D × W × F represent the effects of horizontal distance, irrigation, fertilization, irrigation–fertilization interaction, and the three-way interaction of horizontal distance, irrigation, and fertilization on each of the indicators of soil nutrients; NN, AN, OM, and TP represent nitrate nitrogen, ammoniacal nitrogen, organic matter, and total phosphorus. * Indicates significant, at the 0.05 level; ** indicates very significant, at the 0.01 level; and ns indicates not significant. In the figure, (a,c,e,g) represent the nutrient content of maize at the seeding stage, while (b,d,f,h) represent the nutrient content of maize at the jointing stage. The letters D and M in the horizontal axis represent drip and flood irrigation, respectively; W0, W1, and W2 represent rainfed without irrigation and irrigation at the upper limits of 50% and 80% of field holding capacity, respectively; and F0, F1, and F2 represent a lack of additional fertilizer application and 50% and 100% of farmers’ usual levels of fertilizer application, respectively.
Agronomy 13 02706 g006
Figure 7. Soil nutrient content of the apple–soybean intercropping system in the horizontal direction, where D, W, F, W × F and D × W × F represent the effects of horizontal distance, irrigation, fertilization, irrigation–fertilization interaction, and the three-way interaction of horizontal distance, irrigation, and fertilization on each of the indicators of soil nutrients; NN, AN, OM, and TP represent nitrate nitrogen, ammoniacal nitrogen, organic matter, and total phosphorus. * Indicates significant, at the 0.05 level, ** indicates very significant, at the 0.01 level, and ns indicates not significant; in the figure, (a,c,e,g) represent the nutrient content of soybean at the podding stage while (b,d,f,h) represent the nutrient content of soybean at the maturing stage. The letters D and M in the horizontal axis represent drip and flood irrigation, respectively; W0, W1, and W2 represent rainfed without irrigation and irrigation at the upper limits of 50% and 80% of field holding capacity, respectively; and F0, F1, and F2 represent a lack of additional fertilizer application and 50% and 100% of farmers’ usual levels of fertilizer application, respectively.
Agronomy 13 02706 g007
Figure 8. Soil nutrient content of the apple–maize intercropping system in the vertical direction, where (ad) represent soil nitrate nitrogen, ammoniacal nitrogen, organic matter, and total phosphorus, respectively; S, W, F, W × F, and S × W × F represent the effects of soil depth, irrigation, fertilization, irrigation–fertilization interaction, and depth, irrigation and fertilization interaction on each index of soil nutrients, respectively; NN, AN, OM, and TP represent nitrate nitrogen, ammoniacal nitrogen, organic matter, and total phosphorus. * Indicates significant, at the 0.05 level; ** indicates very significant, at the 0.01 level; and ns indicates not significant. The letters D and M on the vertical bar indicate drip and flood irrigation, respectively; W0, W1, and W2 indicate rainfed without irrigation and irrigation at 50% and 80% of the upper limits of the field holding capacity, respectively; and F0, F1, and F2 represent a lack of additional fertilizer application and 50% and 100% of farmers’ usual levels of fertilizer application, respectively.
Agronomy 13 02706 g008
Figure 9. Soil nutrient content of the apple–soybean intercropping system in the vertical direction, where (ad) represent soil nitrate nitrogen, ammoniacal nitrogen, organic matter, and total phosphorus, respectively; S, W, F, W × F, and S × W × F represent the effects of soil depth, irrigation, fertilization, irrigation–fertilization interaction, and depth, irrigation, and fertilization interaction on each index of soil nutrients, respectively; NN, AN, OM, and TP represent nitrate nitrogen, ammoniacal nitrogen, organic matter, and total phosphorus. * Indicates significant, at the 0.05 level, ** indicates very significant, at the 0.01 level, and ns indicates not significant. The letters D and M on the vertical bar indicate drip and flood irrigation, respectively; W0, W1, and W2 indicate rainfed without irrigation and irrigation at 50% and 80% of the upper limit of the field holding capacity, respectively; and F0, F1, and F2 represent a lack of additional fertilizer application and 50% and 100% of farmers’ usual levels of fertilizer application, respectively.
Agronomy 13 02706 g009
Figure 10. Root-length density distribution of maize, soybean, and two-year-old apple trees in 2020 and 2021. S, D, W, F, and W × F represent the effect of depth, distance from the tree, irrigation, fertilizer application, and interaction of irrigation and fertilizer application on the root system, respectively. * Indicates significant, at the 0.05 level; ** indicates very significant, at the 0.01 level; and ns indicates not significant. The letters D and M on the horizontal axis denote drip and flood irrigation, respectively; W0, W1, and W2 denote rain-fed without irrigation and irrigated at 50% and 80% of the upper field holding capacity, respectively; and F0, F1, and F2 represent a lack of additional fertilizer application and 50% and 100% of farmers’ usual levels of fertilizer application, respectively.
Agronomy 13 02706 g010
Figure 11. (a,b) represent the apple–maize intercropping system in 2020 and the apple–soybean intercropping system in 2021, respectively. MRLD, SRLD, ARLD, ADMQ, and Yd represent apple, maize, and soybean root-length density, aboveground dry matter quality and yield, respectively; SWC, NN, AN, OM, and TP represent the mean values of soil moisture, nitrate nitrogen, ammonium nitrogen, organic matter, and total phosphorus content during the reproductive period of the intercropping system; and PC1, PC2, and PC3 represent the first, second, and third principal components, respectively (n = 60).
Agronomy 13 02706 g011
Figure 12. Diagram of structural equation modelling. Notes: Single arrows represent path coefficients, double arrows represent correlation coefficients, black solid lines represent positive path coefficients, red solid lines represent negative path coefficients, W and F represent water and nutrients, respectively, and NN1, AN1, OM1, TP1, NN2, AN2, OM2, TP2 represent the content of nitrate nitrogen, ammonia nitrogen, organic matter and total phosphorus in maize during the seeding stage (soybean podding stage) and the content of nitrate nitrogen, ammonia nitrogen, organic matter and total phosphorus in maize during the jointing stage (soybean maturing stage), respectively; SWC1 and SWC2 represent soil water content at the maize seeding stage (soybean podding stage) and soil water content at the maize jointing stage (soybean maturing stage), respectively; ARLD, MRLD, SRLD, and Yd represent apple, maize, and soybean root-length density and yield, respectively; and WUE and PFP represent water use efficiency and partial fertilizer productivity, respectively. ** indicates significant at the 0.01 level and * indicates significant at the 0.05 level.
Agronomy 13 02706 g012
Table 1. Background values of soil nutrients in the apple orchard.
Depth of Soil LayerNitrate Nitrogen
(mg/kg)
Ammonia Nitrogen
(mg/kg)
Organic Mass
(g/kg)
Total Phosphorus
(g/kg)
0–20 cm35.616.225.620.71
20–40 cm23.094.684.540.67
40–60 cm15.095.514.310.65
60–100 cm5.684.733.910.67
Table 2. Water consumption, aboveground dry matter mass, yield, and water and fertilizer use efficiency in apple–maize and apple–soybean intercropping systems, 2020–2021.
YearTreatmentET (mm)ADMQ (kg/hm2)Maize/SoybeanPFP (kg/kg)IWUE (kg/m3)WUE (g/L)
A/CB/DGrowth PeriodYield (kg/hm2)
2020D-W1F0180.0 bc48.5 e228.6 abcde9083.3 de7470.6 cdef-74.7 b32.9 bc
D-W1F1177.9 bcd39.7 f217.6 def7838.1 fg7591.6 bcde101.2 ab70.9 ab35.2 bc
D-W1F2180.3 bc30.5 g210.8 ef9055.3 de7895.8 ab52.6 cd80.0 a37.8 abc
M-W1F0189.4 ab52.8 e242.2 ab9526.1 cd7417.8 cdef-74.2 b30.8 c
M-W1F1188.6 ab19.2 h207.7 efg7661.9 gh7619.5 bcde101.6 ab76.2 ab36.9 abc
M-W1F2169.1 cde51.4 e220.5 bcdef7837.5 fgh7743.7 bcd51.6 cd77.4 ab35.4 bc
D-W2F0148.2 fgh96.0 a244.2 a8603.3 defg7638.2 bcde-30.6 c31.5 c
D-W2F1155.0 efg47.5 e202.5 fg9563.6 cd7883.4 ab105.1 a31.5 c39.1 ab
D-W2F2151.2 fgh36.0 fg187.2 g12,845.6 a8190.6 a54.6 c32.8 c44.0 a
M-W2F0162.6 def77.6 c240.2 abc8000.0 efgh7591.6 bcde-30.4 c31.8 bc
M-W2F1142.2 gh86.1 b228.2 abcde8891.4 def7780.9 bc103.7 a30.1 c34.3 bc
M-W2F2135.3 h80.3 bc215.7 def11,596.4 b7787.1 bc51.9 cd30.2 c36.3 bc
W0F1164.6 cdef69.0 d233.6 abcd10,328.3 c7262.6 ef101.6 ab-31.2 c
W0F2154.6 efg63.2 d217.8 def8409.7 defg7380.6 def48.4 d-34.1 bc
CK202.4 a15.9 h218.3 cdef6912.5 h7119.8 f--32.8 bc
2021D-W1F0115.1 de271.0 ab386.1 cd12,585.5 cd2632.3 abc-4.5 ab6.8 abcde
D-W1F1100.3 fg259.6 bc359.9 ef11,019.3 ef2693.0 abc7.2 a4.6 a7.5 ab
D-W1F297.4 fg233.0 e330.4 g12,128.4 de2556.7 bcde3.4 b4.3 ab7.7 ab
M-W1F0108.4 ef278.8 a387.2 cd11,314.4 def2207.4 cde-3.7 b5.7 ef
M-W1F190.3 g263.5 bc353.8 efg13,532.2 bc2596.5 bcd6.9 a4.4 ab7.3 abcd
M-W1F2156.2 a257.3 c413.6 ab12,128.4 b2501.6 bcde3.3 b4.2 ab6.0 cdef
D-W2F0143.0 b228.9 e371.9 de16,538.4 a3021.7 ab-2.6 cd8.1 a
D-W2F1140.6 b277.5 a418.1 a16,327.3 a2781.0 ab7.4 a2.4 cd6.7 bcdef
D-W2F2143.5 ab257.8 c401.4 abc17,576.3 a3125.7 a4.2 b2.7 c7.8 ab
M-W2F0123.7 cd262.6 bc386.3 cd11,037.3 ef2089.7 de-1.8 d5.4 f
M-W2F1135.3 bc254.2 c389.4 bcd13,607.6 bc2746.2 ab7.3 a2.4 cd7.1 abcde
M-W2F2137.9 b252.6 cd390.5 bcd14,333.8 b2898.6 ab3.9 b2.5 cd7.4 abc
W0F1135.4 bc260.5 bc395.9 abcd14,755.9 b2710.1 abc7.2 a-6.9 abcde
W0F2132.4 bc258.1 c390.5 bcd16,607.5 a2712.9 abc3.6 b-7.0 abcde
CK103.0 efg240.7 de343.7 fg10,087.3 f2043.1 e--5.9 def
Significance test (F-value)
W50.1 **13.0 **3.4 **11.8 **4.5 **0. 2 ns2427.4 **0.4 ns
F1.5 ns3.0 **7.9 **3.8 **5.0 **15.7 **3795.6 **6.8 **
W × F1.5 ns5.4 **3.1 **16.8 **0.4 ns1.6 ns0.9 ns1.3 ns
Year99.1 **227.6 **18.3 **116.0 **3508.9 **56.6 **81.7 **1074.4 **
Note: A–D in the table represent the maize seeding stage, soybean podding stage, maize jointing stage, and soybean maturing stage, respectively. Significant differences (p < 0.05) exist between different letters in the same column. ET, ADMQ, PFP, IWUE, and WUE represent water consumption, aboveground dry matter mass, partial fertilizer productivity, irrigation water use efficiency, and water use efficiency, respectively; W and F represent irrigation and fertilizer application, respectively. ** indicates very significant at 0.01 level, and ns indicates not significant.
Table 3. Comprehensive score and ranking for all treatments in 2020–2021.
YearD-W1F0D-W1F1D-W1F2M-W1F0M-W1F1M-W1F2D-W2F0D-W2F1D-W2F2M-W2F0M-W2F1M-W2F2W0F1W0F2CK
2020−1.53
(26)
−1.00
(22)
−0.01
(15)
−1.73
(27)
−1.92
(29)
−0.47
(19)
−1.02
(23)
−0.46
(18)
1.06
(8)
−1.21
(24)
−0.65
(21)
0.75
(11)
−1.49
(25)
−0.61
(20)
−3.02
(30)
20210.04
(14)
0.98
(9)
1.50
(3)
−0.34
(17)
−0.06
(16)
1.43
(5)
0.95
(10)
1.34
(6)
2.97
(1)
0.70
(12)
1.06
(7)
2.49
(2)
0.58
(13)
1.43
(4)
−1.73
(28)
Note: The numbers in parentheses are the rankings of the combined scores for each treatment.
Disclaimer/Publisher’s Note: The statements, opinions and data contained in all publications are solely those of the individual author(s) and contributor(s) and not of MDPI and/or the editor(s). MDPI and/or the editor(s) disclaim responsibility for any injury to people or property resulting from any ideas, methods, instructions or products referred to in the content.

