1. Introduction
Agaricus bisporus is one of the world’s most produced and consumed edible mushroom [
1,
2,
3]. With the increasing demand for
A. bisporus, its production mode has developed from traditional small-household cultivation to large-scale industrialized intelligent cultivation [
4,
5]. Several production processes have been mechanized, such as ruffling machines [
6], continuous fill plate-put plate devices with second-phase compost [
7], and intelligent control of the environment [
8]. However, the picking process still relies on traditional manual labor. Like other agricultural industries, the mushroom industry is facing labor shortages and rising costs. The cost of manual picking is high, usually accounting for about 15–30% of total production costs [
9]. In addition, there are other problems involving low picking efficiency, limited working time, and inconsistent grading standards. Mechanical harvesters have been used since the late 1970s and can significantly increase harvesting efficiency [
9]. However, mechanical harvesting is not selective, and it is very harsh on the quality of the mushrooms [
10]. Mushrooms can be bruised during mechanical harvesting. With the growth in scale and output of the
A. bisporus industry, the development of a further intelligent automatic harvesting system for
A. bisporus is necessary.
Accurate recognition of
A. bisporus through computer vision is a prerequisite for intelligent harvesting. The medium of the
A. bisporus seedling bed is complex and disturbed by weeds, soil, and a large number of mycelia. Additionally, mushrooms grow at irregular rates and intervals, causing irregular size, maturity, and spacing from each other, accompanied by tilt and adhesive overlap. Therefore, their recognition is very challenging. To this end, global scholars have conducted extensive research. Tillett and Batchelor [
11] designed a recognition algorithm according to the different grayscale values of the top and edge of
A. bisporus. However, it had high light requirements with a success rate of only 72%. Similarly, Yu et al. [
12] segmented individual mushrooms based on a sequential scan algorithm according to the gray distribution characteristics of
A. bisporus images. Qiu et al. [
13] identified mushrooms by extracting mushroom boundaries, locating mushroom center coordinates, and calculating the perimeter. However, the effect of segmentation on overlapping mushrooms was limited. The above studies are based on RGB images for recognition. Ji et al. [
14] introduced image depth information based on the three-dimensional longitudinal structure characteristics of
A. bisporus and developed a “submersion method“ to filter out the matrix background and segment the adherent mushroom clusters. Then, they used Hough circle detection to measure the diameter of
A. bisporus and achieved a recognition success rate of 92.37%. Masoudian [
15] segmented images in a more intuitive HSV color space and obtained each mushroom’s center position and perimeter using the image gradient information and the Hough transform method.
All the above studies adopt traditional digital image processing techniques to identify targets based on color, shape, and texture features. With the development of artificial intelligence and computer computing power, some target recognition methods based on deep learning neural networks have been applied to recognize
A. bisporus. Lee et al. [
16] obtained a three-dimensional point cloud of
A. bisporus with a depth camera and used a Faster regional convolutional neural network (R-CNN) model to segment overlapping and adherent mushroom clusters and identify individual mushrooms with an accuracy of 70.93%. Lu et al. [
17,
18] used a convolutional neural network to measure the mushroom size and to count the number of mushrooms. Cao [
19] proposed a multimodal attention fusion network architecture based on the CenterNet target detection method and demonstrated through experiments that the recognition of
A. bisporus can be better achieved under different light intensities. Deep learning methods can achieve higher target recognition rates than traditional digital image processing techniques. However, they require huge training datasets and long training time, and the algorithm runs for a long time with low real-time performance. Saddik et al. used embedded systems to perform complicated real-time tasks, such as monitoring indices, weed detection, and mapping agricultural soil [
20,
21,
22]. Their work showed that the embedded system offers a low-cost solution to processing images in real-time and embedded systems based on artificial intelligence give more flexibility in the field of precision agriculture [
23].
In summary, there are few studies on recognition algorithms for A. bisporus, and they have some application limitations. This paper thoroughly investigates the image information of A. bisporus and proposes a segmentation and recognition method. The main contributions of this paper are summarized as follows.
- (1)
We propose a foreground extraction method to extract A. bisporus from complex backgrounds.
- (2)
A preliminary segmentation algorithm is designed to solve the problem of pseudo-extreme points formed after distance transformation for large-scale adherent mushroom clusters.
- (3)
An iterative marker generation method is proposed to effectively mark individual mushrooms from adherent mushroom clusters by dynamically adjusting the threshold value of the global threshold segmentation algorithm, together with distance transformation and area filtering. Then, we use the marker-controlled watershed algorithm to identify and segment mature mushroom individuals.
2. Materials and Methods
The flow of the
A. bisporus segmentation and recognition algorithm is shown in
Figure 1. First, the image background was filtered using histogram equalization [
24,
25], Otsu threshold segmentation [
26], and morphological operations [
27,
28] to extract foreground images containing only
A. bisporus. Then, individual mushroom markers were prepared by preliminary segmentation as well as by the iterative marker generation method based on distance transformation, global threshold segmentation, and area filtering. The
A. bisporus was subsequently segmented using a marker-controlled watershed algorithm. Finally, the bounding rectangle method was adopted to calculate mushroom cap diameter and center position to identify and locate
A. bisporus. All algorithms were implemented based on OpenCV (Open Source Computer Vision) libraries, which include a wide catalog of highly optimized computer vision algorithms.
2.1. Background Filtering and Foreground Extraction
The size of the image to be processed was 600 × 450 pixels. After acquiring the grayscale image of
A. bisporus, the contrast of the
A. bisporus image was first enhanced using the histogram equalization algorithm. Then the image was binarized using the Otsu algorithm, as shown in
Figure 2. The dark matrix background and the light mushroom foreground in the
A. bisporus image should be easily distinguishable after binarization. However, the white mycelia and immature mushrooms across the matrix blur the boundary between the matrix and the mature mushroom, causing significant interference in identifying
A. bisporus.
For the effective recognition and localization of
A. bisporus, the cluttered matrix background should first be filtered to obtain the foreground image of
A. bisporus. The process is shown in
Figure 3 and Algorithm 1.
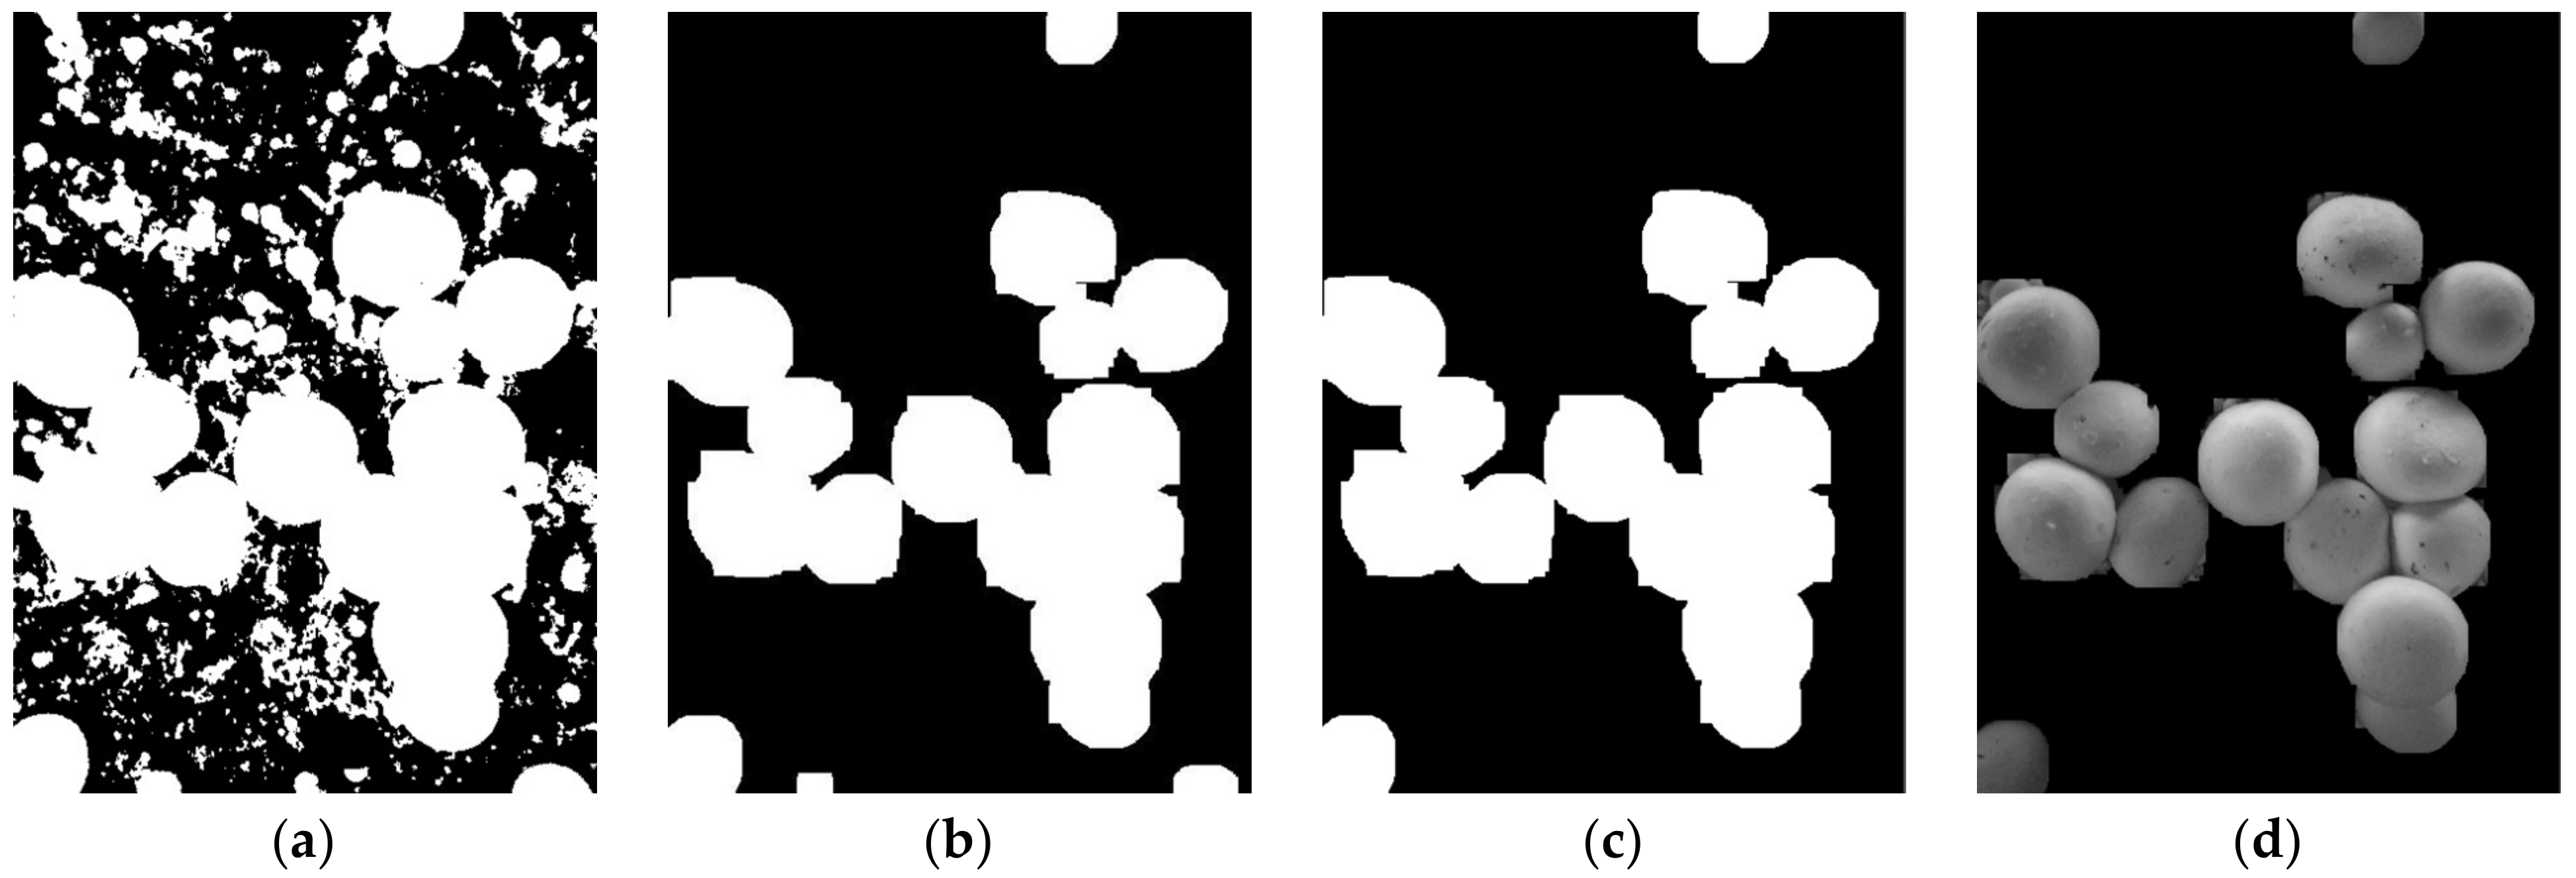
As shown in
Figure 2, the domains corresponding to mature
A. bisporus after binarization are large white blocks, and scattered mycelia and immature mushrooms form many small noises, burrs, and fine connections in the matrix background. The binary image was processed using the morphological opening operation according to the image features. After comparing several trials, a structural element with a rectangular shape and 7 × 7 size was finally used for multiple open operations, considering the real-time demand of image recognition. The ratio of pixel size of the structural element to pixel size of the image is 1.81%. The results are shown in
Figure 4b. As shown in the figure, the mycelia and small immature mushrooms in the background have been filtered out, but not the mushrooms at the edges of the image that were not fully captured due to the limitation of camera views (collection completeness was less than 50%). There can be a significant error in positioning and measuring the diameter of these mushroom caps. Therefore, the area of all contours in
Figure 4b was calculated using the
contourArea function [
29], and the contours of small areas corresponding to incomplete mushrooms were filtered out, thereby obtaining
Figure 4c with the background completely filtered. The original image was processed with the “and” operation to obtain the foreground image of
A. bisporus.
| Algorithm 1 Background filtering and foreground extraction. |
![Agronomy 13 00347 i001]() |
To verify the foreground extraction effect of the proposed algorithm, we manually separated the
A. bisporus region in the image using Photoshop software, and the separation result was used as the standard image. The error between the extraction results using the proposed algorithm and the standard image was calculated, as shown in
Figure 5. Here,
Figure 5a is the grayscale image of
A. bisporus;
Figure 5b shows the manual extraction result;
Figure 5c indicates the result of the foreground extraction algorithm presented in this paper;
Figure 5d, the error binary image, shows the difference between
Figure 5b,c, representing the background parts misused as foreground.
To objectively measure the algorithm’s foreground extraction performance, we introduce the error rate (
ER) used in the literature [
30] as the objective evaluation criterion. The
ER is a common method to evaluate the quality of image segmentation and is calculated as follows:
where
denotes the total number of pixels in the error region, i.e., the total number of pixels in the white region in
Figure 5d, and
represents the total number of pixels in the image. The proposed algorithm was used to process three sets of
A. bisporus images.
To find the impact of resolution, we compared the performance of the algorithm with the same image at different resolutions. The results of the ER are shown in
Table 1, indicating that the interference factors in the matrix of
A. bisporus can be basically removed, laying a good foundation for the subsequent recognition of
A. bisporus. From the table, we can see that the resolution has minimal impact on the ER. We subsequently chose low-resolution images to implement the segmentation algorithm to reduce processing time.
2.2. Watershed Algorithm Segmentation Based on Iterative Markers
For intelligent picking of A. bisporus, it is essential to obtain the diameter and center position of the cap of each individual mushroom. Therefore, the algorithm does not only need to extract the foreground of A. bisporus but also to segment and identify the adherent mushrooms accurately.
2.2.1. Principle of Watershed Algorithm Based on Distance Transformation
The watershed algorithm is a widely-used image segmentation method based on geomorphic analysis [
31,
32]. It analogizes the grayscale space of images to the geographic structure of the earth’s surface, uses local gradient difference in touching areas, and identifies dividing lines through a simulation process of water surface rising from kernel areas under the pixel gradient constraints.
The surface grayscale values of mature
A. bisporus are similar, which is suitable for the watershed algorithm. However, the traditional watershed algorithm is susceptible to noise points and other disturbances and produces over-segmentation due to excessive local minima. These problems can be improved by manual markers. When segmenting the image, a marker-controlled watershed algorithm designates the pixels with relatively high grayscale values as the starting points of the water rise, i.e., “marking” [
33,
34]. Ideally, each target
A. bisporus to be segmented will correspond to a marker. Too many markers will lead to over-segmentation and an increased false rate, while too few markers will cause some mushrooms to be unrecognizable and an increased miss rate. We chose the distance transformation algorithm [
35] to obtain more accurate foreground markers. The distance transform can convert an input binary image into a grayscale image. The grayscale value of each pixel is related to its closest distance to the edge of the background. A farther distance indicates greater pixel grayscale values. Euclidean distance (DIST_L2) [
36] is used as the distance measure for transformation in this algorithm. The distance calculation formula is as follows:
where
is the Euclidean distance between pixel points (
,
) and (
,
).
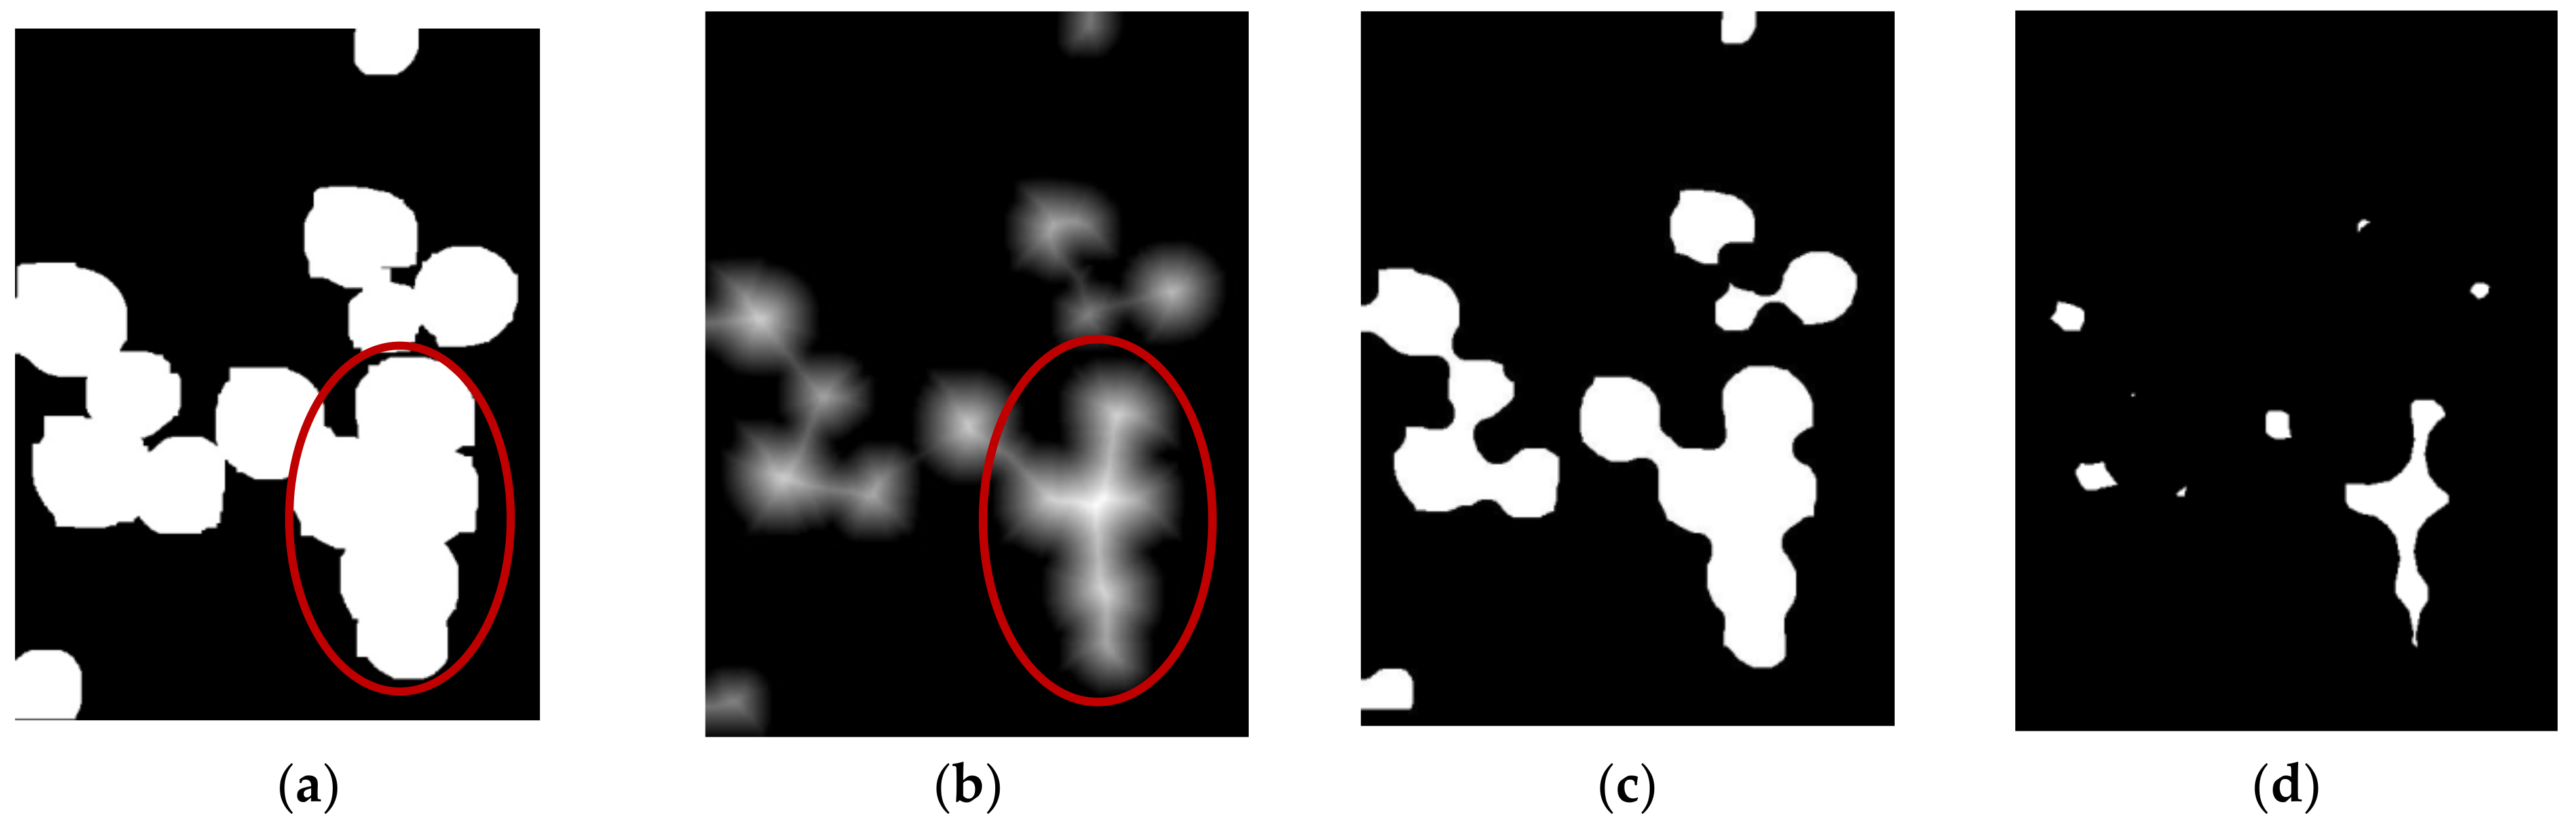
The foreground image of
A. bisporus obtained in the previous section was converted into a binary image. Then, a foreground marker image was obtained after Otsu binarization, distance transformation, and global threshold segmentation, as shown in
Figure 6.
As shown in the figure, the effect of directly using the distance transformation algorithm to prepare markers is not satisfactory. There are two reasons: One is that large-scale adhesion of mushrooms can lead to pseudo-extreme points, resulting in false segmentation, as shown in the red circles in
Figure 6. The other is that the diameter of each mushroom is different. After distance transformation of mushrooms with significant differences in diameter, the grayscale value difference at the extreme value points in the center of the mushroom caps is also significant. If the threshold value is too low for global threshold segmentation, adhering mushrooms cannot be segmented, as shown in
Figure 6c. If the threshold value is too high, the mushrooms with low central grayscale values will be ignored, resulting in missed picking, as shown in
Figure 6d. To obtain accurate segmentation results, we must solve the above two problems.
2.2.2. Preliminary Segmentation of Adherent Mushroom Clusters
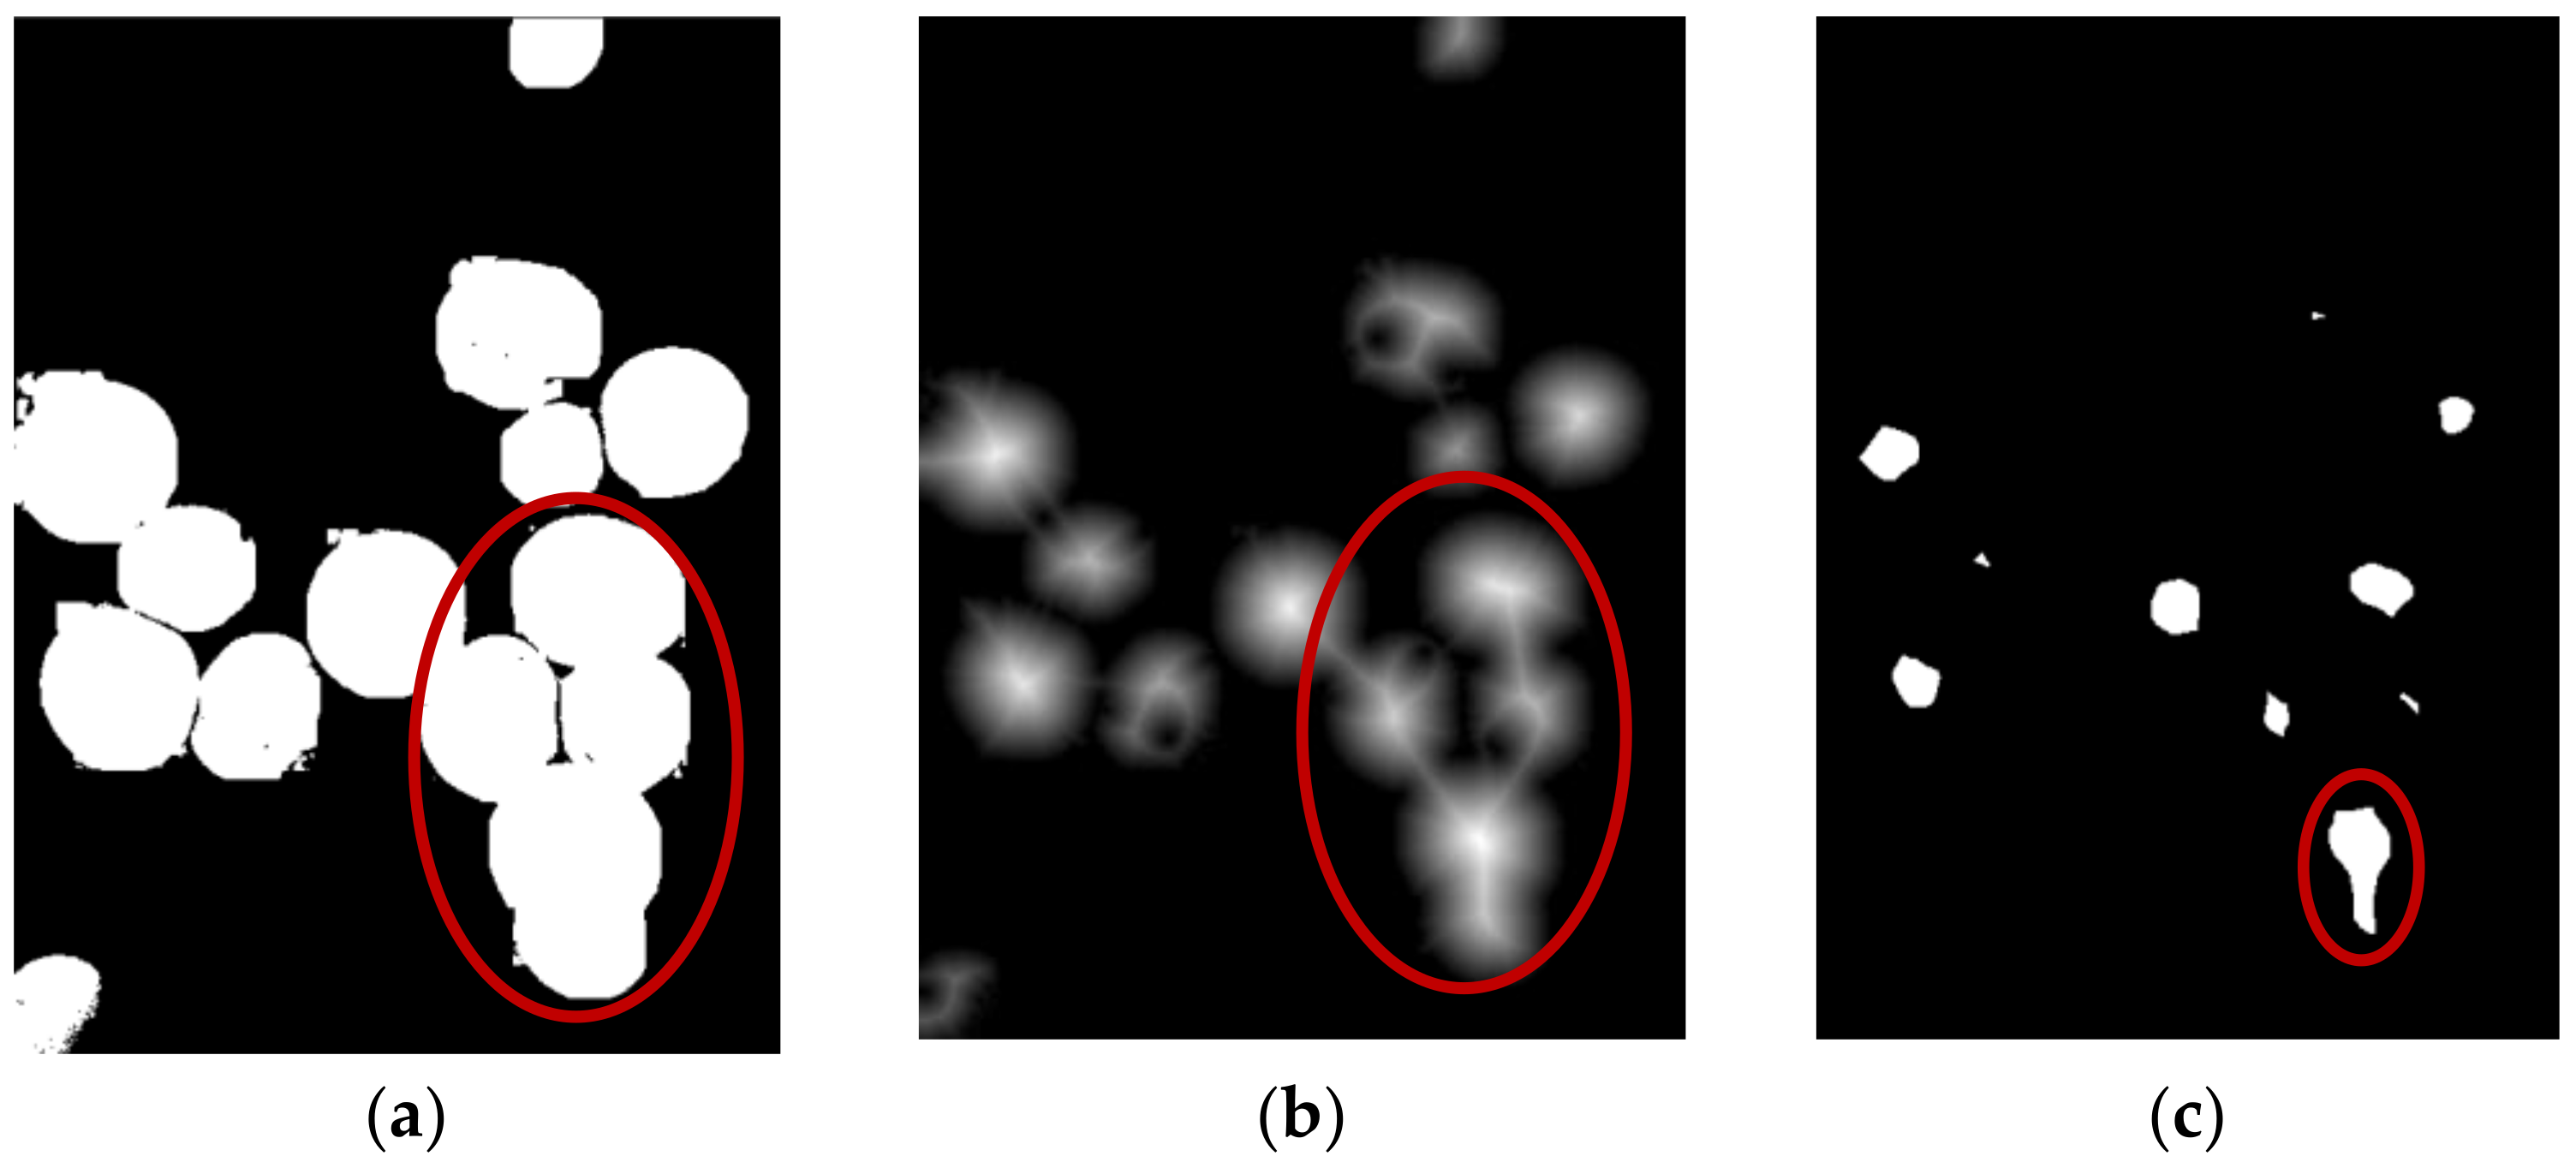
To solve the issue of pseudo-extreme points, we preliminarily segmented the adherent mushroom clusters to reduce the adhesion area. Observing the foreground image of
A. bisporus, we find that the color at the contact border of the adherent mushrooms is darker than at the edge of the mushroom cap, i.e., the grayscale value of the pixel at the border is lower than that of the pixel at the edge of the mushroom cap. Adherent mushroom clusters can be preliminarily segmented according to this feature. The threshold is set according to the grayscale value of the border and the mushroom cap edge, so that the threshold is slightly higher than the grayscale value of the border and lower than that of the mushroom cap edge. In looping through the foreground grayscale image of
A. bisporus, pixels with grayscale values below this threshold are assigned 0 to achieve preliminary segmentation. To determine the preliminary segmentation threshold, we marked the ends and midpoints of the mushroom edge adhesions at 30 points and measured the grayscale values of each marked point. The results are shown in
Figure 7. The grayscale values of 19 marked points were less than 60, so we set the preliminary segmentation threshold as 60. A higher threshold would cause holes in the mushroom cap area. The preliminary segmentation effect is shown in
Figure 8.
As shown in
Figure 8, the adherent mushrooms with clear contact boundaries have been preliminarily separated. It should be noted that if a higher segmentation threshold is set, more adherent mushrooms can be segmented. However, the color of the
A. bisporus cap edge and its center is inconsistent. The color of its center is slightly yellowish, and its pixel grayscale value is lower than that of the edges. If the threshold value for the preliminary segmentation is set too high, the pixel grayscale value of the mushroom cap center will also be set to 0, which would cause holes. In addition, the shadows caused by uneven lighting may also be mistaken as boundaries. Therefore, the preliminary segmentation threshold should be chosen at a reasonable level. The purpose of preliminary segmentation is to solve the problem of pseudo-extreme points formed after distance transformation for large-scale adherent mushroom clusters. Even if only part of the adherent mushrooms is segmented, the distance transformation results will be improved. The distance transformation was performed on the preliminarily segmented image, and a high threshold was selected for the global threshold segmentation of the transformation result to prepare the watershed markers. The results are shown in
Figure 9.
By comparing with
Figure 6, it can be seen that the problem of pseudo-extreme points formed after distance transformation for large-scale adherent mushroom clusters has been effectively solved. However, there remains the problem of global threshold segmentation under scale difference. The mushrooms in the circle in
Figure 9c require a higher threshold to be segmented, but the current threshold is already high enough to filter out multiple small mushrooms. In the case of such scale differences, how to reasonably choose the global segmentation threshold to generate the corresponding marker for each mushroom is the next problem to be solved.
2.2.3. Watershed Segmentation Algorithm Based on Iterative Markers
Aimed at resolving the problem of global threshold segmentation under scale differences, this paper proposes an iterative threshold segmentation method combined with area filtering. More specifically, the idea is to first select a low threshold to segment the image obtained from distance transformation. The markers obtained can be divided into segmented mushroom individuals and adherent mushrooms that need further segmentation. The marker areas corresponding to mushroom clusters is larger than those corresponding to individuals. Thus, the individual mushroom markers can be retained through contour area filtering, and the markers corresponding to the adherent mushrooms can be separately used as a new input image for another distance transformation and global segmentation algorithm with a higher threshold value to segment again. The iteration is performed until the contour area of the markers obtained by segmentation is not greater than a certain small area value. This area value represents the maximum contour area of the markers corresponding to individual mushrooms and can be obtained statistically by experiment. When the marker contour area obtained from the global threshold segmentation is smaller than this area value, it is considered that all adherent mushrooms have been successfully segmented and marked. Taking
Figure 9a as the example, obtained by binarization after preliminary segmentation, the process of preparing the watershed markers by this iterative method is shown in
Figure 10.
The individual mushroom markers filtered after each iteration were combined to obtain a complete
A. bisporus foreground marker image corresponding to individual mushrooms, as shown in
Figure 11.
After the complete
A. bisporus marker image was created, the marker-controlled watershed algorithm created seed growth points according to the marker contours to divide similar regions, thus achieving complete segmentation of
A. bisporus, as shown in
Figure 12a. After the segmentation, the minimum bounding rectangle function was adopted to count each region’s center and side length, which were used as the basis for the subsequent intelligent grasping algorithm. Taking the center of the minimum bounding rectangle of each region as the center of a circle and the long side as the diameter, we marked all of the recognized mushrooms in the original image, as shown in
Figure 12b. Meanwhile, we compared results obtained by Circle Hough Transform (CHT; provided by the OpenCV library) to verify the proposed algorithm’s performance. The five parameters of the OpenCV
HoughCircles function were adjusted to 30, 100, 20, 30, and 50, and the CHT results are shown in
Figure 12c.
We can see from
Figure 12 that the proposed algorithm recognized all of the mushrooms. In contrast, CHT only recognized 11 of the 15 mushrooms. Moreover, some mushroom diameters and center coordinates identified by CHT had significant errors. We will present a quantitative comparison of the two algorithms in
Section 3.
The complete flow of the watershed algorithm with iterative markers to segment
A. bisporus is shown in
Figure 13.
As shown in the diagram, the segmentation algorithm consists of four processes: preliminary segmentation, marker generation by an iterative method, marker-controlled watershed segmentation, and acquisition of mushroom center coordinates and diameter. First, the adherent mushroom clusters were preliminarily separated by means of pixel manipulations (see
Section 2.2.2). Second, a novel iterative method was applied to generate the watershed markers (see
Section 2.2.3 and
Figure 10). The result was that each mushroom was assigned a marker. Then, the marker-controlled watershed algorithm was employed to segment the adherent mushrooms and recognize the mushroom contours. Finally, the minimum bounding rectangle function was adopted to determine the center coordinates and diameters of the mushrooms.
3. Experiment and Results Analysis
To verify the algorithm’s effectiveness, we collected images for testing at the modern agricultural science and technology experimental field in Jiangyan District, Taizhou City, China.
3.1. System Hardware and Software
The Hikvision MV-CA060-10GC industrial camera (Hikvision Inc., Hangzhou, Zhejiang Province, China), with a resolution of 3072 × 2048, was used to obtain images of A. bisporus. The lens model was Hikvision MVL-HF0628M-6MPE, with a focal length of 6 mm and aperture set to F2.8. The camera was installed on a mobile gantry platform with a strip of white LED lights on both sides of the camera. The camera was placed perpendicularly from the soil surface, and the distance between the camera and the soil surface was 300 mm. The camera was set to auto white balance mode and maintained maximum light intake when the system was operated, and manual focus was used to obtain clear images.
The A. bisporus recognition algorithm was developed based on OpenCV 4.1.0 and Visual Studio 2015. The algorithm was implemented on an industrial personal computer with Intel(R) Core (TM) i7-6700HQ 2.6GHz CPU, 8.00GB RAM and Windows 10 operating system (OS). The Kithara RealTime Suite (KRTS), a modular real-time extension for Windows OS, was installed to realize real-time image processing with OpenCV.
3.2. Target Detection
We captured ten mushroom images in random places on the cultivation bed. To improve the efficiency of the algorithm, we resized the image to 600 × 450 with the resize function of OpenCV. Then, the images were processed using the proposed algorithm and CHT for comparison.
The tests focused on correct detection rate, miss rate, false rate,
F −
Score, and detection time. Their calculation formulae are as follows [
37]:
where
DR is the correct detection rate;
MD is the miss rate;
FD is the false rate;
TP denotes true positive, meaning the algorithm successfully recognizes the target mushroom in the image;
FN denotes false negative, meaning the algorithm recognizes a mushroom in the image as the background; and
FP denotes false positive, meaning the algorithm recognizes the background area as a mushroom. The highest possible
F −
Score is 1.0, indicating perfect precision and recall.
3.2.1. Test Results of the Proposed Algorithm
The test results of the proposed algorithm are shown in
Table 2.
As shown in
Table 2, the average detection rate of the ten groups of tests was 95.7%, which is higher than those of 70.93% [
16] and 92.37% [
14] found in the literature. The
F −
Score value was 0.97, which indicates that the algorithm has good precision and recall. Therefore, the algorithm accuracy met the actual picking requirements.
Figure 14 shows the time spent by the algorithm on each image. The running time of a single image was between 652 ms and 755 ms, with an average time of 705.7 ms, which is sufficient to satisfy the real-time constraints based on 1 image/s. The time spent had an apparent upward trend with increases in the number of mushrooms. Nevertheless, the overall increase was small. We analyzed the images represented by the two outliers and discovered that the higher time consumption could be attributed to more complicated backgrounds, which required more time in the background filtering.
Table 2 shows that the average miss rate of the algorithm was 4.3%, and the false rate was 0.89%. There are two causes for missed detections: One is that the height of individual
A. bisporus can vary significantly at the adhesion points, and the lower individual
A. bisporus can be almost completely obscured, as shown in
Figure 15a. The other is that uneven light can lead to low grayscale values for some
A. bisporus, which are mistaken for the background and missed, as shown in
Figure 15b. The main reason for false detection is that the shape and grayscale value of some mycelium areas are close to the performance of
A. bisporus, so they are mistaken as individual
A. bisporus. The probability of false detection is extremely low due to the excellent effect of the algorithm in extracting the foreground.
The analysis shows that lighting significantly influences the false and missed detection rates. It is necessary to design more appropriate light sources to further optimize the light environment. The stalk of A. bisporus has a significant impact on the false rate. Therefore, more accurate segmentation techniques to separate the stalk from the mushroom cap can be explored in future studies to reduce the false rate.
3.2.2. Comparison between the Proposed Algorithm and CHT
The CHT test results are shown in
Table 3.
Table 3 shows that the average detection rate of CHT is 81.4%, the average miss rate is 18.6%, and the false rate is 4.2%. The calculated
F −
Score is 0.88. Comparing
Table 2 and
Table 3, it can be seen that the correct detection rate of the proposed algorithm is higher than that of CHT. In addition, the proposed algorithm has lower miss and false rates. When the mushroom image is not close to a perfect circle or the grayscale value of the mushroom is low, the CHT algorithm is prone to miss or falsely detect them. From the experimental results, the proposed algorithm performed better than CHT in recognizing mushrooms.
3.3. Verification of Diameter Measurement and Center Coordinates
3.3.1. Verification of Diameter Measurement
In this paper, we use spatial resolution to calculate the actual diameter (measured in millimeters) after extracting the mushroom’s diameter (measured in pixels) from the image. Spatial resolution [
18] represents the number of independent pixel values per millimeter and is 2.1 pixel/mm in this paper. The mushrooms in
Figure 2 were processed to verify diameter measurement. It should be noted that the diameters we measured are the maximum diameters of the mushrooms. The relative error of the measurement results is calculated as follows:
where
ME represents the measurement error,
AV denotes the actual value of diameter, and
EV denotes the experimental value measured by an algorithm. The results of the proposed algorithm and CHT are shown in
Table 4 and
Table 5, respectively.
As shown in
Table 4, the maximum measurement error of the proposed algorithm was 3.39% (in bold), the minimum error was 0.21% (in bold), and the average measurement error was 1.15% (in bold). The results show that the differences between the AV and EV values of the proposed algorithm were very small. By comparison, the maximum measurement error by CHT was 26.45% (in bold), the minimum error was 0.84% (in bold), and the average measurement error was 8.31% (in bold). The comparison results indicate that the proposed algorithm outperforms CHT in measuring diameters.
3.3.2. Verification of Center Coordinates
To better evaluate the accuracy of the proposed method for calculating the center coordinates of mushrooms, we introduced the two-dimensional coordinate deviation rate (
CDR) [
5]:
where
and
represent the column and row coordinates of the mushroom’s center point measured manually;
and
represent the column and row coordinates of the mushroom’s center point determined by algorithm; and
and
are the width and height of the image, respectively. The mushroom images in
Figure 2 were utilized to verify the algorithm performance. Three examples of calculating the CDR are shown in
Figure 16, and the calculation results of the proposed algorithm and CHT are illustrated in
Table 6 and
Table 7.
Table 6 shows that the maximum CDR of the proposed algorithm was 3.28% (in bold), the minimum CDR was 0.61% (in bold), and the average CDR was 1.43% (in bold).
Table 7 shows that the maximum CDR of CHT was 3.39 % (in bold), the minimum CDR was 0.94% (in bold), and the average CDR was 2.18% (in bold). If the CDR is less than 3%, it is judged that the coordinates of the mushroom’s center point were successfully measured. The results show that the proposed algorithm is more effective than CHT in determining the center of a mushroom. For the proposed algorithm, incorrectly treating the stalk as part of the cap was the leading cause of CDR errors. For the CHT, irregularly circular mushrooms tended to cause significant CDR errors. In
Table 6, there is one CDR with a value larger than 3, indicating one mushroom with significant errors in the center coordinates. Similarly,
Table 7 illustrates three mushrooms with large errors in the center coordinates. The results are consistent with
Figure 12b,c.
From the experimental results, we can summarize that the proposed algorithm has high accuracy in mushroom recognition compared to CHT, and it yields better outcomes in measuring the center coordinates and cap diameters of A. bisporus.
4. Conclusions
This study proposes a segmentation and recognition algorithm for A. bisporus, which can recognize mature A. bisporus and obtain center coordinates and cap diameters. A background filtering method based on morphological operations was developed to filter the complex matrix background and extract the foreground images containing only A. bisporus. Moreover, a marker-controlled watershed algorithm was used to segment adherent mushrooms. A preliminary segmentation method based on pixel operation and an iterative watershed marker generation method were proposed, improving the algorithm’s accuracy of segmentation and recognition. The experimental results show that the average correct detection rate of the proposed algorithm is 95.7%, the average diameter measurement error is 1.15 %, and the average coordinate deviation rate is 1.43%, showing better outcomes than CHT. Based on this algorithm, vision-based mechanical harvesting equipment for A. bisporus can be further studied. Moreover, the methods in this paper can be expanded to other vision-based applications in the mushroom industry, such as grading of mushroom quality and growth-rate measurement. On average, the algorithm takes 705.7 ms to process one image. The algorithm is time-consuming because it requires many calculations. Our future work will improve the algorithm’s efficiency and shorten the processing time, thereby enhancing its real-time performance.


 ,
, 


