Article

The Effect of Deep Placement of Basal Nitrogen Fertilizer on Gaseous Nitrogen Losses and Nitrogen Use Efficiency of Paddy Fields under Water-Saving Irrigation in Northeast China

1
School of Water Conservancy and Civil Engineering, Northeast Agricultural University, Harbin 150030, China
2
Key Laboratory of Effective Utilization of Agricultural Water Resources, Ministry of Agriculture and Rural Affairs, Northeast Agricultural University, Harbin 150030, China
3
College of Agricultural Science and Engineering, Hohai University, Nanjing 210098, China
4
School of Water Conservancy and Electric Power, Heilongjiang University, Harbin 150006, China
5
College of Agriculture and Hydraulic Engineering, Suihua University, Suihua 152001, China
*
Author to whom correspondence should be addressed.
Submission received: 12 February 2023 / Revised: 10 March 2023 / Accepted: 11 March 2023 / Published: 13 March 2023
(This article belongs to the Special Issue Effects of Tillage, Cover Crop and Crop Rotation on Soil)

Abstract

:
As a widely implemented irrigation regime for paddy fields, water-saving irrigation (WSI) is capable of ensuring water resource security and improving nitrogen use efficiency (NUE). Higher gaseous nitrogen losses (GNL) lead to a low recovery rate of basal nitrogen, and this is the primary reason that restricts further improvements in the NUE under WSI. The deep placement of nitrogen fertilizer (DPN) is considered an efficient agricultural management measure to reduce GNL. However, the effects of WSI combined with the deep placement of basal nitrogen fertilizer on NUE, GNL, and rice yield in paddy fields remain largely unknown. In this study, a 2-year field experiment was conducted to measure GNL (N2O emissions and NH3 volatilization), NUE, and rice yield. Four treatments were utilized: (i) conventional flooding irrigation + broadcast of nitrogen fertilizer (110 kg N hm−2, CFN); (ii) water-saving irrigation + deep placement of basal nitrogen fertilizer (110 kg N hm−2, WSN); (iii) water-saving irrigation + deep placement of basal nitrogen fertilizer (99 kg N hm−2, WSN1); (iv) water-saving irrigation + deep placement of basal nitrogen fertilizer (88 kg N hm−2, WSN2). The results showed that the GNL in paddy fields under treatment ranged from 5.29 to 10.67 kg hm−2. Deep placement of basal nitrogen fertilizer mitigated the GNL of the paddy fields under WSI. The GNL of CFN was significantly higher than those of WSN1 and WSN2 by 26.9% and 54.0% in 2021 and 14.4% and 23.3% in 2022, respectively (p < 0.05). Under WSI, the deep placement of basal nitrogen fertilizer reduced the GNL primarily via the reduction of NH3 volatilization. NH3-N of CFN was higher than those treatments under WSI. The rice yield of CFN was significantly lower than those of WSN and WSN1 by 22.4% and 21.6% in 2021 and 4.6% and 1.5% in 2022, respectively. (p < 0.05). Moreover, the NUE of each treatment under WSI was higher than that of CFN. These changes exhibited similar trends in 2021 and 2022. These results demonstrated that deep placement of basal nitrogen fertilizer is an effective practice to ensure food and environmental security under WSI.

1. Introduction

The Mollisols region in Northeast China is the ballast stone and stabilizer to ensure China’s grain security. The rice planting area is continuously increasing to satisfy the rice demands of a continuously growing population [1]. To alleviate the further intensification of the contradiction between the supply and demand of water resources, the irrigation management of paddy fields is changing in Northeast China [2]. Farmers have utilized water-saving irrigation (WSI) extensively to cope with the sharp rise in agricultural water consumption caused by the constant expansion of the rice planting area [3]. WSI has also been considered to meet the sustainable development goals (SDG) and is regarded as an effective management technique for sustainable rice production [4,5]. According to our previous research results, WSI improved the nitrogen use efficiency (NUE) to a certain extent compared with conventional flooding irrigation (CFI). However, we also found that the high nitrogen loss rate of basal fertilizer could not be ignored. More specifically, the loss rate of basal nitrogen fertilizer was 51.15–56.91%, which was greater than the loss rate of tillering and panicle nitrogen fertilizer [6].
Gaseous nitrogen loss (GNL) was the primary pathway for the loss of nitrogen fertilizer [7,8]. Frequent alternate wet and dry conditions provided by WSI were beneficial to GNL [9]. Previous research has demonstrated that the WSI increased N2O emissions compared with conventional flooding irrigation, due to the changes in the redox potential of paddy fields after the adoption of WSI [10]. Nitrification was enhanced from flooding to drying, and this was conducive to the conversion of NH4+-N into NO3-N [11]. In addition, re-watering provides an anaerobic environment for denitrification [12]. The joint enhancement of nitrification and denitrification promoted N2O emissions. The conclusions on the impact of WSI on NH3 volatilization were inconsistent. Bhagat et al. reported that CFI inhibited soil NH3 volatilization [13]. Xu et al. reported that WSI reduced NH3 volatilization of rice fields in Southern China compared with CFI [14]. However, the GNL of paddy fields under WSI greatly polluted the atmospheric environment and restricted further improvements in NUE and yield [15,16]. Therefore, under the dual background of global warming and carbon peak and neutralization, it is urgent to implement appropriate fertilizer measures that can simultaneously achieve nitrogen reduction, NUE increases, and GNL diminution to guarantee the sustainable development of paddy ecosystems and help achieve “carbon neutrality” in China.
The deep placement of nitrogen (DPN) has been considered an efficient nitrogen fertilizer management that can reduce GNL and improve NUE [17,18]. Several studies have shown that DPN promoted N fertilization and was more likely to be absorbed by soil and reduce N loss [19]. Bandaogo et al. found that DPN obviously increased NUE and reduced N loss by inhibiting NH3 volatilization [20]. Yao et al. found that DPN decreased the seasonal NH3 volatilization of paddy fields by 91% compared with surface-broadcast N fertilizer application [18]. And previous studies proposed that DPN maintained more fertilizer N in the soil for a longer time and could reduce N2O emissions [21]. Additionally, DPN was demonstrated to be an effective way to improve the NUE and crop yield. Compared with broadcasting, DPN precisely applies fertilizers close to the crop roots and increases the absorption of N by plants. Liu et al. reported that DPN enhanced root growth and improved rice yield [22]. Zhu et al. showed that DPN significantly improved NUE and yield in paddy fields [23]. Hence, it would be of great significance to explore the effects of the deep placement of basal fertilizer under WSI on GNL, NUE, and the yields of paddy fields in Northeast China.
Therefore, a 2-year field experiment was conducted by using CFI and broadcasting 110 kg N hm−2 as the control, and the deep placement of basal nitrogen fertilizer + three nitrogen fertilizer levels (110, 99, and 88 kg N hm−2) under WSI were established. We measured the N2O emission fluxes, the NH3 volatilization rate, the nitrogen accumulation of plants, and the yield and calculated the NUE in Northeast China. We hypothesized that the deep placement of basal nitrogen fertilizer combined with WSI could reduce the GNL and improve the NUE and rice yield. The aims of this study were as follows: (1) to explore the effects of WSI combined with the deep placement of basal nitrogen fertilizer on the GNL of paddy fields, and (2) to comprehensively evaluate the effects of WSI combined with the deep placement of basal nitrogen fertilizer trade-offs for reducing GNL and improving NUE and rice yields.

2. Materials and Methods

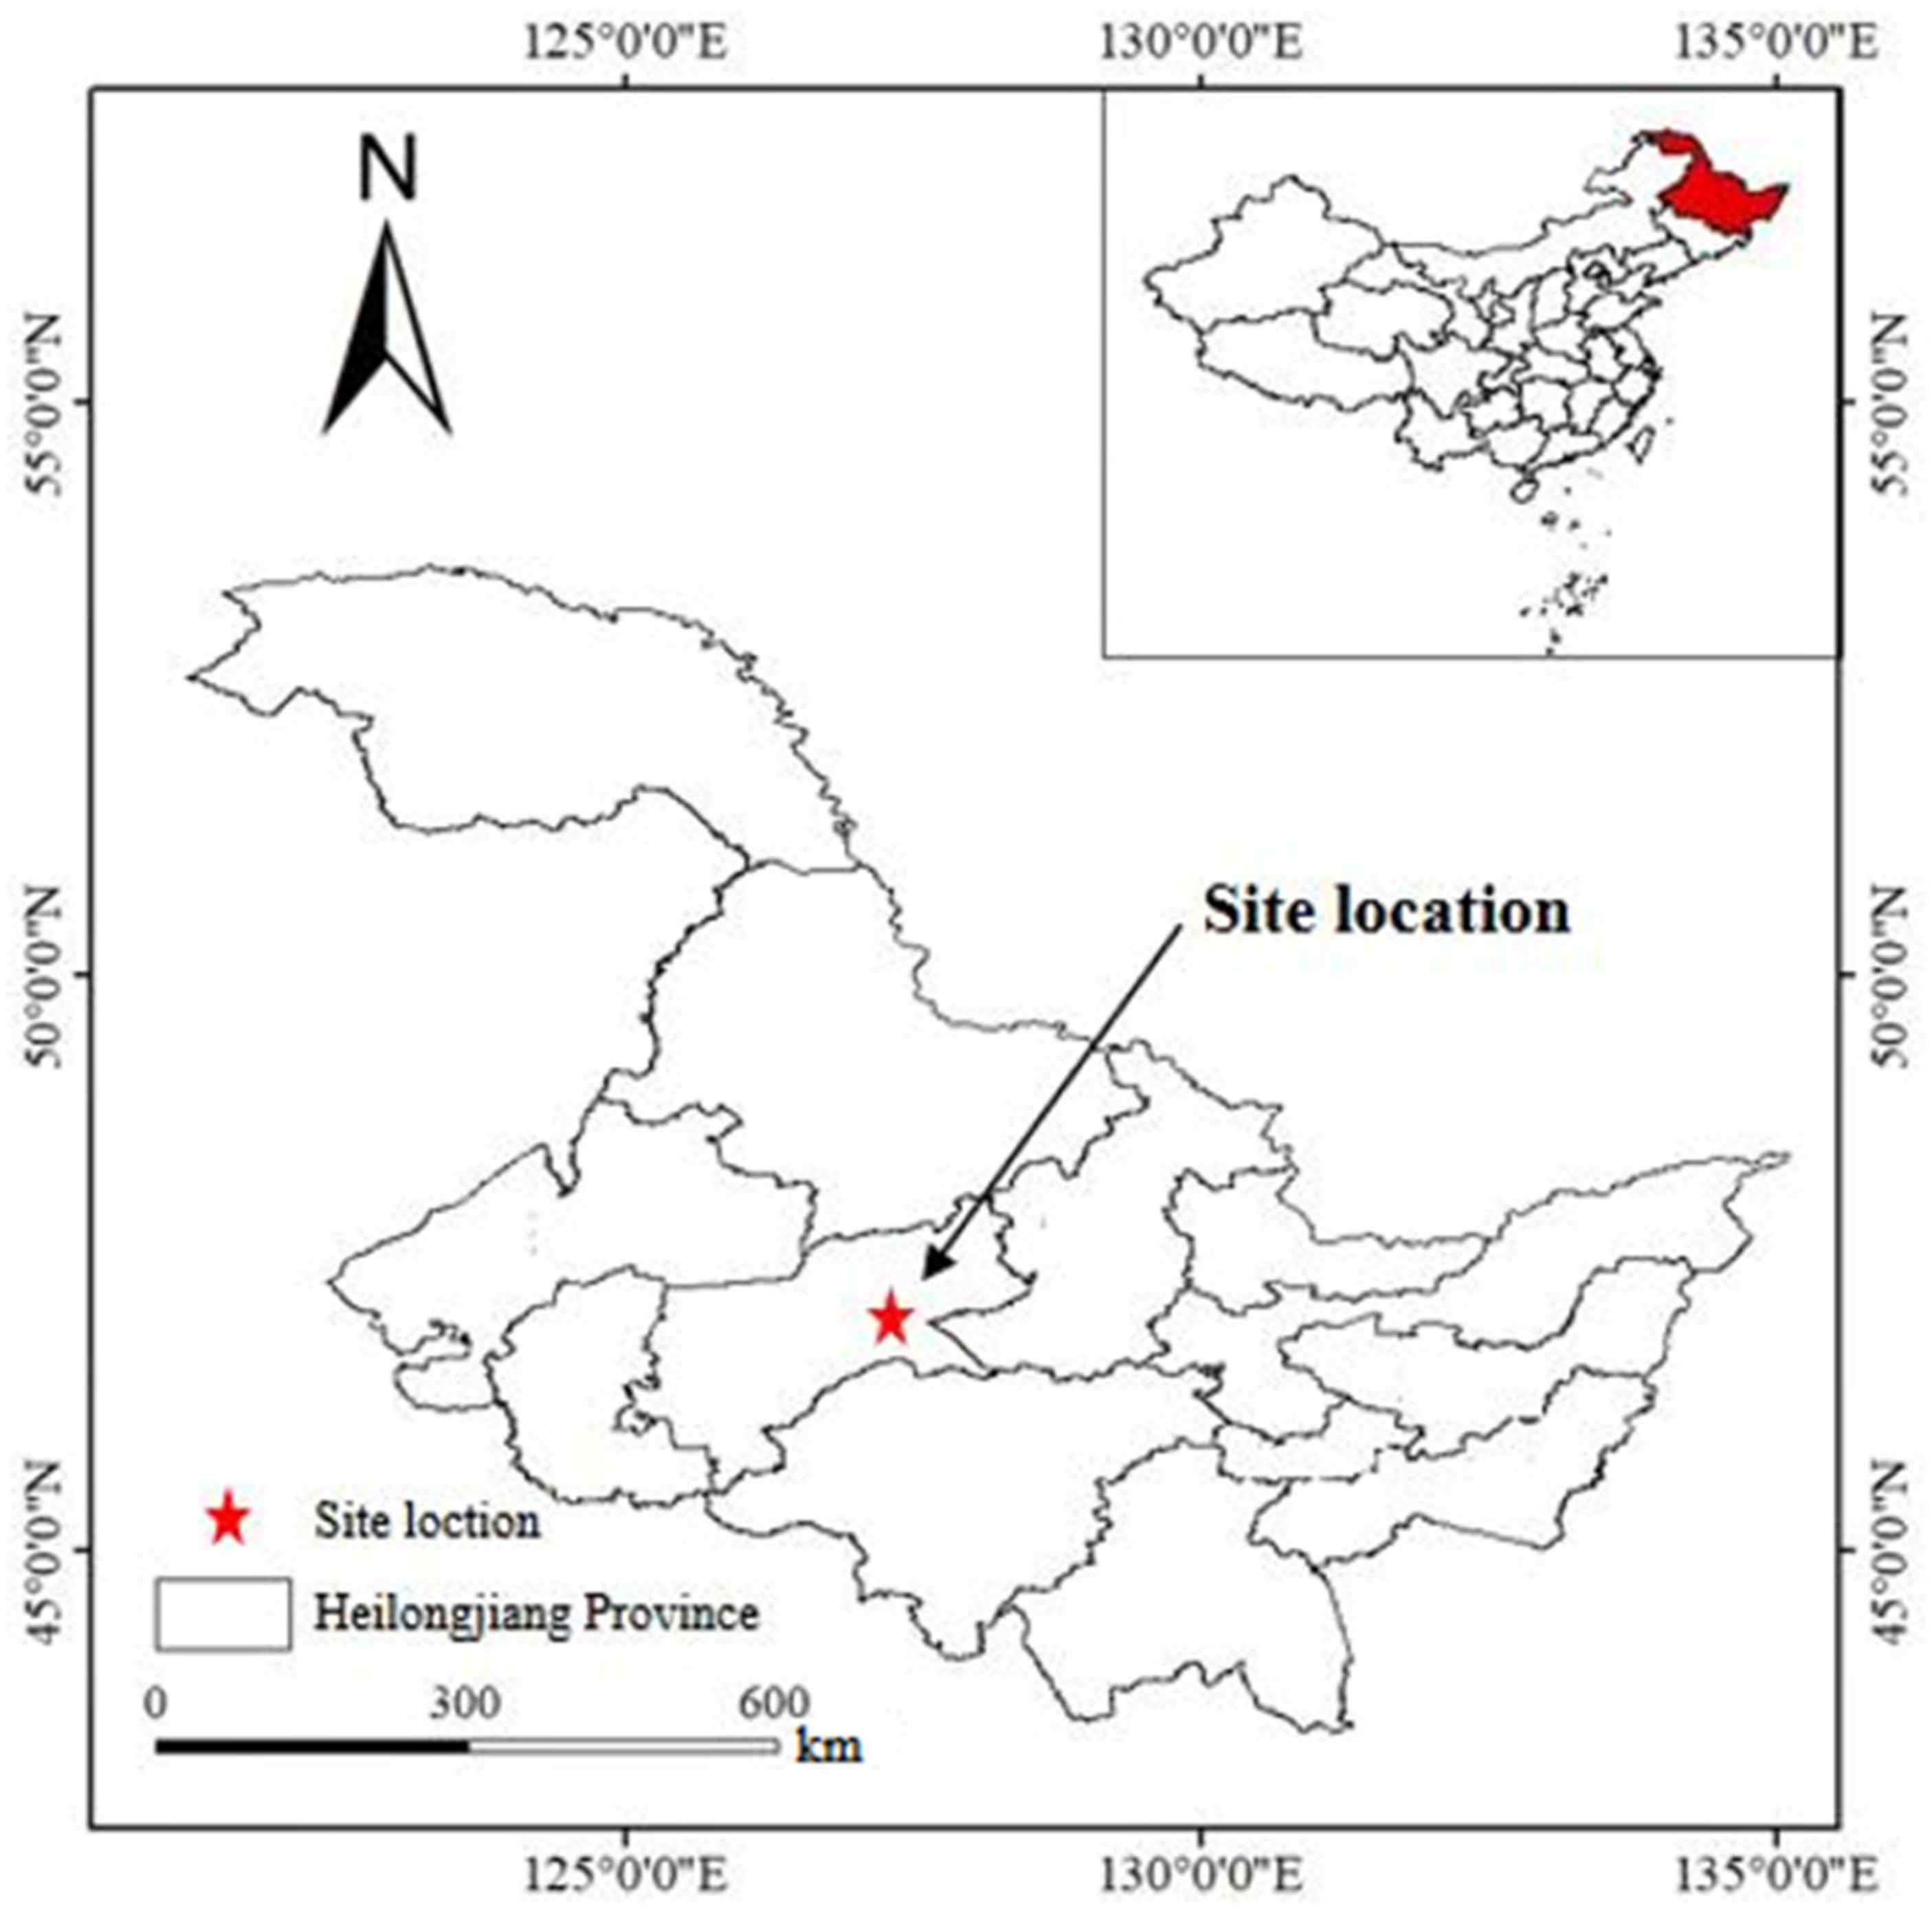
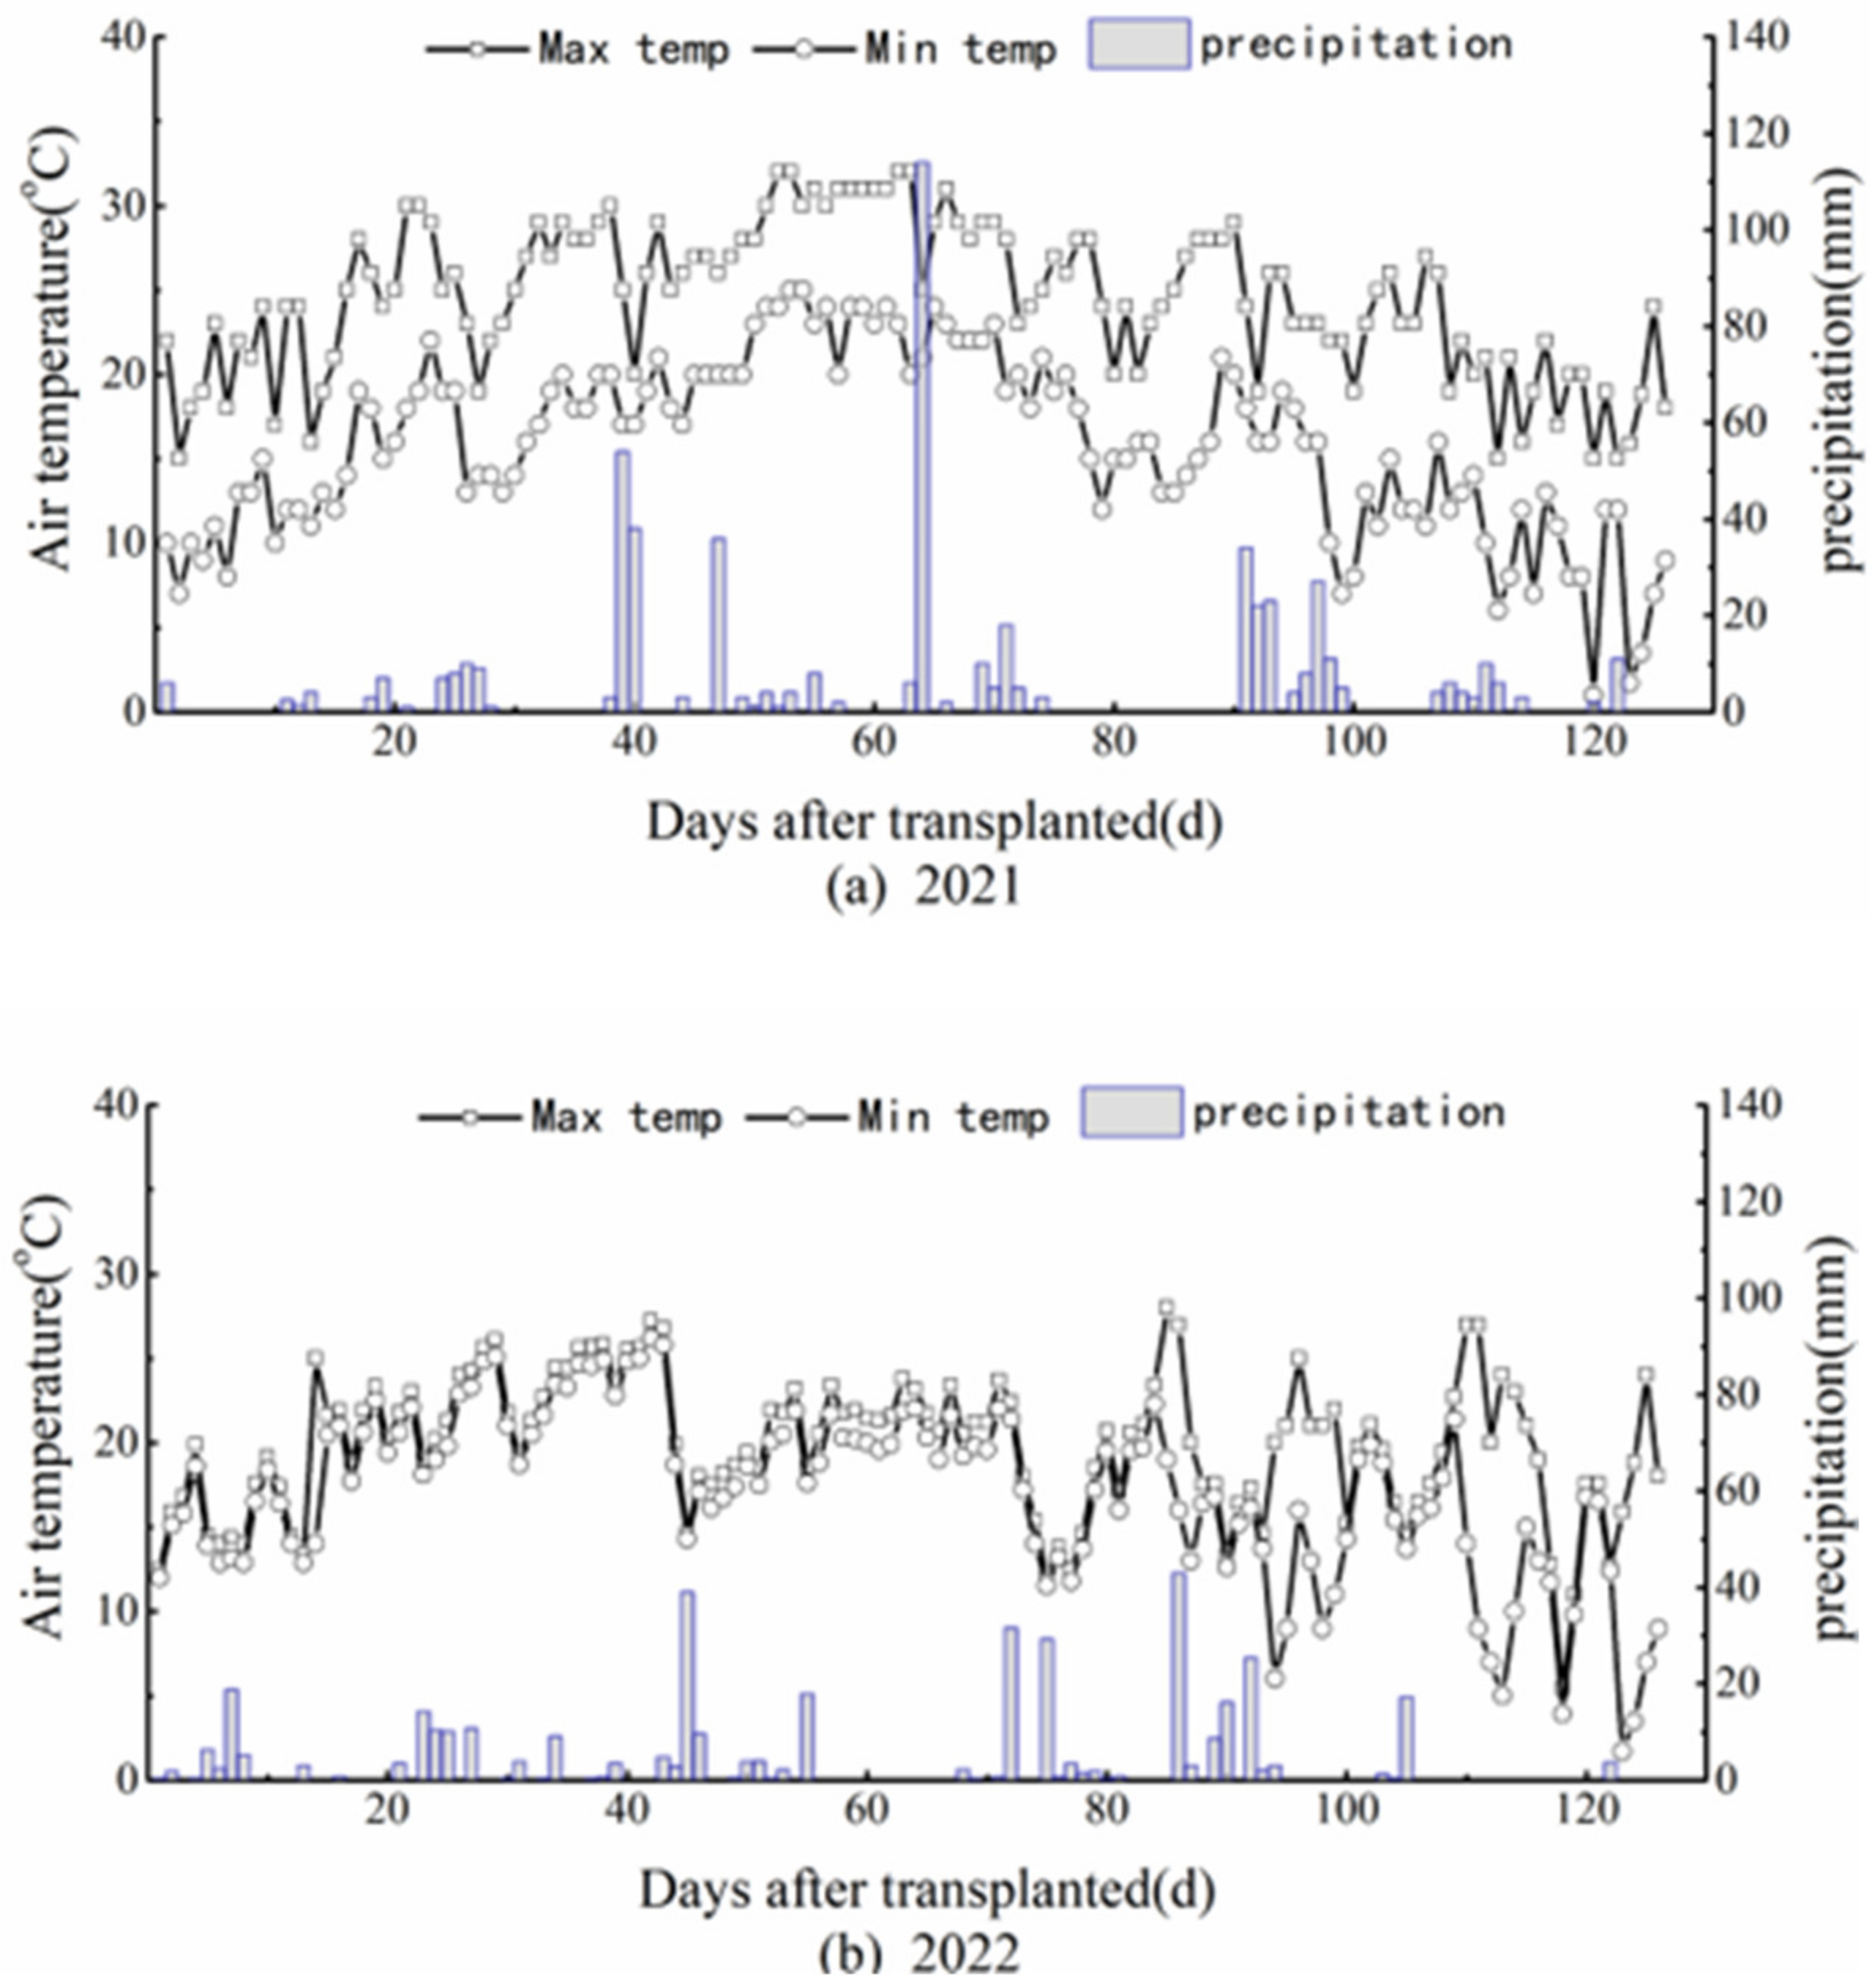
2.1. Site Description

This experiment was conducted at the National Irrigation Experimental Station (127°40′45″ E, 46°57′28″ N) in Heping Irrigation District of Heilongjiang Province, Northeast China, in 2021 and 2022, which belongs to a typical cold Mollisols distribution region (Figure 1). The meteorological data of the rice-growth period are shown in Figure 2. The region has a monsoon climate in a cold temperate zone, with an average annual precipitation of 577 mm and a crop growth period of 156–171 days [24]. The soil texture of this region is classified as Mollisols, and the physical-chemical properties of the 0~20 cm layer are pH 6.40, 41.4 g kg−1 of organic matter, 154.36 mg kg−1 of alkaline N, 25.33 mg kg−1 of available P, and 157.25 mg kg−1 of available K. Prior to experimentation, the test field had rice planted for more than 20 years.

2.2. Experimental Design

The experiment established conventional flooding irrigation (CFI) + the broadcast of the local fertilizer application level as the control (110 kg N hm−2, CFN). Under WSI, three nitrogen fertilizer levels were established: (1) deep placement of basal nitrogen fertilizer + the local fertilizer application level (110 kg N hm−2, WSN); (2) deep placement of basal nitrogen fertilizer + 90% of the local fertilizer application level (99 kg N hm−2, WSN1); (3) deep placement of basal nitrogen fertilizer + 80% of the local fertilizer application level (88 kg N hm−2, WSN2). In addition, another two unfertilized treatments under CFI and WSI were prepared to calculate the NUE, respectively. The different water management patterns at the rice growth stages were summarized in Table 1. Each treatment was laid out with three replicates. The size of each plot was 10 × 10 m. The plots were separated from each other, and a concrete barrier (height 40 cm) was built between each plot to prevent surface water-fertilizer exchange. For rice cultivation in the study region, 110–45–80 kg hm−2 N-P-K was recommended [25]. A total of 45% of the N fertilizer was applied as basal fertilizer, 20% as tillering fertilizer, and 35% as panicle fertilizer, respectively. Under WSI, the basal fertilizer was applied to the soil at a depth of 4~5 cm using a side-deeping fertilizer machine (FSPV6; Kubaotian Corporation; Osaka, Japan). P2O5 and K2O were applied at the same rate in all treatments (45 kg hm−2 P2O5 and 80 kg hm−2 K2O). The P fertilizer was applied once before transplanting. 50% of the K2O was applied ahead of the transplanting of rice, and the other 50% was applied when the leaf age was 8.5. The other agricultural management practices, which included seed raising and pesticide application, were all in line with the local high-yield fields. Twenty-one-day-old rice seedlings (three plants per hill, Longqing 8, China) were selected for the experiment. The planting density was 24 hills per square meter. In 2021 and 2022, the seedlings were transplanted on 22 May and 24 May and the rice was harvested on 21 September and 23 September, respectively.

2.3. N2O Emissions

The N2O emission fluxes were measured using the static chamber-gas chromatography method [26]. After each nitrogen fertilizer, the N2O emission fluxes were measured continuously until the emission peak appeared. As the N2O emission fluxes decreased, the sampling interval was then adjusted to once per week. If heavy rainfall occurred on the day of sampling, the measurement time was extended [27]. The measuring time was fixed between 9:00 and 11:00 a.m. The static chamber was mainly composed of a chamber and a stainless-steel base. An electronic fan and air thermometer were installed in each chamber. The chambers were removed from the base, except during gas collection. In advance of transplantation, the stainless steel base was inserted into each plot with a sealing groove (3 cm width, 5 cm height) reserved at the top. To prevent gas exchange in the chamber with outside air while measurements were taken, water was injected to seal the groove. For each N2O flux measurement, four gas samples were collected using 50 mL E-Switch gas bags at 0, 10, 20, and 30 min after the chamber was closed. Additionally, the temperature inside the chamber was noted. All gas samples were analyzed within 48 h using gas chromatography (GC-2010 Plus; Shimadzu Corporation; Kyoto; Japan). The gas chromatograph was equipped with an electron capture detector (ECD); the N2O concentration was analyzed at 250 °C, and the carrier gas was Ar/CH4 (95%Ar + 5%CH4). Then the N2O emission fluxes (μg m−2 h−1) were calculated as follows [19]:
F N 2 O = ρ h × d C d t × 273 273 + t
where ρ is the density of N2O under a standardized state, (1.964 kg·m−3); h is the effective height of the chamber above the soil or surface water, m; dC/dt is the rate of increase of the N2O gas concentrations in the chamber, mL·m−3·h−1; and t is the mean air temperature inside the chamber at the time of sampling, °C.

2.4. NH3 Volatilization

NH3 volatilization was measured using a ventilation method similar to that used by Li et al. [28]. The vented chamber was mainly composed of a polyvinyl (PVC) tube (15 cm internal diameter, 20 cm height) and an aluminum alloy canopy. The vented chambers were buried into each plot, and the buried depth was 5 cm. Two pieces of circular sponges (diameter 16 cm, thickness 2 cm) were inserted into the PVC tube when sampling. Each circular sponge was moistened with 15 mL of a phosphate/glycerol solution. The upper circular sponge was mounted at the top of the PVC tube to prevent NH3 in the air from entering the chamber. The lower circular sponge was mounted 3 cm from the top of the PVC tube to absorb NH3. Once rainfall occurred on the day of sampling, the top of the PVC tube was covered using an aluminum alloy canopy. Samples were collected daily after N fertilizer application for 1 week, followed by an interval of 1–3 days for another week, and finally at an interval of one week. The lower circular sponge was cut into small pieces and immersed in a 300 mL 1.0 mol L−1 KCL solution. Then the extracted solution was shaken in a thermostatic air oscillator and analyzed using an ultraviolet-visible spectrophotometer (UV1780, Shimadzu Corporation, Kyoto, Japan). The NH3 volatilization rate (kg hm−2 d−1) was estimated using the following equation [29]:
F NH 3 = M / A × D × 10 2
where M is the ammonia nitrogen collected by the PVC tube, mg; A is the cross-sectional area of the circular chamber, m2; and D is the duration of each sampling; d.

2.5. Gaseous N Losses

The seasonal NH3 volatilization (kg hm−2) and N2O fluxes (kg hm−2) for the entire cropping period were calculated as follows [30]:
Seasonal   NH 3   and   N 2 O = i n E i × D i
where Ei is the average NH3 volatilization rate (kg hm−2 d−1) and N2O fluxes (μg m−2 h−1) at the ith interval during sampling; Di is the number of days between the ith sampling and the (i − 1)th sampling; and n is the sampling number.
The gaseous N losses (kg hm−2) were calculated as follows [27]:
G N L = N H 3 N + N 2 O N
N H 3 N = Seasonal   NH 3 × 14 / 17
N 2 O N = Seasonal   N 2 O × 28 / 44
where GNL is the gaseous N losses (kg hm−2); and 14/17 and 28/44 are the conversion coefficients.

2.6. Nitrogen Use Efficiency and Rice Yield

Five representative rice plants were harvested by using a sickle in each plot at the yellow-ripe stage of the rice. The grain, stem, leaf, and root were washed using a pressure-water gun and placed in a drying oven at 105 °C for 30 min, dried at 70 °C to a constant mass, and weighed. The N contents of samples were then measured using an elemental analyzer (Flash 2000 HT; Thermo Fisher Scientific, Waltham, MA, USA). The nitrogen use efficiency (%) was calculated as [31]:
N U E = U N U 0 / F N × 100 %
where UN is the nitrogen uptake by the aboveground plants treated with nitrogen, kg hm−2; U0 is the nitrogen uptake by the aboveground plants without nitrogen treatment, kg hm−2; and FN is the amount of nitrogen applied.
The rice grains within 5 m2 of an undisturbed area of each plot were collected at maturity, and the moisture content was adjusted to 14% [21,32].

2.7. Statistical Analysis

All equation calculations were calculated using Excel 2010. The statistical analyses were performed using SPSS v19.0 (IBM, Armonk, NY, USA). The figures were visualized using ORIGIN v9.0 (OriginLab, Northampton, MA, USA) and ArcGIS v10.2 (ArcGIS, Esri, Redlands, CA, USA). Two-way ANOVAs were used to evaluate the significant differences of all the treatments. The significant threshold of all of the statistical analyses was p < 0.05.

3. Results

3.1. Nitrous Oxide Emissions

The N2O emission fluxes and seasonal N2O fluxes were visualized during the rice cropping season (Figure 3). For the N2O emission fluxes under the CFI and WSI, there were two peaks at about 15 and 57 days after transplanting. In 2021 and 2022, the maximum N2O emission fluxes reached 186.47 μg m−2 h−1 and 233.94 μg m−2 h−1 in the CFN. The seasonal N2O fluxes of CFN were higher than those treatments under the WSI in 2021 and 2022. With a reduction in the nitrogen application, the seasonal N2O fluxes decreased gradually under the WSI. The seasonal N2O fluxes of WSN were significantly higher than WSN1 and WSN2. These changes exhibited similar trends in 2021 and 2022. Nevertheless, the seasonal N2O fluxes of each treatment in 2021 were lower than in 2022.

3.2. Ammonia Volatilization

The NH3 volatilization rate and seasonal NH3 volatilization were presented in Figure 4. There were similar trends exhibited in 2021 and 2022. Under the CFI and WSI, the NH3 volatilization rate peaks appeared 2~3 days after the application of nitrogen fertilizer. The NH3 volatilization rate of the CFN increased immediately after the application of basal fertilizer, and this was higher than those treatments under the WSI. However, the two NH3 volatilization rate peaks after the application of tillering and panicle fertilizer in the CFN were lower than those of the WSN. The seasonal NH3 volatilization of CFN was higher than those treatments under the WSI and was significantly higher than those of WSN1 and WSN2 (p < 0.05). The seasonal NH3 volatilization under the WSI decreased gradually with a reduction in the nitrogen application, and there was a significant difference between them (p < 0.05). The seasonal NH3 volatilization of each treatment in 2021 was lower than in 2022.

3.3. Gaseous Nitrogen Losses

The N2O-N, NH3-N and gaseous N losses were summarized in Table 2. The N2O-N of WSN1 and WSN2 were significantly lower than that of WSN (p < 0.05). The N2O-N of CFN was higher than those of the treatments under the WSI. Under WSI, the NH3-N decreased gradually with a reduction in nitrogen, and there was a significant difference between them (p < 0.05). The NH3-N of CFN was significantly higher than that of WSN1 and WSN2 (p < 0.05). These changes exhibited similar trends in 2021 and 2022. The GNL of the paddy fields under the treatments ranged from 5.29 to 10.67 kg hm−2. The GNL of CFN reached 10.67 kg hm−2 in 2021, but that of the WSN2 was only 5.29 kg hm−2 in 2022. The GNL of CFN was significantly higher than those of WSN1 and WSN2 (p < 0.05). The GNL under WSI decreased gradually with a reduction in the nitrogen application, and there was a significant difference between them (p < 0.05). Furthermore, the GNL of each treatment in 2021 was higher than in 2022.

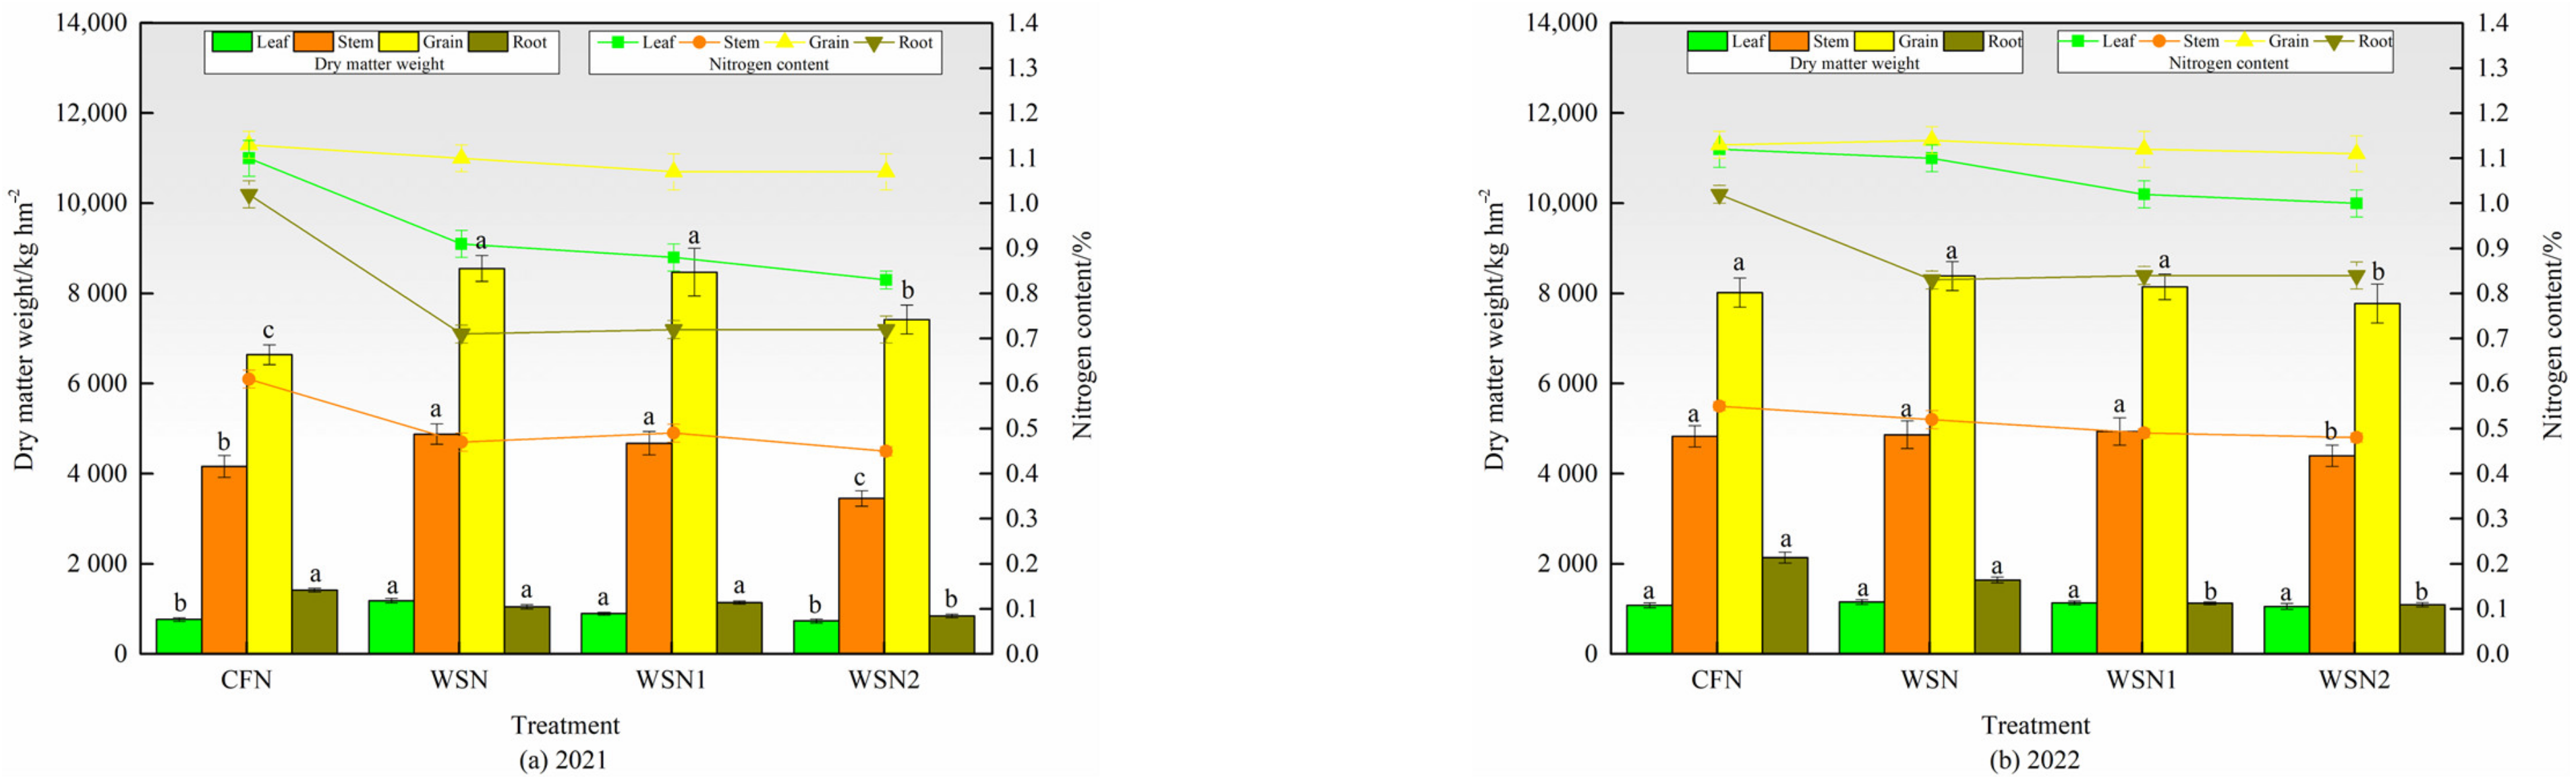
3.4. The Nitrogen Accumulation of the Plants

The nitrogen accumulation of the plants was summarized in Table 3. The leaf N accumulation of WSN was higher than those of CFN, WSN1, and WSN2. The stem N accumulation and root N accumulation of CFN were higher than those treatments under WSI. The grain N accumulation of CFN was lower than those treatments under the WSI in 2021. The grain N accumulation of CFN was lower than those of the WSN and WSN1, but that of WSN2 was lower than that of the CFN in 2022. The total N accumulation of WSN and WSN1 was significantly higher than that of the CFN in 2021, while that of WSN and WSN1 was significantly lower than that of the CFN in 2022 (p < 0.05). The total N accumulation of WSN2 was lower than that of CFN. The total N accumulation of each treatment in 2021 were lower than in 2022.

3.5. Rice Yield and the Nitrogen Use Efficiency

The rice yield and nitrogen use efficiency were summarized in Table 4. The rice yieldn that of was significantly lower than those of the WSN and WSN1 (p < 0.05). The rice yield of WSN2 was significantly higher than that of CFN in 2021 (p < 0.05), but was lower than that of CFN in 2022. The rice yields of WSN and WSN1 were 1.6~28.8% higher than that of the CFN. The rice yields of WSN and WSN1 were significantly higher than that of WSN2 (p < 0.05). The NUEs of those treatments under WSI were higher than that of CFN. The NUEs under the WSI decreased gradually with a reduction in the nitrogen application.

4. Discussion

Investigations have been completed on how DPN affects paddy field N2O emissions and NH3 volatilization. However, only a small number of studies have focused on the impact of DPN on GNL, NUE, and yield of paddy fields under WSI. In this work, we explored the impact of basal nitrogen fertilizer deep placement combined with WSI on N2O emission fluxes, the NH3 volatilization rate, the nitrogen accumulation of plants, and the yields, and calculated the NUE in Northeast China. The results validated our hypothesis that the deep placement of basal nitrogen fertilizer combined with WSI more effectively reduced the GNL and improved the NUE and rice yield.
When nitrogen fertilizer was given to the soil, urease caused the nitrogen fertilizer to be hydrolyzed into NH4+-N, and any excess nitrogen input would be lost in the form of NH3 volatilization or N2O emissions [33,34]. N2O was primarily caused by soil nitrification and denitrification and discharged into the atmosphere through rice plants or the soil-water-atmosphere interface [35]. This result showed that WSI combined with basal nitrogen fertilizer deep application reduced seasonal N2O fluxes from paddy fields. The seasonal N2O fluxes of WSN, WSN1, and WSN2 were lower when compared with CFN in 2021 and 2022 (Table 2). This suggested that the deep application of basal nitrogen fertilizer was a favorable measure to inhibit N2O emissions. This was primarily because soil aeration was lower in the subsoil than in the topsoil. Hence, the nitrobacteria activity in the subsoil was lower compared with that in the topsoil. Lower nitrobacteria activity causes a low nitrification rate that results in more NH4+-N accumulation in the soil [36]. Additionally, DPN regulated nitrogen status in the rhizosphere of rice and promoted roots to grow deeper [37,38]. More nitrogen was utilized by plants, and this reduced the reaction substrates for nitrification and denitrification, consequently reducing N2O emissions. [39,40]. However, Linquist et al. argued that DPN promoted N2O emissions because it increased oxygen availability [41]. These contradictory results might be attributed to variations in the climate conditions, soil, the source and quantity of nitrogen fertilizer, and their interactions.
There were many factors that affected NH3 volatilization. A physical mechanism was involved in the release of NH3 from soil to the atmosphere. It is generally considered that WSI is susceptible to enhancing NH3 volatilization, primarily because the thin water layer or anhydrous environment provided by it shortens the escape path of NH3 and the aerobic environment improves urease activity [13,42]. While it was worth noting that our research showed the NH3 volatilization peak after the application of basal fertilizer and seasonal NH3 volatilization of CFN were not higher than those of WSN, they were even slightly lower than those of WSN (Figure 4). The decreased NH3 volatilization peak and seasonal NH3 volatilization illustrated that deep placement of basal fertilizer was an effective measure to mitigate NH3 volatilization of paddy fields after the implementation of WSI. The possible reasons for this observation are: (i) The NH4+-N content of the surface water has a positive correlation with NH3 volatilization rate. The deep placement of basal fertilizer possibly decreased the NH4+-N content of the surface water and thus mitigated NH3 volatilization. [43,44]. (ii) Deep placement of basal fertilizer stimulated more nitrogen that could be absorbed by soil colloids and kept in the soil for an extended time [19]. (iii) Urease activity in the subsoil was lower, so the deep placement of basal fertilizer inhibited the transformation of urea into inorganic nitrogen and thus inhibited NH3 volatilization [45,46].
Our previous studies showed that WSI increased rice yield by 0.5~9.99% by increasing the rice harvest index compared with CFI [47]. This study confirmed that WSI combined with the deep placement of basal nitrogen fertilizer decreased the GNL of paddy fields so that more nitrogen could be utilized by plants, which further increased yield and NUE. The GNL of treatments under WSI was lower than those of CFN (Table 2). The rice yields of WSN and WSN1 were 1.6~28.8% higher than those of CFN (Table 4). We also found that the NUEs of those treatments under WSI were higher than those of CFN, and those of WSN and WSN1 were significantly higher than that of CFN in 2021 (p < 0.05) (Table 4). This may have been due to the fact that the nitrogen accumulation of grain accounts for 60%~74% of the total nitrogen accumulation and the grain nitrogen accumulations of WSN and WSN1 were higher than those of CFN (Table 3). Moreover, the grain, stem, and leaf dry matter weights of WSN and WSN1 were higher when compared with CFN (Figure 5). Considering the yield, NUE and GNL, WSI combined with the deep placement of basal nitrogen fertilizer and a nitrogen application of 99 kg hm−2 was recommended as the optimal water and fertilizer management mode. In addition, due to the larger planting density of the paddy fields than the dry land and because the soil texture of Mollisols is soft, a side-deeping fertilizer machine walks hard when the tillering and panicle nitrogen fertilizer were applied. Hence, the deep application of topdressing fertilizer was greatly limited. It can be considered to apply an urease inhibitor or a nitrification inhibitor, and this would be more feasible to further reduce the GNL of paddy fields by about 50% and improve the rice yield (9%, 6–13%) and NUE (58%, 34–93%) [48,49].

5. Conclusions

Under WSI, the deep placement of basal nitrogen fertilizer mitigated the GNL of paddy fields primarily via the reduction of NH3 volatilization in Northeast China. The GNL during the rice cropping season under the treatments ranged from 5.29 to 10.67 kg hm−2. The GNL of WSN1 and WSN2 were significantly lower than those of CFN (p < 0.05). Additionally, the NUEs and rice yields of WSN and WSN1 were higher than those of CFN. In total, these results indicated that WSI combined with the deep placement of basal nitrogen fertilizer when the nitrogen application level is 99 kg hm−2 was the optimal management pattern for paddy fields as it simultaneously improved the rice yield and NUE and reduced the GNL. Further study should focus on the development of side-deeping fertilizer machines and effective fertilizer inhibitors to provide technical support for further improving NUE and reducing GNL.

Author Contributions

Methodology, T.L.; software, T.L.; validation, Z.Z. (Zhongxue Zhang) and Z.Q.; formal analysis, T.N. and P.C.; investigation, D.S. and S.D.; data curation, T.L.; writing—original draft preparation, T.L.; writing—review and editing, Z.Z. (Zhongxue Zhang), Z.Z. (Zuohe Zhang) and X.Z.; funding acquisition, Z.Z. (Zhongxue Zhang). All authors have read and agreed to the published version of the manuscript.

Funding

This study was funded by General Projects of the National Natural Science Foundation of China (52079028).

Data Availability Statement

The data presented in this study are available on request from the corresponding author.

Acknowledgments

We would like to thank the Heilongjiang Province Hydraulic Research Institute for providing us access to the test sites, as well as for their valuable time providing us with management information. We thank the anonymous reviewers and the editors for their suggestions which substantially improved the manuscript.

Conflicts of Interest

The authors declare no conflict of interest.

References

  1. Xin, F.; Xiao, X.; Dong, J.; Zhang, G.; Zhang, Y.; Wu, X.; Li, X.; Zou, Z.; Ma, J.; Du, G.; et al. Large increases of paddy rice area, gross primary production, and grain production in Northeast China during 2000–2017. Sci. Total Environ. 2020, 711, 135183. [Google Scholar] [CrossRef]
  2. Xu, H.; Tian, Z.; He, X.; Wang, J.; Sun, L.; Fischer, G.; Fan, D.; Zhong, H.; Wu, W.; Pope, E.; et al. Future increases in irrigation water requirement challenge the water-food nexus in the northeast farming region of China. Agr. Water Manag. 2019, 213, 594–604. [Google Scholar] [CrossRef]
  3. Chen, P.; Xu, J.; Zhang, Z.; Wang, K.; Li, T.; Wei, Q.; Li, Y. Carbon pathways in aggregates and density fractions in Mollisols under water and straw management: Evidence from 13C natural abundance. Soil Biol. Biochem. 2022, 169, 108684. [Google Scholar] [CrossRef]
  4. Yang, S.; Peng, S.; Xu, J.; Luo, Y.; Li, D. Methane and nitrous oxide emissions from paddy field as affected by water-saving irrigation. Phys. Chem. Earth 2012, 53–54, 30–37. [Google Scholar] [CrossRef]
  5. Zhuang, Y.; Zhang, L.; Li, S.; Liu, H.; Zhai, L.; Zhou, F.; Ye, Y.; Ruan, S.; Wen, W. Effects and potential of water-saving irrigation for rice production in China. Agr. Water Manag. 2019, 217, 374–382. [Google Scholar] [CrossRef]
  6. Chen, P.; Nie, T.; Chen, S.; Zhang, Z.; Qi, Z.; Liu, W. Recovery efficiency and loss of 15N-labelled urea in a rice-soil system under water saving irrigation in the Songnen Plain of Northeast China. Agr. Water Manag. 2019, 222, 139–153. [Google Scholar] [CrossRef]
  7. Chen, X.; Wo, F.; Chen, C.; Fang, K. Seasonal changes in the concentrations of nitrogen and phosphorus in farmland drainage and groundwater of the Taihu Lake region of China. Environ. Monit. Assess. 2010, 169, 159–168. [Google Scholar] [CrossRef]
  8. Cui, S.; Shi, Y.; Groffman, P.M.; Schlesinger, W.H.; Zhu, Y.G. Centennial-scale analysis of the creation and fate of reactive nitrogen in China (1910–2010). Proc. Natl. Acad. Sci. USA 2013, 110, 2052–2057. [Google Scholar] [CrossRef] [PubMed] [Green Version]
  9. Sey, B.K.; Manceur, A.M.; Whalen, J.K.; Gregorich, E.G.; Rochette, P. Small-scale heterogeneity in carbon dioxide, nitrous oxide and methane production from aggregates of a cultivated sandy-loam soil. Soil. Biol. Biochem. 2008, 40, 2468–2473. [Google Scholar] [CrossRef]
  10. Liu, S.; Qin, Y.; Zou, J.; Liu, Q. Effects of water regime during rice-growing season on annual direct N(2)O emission in a paddy rice-winter wheat rotation system in southeast China. Sci. Total Environ. 2010, 408, 906–913. [Google Scholar] [CrossRef] [PubMed]
  11. Zheng, W.; Wang, S.; Tan, K.; Lei, Y. Nitrate accumulation and leaching potential is controlled by land-use and extreme precipitation in a headwater catchment in the North China Plain. Sci. Total Environ. 2020, 707, 136168. [Google Scholar] [CrossRef] [PubMed]
  12. Wu, D.; Cárdenas, L.M.; Calvet, S.; Brüggemann, N.; Loick, N.; Liu, S.; Bol, R. The effect of nitrification inhibitor on N2O, NO and N2 emissions under different soil moisture levels in a permanent grassland soil. Soil. Biol. Biochem. 2017, 113, 153–160. [Google Scholar] [CrossRef]
  13. Bhagat, R.M.; Bhuiyan, S.I.; Moody, K. Water, tillage and weed interactions in lowland tropical rice: A review. Agr. Water Manag. 1996, 31, 165–184. [Google Scholar] [CrossRef]
  14. Xu, J.-Z.; Peng, S.-Z.; Hou, H.-J.; Yang, S.-H.; Luo, Y.-F.; Wang, W.-G. Gaseous losses of nitrogen by ammonia volatilization and nitrous oxide emissions from rice paddies with different irrigation management. Irrig. Sci. 2012, 31, 983–994. [Google Scholar] [CrossRef]
  15. Ding, T.; Ning, Y.; Zhang, Y. Estimation of greenhouse gas emissions in China 1990-2013. Greenh. Gases 2017, 7, 1097–1115. [Google Scholar] [CrossRef]
  16. Zhang, M.; Yao, Y.; Zhao, M.; Zhang, B.; Tian, Y.; Yin, B.; Zhu, Z. Integration of urea deep placement and organic addition for improving yield and soil properties and decreasing N loss in paddy field. Agr. Ecosyst. Environ. 2017, 247, 236–245. [Google Scholar] [CrossRef]
  17. Xia, L.; Li, X.; Ma, Q.; Lam, S.K.; Wolf, B.; Kiese, R.; Butterbach-Bahl, K.; Chen, D.; Li, Z.; Yan, X. Simultaneous quantification of N2, NH3 and N2O emissions from a flooded paddy field under different N fertilization regimes. Glob. Chang. Biol. 2019, 26, 2292–2303. [Google Scholar] [CrossRef]
  18. Yao, Y.; Zhang, M.; Tian, Y.; Zhao, M.; Zhang, B.; Zhao, M.; Zeng, K.; Yin, B. Urea deep placement for minimizing NH3 loss in an intensive rice cropping system. Field Crops Res. 2018, 218, 254–266. [Google Scholar] [CrossRef]
  19. Chatterjee, D.; Mohanty, S.; Guru, P.K.; Swain, C.K.; Tripathi, R.; Shahid, M.; Kumar, U.; Kumar, A.; Bhattacharyya, P.; Gautam, P.; et al. Comparative assessment of urea briquette applicators on greenhouse gas emission, nitrogen loss and soil enzymatic activities in tropical lowland rice. Agr. Ecosyst. Environ. 2018, 252, 178–190. [Google Scholar] [CrossRef]
  20. Bandaogo, A.; Bidjokazo, F.; Youl, S.; Safo, E.; Abaidoo, R.; Andrews, O. Effect of fertilizer deep placement with urea supergranule on nitrogen use efficiency of irrigated rice in Sourou Valley (Burkina Faso). Nutr. Cycl. Agroecosyst. 2014, 102, 79–89. [Google Scholar] [CrossRef]
  21. Liu, T.Q.; Li, S.H.; Guo, L.G.; Cao, C.G.; Li, C.F.; Zhai, Z.B.; Zhou, J.Y.; Mei, Y.M.; Ke, H.J. Advantages of nitrogen fertilizer deep placement in greenhouse gas emissions and net ecosystem economic benefits from no-tillage paddy fields. J. Clean Prod. 2020, 263, 121322. [Google Scholar] [CrossRef]
  22. Liu, T.Q.; Fan, D.J.; Zhang, X.X.; Chen, J.; Li, C.F.; Cao, C.G. Deep placement of nitrogen fertilizers reduces ammonia volatilization and increases nitrogen utilization efficiency in no-tillage paddy fields in central China. Field Crops Res. 2015, 184, 80–90. [Google Scholar] [CrossRef]
  23. Zhu, C.; Xiang, J.; Zhang, Y.; Zhang, Y.; Zhu, D.; Chen, H. Mechanized transplanting with side deep fertilization increases yield and nitrogen use efficiency of rice in Eastern China. Sci. Rep. 2019, 9, 5653. [Google Scholar] [CrossRef] [PubMed] [Green Version]
  24. Nie, T.; Huang, J.; Zhang, Z.; Chen, P.; Li, T.; Dai, C. The inhibitory effect of a water-saving irrigation regime on CH4 emission in Mollisols under straw incorporation for 5 consecutive years. Agric. Water Manag. 2023, 278, 108163. [Google Scholar] [CrossRef]
  25. Chen, P.; Xu, J.; Zhang, Z.; Nie, T. ‘Preferential’ ammonium uptake by rice does not always turn into higher N recovery of fertilizer sources under water-saving irrigation. Agr. Water Manag. 2022, 272, 107867. [Google Scholar] [CrossRef]
  26. Fan, C.; Chen, H.; Li, B.; Xiong, Z. Biochar reduces yield-scaled emissions of reactive nitrogen gases from vegetable soils across China. Biogeosciences 2017, 14, 2851–2863. [Google Scholar] [CrossRef] [Green Version]
  27. Wu, P.; Liu, F.; Li, H.; Cai, T.; Zhang, P.; Jia, Z. Suitable fertilizer application depth can increase nitrogen use efficiency and maize yield by reducing gaseous nitrogen losses. Sci. Total Environ. 2021, 781, 146787. [Google Scholar] [CrossRef]
  28. Li, J.; Yang, H.; Zhou, F.; Zhang, X.; Luo, J.; Li, Y.; Lindsey, S.; Shi, Y.; He, H.; Zhang, X. Effects of maize residue return rate on nitrogen transformations and gaseous losses in an arable soil. Agr. Water Manag. 2019, 211, 132–141. [Google Scholar] [CrossRef]
  29. Guo, Y.; Ji, Y.; Zhang, J.; Liu, Q.; Han, J.; Zhang, L. Effects of water and nitrogen management on N2O emissions and NH3 volatilization from a vineyard in North China. Agr. Water Manag. 2022, 266, 107601. [Google Scholar] [CrossRef]
  30. Singh, S.; Singh, J.S.; Kashyap, A.K. Methane flux from irrigated rice fields in relation to crop growth and N-fertilization. Soil Biol. Biochem. 1999, 31, 1219–1228. [Google Scholar] [CrossRef]
  31. Ke, J.; He, R.; Hou, P.; Ding, C.; Ding, Y.; Wang, S.; Liu, Z.; Tang, S.; Ding, C.; Chen, L.; et al. Combined controlled-released nitrogen fertilizers and deep placement effects of N leaching, rice yield and N recovery in machine-transplanted rice. Agr. Ecosyst. Environ. 2018, 265, 402–412. [Google Scholar] [CrossRef]
  32. Li, M.; Wang, Y.; Adeli, A.; Yan, H. Effects of application methods and urea rates on ammonia volatilization, yields and fine root biomass of alfalfa. Field Crops Res. 2018, 218, 115–125. [Google Scholar] [CrossRef]
  33. Corrochano-Monsalve, M.; Bozal-Leorri, A.; Sánchez, C.; González-Murua, C.; Estavillo, J.-M. Joint application of urease and nitrification inhibitors to diminish gaseous nitrogen losses under different tillage systems. J. Clean. Prod. 2021, 289, 125701. [Google Scholar] [CrossRef]
  34. Hofmeier, M.; Roelcke, M.; Han, Y.; Lan, T.; Bergmann, H.; Böhm, D.; Cai, Z.; Nieder, R. Nitrogen management in a rice–wheat system in the Taihu Region: Recommendations based on field experiments and surveys. Agr. Ecosyst. Environ. 2015, 209, 60–73. [Google Scholar] [CrossRef]
  35. Goldberg, S.D.; Knorr, K.H.; Gebauer, G. N(2)O concentration and isotope signature along profiles provide deeper insight into the fate of N(2)O in soils. Isot. Environ. Health 2008, 44, 377–391. [Google Scholar] [CrossRef] [PubMed]
  36. Cui, T.; Li, Z.; Wang, S. Effects of in-situ straw decomposition on composition of humus and structure of humic acid at different soil depths. J. Soils Sediment 2017, 17, 2391–2399. [Google Scholar] [CrossRef]
  37. Nasielski, J.; Grant, B.; Smith, W.; Niemeyer, C.; Janovicek, K.; Deen, B. Effect of nitrogen source, placement and timing on the environmental performance of economically optimum nitrogen rates in maize. Field Crops Res. 2020, 246, 107686. [Google Scholar] [CrossRef]
  38. Nkebiwe, P.M.; Weinmann, M.; Bar-Tal, A.; Müller, T. Fertilizer placement to improve crop nutrient acquisition and yield: A review and meta-analysis. Field Crops Res. 2016, 196, 389–401. [Google Scholar] [CrossRef]
  39. Maris, S.C.; Teira-Esmatges, M.R.; Arbones, A.; Rufat, J. Effect of irrigation, nitrogen application, and a nitrification inhibitor on nitrous oxide, carbon dioxide and methane emissions from an olive (Olea europaea L.) orchard. Sci. Total Environ. 2015, 538, 966–978. [Google Scholar] [CrossRef]
  40. Qin, X.; Li Ye Wang, B.; Wan, Y.; Gao, Q.; Chen, X.; Chen, H.; Song, C. Nonlinear dependency of N2O emissions on nitrogen input in dry farming systems may facilitate green development in China. Agr. Ecosyst. Environ. 2021, 317, 107456. [Google Scholar] [CrossRef]
  41. Linquist, B.A.; Adviento-Borbe, M.A.; Pittelkow, C.M.; van Kessel, C.; van Groenigen, K.J. Fertilizer management practices and greenhouse gas emissions from rice systems: A quantitative review and analysis. Field Crops Res. 2012, 135, 10–21. [Google Scholar] [CrossRef]
  42. Freney, J.R.; Trevitt, A.C.F.; Muirhead, W.A.; Denmead, O.T.; Simpson, J.R.; Obcemea, W.N. Effect of water depth on ammonia loss from lowland rice. Fertil. Res. 1988, 16, 97–107. [Google Scholar] [CrossRef]
  43. Cao, Y.; Tian, Y.; Yin, B.; Zhu, Z. Assessment of ammonia volatilization from paddy fields under crop management practices aimed to increase grain yield and N efficiency. Field Crops Res. 2013, 147, 23–31. [Google Scholar] [CrossRef]
  44. Xu, J.; Peng, S.; Yang, S.; Wang, W. Ammonia volatilization losses from a rice paddy with different irrigation and nitrogen managements. Agr. Water Manag. 2012, 104, 184–192. [Google Scholar] [CrossRef]
  45. Keshavarz Afshar, R.; Lin, R.; Mohammed, Y.A.; Chen, C. Agronomic effects of urease and nitrification inhibitors on ammonia volatilization and nitrogen utilization in a dryland farming system: Field and laboratory investigation. J. Clean. Prod. 2018, 172, 4130–4139. [Google Scholar] [CrossRef]
  46. Zhao, M.; Tian, Y.; Ma, Y.; Zhang, M.; Yao, Y.; Xiong, Z.; Yin, B.; Zhu, Z. Mitigating gaseous nitrogen emissions intensity from a Chinese rice cropping system through an improved management practice aimed to close the yield gap. Agr. Ecosyst. Environ. 2015, 203, 36–45. [Google Scholar] [CrossRef]
  47. Du, S.; Zhang, Z.; Li, T.; Wang, Z.; Zhou, X.; Gai, Z.; Qi, Z. Response of Rice Harvest Index to Different Water and Nitrogen Management Modes in the Black Soil Region of Northeast China. Agriculture 2022, 12, 115. [Google Scholar] [CrossRef]
  48. Fan, D.; He, W.; Smith, W.N.; Drury, C.F.; Jiang, L.; Grant, B.B.; Shi, Y.; Song, D.; Chen, Y.; Wang, X.; et al. Global evaluation of inhibitor impacts on ammonia and nitrous oxide emissions from agricultural soils: A meta-analysis. Global. Chang. Biol. 2022, 28, 5121–5141. [Google Scholar] [CrossRef]
  49. Qiao, C.; Liu, L.; Hu, S.; Compton, J.E.; Greaver, T.; Li, Q. How inhibiting nitrification affects nitrogen cycle and reduces environmental impacts of anthropogenic nitrogen input. Global. Chang. Biol. 2015, 21, 1249–1257. [Google Scholar] [CrossRef]
Figure 1. Experimental site location.
Agronomy 13 00842 g001
Figure 2. Changes of air temperature and precipitation in (a) 2021 and (b) 2022.
Agronomy 13 00842 g002
Figure 3. N2O emission fluxes and seasonal N2O fluxes during the rice cropping season in (a) 2021 and (b) 2022. Bars represent means SE. Different letters indicate significant differences (p < 0.05) between different treatments.
Agronomy 13 00842 g003
Figure 4. NH3 volatilization rates and seasonal NH3 volatilization during the rice cropping season in (a) 2021 and (b) 2022. Bars represent means SE. Different letters indicate significant differences (p < 0.05) between different treatments.
Agronomy 13 00842 g004
Figure 5. Dry matter weights and the nitrogen contents of the plants in (a) 2021 and (b) 2022. Bars represent means SE. Different letters indicate significant differences (p < 0.05) between different treatments.
Agronomy 13 00842 g005
Table 1. Different water management patterns at the rice growth stages.
Irrigation
Regime
Soil Water ContentTurning
Green
Early
Tillering
Middle
Tillering
Later
Tillering
Jointing and BootingHeading and
Flowering
MilkYellow-Wipe
CFImaximum30 mm50 mm50 mmDrainage50 mm50 mm50 mmNaturally drying
minimum0 mm10 mm10 mm10 mm10 mm10 mm
WSImaximum30 mm30 mm30 mmDrainage30 mm30 mm0 mmNaturally drying
minimum0 mm0.7θs0.7θs0.8θs0.8θs0.7θs
Note: therein, the θs refer to the soil saturated water content mass fraction in the root layer, CFI, conventional flooding irrigation; WSI, water-saving irrigation.
Table 2. Gaseous nitrogen losses during the rice cropping season.
YearTreatmentSeasonal N2O Fluxes/
kg hm−2
N2O-N/
kg hm−2
Seasonal NH3 Volatilization/
kg hm−2
NH3-N/
kg hm−2
GNL/kg hm−2
2021CFN0.77 ± 0.09 a0.49 ± 0.06 a12.36 ± 0.88 a10.18 ± 0.73 a10.67 ± 0.79 a
WSN−0.02 ± 0.01 b−0.01 ± 0.01 b12.28 ± 0.90 a10.12 ± 0.74 a10.10 ± 0.73 a
WSN1−0.23 ± 0.02 c−0.15 ± 0.01 c10.39 ± 0.75 b8.56 ± 0.62 b8.41 ± 0.61 b
WSN2−0.26 ± 0.04 c−0.17 ± 0.03 c8.62 ± 0.68 c7.10 ± 0.56 c6.93 ± 0.55 c
2022CFN1.16 ± 0.19 a0.74 ± 0.12 a7.02 ± 0.53 a5.78 ± 0.44 a6.52 ± 0.54 a
WSN1.06 ± 0.02 a0.68 ± 0.01 a6.89 ± 0.53 ab5.68 ± 0.45 ab6.35 ± 0.53 ab
WSN10.79 ± 0.13 b0.50 ± 0.08b 6.31 ± 0.49 bc5.70 ± 0.48 bc5.70 ± 0.48 bc
WSN20.66 ± 0.02 b0.42 ± 0.07 b5.91 ± 0.41 c5.29 ± 0.40 c5.29 ± 0.35 c
Different lowercase letters indicate significant differences between treatments (p < 0.05).
Table 3. Nitrogen accumulations of the plants.
YearTreatmentLeaf
N Accumulation/
kg hm−2
Stem
N Accumulation/
kg hm−2
Grain
N Accumulation/
kg hm−2
Root
N Accumulation/
kg hm−2
Total
N Accumulation/
kg hm−2
2021CFN8.45 ± 0.63 b25.39 ± 2.40 a75.03 ± 4.08 b14.46 ± 0.77 a123.32 ± 7.66 ab
WSN10.82 ± 0.87 a23.14 ± 1.82 ab94.07 ± 5.98 a7.49 ± 0.57 b135.52 ± 9.15 a
WSN17.89 ± 0.53 b22.75 ± 2.09 b90.93 ± 8.70 a8.23 ± 0.41 b129.79 ± 11.52 a
WSN26.11 ± 0.50 c15.53 ± 1.17 c79.71 ± 5.87 b6.09 ± 0.47 c107.43 ± 7.96 b
2022CFN12.13 ± 0.98 a26.57 ± 1.78 a90.59 ± 5.95 a21.81 ± 1.71 a151.10 ± 10.32 a
WSN12.71 ± 0.84 a25.29 ± 2.26 a95.58 ± 6.37 a13.63 ± 0.91 b147.21 ± 9.62 ab
WSN111.57 ± 0.73 ab24.21 ± 2.24 a91.19 ± 5.97 a9.46 ± 0.44 c136.43 ± 8.66 bc
WSN210.58 ± 0.95 b21.11 ± 1.67 b86.30 ± 7.50 a9.19 ± 0.70 c127.18 ± 10.75 c
Different lowercase letters indicate significant differences between treatments (p < 0.05).
Table 4. Rice yields and the nitrogen use efficiencies.
YearTreatmentNitrogen Application/
kg hm−2
Nitrogen
Use Efficiency/%
Rice Yield/kg hm−2
2021CFN11036.64 ± 1.31 b7569 ± 249 c
WSN11054.77 ± 4.32 a9749 ± 325 a
WSN19954.32 ± 7.36 a9657 ± 602 a
WSN28838.14 ± 3.66 b8458 ± 364 b
2022CFN11055.21 ± 3.13 a9139 ± 269 b
WSN11058.78 ± 4.68 a9558 ± 364 a
WSN19958.64 ± 4.06 a9282 ± 323 ab
WSN28855.76 ± 6.54 a8863 ± 492 b
Different lowercase letters indicate significant differences between treatments (p < 0.05).
Disclaimer/Publisher’s Note: The statements, opinions and data contained in all publications are solely those of the individual author(s) and contributor(s) and not of MDPI and/or the editor(s). MDPI and/or the editor(s) disclaim responsibility for any injury to people or property resulting from any ideas, methods, instructions or products referred to in the content.

