
Effects of Two Biochar Types on Mitigating Drought and Salt Stress in Tomato Seedlings
 , ,
, ,  and
and
Abstract
: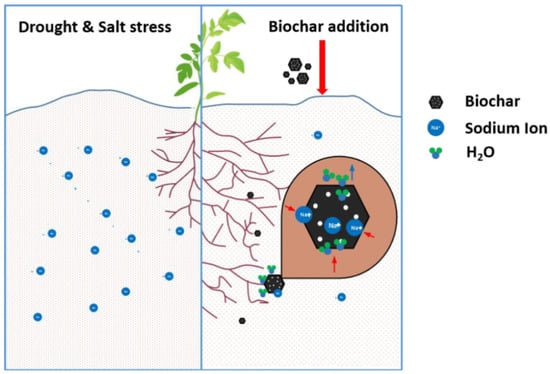
1. Introduction
2. Materials and Methods
2.1. Soil and Biochar
2.2. Experimental Design
2.3. Experimental Setup
2.4. Measurement of Parameters
2.4.1. Soil Water Content and Plant Water Consumption
2.4.2. Plant Water Relations
2.4.3. Gas Exchange Measurements
2.4.4. Leaf Area, Biomass, Ratio of Root and Shoot (Rrs), and Specific Leaf Area (SLA)
2.4.5. ABA Concentration
2.4.6. iWUE and WUE
2.5. Data Analysis
3. Results
3.1. Morphological Parameters
3.2. Gas Exchange
3.3. Water Relations
3.4. Leaf and Xylem Sap ABA Concentrations
3.5. WUE and iWUE
4. Discussion
5. Conclusions
Author Contributions
Funding
Data Availability Statement
Acknowledgments
Conflicts of Interest
References
- Munns, R. Genes and salt tolerance: Bringing them together. New Phytol. 2005, 167, 645–663. [Google Scholar] [CrossRef] [PubMed]
- Parihar, P.; Singh, S.; Singh, R.; Singh, V.P.; Prasad, S.M. Effect of salinity stress on plants and its tolerance strategies: A review. Environ. Sci. Pollut. Res. 2015, 22, 4056–4075. [Google Scholar] [CrossRef] [PubMed]
- Hamal, K.; Sharma, S.; Pokharel, B.; Shrestha, D.; Talchabhadel, R.; Shrestha, A.; Khadka, N. Changing pattern of drought in Nepal and associated atmospheric circulation. Atmos. Res. 2021, 262, 105798. [Google Scholar] [CrossRef]
- Aliyari, F.; Bailey, R.T.; Arabi, M. Appraising climate change impacts on future water resources and agricultural productivity in agro-urban river basins. Sci. Total Environ. 2021, 788, 147717. [Google Scholar] [CrossRef]
- Chen, L.; Chang, J.; Wang, Y.; Guo, A.; Liu, Y.; Wang, Q.; Zhu, Y.; Zhang, Y.; Xie, Z. Disclosing the future food security risk of China based on crop production and water scarcity under diverse socioeconomic and climate scenarios. Sci. Total Environ. 2021, 790, 148110. [Google Scholar] [CrossRef] [PubMed]
- The PLOS ONE Staff. Correction: ACC-deaminase producing plant growth promoting rhizobacteria and biochar mitigate adverse effects of drought stress on maize growth. PLoS ONE 2021, 16, e0250286. [Google Scholar] [CrossRef]
- Farooq, M.; Gogoi, N.; Barthakur, S.; Baroowa, B.; Bharadwaj, N.; Alghamdi, S.S.; Siddique, K.H.M. Drought Stress in Grain Legumes during Reproduction and Grain Filling. J. Agron. Crop Sci. 2017, 203, 81–102. [Google Scholar] [CrossRef]
- Zhang, X.; Lv, P.; Xu, C.; Huang, X.; Rademacher, T. Dryness decreases average growth rate and increases drought sensitivity of Mongolia oak trees in North China. Agric. For. Meteorol. 2021, 308–309, 108611. [Google Scholar] [CrossRef]
- Cui, J.; Shao, G.; Lu, J.; Keabetswe, L.; Hoogenboom, G. Yield, quality and drought sensitivity of tomato to water deficit during different growth stages. Sci. Agric. 2020, 77, e20180390. [Google Scholar] [CrossRef] [Green Version]
- Chen, J.; Kang, S.; Du, T.; Guo, P.; Qiu, R.; Chen, R.; Gu, F. Modeling relations of tomato yield and fruit quality with water deficit at different growth stages under greenhouse condition. Agric. Water Manag. 2014, 146, 131–148. [Google Scholar] [CrossRef]
- Chen, J.; Kang, S.; Du, T.; Qiu, R.; Guo, P.; Chen, R. Quantitative response of greenhouse tomato yield and quality to water deficit at different growth stages. Agric. Water Manag. 2013, 129, 152–162. [Google Scholar] [CrossRef]
- Liang, K.; Peng, X.; Liu, F. Physiological response of Miscanthus genotypes to salinity stress under elevated CO2. GCB Bioenergy 2022, 14, 858–874. [Google Scholar] [CrossRef]
- Parida, A.K.; Das, A.B. Salt tolerance and salinity effects on plants: A review. Ecotoxicol. Environ. Saf. 2004, 60, 324–349. [Google Scholar] [CrossRef] [PubMed]
- Akhtar, S.S.; Andersen, M.N.; Naveed, M.; Zahir, Z.A.; Liu, F. Interactive effect of biochar and plant growth-promoting bacterial endophytes on ameliorating salinity stress in maize. Funct. Plant Biol. 2015, 42, 770. [Google Scholar] [CrossRef]
- Liu, A.; Zhang, Y.; Zhong, Z.; Wu, X.; Zhang, M. Effect of salt stress on the growth and osmotic accumulation of Coleus blumei. Acta Pratacult. Sin. 2013, 22, 211–218. [Google Scholar]
- Almansouri, M.; Kinet, J.-M.; Lutts, S. Effect of salt and osmotic stresses on germination in durum wheat (Triticum durum Desf.). Plant Soil 2001, 231, 243–254. [Google Scholar] [CrossRef]
- Hussain, S.; Shaukat, M.; Ashraf, M.; Zhu, C.; Jin, Q.; Zhang, J. Salinity Stress in Arid and Semi-Arid Climates: Effects and Management in Field Crops. In Climate Change and Agriculture; IntechOpen: Rijeka, Croatia, 2019; Volume 13, pp. 201–226. [Google Scholar] [CrossRef] [Green Version]
- Morales, M.M.; Comerford, N.; Guerrini, I.A.; Falcao, N.; Reeves, J.B. Sorption and desorption of phosphate on biochar and biochar-soil mixtures. Soil Use Manag. 2013, 29, 306–314. [Google Scholar] [CrossRef]
- Ajayi, A.E.; Horn, R. Biochar-Induced Changes in Soil Resilience: Effects of Soil Texture and Biochar Dosage. Pedosphere 2017, 27, 236–247. [Google Scholar] [CrossRef]
- Blanco-Canqui, H. Biochar and Soil Physical Properties. Soil Sci. Soc. Am. J. 2017, 81, 687–711. [Google Scholar] [CrossRef] [Green Version]
- Fehmi, J.S.; Rasmussen, C.; Rachel, E. Gallery Biochar and woodchip amendments alter restoration outcomes, microbial processes, and soil moisture in a simulated semi-arid ecosystem. Restor. Ecol. 2020, 28, S355–S364. [Google Scholar] [CrossRef]
- Githinji, L. Effect of biochar application rate on soil physical and hydraulic properties of a sandy loam. Arch. Agron. Soil Sci. 2014, 60, 457–470. [Google Scholar] [CrossRef]
- Jaafar, N.M.; Clode, P.L.; Abbott, L.K. Biochar-Soil Interactions in Four Agricultural Soils. Pedosphere 2015, 25, 729–736. [Google Scholar] [CrossRef]
- Li, Y.; Feng, G.; Tewolde, H.; Yang, M.; Zhang, F. Soil, biochar, and nitrogen loss to runoff from loess soil amended with biochar under simulated rainfall. J. Hydrol. 2020, 591, 125318. [Google Scholar] [CrossRef]
- Abiven, S.; Hund, A.; Martinsen, V.; Cornelissen, G. Biochar amendment increases maize root surface areas and branching: A shovelomics study in Zambia. Plant Soil 2015, 395, 45–55. [Google Scholar] [CrossRef] [Green Version]
- Backer, R.G.M.; Saeed, W.; Seguin, P.; Smith, D.L. Root traits and nitrogen fertilizer recovery efficiency of corn grown in biochar-amended soil under greenhouse conditions. Plant Soil 2017, 415, 465–477. [Google Scholar] [CrossRef]
- Xiang, Y.; Deng, Q.; Duan, H.; Guo, Y. Effects of biochar application on root traits: A meta-analysis. GCB Bioenergy 2017, 9, 1563–1572. [Google Scholar] [CrossRef]
- Zou, Z.; Fan, L.; Li, X.; Dong, C.; Zhang, L.; Zhang, L.; Fu, J.; Han, W.; Yan, P. Response of Plant Root Growth to Biochar Amendment: A Meta-Analysis. Agronomy 2021, 11, 2442. [Google Scholar] [CrossRef]
- Bruun, E.W.; Petersen, C.T.; Hansen, E.H.; Holm, J.K.; Hauggaard-Nielsen, H. Biochar amendment to coarse sandy subsoil improves root growth and increases water retention. Soil Use Manag. 2014, 30, 109–118. [Google Scholar] [CrossRef]
- Sun, C.X.; Chen, X.; Cao, M.M.; Li, M.Q.; Zhang, Y.L. Growth and metabolic responses of maize roots to straw biochar application at different rates. Plant Soil 2017, 416, 487–502. [Google Scholar] [CrossRef]
- Edeh, I.G.; Mašek, O.; Buss, W. A meta-analysis on biochar’s effects on soil water properties—New insights and future research challenges. Sci. Total Environ. 2020, 714, 136857. [Google Scholar] [CrossRef]
- Gliniak, M.; Sikora, J.; Sadowska, U.; Klimek-Kopyra, A.; Latawiec, A.; Kuboń, M. Impact of Biochar on Water Permeability in Soil. IOP Conf. Ser. Mater. Sci. Eng. 2020, 960, 042017. [Google Scholar] [CrossRef]
- Ghorbani, M.; Amirahmadi, E.; Konvalina, P.; Moudrý, J.; Bárta, J.; Kopecký, M.; Teodorescu, R.I.; Bucur, R.D. Comparative Influence of Biochar and Zeolite on Soil Hydrological Indices and Growth Characteristics of Corn (Zea mays L.). Water 2022, 14, 3506. [Google Scholar] [CrossRef]
- Guo, M. Application of Biochar for Soil Physical Improvement; John Wiley & Sons, Ltd.: Hoboken, NJ, USA, 2016; pp. 101–122. [Google Scholar] [CrossRef]
- Chang, Y.; Rossi, L.; Zotarelli, L.; Gao, B.; Shahid, M.A.; Sarkhosh, A. Biochar improves soil physical characteristics and strengthens root architecture in Muscadine grape (Vitis rotundifolia L.). Chem. Biol. Technol. Agric. 2021, 8, 7. [Google Scholar] [CrossRef]
- Ghorbani, M.; Neugschwandtner, R.W.; Konvalina, P.; Asadi, H.; Kopecký, M.; Amirahmadi, E. Comparative effects of biochar and compost applications on water holding capacity and crop yield of rice under evaporation stress: A two-years field study. Paddy Water Environ. 2023, 21, 47–58. [Google Scholar] [CrossRef]
- Ghorbani, M.; Amirahmadi, E.; Neugschwandtner, R.W.; Konvalina, P.; Kopecký, M.; Moudrý, J.; Perná, K.; Murindangabo, Y.T. The Impact of Pyrolysis Temperature on Biochar Properties and Its Effects on Soil Hydrological Properties. Sustainability 2022, 14, 14722. [Google Scholar] [CrossRef]
- Joseph, S.; Cowie, A.L.; Van Zwieten, L.; Bolan, N.; Budai, A.; Buss, W.; Cayuela, M.L.; Graber, E.R.; Ippolito, J.A.; Kuzyakov, Y.; et al. How biochar works, and when it doesn’t: A review of mechanisms controlling soil and plant responses to biochar. GCB Bioenergy 2021, 13, 1731–1764. [Google Scholar] [CrossRef]
- Safari, S.; Nazari, F.; Vafaee, Y.; da Silva, J.A.T. Impact of Rice Husk Biochar on Drought Stress Tolerance in Perennial Ryegrass (Lolium perenne L.). J. Plant Growth Regul. 2022, 42, 810–826. [Google Scholar] [CrossRef]
- Ghosh, A.K.; Ishijiki, K.; Toyota, M.; Kusutani, A.; Asanuma, K. Water Potential, Stomatal Dimension and Leaf Gas Exchange in Soybean Plants under Long-term Moisture Deficit. Jpn. J. Trop. Agric. 2000, 44, 30–37. [Google Scholar] [CrossRef]
- Yang, A.; Akhtar, S.S.; Li, L.; Fu, Q.; Li, Q.; Naeem, M.A.; He, X.; Zhang, Z.; Jacobsen, S.-E. Biochar Mitigates Combined Effects of Drought and Salinity Stress in Quinoa. Agronomy 2020, 10, 912. [Google Scholar] [CrossRef]
- Sakaoka, S.; Mabuchi, K.; Morikami, A.; Tsukagoshi, H. MYB30 regulates root cell elongation under abscisic acid signaling. Commun. Integr. Biol. 2018, 11, e1526604. [Google Scholar] [CrossRef]
- Shokat, S.; Großkinsky, D.K.; Liu, F. Impact of elevated CO2 on two contrasting wheat genotypes exposed to intermediate drought stress at anthesis. J. Agron. Crop. Sci. 2020, 207, 20–33. [Google Scholar] [CrossRef]
- Akhtar, S.S.; Andersen, M.N.; Liu, F. Biochar Mitigates Salinity Stress in Potato. J. Agron. Crop. Sci. 2015, 201, 368–378. [Google Scholar] [CrossRef]
- Mickelbart, M.V.; Hasegawa, P.M.; Bailey-Serres, J. Genetic mechanisms of abiotic stress tolerance that translate to crop yield stability. Nat. Rev. Genet. 2015, 16, 237–251. [Google Scholar] [CrossRef] [PubMed]
- Wilkinson, S.; Davies, W.J. ABA-based chemical signalling: The co-ordination of responses to stress in plants. Plant Cell Environ. 2002, 25, 195–210. [Google Scholar] [CrossRef] [PubMed]
- Guo, L.; Bornø, M.L.; Niu, W.; Liu, F. Biochar amendment improves shoot biomass of tomato seedlings and sustains water relations and leaf gas exchange rates under different irrigation and nitrogen regimes. Agric. Water Manag. 2020, 245, 106580. [Google Scholar] [CrossRef]
- Nikpour-Rashidabad, N.; Tavasolee, A.; Torabian, S.; Farhangi-Abriz, S. The effect of biochar on the physiological, morphological and anatomical characteristics of mung bean roots after exposure to salt stress. Arch. Biol. Sci. 2019, 71, 321–327. [Google Scholar] [CrossRef] [Green Version]
- Rezaie, N.; Razzaghi, F.; Sepaskhah, A.R. Different Levels of Irrigation Water Salinity and Biochar Influence on Faba Bean Yield, Water Productivity, and Ions Uptake. Commun. Soil Sci. Plant Anal. 2019, 50, 611–626. [Google Scholar] [CrossRef]
- She, D.; Sun, X.; Gamareldawla, A.H.D.; Nazar, E.A.; Hu, W.; Edith, K.; Yu, S. Benefits of soil biochar amendments to tomato growth under saline water irrigation. Sci. Rep. 2018, 8, 14743. [Google Scholar] [CrossRef] [Green Version]
- Natasha, N.; Shahid, M.; Khalid, S.; Bibi, I.; Naeem, M.A.; Niazi, N.K.; Tack, F.M.G.; Ippolito, J.A.; Rinklebe, J. Influence of biochar on trace element uptake, toxicity and detoxification in plants and associated health risks: A critical review. Crit. Rev. Environ. Sci. Technol. 2022, 52, 2803–2843. [Google Scholar] [CrossRef]
- Gullap, M.K.; Severoglu, S.; Karabacak, T.; Yazici, A.; Ekinci, M.; Turan, M.; Yildirim, E. Biochar derived from hazelnut shells mitigates the impact of drought stress on soybean seedlings. N. Z. J. Crop. Hortic. Sci. 2022, 1–19. [Google Scholar] [CrossRef]
- Sattar, A.; Sher, A.; Ijaz, M.; Irfan, M.; Butt, M.; Abbas, T.; Hussain, S.; Abbas, A.; Ullah, M.S.; Cheema, M.A. Biochar Application Improves the Drought Tolerance in Maize Seedlings. Phyton 2019, 88, 379–388. [Google Scholar] [CrossRef] [Green Version]
- Yildirim, E.; Ekinci, M.; Turan, M. Impact of Biochar in Mitigating the Negative Effect of Drought Stress on Cabbage Seedlings. J. Soil Sci. Plant Nutr. 2021, 21, 2297–2309. [Google Scholar] [CrossRef]
- Ghorbani, M.; Konvalina, P.; Neugschwandtner, R.W.; Kopecký, M.; Amirahmadi, E.; Moudrý, J., Jr.; Menšík, L. Preliminary Findings on Cadmium Bioaccumulation and Photosynthesis in Rice (Oryza sativa L.) and Maize (Zea mays L.) Using Biochar Made from C3- and C4-Originated Straw. Plants 2022, 11, 1424. [Google Scholar] [CrossRef] [PubMed]
- Kul, R.; Arjumend, T.; Ekinci, M.; Yildirim, E.; Turan, M.; Argin, S. Biochar as an organic soil conditioner for mitigating salinity stress in tomato. Soil Sci. Plant Nutr. 2021, 67, 693–706. [Google Scholar] [CrossRef]


| WB | PB | |
|---|---|---|
| EC (µS/cm) | – | 2650 |
| pH (in CaCl2) | 8.6 | 10.1 |
| C (%) | – | 67.6 |
| N (%) | – | 2.9 |
| P (%) | – | 1 |
| K (%) | – | 3 |
| Surface area (m2/g) | 369 | 117 |
| Total ash (%) | 1.25 | 22.2 |
| Volatile matter | 4 | 6.2 |
| C stability (%) | 36 | 44.3 |
| Bulk density (g/cm3) | 0.150 | 0.362 |
| B | W | S | B × W | B × S | W × S | B × W × S | |
|---|---|---|---|---|---|---|---|
| H/cm | ns | ** | ** | ns | ns | ns | ns |
| DM (g) | ** | ** | ** | ns | ns | ns | ns |
| DR (g) | ** | ** | ** | ** | ** | ns | ns |
| DL (g) | ** | ** | ** | ns | ns | ns | ns |
| Rrs | ** | ns | ns | ns | ** | ns | ns |
| SLA (g·cm−2) | ** | * | ns | ns | ns | ns | ns |
| B | W | S | B × W | B × S | W × S | B × W × S | |
|---|---|---|---|---|---|---|---|
| An | * | ns | ns | ns | * | ns | ns |
| Tr | ns | ** | ns | ns | ** | ns | ns |
| gs | ns | * | ns | ns | * | ns | ns |
| Ci | ns | ns | ns | ns | ns | ns | ns |
| Parameters | Biochar Treatment | F | D | ANOVA | ||||||||||
|---|---|---|---|---|---|---|---|---|---|---|---|---|---|---|
| 0 | 100 mmol/L | 200 mmol/L | 0 | 100 mmol/L | 200 mmol/L | B | W | S | B × W | B × S | W × S | B × W × S | ||
| LRWC (%) | CK | 88.08 ± 1.02 | 75.46 ± 0.87 | 70.43 ± 1.13 | 83.35 ± 1.78 | 72.89 ± 3.40 | 61.65 ± 2.14 | ** | ** | ** | * | ** | ** | ns |
| WB | 88.97 ± 0.87 | 90.18 ± 3.25 | 82.84 ± 0.20 | 82.38 ± 1.27 | 77.39 ± 3.24 | 64.81 ± 1.73 | ||||||||
| PB | 89.63 ± 3.25 | 82.67 ± 1.40 | 73.39 ± 8.60 | 81.80 ± 3.13 | 79.96 ± 9.67 | 63.79 ± 8.08 | ||||||||
| RWP (–MPa) | CK | 0.23 ± 0.13 | 0.25 ± 0.06 | 0.42 ± 0.08 | 0.28 ± 0.03 | 0.35 ± 0.08 | 0.52 ± 0.14 | ** | ** | ** | ns | ns | ns | ns |
| WB | 0.23 ± 0.13 | 0.22 ± 0.15 | 0.37 ± 0.09 | 0.25 ± 0.08 | 0.23 ± 0.03 | 0.43 ± 0.04 | ||||||||
| PB | 0.10 ± 0.06 | 0.06 ± 0.02 | 0.19 ± 0.08 | 0.21 ± 0.09 | 0.33 ± 0.07 | 0.47 ± 0.03 | ||||||||
| LWP (–MPa) | CK | 0.33 ± 0.16 | 0.48 ± 0.05 | 0.50 ± 0.06 | 0.57 ± 0.01 | 0.59 ± 0.04 | 0.63 ± 0.34 | ns | ** | ns | ns | ns | ns | * |
| WB | 0.47 ± 0.06 | 0.33 ± 0.04 | 0.31 ± 0.03 | 0.59 ± 0.03 | 0.58 ± 0.09 | 0.69 ± 0.22 | ||||||||
| PB | 0.47 ± 0.03 | 0.44 ± 0.07 | 0.49 ± 0.06 | 0.64 ± 0.07 | 0.50 ± 0.06 | 0.45 ± 0.21 | ||||||||
| OP (–MPa) | CK | 0.64 ± 0.17 | 0.88 ± 0.06 | 1.06 ± 0.01 | 0.83 ± 0.06 | 1.05 ± 0.28 | 1.10 ± 0.16 | * | ns | ** | ns | ns | ns | ns |
| WB | 0.57 ± 0.22 | 0.71 ± 0.11 | 0.92 ± 0.26 | 0.74 ± 0.07 | 0.70 ± 0.32 | 1.07 ± 0.21 | ||||||||
| PB | 0.51 ± 0.28 | 0.69 ± 0.37 | 0.82 ± 0.12 | 0.80 ± 0.20 | 0.55 ± 0.34 | 1.09 ± 0.23 | ||||||||
| Parameters | Biochar Treatment | F | D | ANOVA | ||||||||||
|---|---|---|---|---|---|---|---|---|---|---|---|---|---|---|
| 0 | 100 | 200 | 0 | 100 | 200 | B | W | S | B × W | B × S | W × S | B × W × S | ||
| LABA (ng/g FW) | CK | 2263 ± 355 | 1971 ± 597 | 1394 ± 185 | 2298 ± 769 | 1627 ± 746 | 1609 ± 705 | *** | ns | ns | ns | * | ns | ns |
| WB | 1330 ± 058 | 1536 ± 256 | 1511 ± 139 | 1324 ± 496 | 1621 ± 438 | 1394 ± 097 | ||||||||
| PB | 1411 ± 268 | 1106 ± 086 | 1341 ± 102 | 1037 ± 479 | 997 ± 176 | 1039 ± 245 | ||||||||
| XABA (pmol/mL) | CK | 355 ± 05 | 411 ± 40 | 547 ± 43 | 653 ± 32 | 578 ± 33 | 1181 ± 216 | *** | * | ns | *** | ** | ns | * |
| WB | 268 ± 14 | 348 ± 37 | 528 ± 26 | 555 ± 26 | 567 ± 43 | 1841 ± 145 | ||||||||
| PB | 119 ± 25 | 284 ± 41 | 373 ± 36 | 451 ± 16 | 376 ± 44 | 695 ± 023 | ||||||||
| B | W | S | B × W | B × S | W × S | B × W × S | |
|---|---|---|---|---|---|---|---|
| Water consumption | *** | *** | *** | ns | * | ns | ns |
| WUE | * | ns | *** | ns | ** | ns | ns |
| iWUE | ns | ns | * | * | ns | ns | ns |
Disclaimer/Publisher’s Note: The statements, opinions and data contained in all publications are solely those of the individual author(s) and contributor(s) and not of MDPI and/or the editor(s). MDPI and/or the editor(s) disclaim responsibility for any injury to people or property resulting from any ideas, methods, instructions or products referred to in the content. |
© 2023 by the authors. Licensee MDPI, Basel, Switzerland. This article is an open access article distributed under the terms and conditions of the Creative Commons Attribution (CC BY) license (https://creativecommons.org/licenses/by/4.0/).
Share and Cite
Zhang, W.; Wei, J.; Guo, L.; Fang, H.; Liu, X.; Liang, K.; Niu, W.; Liu, F.; Siddique, K.H.M. Effects of Two Biochar Types on Mitigating Drought and Salt Stress in Tomato Seedlings. Agronomy 2023, 13, 1039. https://0-doi-org.brum.beds.ac.uk/10.3390/agronomy13041039
Zhang W, Wei J, Guo L, Fang H, Liu X, Liang K, Niu W, Liu F, Siddique KHM. Effects of Two Biochar Types on Mitigating Drought and Salt Stress in Tomato Seedlings. Agronomy. 2023; 13(4):1039. https://0-doi-org.brum.beds.ac.uk/10.3390/agronomy13041039
Chicago/Turabian StyleZhang, Wenqian, Jiahua Wei, Lili Guo, Heng Fang, Xiaojuan Liu, Kehao Liang, Wenquan Niu, Fulai Liu, and Kadambot H. M. Siddique. 2023. "Effects of Two Biochar Types on Mitigating Drought and Salt Stress in Tomato Seedlings" Agronomy 13, no. 4: 1039. https://0-doi-org.brum.beds.ac.uk/10.3390/agronomy13041039