Article

Effect of Branch Bending on the Canopy Characteristics and Growth of Peach (Prunus persica (L.) Batsch)

College of Horticulture Science and Engineering, Shandong Agricultural University, Taian 271018, China
*
Authors to whom correspondence should be addressed.
These authors contributed equally to this work.
Submission received: 8 March 2023 / Revised: 29 March 2023 / Accepted: 30 March 2023 / Published: 5 April 2023
(This article belongs to the Collection Crop Physiology and Stress)

Abstract

:
A reasonable main branch opening angle can improve the canopy light environment of a tree, change the direction of nutrient transport, and promote the formation of flower buds. In this experiment, 3-year-old ‘Lu Hong 618’ was used as the test material to study the effects of different main branch opening angles (three treatments: 45°, 65°, and 85°) on the canopy light distribution, canopy characteristics, fruit quality, and flower bud quality of ‘Y’-shaped peach trees. The main findings were as follows: the solar energy utilization in the canopy varied greatly between different main branch opening angles, with the best relative light intensity of the canopy at 85°. In addition, the canopy light distribution on photosynthesis was more reasonable at 85°, and the daily variation range of CO2 concentration in the inner canopy was the greatest, which facilitated ventilation and light penetration in the inner canopy. With the increase in the main branch opening angle, the new growth of peach trees and the growth of the main branch trunk were inhibited. A reasonable branch opening angle results in good branch structure and leaf morphology. Leaf stomatal morphology and the soluble sugar and starch contents at different levels of the canopy are influenced by canopy light, and higher levels of canopy light can significantly increase the stomatal size and improve the leaf photosynthetic capacity, SPAD value, and soluble sugar and starch contents. With the increase in the main branch opening angle, C/N tended to increase. In addition, the distribution pattern of fruit quality in the canopy was similar to that of light distribution. In the same fruiting part, the fruit quality was higher at 85° and 45° than at 65° and slightly higher at 85° than at 45°, but the difference was not significant. The effects of different main branch opening angle treatments on the fruit weight, flesh firmness, soluble solids, and titratable acid were more significant. The 85° pulling angle effectively increased the light intensity of the different canopy layers of the peach trees and promoted the accumulation of nutrients. An 85° pulling angle can be used as a more suitable pulling angle for peach tree shaping cultivation.

1. Introduction

Peach (Prunus persica (L.) Batsch) is a large-growing, heliophilous plant, but its effective economic cultivation period is short, so it is important to improve the yield and economic efficiency of peach trees per unit area [1,2]. In the context of rapid economic development, in order to save human, financial, and material resources in orchard management and to reduce labor costs to achieve high-quality and efficient production, orchard production and management modes have begun to change, and dwarf anvil dense planting has gradually become the mainstream. Driven by this cultivation mode, the traditional branch bending angle pruning technique has become more widely adopted [3,4,5]. Many horticultural experts in China and overseas have studied the effect of changes in a tree shape on fruit products [6,7,8,9,10,11,12].
The bending of branches is a practical way to reduce nutrient growth and enhance light interception in the canopy, thus improving fruit yield and quality [13,14]. In ‘Fuji’ apple trees, the bending of branches at a wide angle, especially at 135° to the central branch, increases the number of buds. In one study, branches were bent at an angle of 120°–150° relative to the central branch of each apple tree during the dormant season to assess tree growth and fruit productivity [15]. In other studies, the optimum bending angle of 90° for ‘Gala’ and 110° for ‘Fuji’ apples effectively increased the flower bud yield and C/N ratio, while the N content decreased with an increasing bending angle and also had a significant effect on endogenous plant hormones [16,17]. Tree structure and efficient management can also improve fruit quality and yield; these factors are related to light interception and also directly affect branch density and spatial distribution [18,19]. The spatial distribution of the canopy structure within the canopy includes horizontal structure and vertical structure. The horizontal structure usually has a significant effect on the fruit quality of the inner and outer canopy development [20,21]. For example, a good canopy structure can intercept high levels of light and increase apple tree productivity [22,23].
A reasonable opening angle of the main branches can improve the lighting conditions of the tree body, inhibit the growth of branches, change the direction of nutrient transport, affect the distribution and balance of endogenous substances such as hormones, and promote the formation of flower buds. However, the effects of different main branch opening angles on the canopy characteristics, light distribution, branch bud characteristics, and fruit quality of ‘Y’-shaped peach trees have rarely been reported. In this experiment, 3-year-old ‘Luhong 618’ was used as the test material to study the effects of different main branch opening angles on the canopy light distribution, canopy characteristics, fruit quality, flower bud quality, etc., of ‘Y’-shaped peach trees and to explore the optimal main branch opening angle, with a view to providing a theoretical basis for production practice.

2. Materials and Methods

2.1. Experimental Materials

This experiment was carried out at the Shandong Agricultural University experimental base, located in Tai’an city, Shandong Province, China (36°17′7459″ N, 117°16′7712″ E), in 2021. The test variety was ‘Lu Hong 618’, and the orchard soil was brown loam. The basic physical and chemical properties of the soil were as follows: alkaline nitrogen content, 79.98 mg/kg; fast-acting phosphorus content, 56.38 mg/kg; effective potassium content, 82.73 mg/kg; and organic matter content, 1.72 g/kg. The tree shape was a ‘Y’ shape, the tree was 3 years old, and the orchard spacing was 2 m × 5 m, with a north–south row direction. Normal management was undertaken in the field.

2.2. Experimental Design

We selected 15 three-year-old peach trees with roughly the same tree body indicators. We pulled the main branches to 45°, 65°, and 85° before flowering in March 2021. We divided the tree body into three parts: upper (UP), middle (MID), and lower (LOW), in the vertical direction. Single plant plots with five replications per treatment were used. When thinning the fruit during the young fruit stage, we ensured that the load of each peach tree was the same and would not affect the quality of a single fruit too much, resulting in a low proportion of high-quality fruits; we also ensured the fruit was not too small to avoid the chance of incorrect test results and to reduce test errors.

2.3. Determination of Flower Bud Quality

We collected full flower buds from the middle and periphery of the tree body, put them in a centrifuge tube, and quickly transported them to the laboratory. We then placed them in a 75 °C oven to dry to a constant weight. The dried sample was ground and crushed in a mortar. The H2SO4-H2O2 combined decoction method was used to decoct the sample, and after cooling, the capacity was fixed to a 50 mL volumetric bottle. The phosphorus content of the decocting solution was determined using the molybdenum blue colorimetric method. We placed 0.5 mL of the solution to be tested in a 10 mL centrifuge tube and then added 4.5 mL of deionized water and 5 mL of fixed phosphorus reagent. We sealed and mixed the solution well, kept it at 45 °C for 25 min, and then performed colorimetric analysis at a wavelength of 823 nm. The potassium content was measured using a flame spectrophotometer. We used a TOC/TN analyzer (Analytik Jena, German) to determine the total nitrogen and carbon contents.

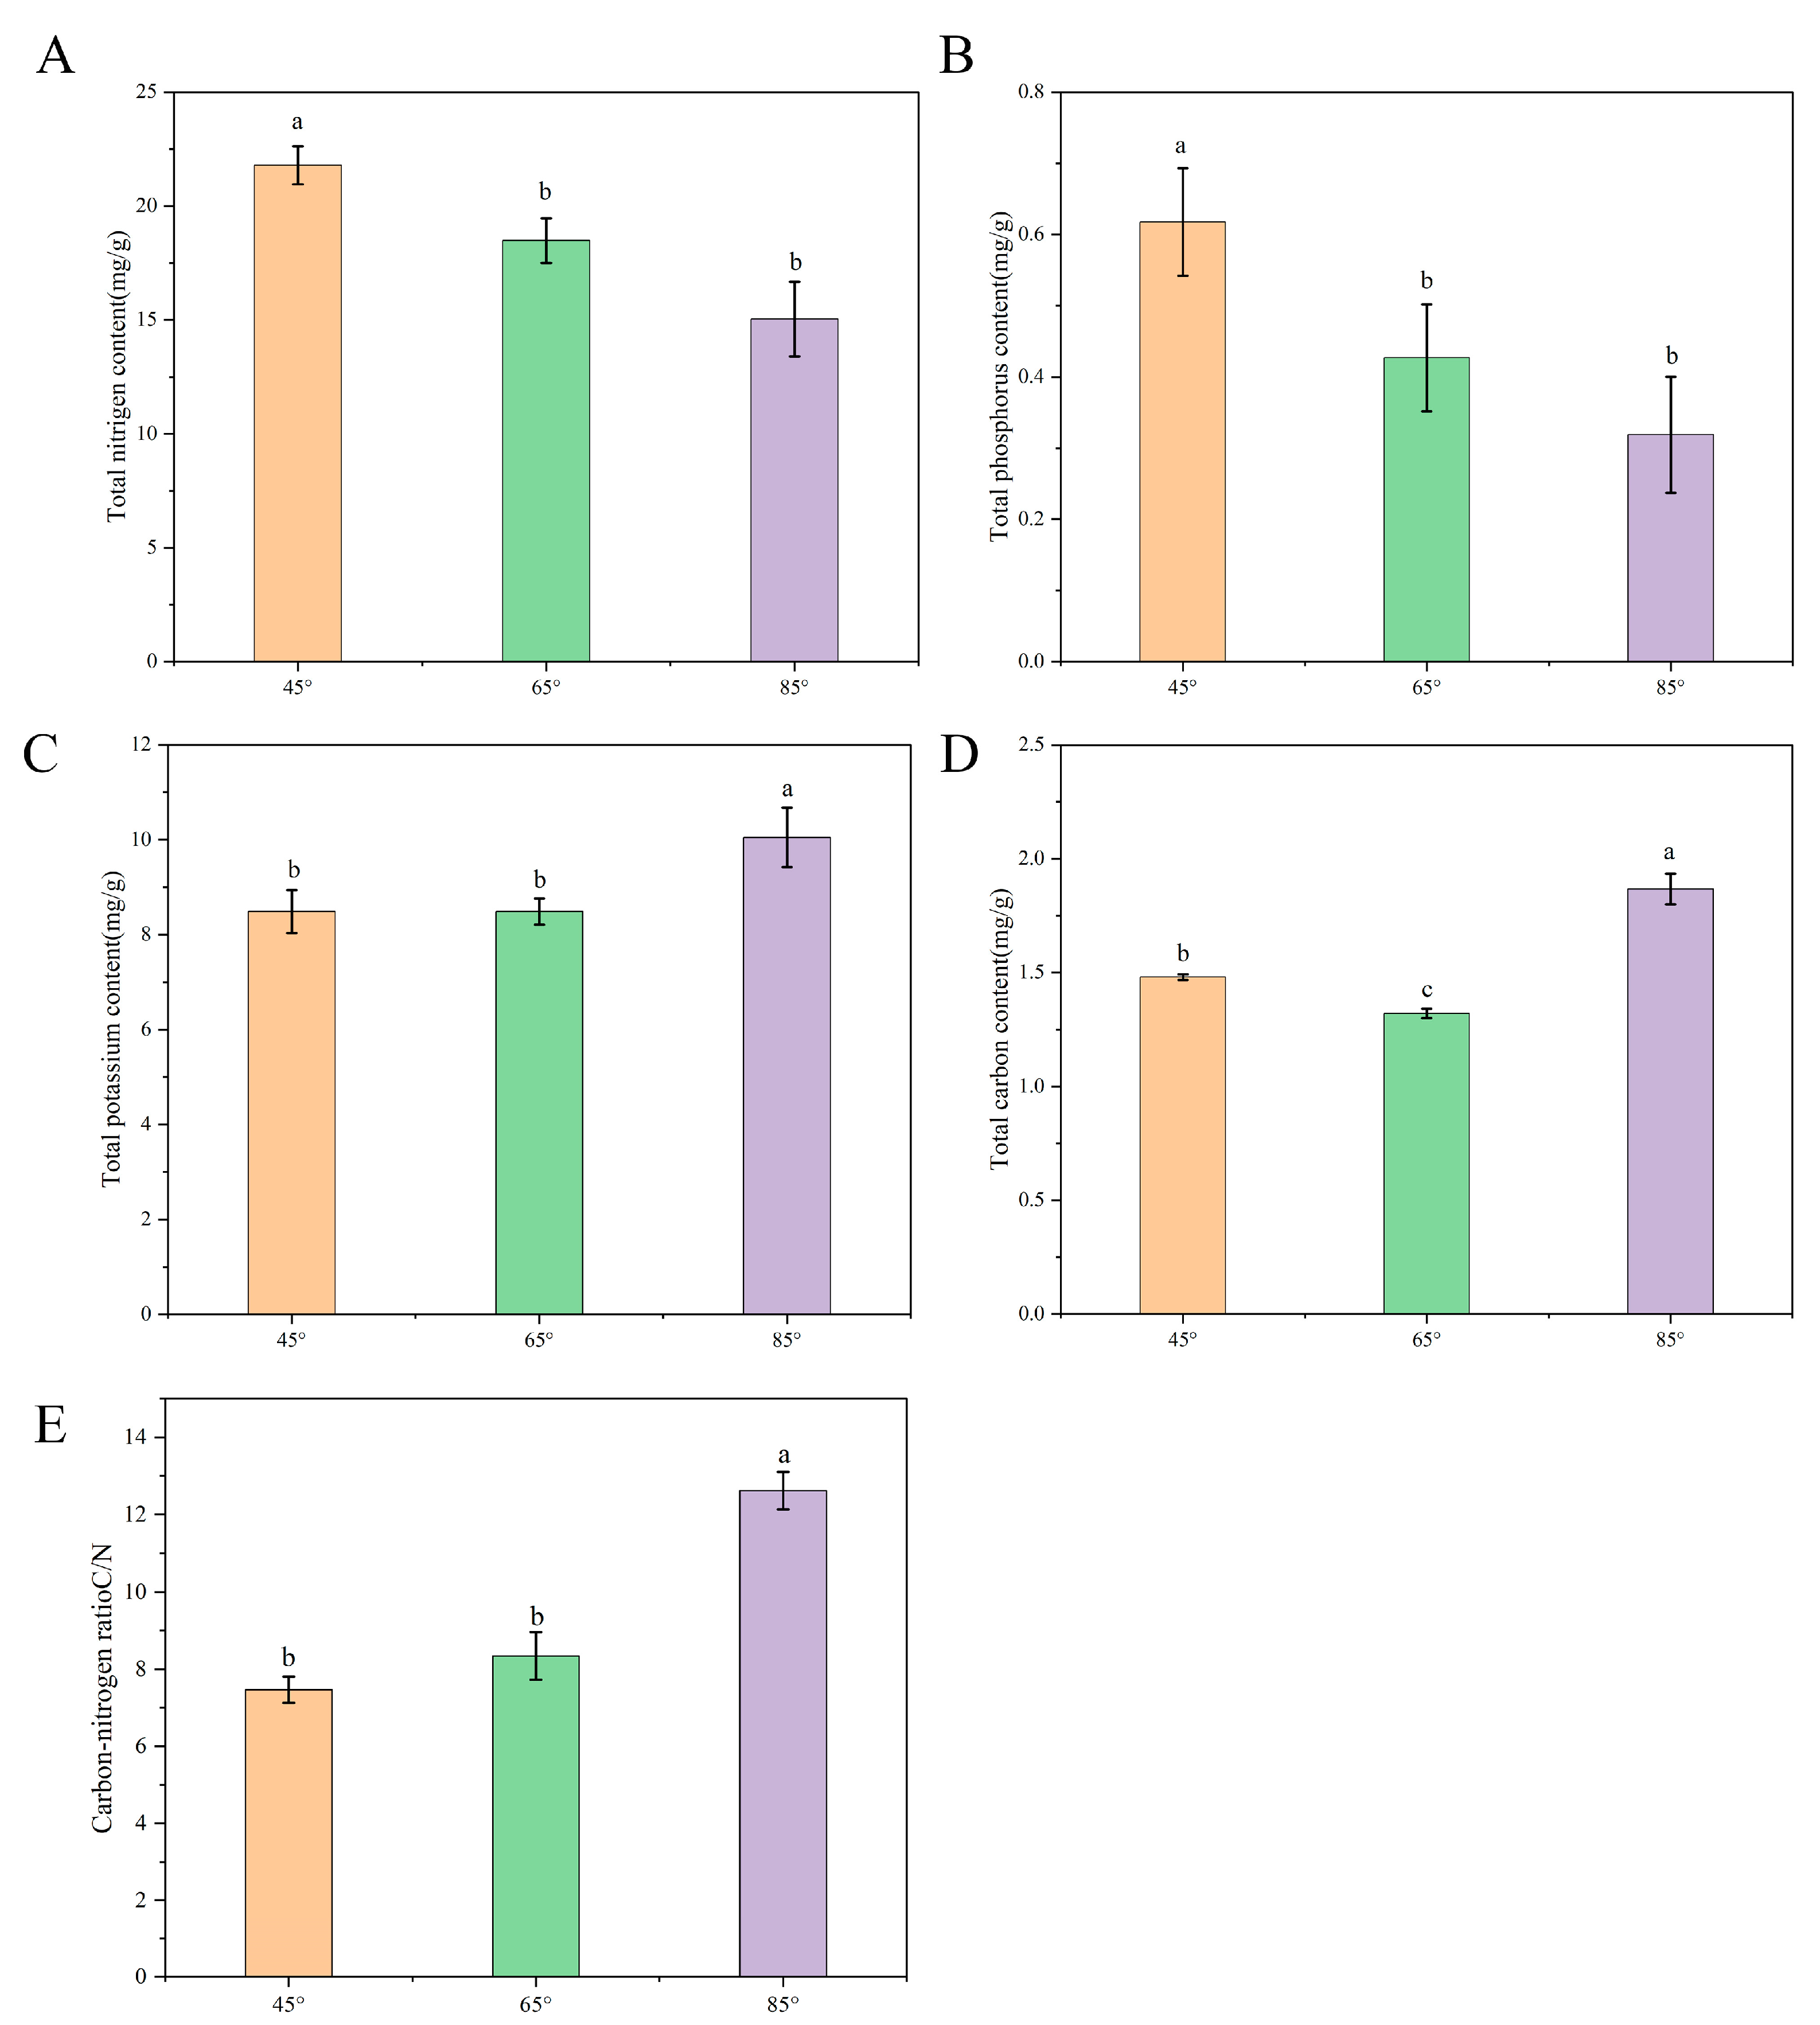
2.4. Determination of the Leaf Photosynthetic Rate and Nutrients

The photosynthetic rate (Pn) was measured using a portable photosynthesis system (Ciras-3, PP SYSTEMS, Madison, WI, USA); with the use of the SPAD-502 Plus chlorophyll analyzer, we selected functional leaves that were fully developed in different parts of different treatments for measurement. The measurements were taken between 10:50 and 11:10 in the morning. Leaves from different parts of different treatments were picked in September, and then samples (2 g) were accurately weighed, ground until crushed, and homogenized in 10 mL of 70% ethanol. The samples were centrifuged at 24,150 g for 10 min. Soluble sugars were determined using the supernatant, and starch was determined using the residue. The soluble sugar content was determined as follows: we absorbed 0.5 mL of sample extract and added 0.5 mL of anthrone-ethyl acetate reagent and 5 mL of concentrated sulfuric acid. After full shaking, we put the sample in a boiling water bath and kept it warm for 1 min. After removal and cooling to room temperature, the absorbance value of the solution was measured at a wavelength of 630 nm. The starch content was determined as follows: we transferred the residue to a 50 mL volumetric bottle, added 10 mL of hot deionized water, put the solution in a boiling water bath for 15 min, and then added 2 mL of 9.2 mol/L perchloric acid. Extraction was performed for 15 min, followed by filtering with filter paper after cooling and adding deionized water to the volume. We withdrew 0.5 mL of sample extract, added it to the scale test tube, and then added 1.5 mL of distilled water, 0.5 mL of anthrone-ethyl acetate reagent, and 5 mL of concentrated sulfuric acid. The sample was fully oscillated in a boiling water bath, kept warm for 1 min, and then cooled to room temperature. Colorimetric measurements were taken at a wavelength of 630 nm.

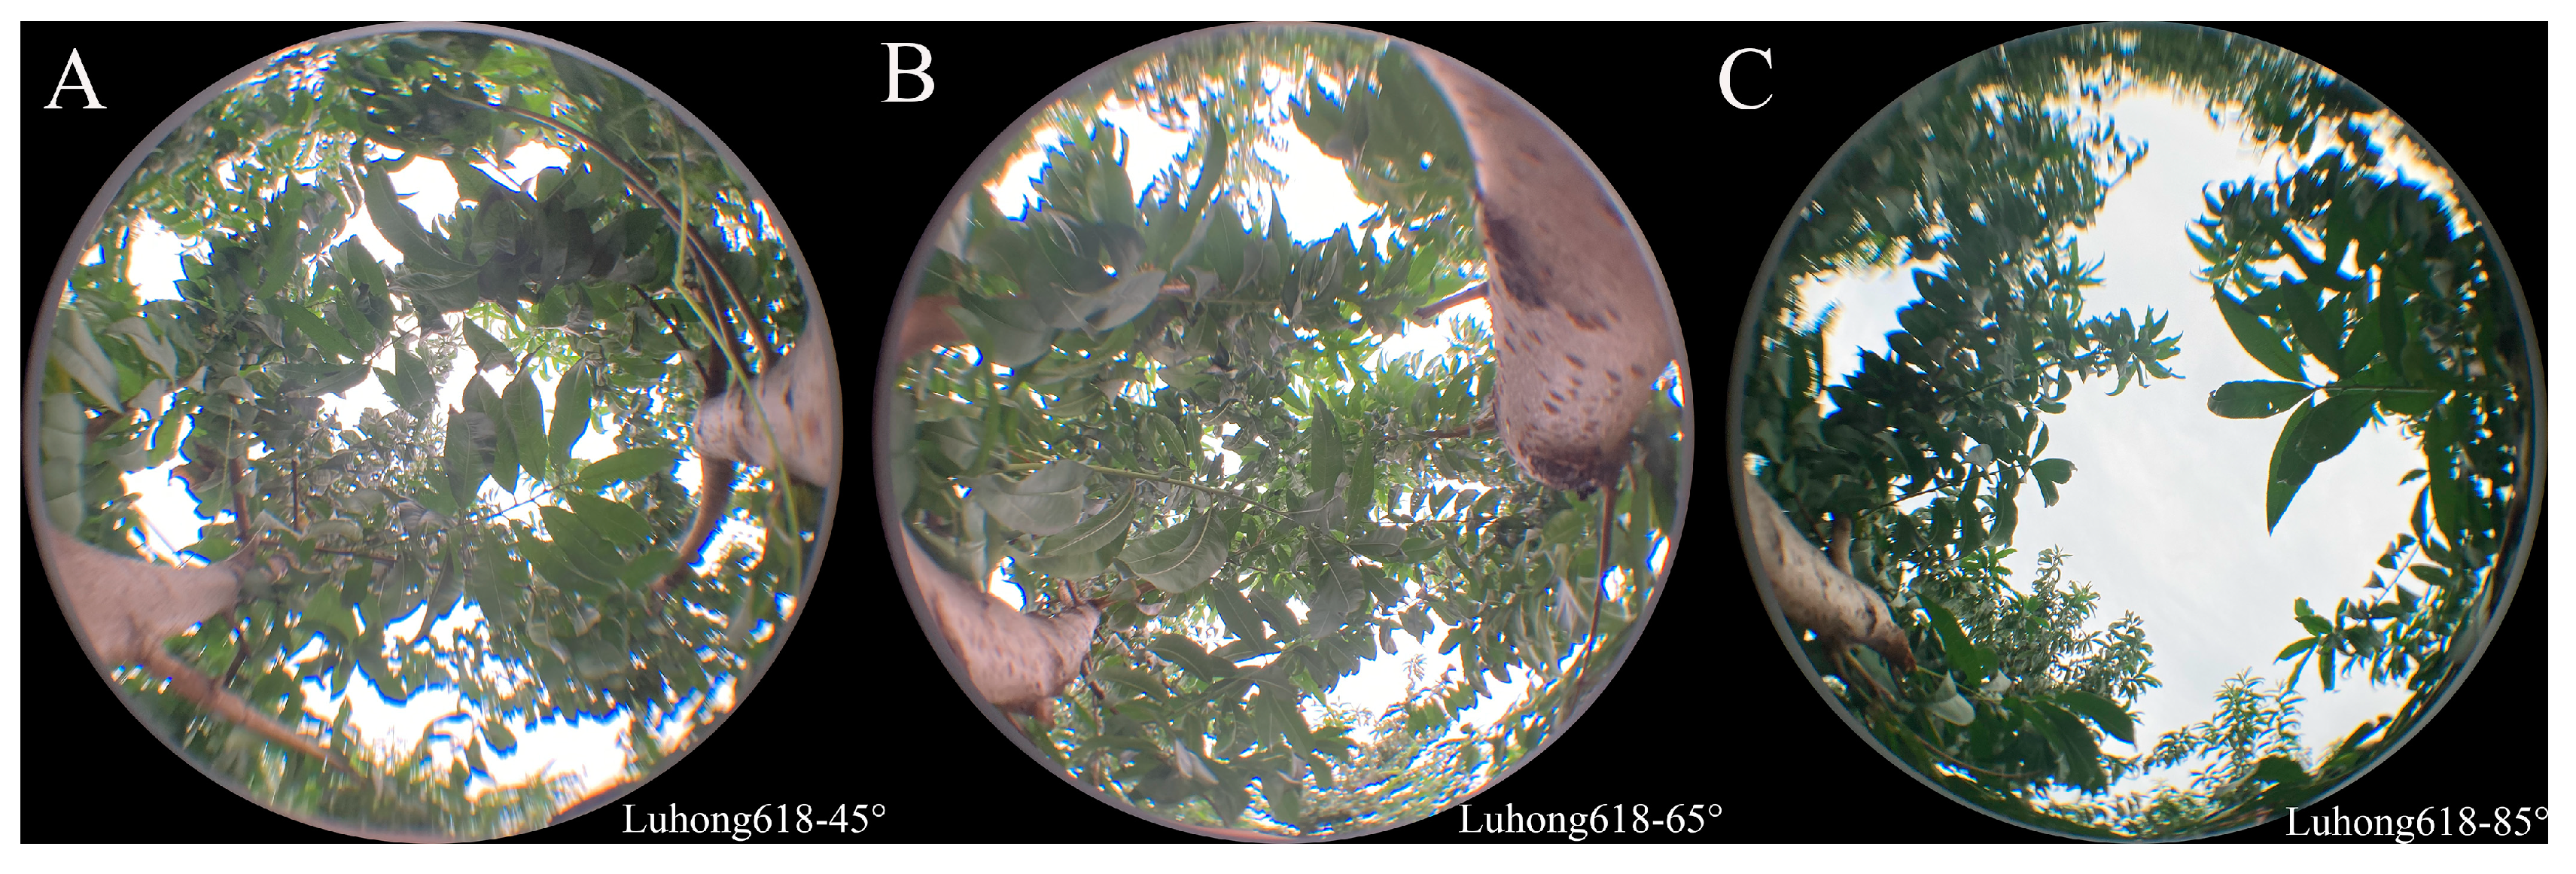
2.5. Measurement of the Canopy Light Intensity

We chose sunny and windless days in late June and late August and used the L99-LX illuminance recorder (Hangzhou Luge Technology Company, Hangzhou, China) at 9:00 in the morning to perform multi-point measurements on the upper, middle, and lower parts of the canopy of ‘Luhong 618’ to increase the measured sample points as much as possible and increase the amount of data to reflect the completeness and authenticity of the canopy lighting conditions. We obtained the real-time direct solar light intensity during the measurement process as a control; the relative light intensity was calculated as the measured value of the light intensity at a certain point divided by the direct solar light intensity. In August 2021, a cloudy day without wind was selected to photograph the distribution of branches and leaves in the inner chamber of the canopy. A camera (Canon EOS R6) equipped with a fisheye lens was placed 60 cm above the ground, and photographs were taken with the lens facing upward. The pictures obtained showed the distribution of branches and leaves in the canopy of the peach trees.

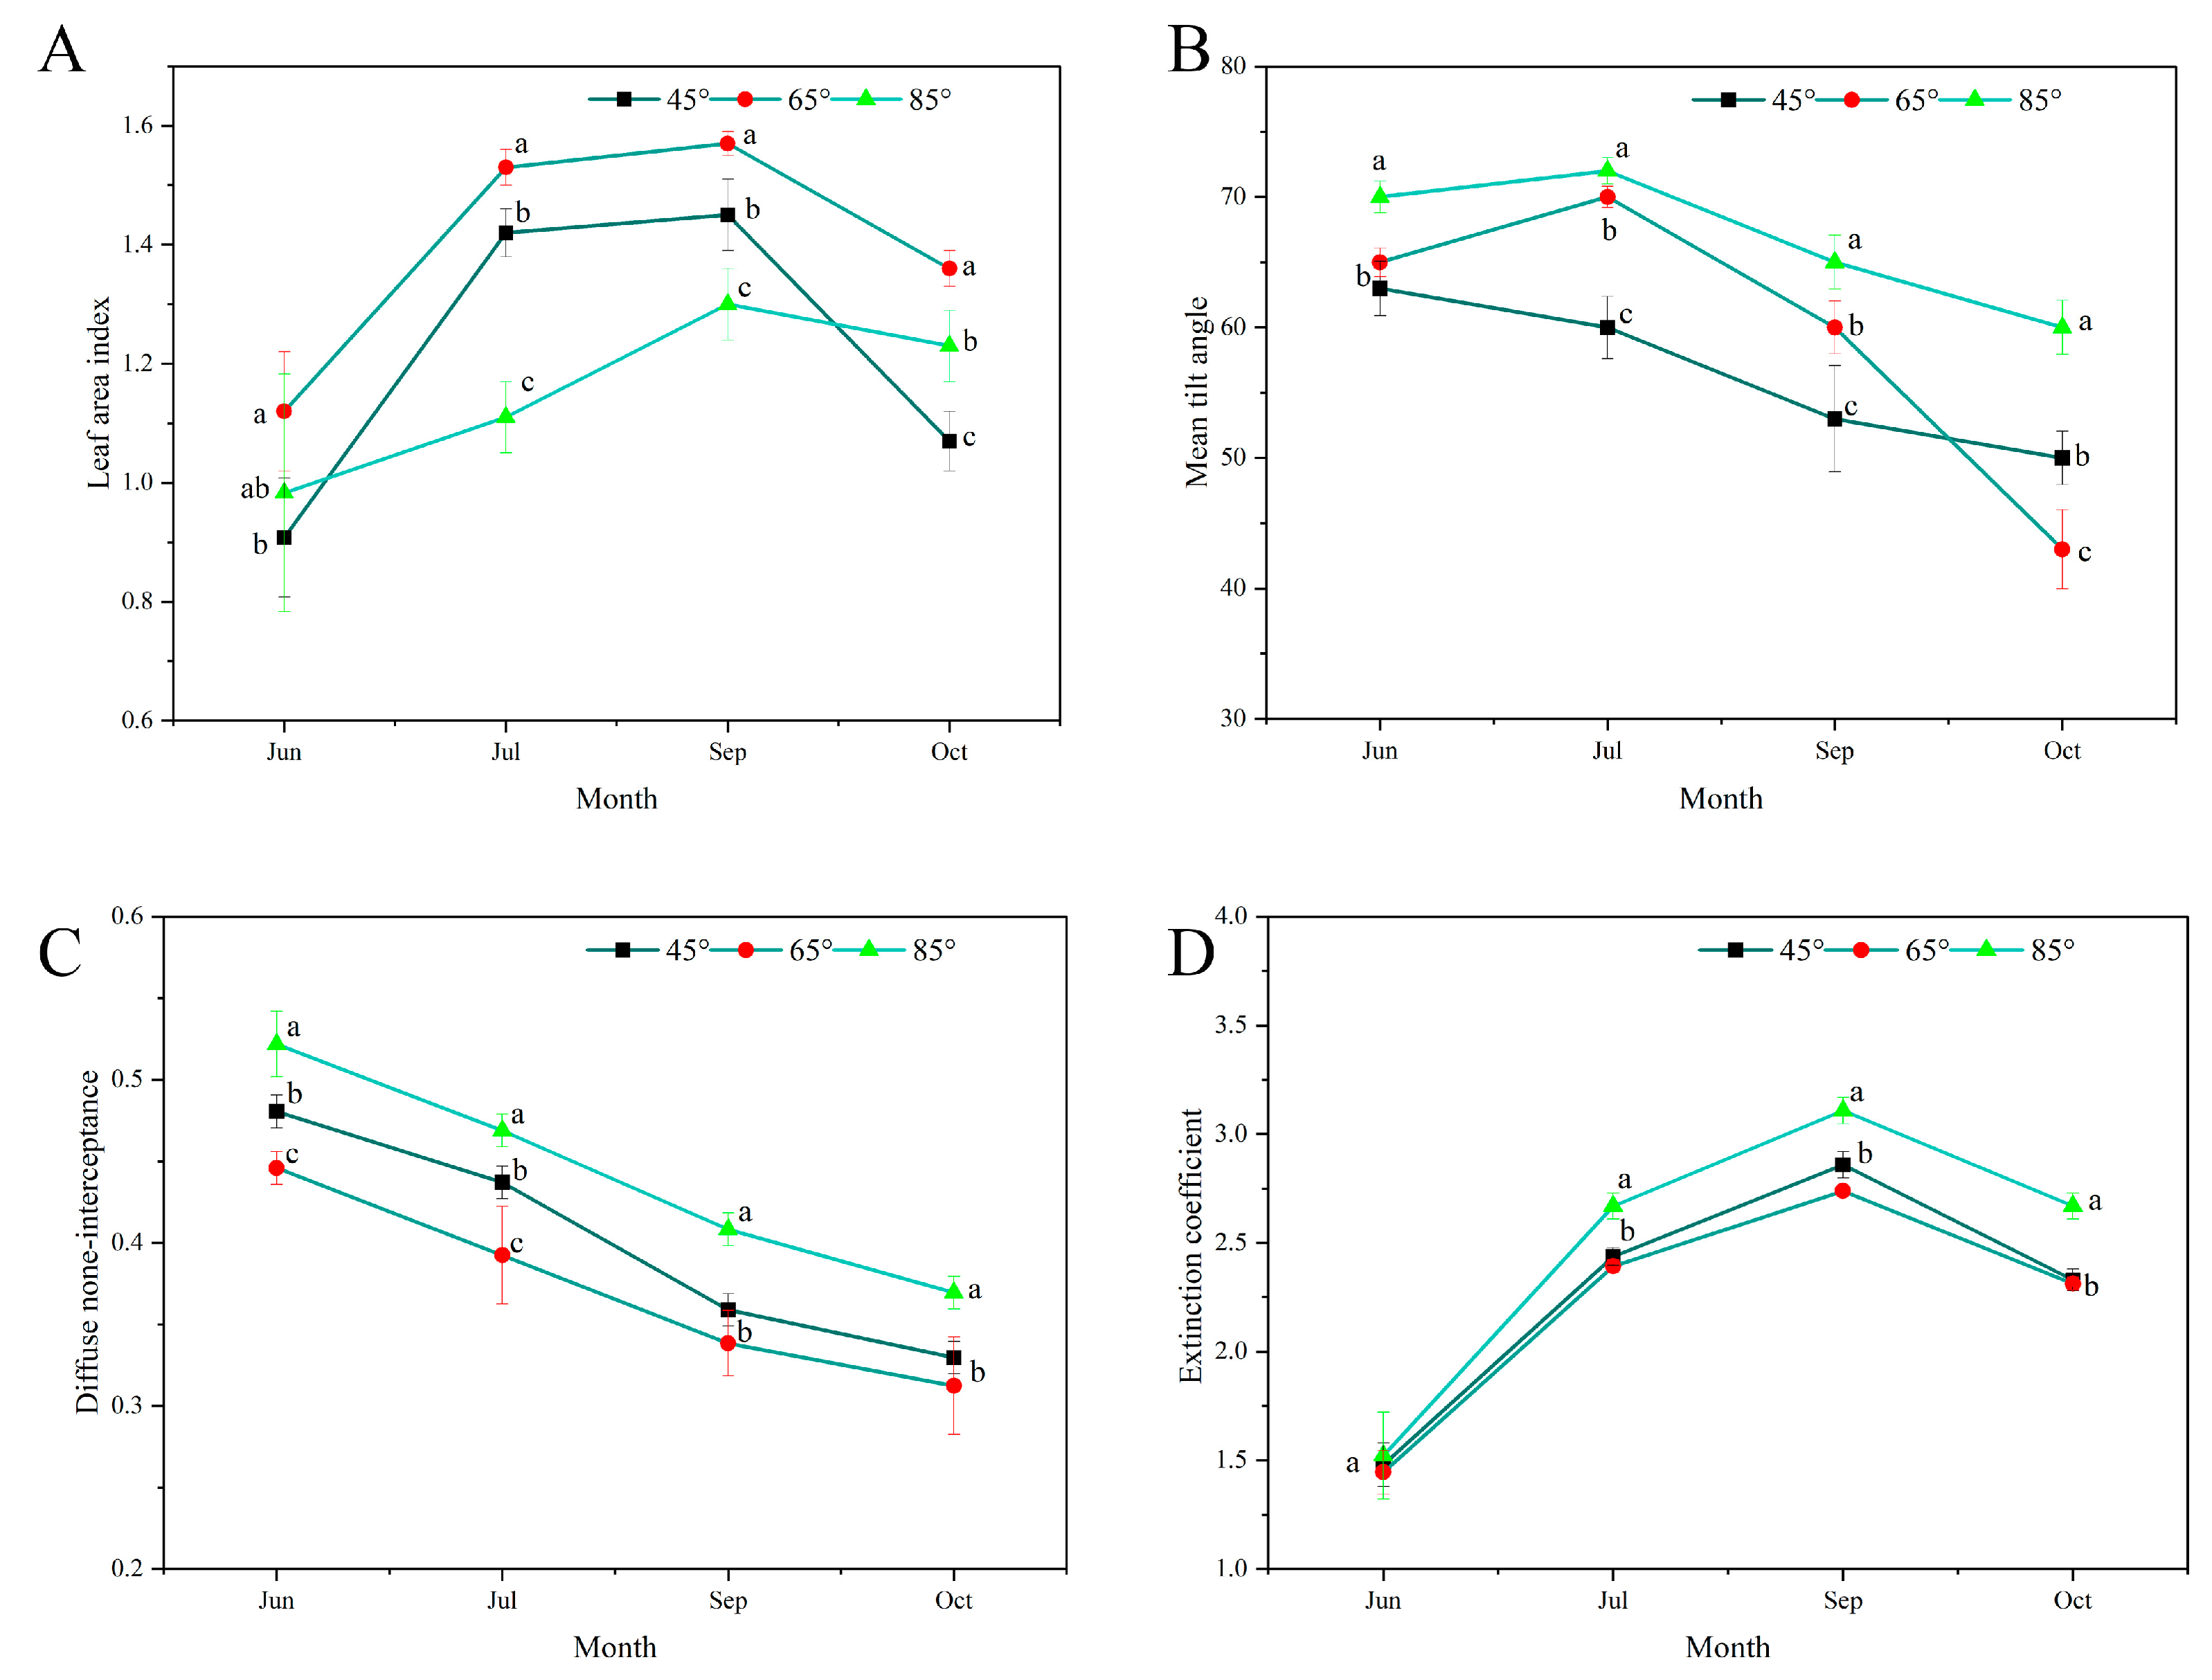
2.6. Measurement of Canopy Characteristics

The canopy characteristics of the tree body were measured using an LAI-2200 canopy analyzer (LI-COR, Lincoln, NE, USA). With the trunk as the center of the circle, we took point A 20 cm above the highest point in the center of the tree and point B at 0°, 120°, and 240° below the periphery of the canopy. We chose cloudy weather or evening for measurements from June to October 2021. The measurement parameters included LAI, MTA, and DIFN. Each process was repeated five times. We used Beer’s law to calculate the extinction coefficient k.
k = l n ( T P A R / P A R ) L A I
TPAR is the instantaneous photosynthetic effective radiation measured at the bottom of the canopy; PAR is the instantaneous photosynthetic effective radiation measured when the upper part of the canopy is unobstructed; LAI is the leaf area index of the tree canopy.

2.7. Stomatal Aperture Assay

We selected 3–5 fully developed and robust blades from different parts of different treatments for sampling. Pieces covered with nail polish were then placed on a microscope slide and examined with a fluorescence microscope (AXI0, Carl Zeiss, Germany) at 400× magnification. The pore area and pore circumference were measured using ImageJ image processing software (National Institutes of Health, Bethesda, MD, USA).

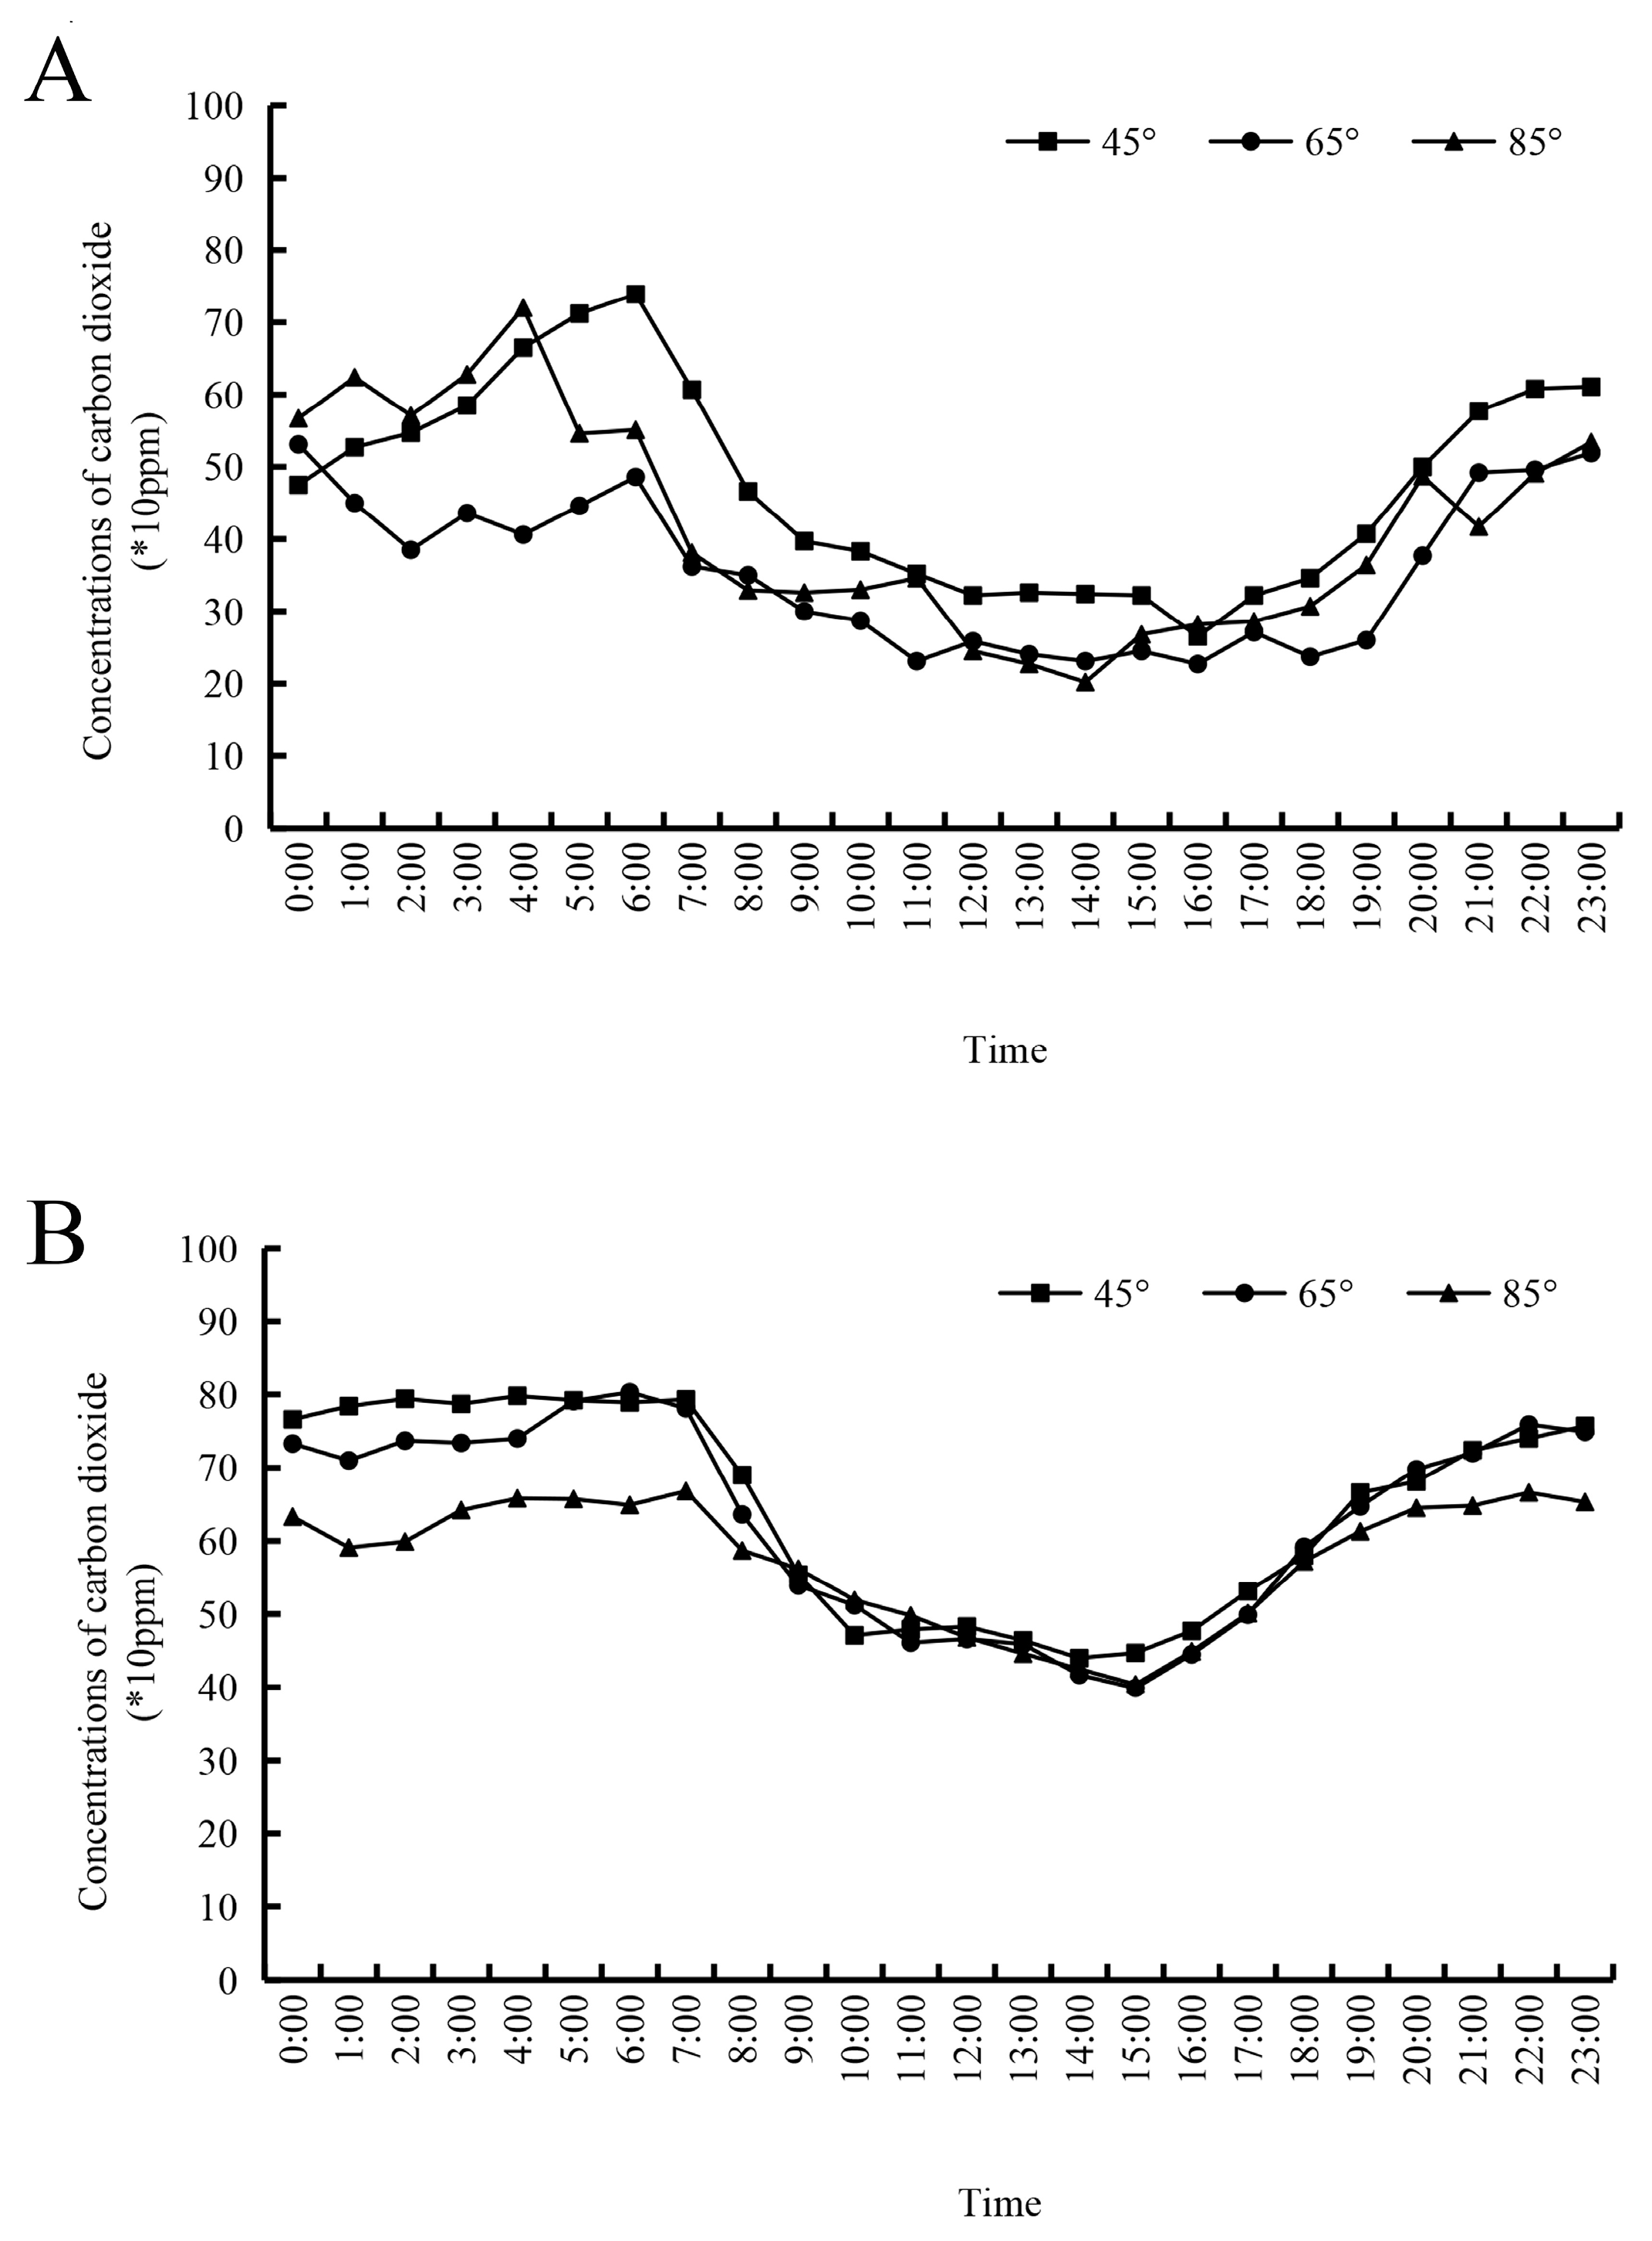
2.8. The Daily Change in the Carbon Dioxide Concentration in the Canopy during Different Seasons

An L99-CO2 carbon dioxide recorder (Hangzhou Luge Technology Company) was used to monitor the daily changes in the CO2 concentration inside the canopy of the tree. We chose sunny, windless, and dry weather in July and September and placed the carbon dioxide recorder in the middle and lower part of the main branch inside the canopy of ‘Luhong 618’; the instrument continued to monitor changes for at least 24 h.

2.9. Determination of the Growth of New Shoots and Main Branches

At the beginning of July, the periphery of the upper, middle, and lower parts of the ‘Luhong 618’ canopy was selected, and the robust new shoots with the same growth were marked with a tape measure. We measured the length of the marked new shoots at the end of August and calculated the growth of the new shoots. At the beginning of July, we selected 20 cm above the bifurcation of the main branch to mark and use as the circumference measurement point of the main branch; we selected the trunk area 40 cm above the ground to mark and use as the circumference measurement point of the trunk. The growth length of the main branch was measured and counted at the beginning of July, and the second measurement was made at the end of August. After all of the leaves of the tree body had fallen, we counted the number of long (30–60 cm), medium (10–30 cm), and short (5–10 cm) fruiting branches and the number of long branches on the back for the different main branch opening angles.

2.10. Determination of Fruit Quality

After the peaches were ripe, fruits from different parts of the tree were picked and bagged separately and returned to the laboratory for quality index determination. The weight of a single fruit was measured using a one-hundredth balance; the determination of soluble solids was performed with a TD-4 glucose meter. The firmness of the pulp was measured using a TA-X Plus texture meter (Stable Micro Systems, Surrey, UK), and the probe model was 2 mm DIA CYLINDER STAINLESS. Titrable acid was titrated via sodium hydroxide titration. We weighed 10.0 g of the sample, ground it, and transferred it to a 100 mL volumetric bottle. We set the volume to the scale, shook it well, and let it stand for 30 min before filtering. We withdrew 20.0 mL of filtrate, transferred it to a triangular bottle, added 2 drops of 1% phenolphthalein indicator, and titrated it with a calibrated sodium hydroxide solution. Titration took place until the solution was initially pink and did not fade within 0.5 min (pH = 8.1~8.3), after which we recorded the amount of sodium hydroxide titration solution used; we repeated this process three times. Distilled water was used instead of the filtrate for titration as a blank control.

2.11. Statistical Analysis

SPSS 17.0 statistical analysis software (IBM, New York, NY, USA) was used to perform one-way ANOVA and Duncan’s multiple comparison test, and Origin Pro2021 was used to perform index correlation analysis. Statistical significance, presented using letters in the tables below, was assumed at a level of 5% (p < 0.05). Data in all tables are presented as the means ± standard deviations (error bars).

3. Results

3.1. The Quality Difference in Peach Buds with Different Main Branch Opening Angles

Figure 1 shows the difference in the quality of flower buds for different opening angles of the main branches of ‘Luhong 618’. With the increase in the branching angle, the total nitrogen content in the flower buds decreased, and at 85°, it was 30.9% lower than that at 45°, which was a significant difference (Figure 1A). The total phosphorus content in the buds of different treated flowers decreased with the increase in the branching angle, and at 85°, it was 48.4% lower than that at 45°, which was a significant difference (Figure 1B). There was no significant difference in the total potassium content in the flower buds of different treatments, and the opening angles of the three main branches were not significantly different (Figure 1C). The carbon content of flower buds at 85° was the highest, 26.07% higher than that at 45° and 41.34% higher than that at 65° (Figure 1D). The carbon–nitrogen ratio in the flower buds was not significantly different between 45° and 65°, but there was a significant difference between 45° and 85°. The carbon–nitrogen ratio of the 85° flower buds was 69% higher than that of the 45° buds (Figure 1E).

3.2. Differences in the Canopy Characteristics among the Different Main Branch Opening Angles

The leaf area index (LAI) of the peach trees at the opening angle of the three main branches of ‘Luhong 618’ gradually increased during the growth period from June to September (Figure 2A). In the early stage of canopy formation in June, the LAI values of the three main branch opening angles were not significantly different. During the period of vigorous growth from July to September, the LAI of the opening angle of the main branch at 65° was 1.49, which was significantly greater than the other values (1.31 at 45° and 1.21 at 85°). In October, as the temperature decreases and the number of hours of light decreases, leaf growth slows down, and there is even a phenomenon of leaf shrinkage and shedding, and the LAI begins to decline. This was most evident for peach trees at the 45° opening angle of the main branch. During the entire growing season from June to October, the mean tilt angle (MTA) of the canopy leaves at 85° was 66.75°, which was significantly higher than that of the other treatments, and the MTA at 45° was 56.5° and at 65° was 59.5°; the overall trend showed a slow decrease (Figure 2B). The variation curves of diffuse non-interceptance (DIFN) were plotted for the measurements at the bottom of different canopies. As can be seen from Figure 2C, the canopy DIFN of all three main branch opening angles decreased with the change in month, and the change curves of 45° and 85° were approximately the same. During the whole growing period, the magnitudes of the DIFN values were 85° > 45° > 65°, which showed that the inner light environment of the 85° branch opening angle was better than that at 45° and 65°, and the lower leaves were able to intercept more solar radiation, which was beneficial to the fruit growth and development in the lower levels of the canopy. The canopy extinction coefficient (k) showed a pattern of increasing and then decreasing from June to October, indicating that the overall light transmission capacity of the canopy decreased and then increased, and the proportion of solar radiation penetrating the middle and upper leaves to the bottom of the canopy decreased and then increased. Based on Figure 2D, the average k of the 85° canopy was always higher than that of 45° and 65° from July to October, which indicates that the upper and middle part of the 85° canopy had better light transmittance and a more open canopy, and the lower canopy intercepted more direct solar radiation, which is beneficial for photosynthesis.
Fish-eye photographs of the canopy at different branch opening angles were taken at the end of August when the canopy was in its final stage of formation. This set of pictures can more visually represent the difference in the visible sky ratio DIFN at different branch opening angles. It is clear from the figure that for ‘Lu Hong 618’, the density of the inner branches and leaves was higher when the main branch opening angle was 65°. The ratio of the visible sky at the bottom of the canopy of 65° was lower than that recorded for 45° and 85°, and the ventilation and light penetration conditions were poor (Figure 3).

3.3. Daily Variation Pattern of Carbon Dioxide with Different Main Branch Opening Angles

The range of variation in the CO2 concentration in the inner chamber throughout the day in summer was greater than that in autumn, probably because the lower average daily temperature in autumn led to lower rates of photosynthesis and respiration of the peach leaves, which had less effect on CO2 in the canopy (Figure 4). The range of variation in CO2 concentration in the inner chamber throughout the day in summer was greater than that in autumn, probably because the lower average daily temperature in autumn led to lower rates of photosynthesis and respiration of the peach leaves, which had less effect on CO2 in the canopy.

3.4. Effect of Different Main Branch Opening Angles on the Canopy Growth of Peach Trees

There were significant differences in the height of the trees with different main branch opening angles. The east–west crown diameter showed an increasing trend with the increase in the main branch opening angle, and the difference was significant. The opposite trend was observed for tree height. There were no significant differences in the north–south crown diameter among the different main branch opening angles (Table 1). It can be seen from Table 2 that the number of long, medium, and short fruiting branches gradually decreased as the opening angle of the main branch increased. In addition, the number of long branches on the back of ‘Luhong 618’ was in the order 65° > 85° > 45°. Regardless of the number of long, medium, and short fruiting branches, there were significant differences between 45° and 85°. The length of the lower peripheral new tips of ‘Lu Hong 618’ also differed significantly between the different main branch opening angles; the length of new tips at 45° and 65° was 71.8 cm and 61.1 cm, respectively, whereas the length of the new tips at 85° was only 30.56 cm, which was 57.74% lower compared with that at 45°. From the above analysis, there was a clear effect of the larger branch opening angle.

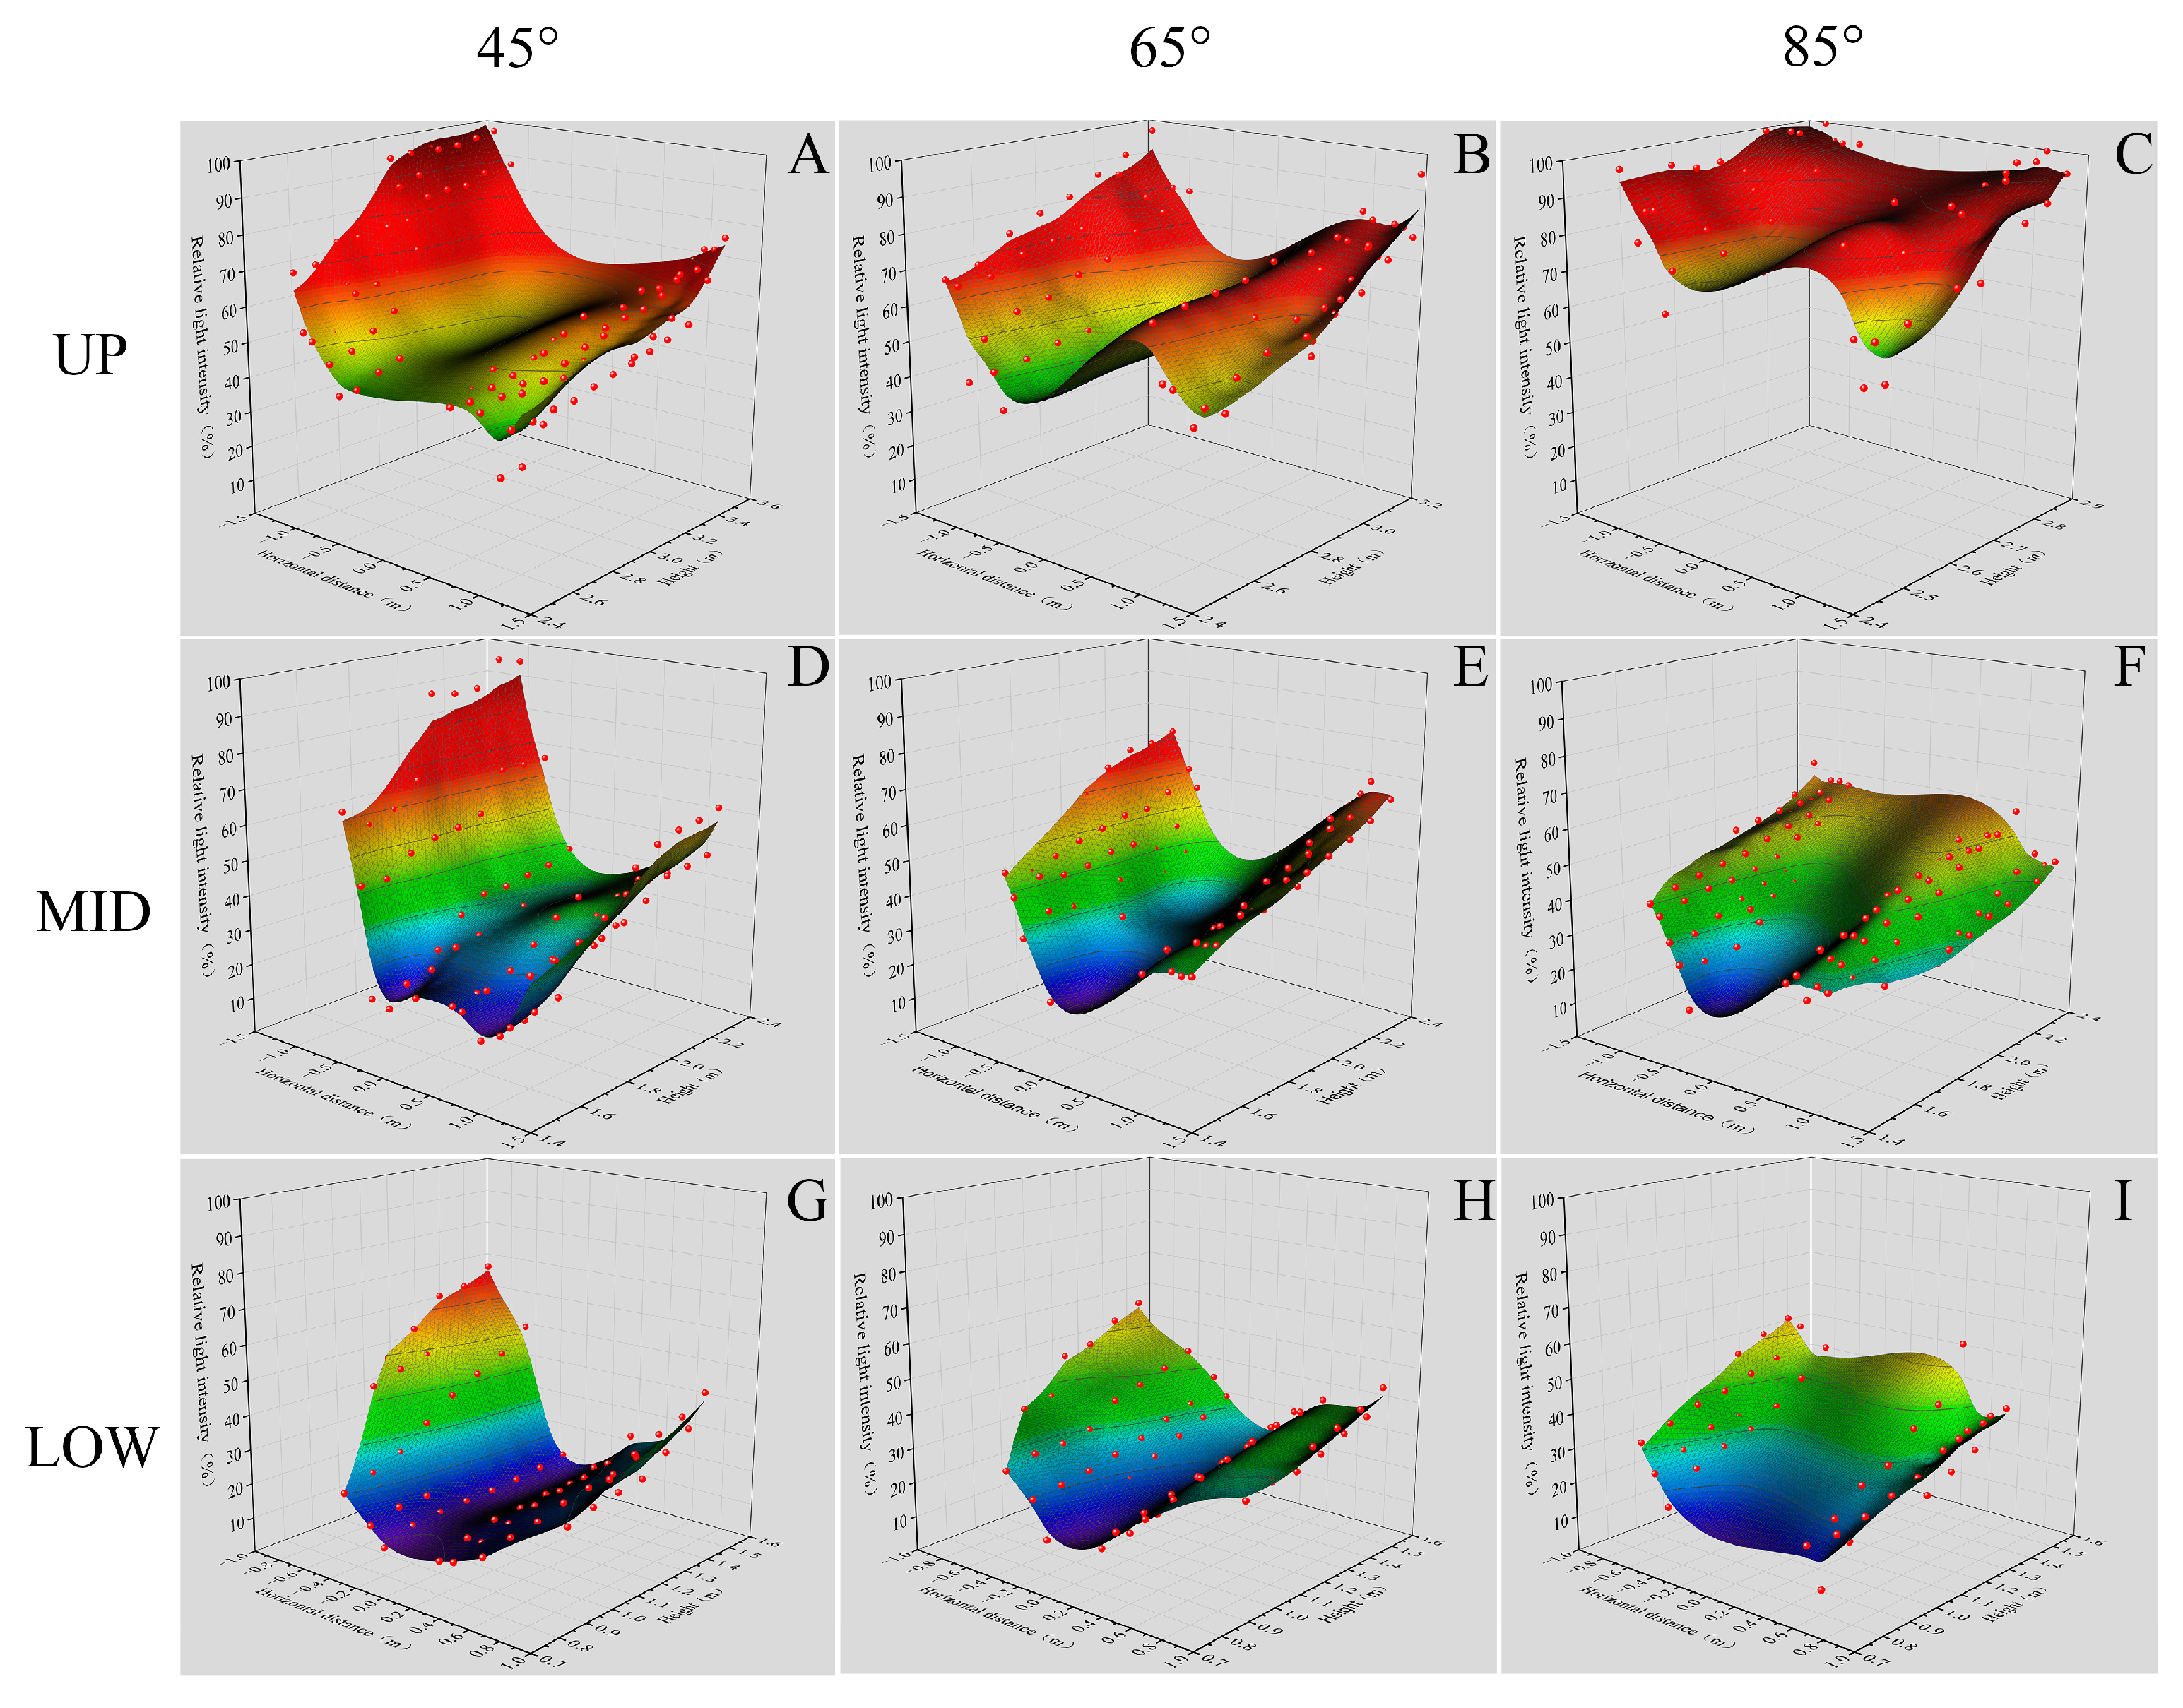
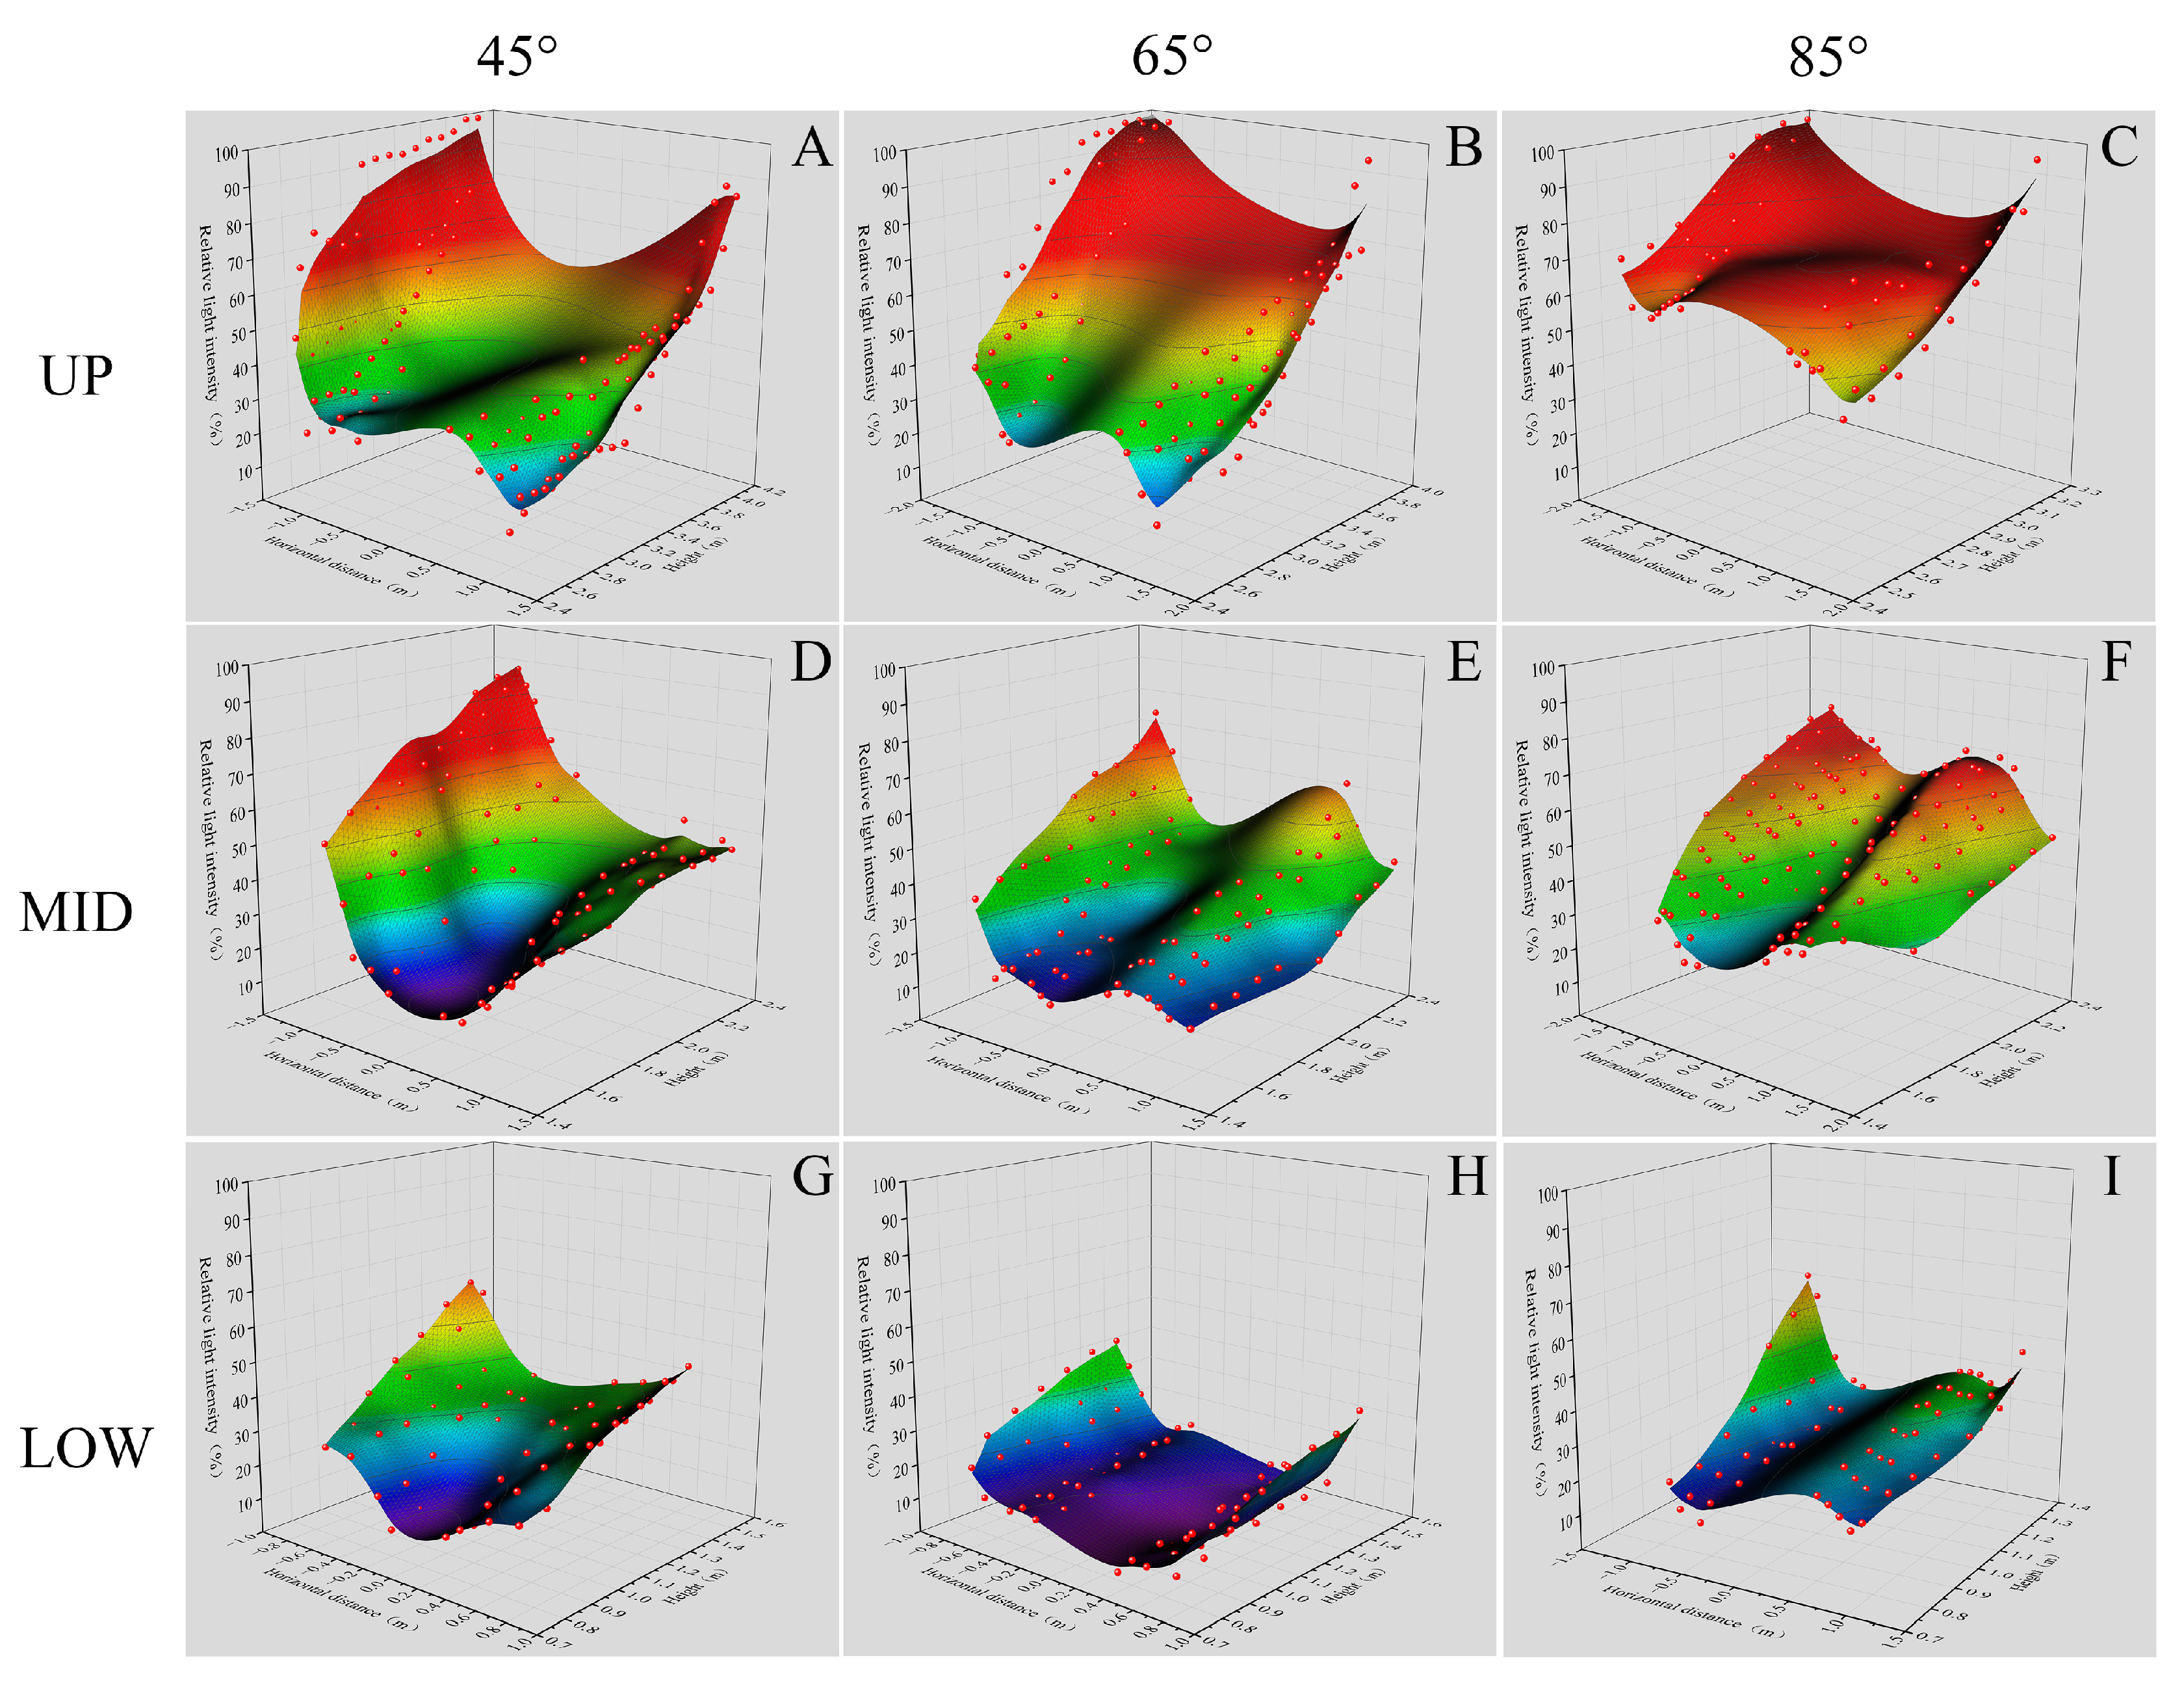
3.5. Differences in Light Distribution in the Canopy

The relative light intensity distribution of ‘Luhong 618’ in the early stage of canopy formation is shown in Figure 5 and Table 3. Surface diagrams of the distribution of light intensity in the upper part of the opening angle of the three main branches are shown in Figure 5A–C. It can be intuitively seen from the figure that the upper lighting environment at 85° was significantly better than that at 45° and 65°. The relative light intensity area at 85° that was greater than 60% accounted for 79.7%, which was significantly greater than the values (35.7% and 36.9%) at 45° and 65°. From the curved surface diagram of the light intensity distribution in the middle of the canopy, the light intensity inside and outside the peach tree canopy at 45° and 65° was very different, and the light intensity in the eastern part of the canopy at 45° and 65° was significantly greater than that in the western part (Figure 5D–F). From the surface diagram of the distribution of the light intensity in the lower part of the canopy, it can be seen that due to the influence of the upper branches and leaves of the canopy on the shielding of solar radiation, the external light intensity of the canopy at 85° was roughly the same as the light intensity of the inner chamber. The external light intensity at 45° and 65° was greater than that of the interior of the canopy, and the difference was obvious (Figure 5G–I).
Figure 6 and Table 4 show the relative light intensity distribution of ‘Luhong 618’ in different areas during the final stage of canopy formation. The surface diagram of the distribution of light intensity in the upper part of the three main branch opening angles shows that the proportion of relative light in the upper canopy at 85° that was greater than 60% was 63.3%, a decrease of 16% compared to the initial stage; the proportion of relative light in the upper canopy at 65° that was greater than 60% was 33.7%, a decrease of 3.2% compared to the initial stage; and the proportion of relative light in the upper canopy of 45° that was greater than 60% was 18.9%, a decrease of 16.8% compared to the initial stage (Figure 6A–C). In the surface view of the middle part of the canopy, the relative light intensity of the eastern canopy was in the order 45° > 65° > 85°, and the western side exhibited the opposite trend. In the morning, the sun is incident from the east. As the opening angle of the main branch increased, the solar radiation received by the western inner chamber increased, which improved the internal lighting environment of the canopy and had less impact on the light intensity along the western periphery of the canopy (Figure 6D–F). In the lower canopy surface diagram, the proportion of areas with a relative light intensity of less than 30% at 65° reached 74.5%, which was higher than that at 45° and 85° (Figure 6G–I).

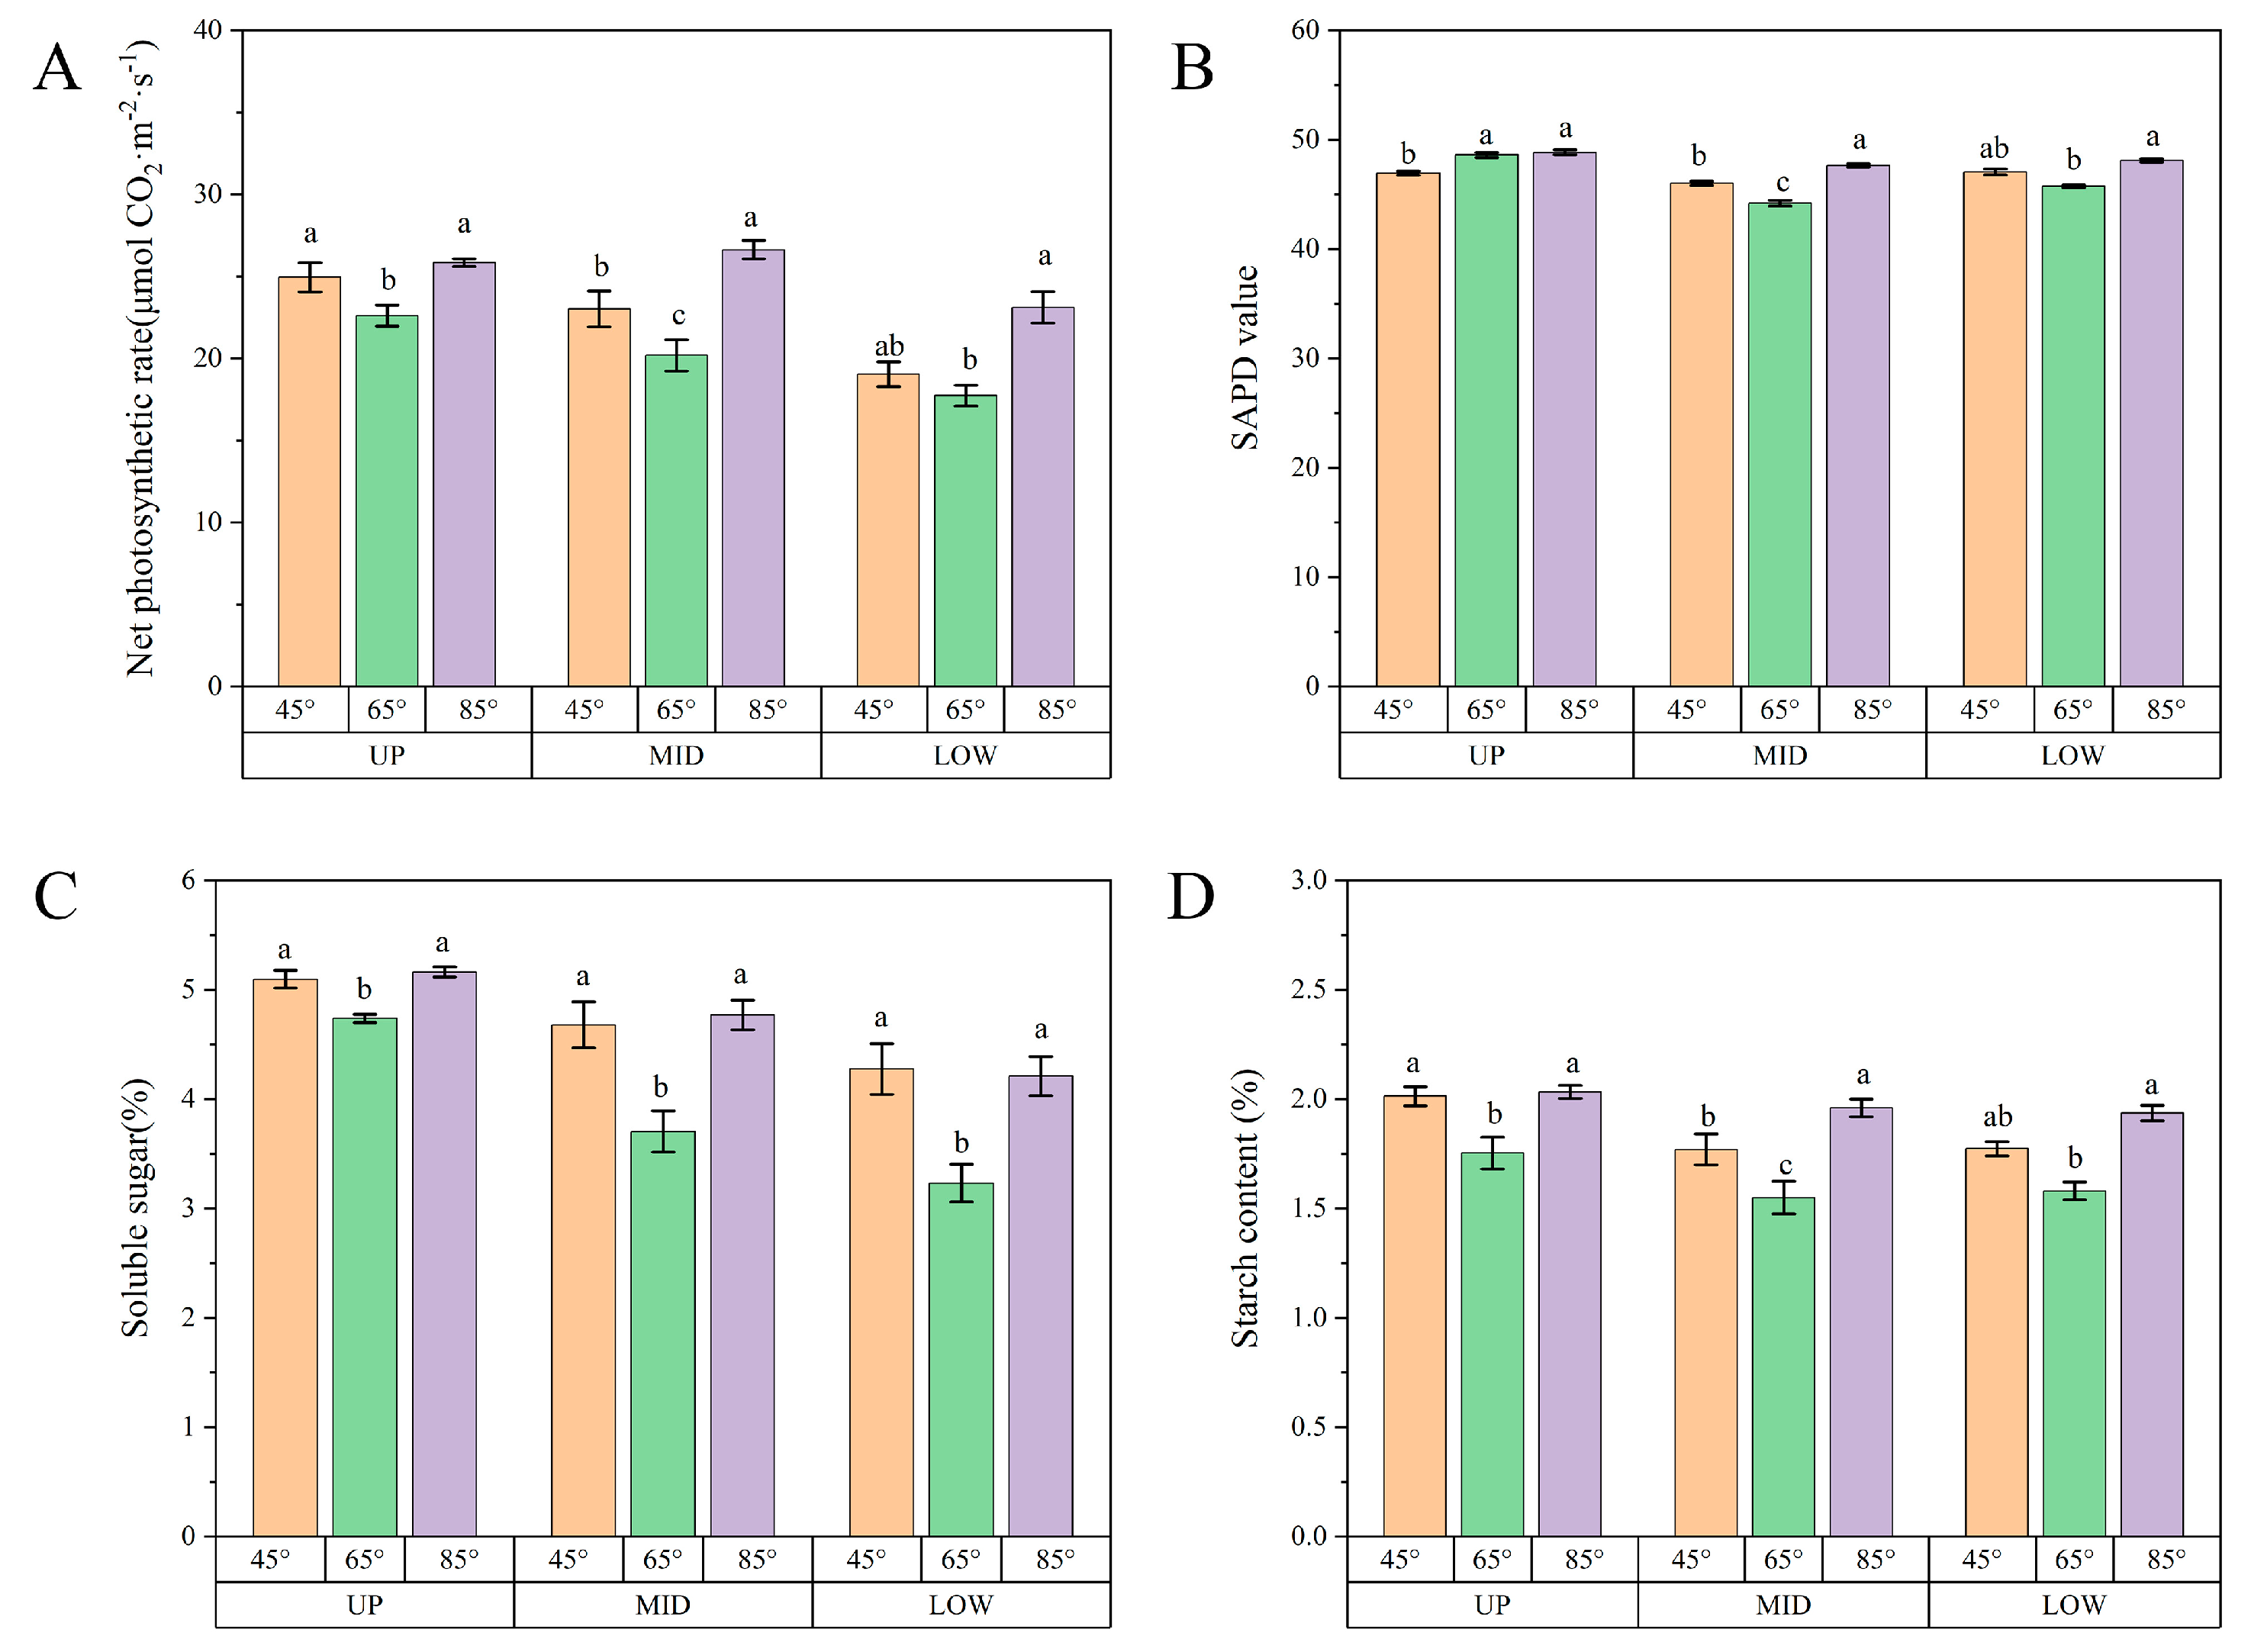
3.6. The Photosynthetic Rate and Photosynthates of Leaves Differed among Different Parts

The influence of different opening angles on the photosynthetic rate can be effectively improved in the upper, middle, and lower parts of the canopy. In the middle of the canopy, the 85° angle photosynthetic rate was 26.63, which was 32.9% higher than that at 65° (Figure 7A). In Figure 7B, it can be seen that the chlorophyll SPAD values of leaves in different parts of the 85° canopy were significantly higher than those in the 65° and 85° treatments. In different parts of the canopy, the soluble sugar and starch contents of the leaves were 45° and 85°, which were significantly greater than those at 65°; there was no significant difference between 45° and 85°, and the overall trend was a gradual decrease from top to bottom (Figure 7C,D).

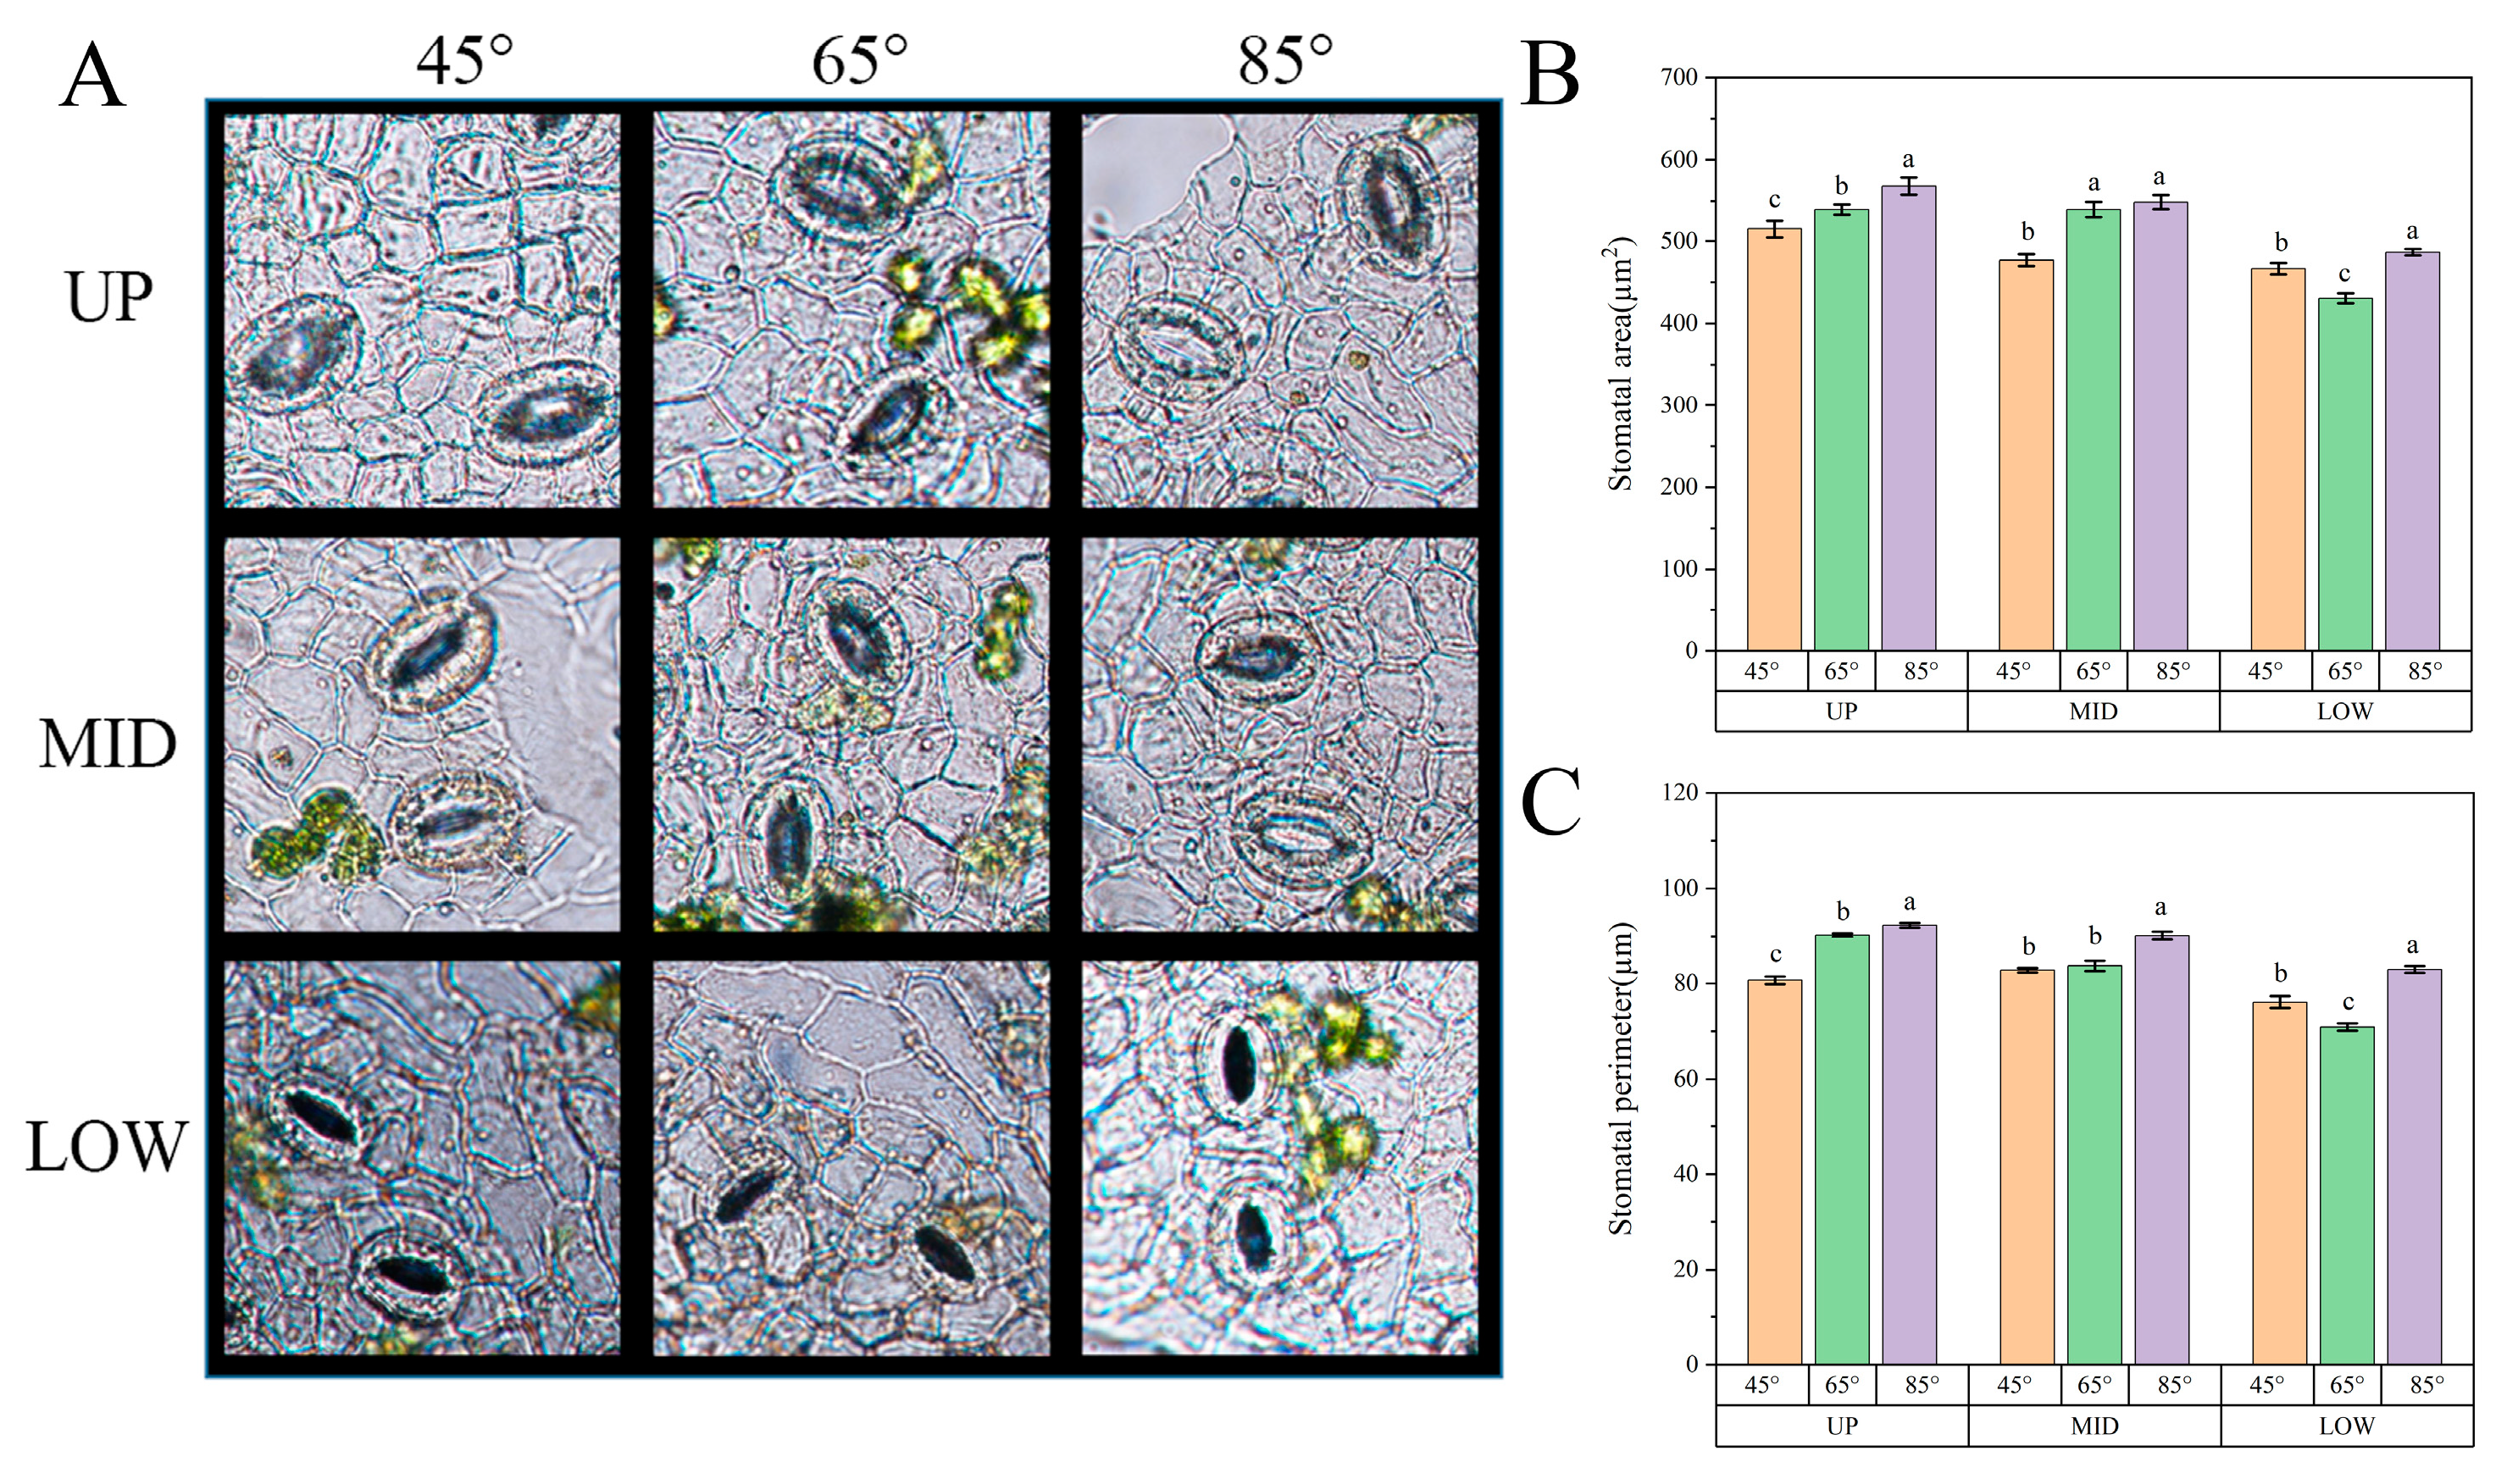
3.7. Leaf Stomatal Morphology Was Different in Different Parts of the Canopy

The morphology of the pores of leaves in the different parts of the canopy was examined under a microscope. As can be seen from the photos, the degree of opening of the pores in the upper canopy was greater than the degree of opening of the pores in the middle canopy, which was, in turn, greater than the degree of opening of the pores in the lower canopy (Figure 8A). The open distribution of pores from leaves in different parts of the canopy is generally consistent with the distribution of the relative light intensity in the canopy. As can be seen from Figure 8B,C, the circumference and area of the pores of the leaves in the middle and upper parts of the canopy followed the order 85° > 65° > 45°, but in the lower part of the canopy, the order was 85° > 45° > 65°.

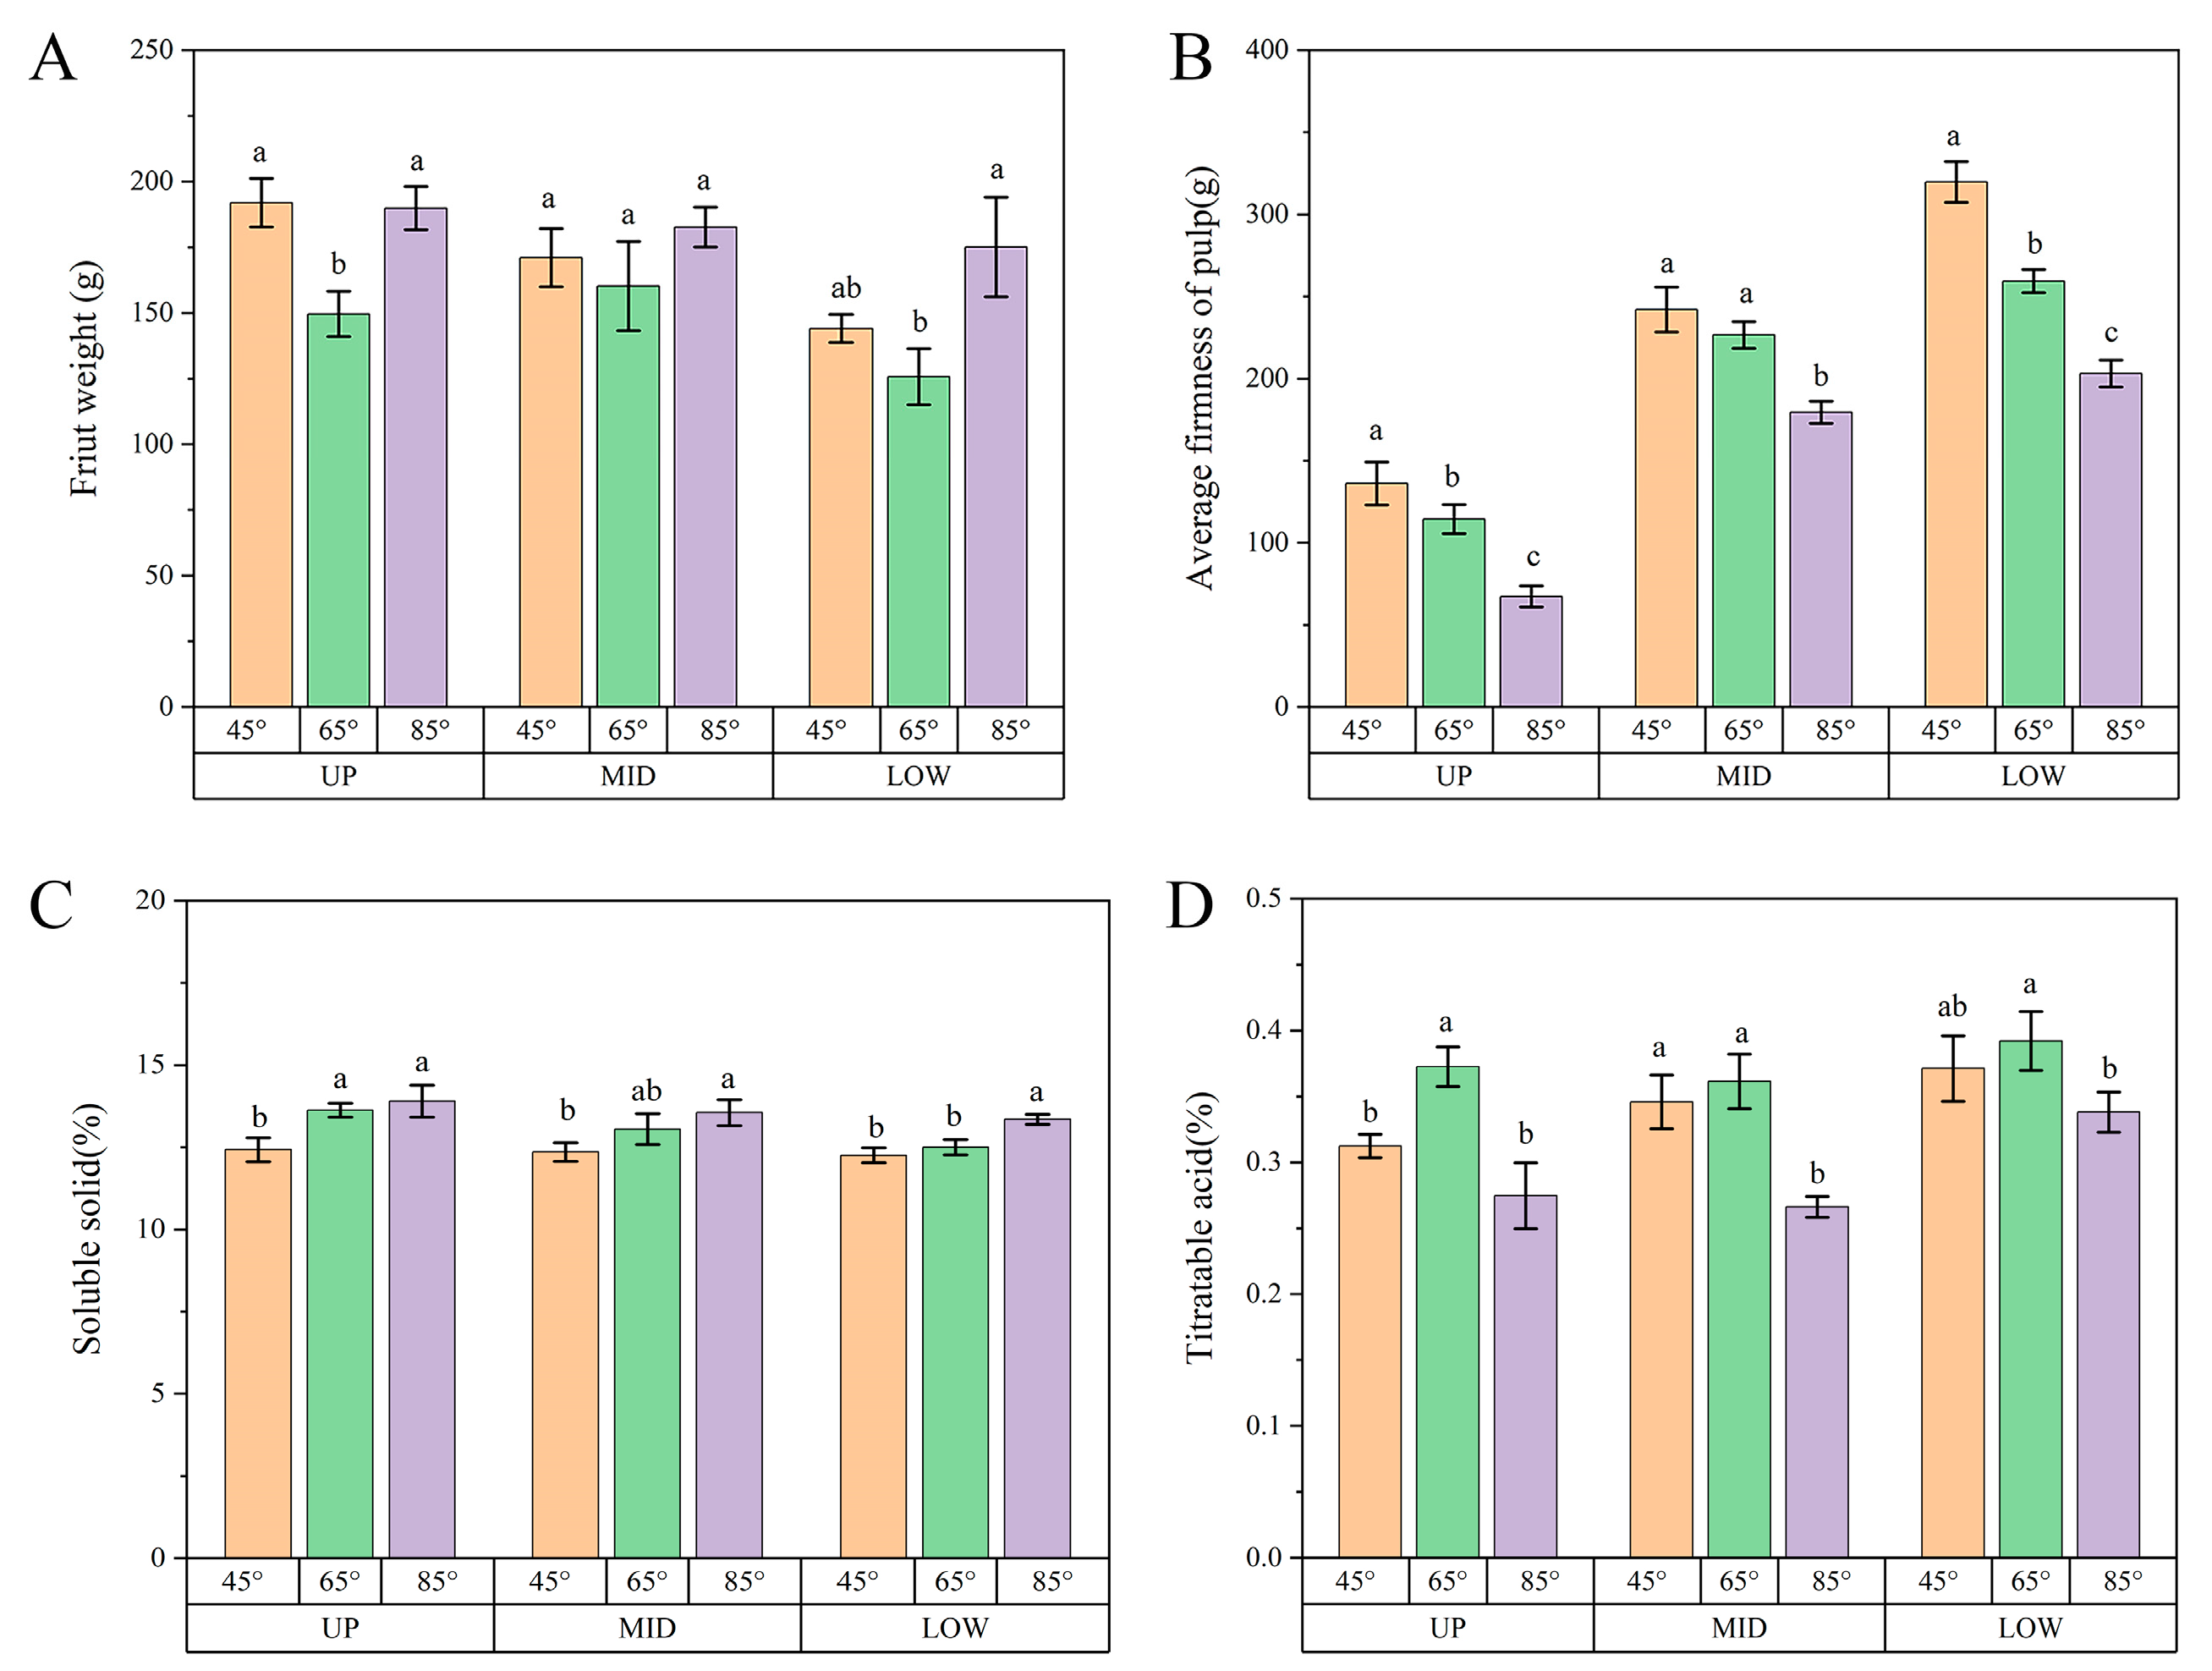
3.8. Differences in Fruit Quality in Different Fruiting Parts

The influence of tree shape on the quality of peach fruit under the different main branch opening angles was examined. As can be seen from Figure 9A, among the three main branch opening angles, at the same canopy site, the single fruit weight at 45° or 85° was significantly greater than that at 65°. The overall average single fruit weight of peach trees with a main branch opening angle of 85° reached 194 g, at 45° was 177 g, and at 65° was 154 g. Compared with 65°, the average single fruit weights at 85° and 45° were 25.9% and 14.9% higher, respectively. As can be seen in Figure 9B, the firmness of the pulp under the same treatment showed a gradual increase from top to bottom. With the increase in the opening angle of the main branch, the firmness of the pulp after the fruit matured decreased significantly. Figure 9C shows that at the same canopy position, the content of soluble solids in the fruit increased significantly as the opening angle of the main branch increased. The average soluble solids content of the peach trees at 45° was 12.6%, that at 65° was 13.35%, and that at 85° was 13.7%. Compared with 45°, the content of soluble solids at 85° increased by 8.7%. Figure 9D shows that the distribution trend of the titratable acid content of the fruit in the canopy was increased from top to bottom. At the same position in the canopy, the titratable acid content of the fruit with respect to the opening angle of the three main branches was in the order 65° > 45° > 85°. The average titratable acid content of the peach trees at 45° was 0.31%, that at 65° was 0.35%, and that at 85° was 0.27%. Compared with 45° and 65°, the titratable acid content at 85° was reduced by 12.9% and 22.8%, respectively.

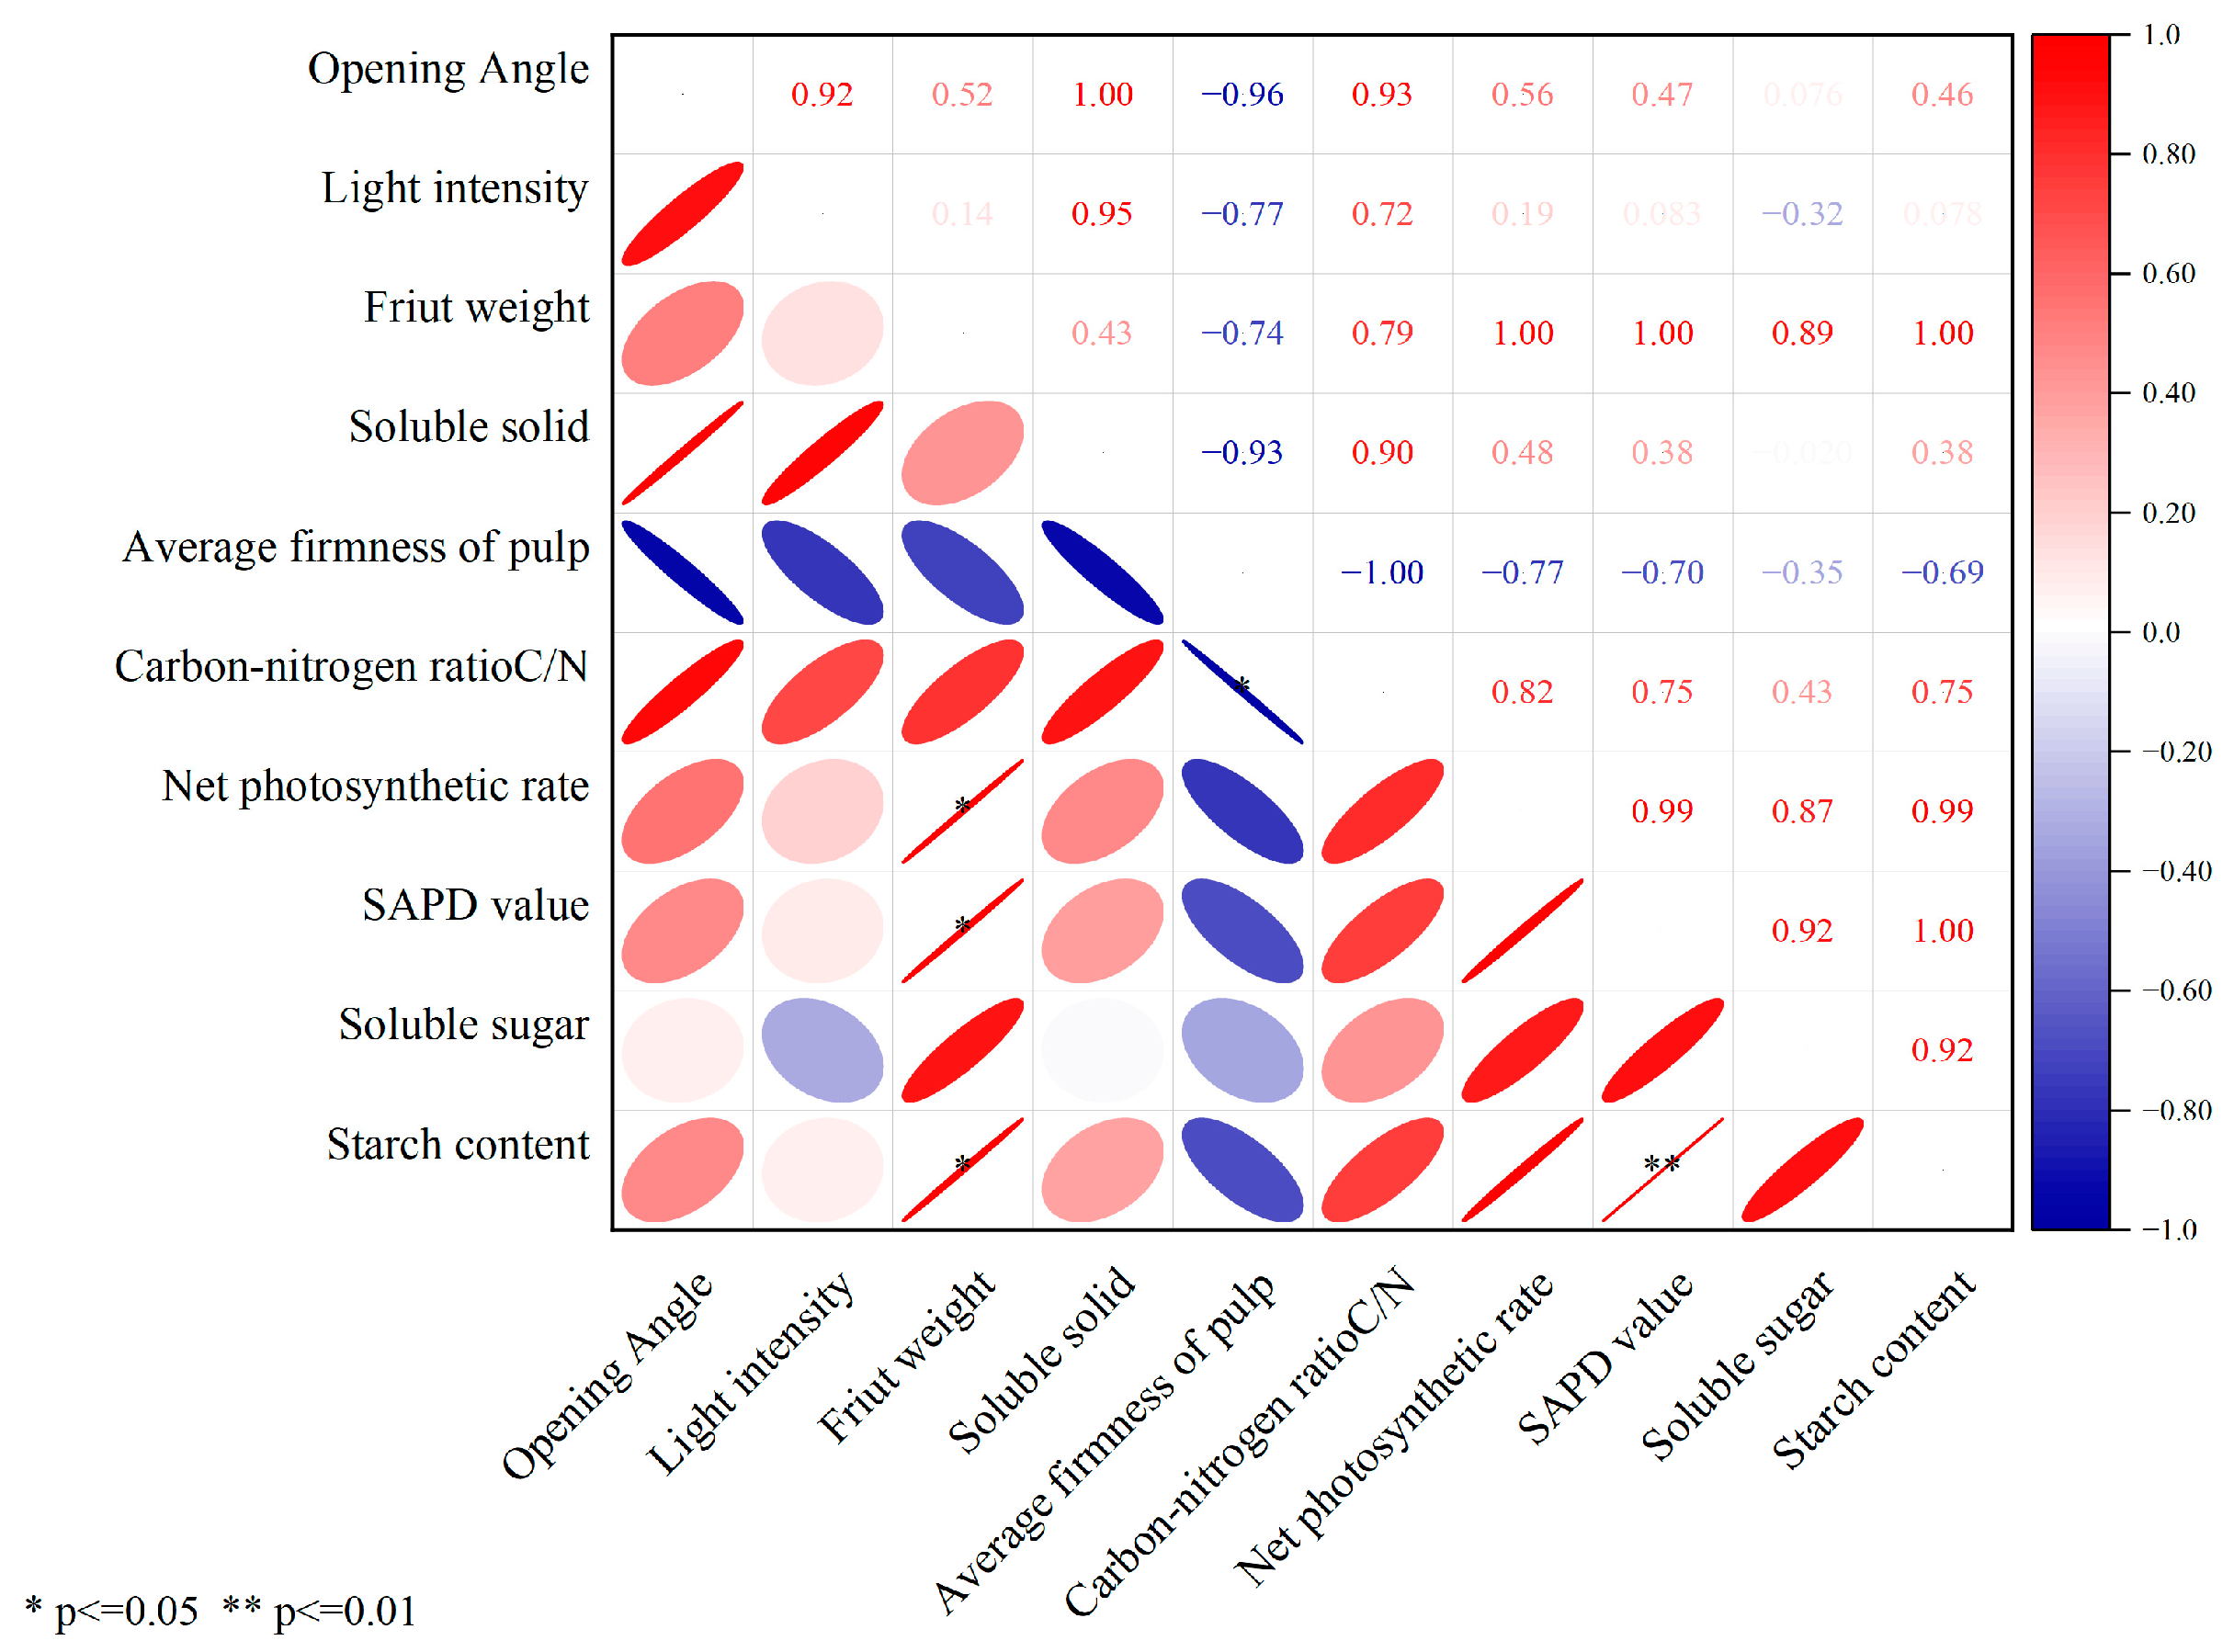
3.9. Correlation Analysis of Canopy Characteristic Indices and Fruit Quality

Different main branch pulling angles were negatively correlated with fruit hardness, and their indicators were positively correlated. There was a significant positive correlation between fruit weight and photosynthesis, the SPAD value, and the starch content (Figure 10).

4. Discussion

Branch bending affects the formation of flower buds. In actively growing shoots, assimilates flow to flower buds, and bending leads to a higher accumulation of flower bud assimilates [24,25]. The accumulation of C and N in young shoots produced by bent branches is considered important for flower bud formation [26]. The main objective of apple cultivation is to increase the accumulation of C and N to promote flower bud formation. Bending may lead to spur formation and limit plant vigor, resulting in nutrient accumulation and, thus, improved bud quality [17,27]. In this experiment, we found that the total N and total P contents of flower buds of ‘Lu Hong 618’ decreased with an increase in the main branch opening angle, and the difference reached a significant level; the total K contents of flower buds at 85° were significantly different from those at 45° and 65°. A higher carbon-to-nitrogen ratio is one of the most important factors determining the quality of flower buds, and a higher carbon-to-nitrogen ratio is beneficial for germination and fruit setting. In this study, the main branch opening angle of 85° was better than 45° and 65°, which is consistent with the results of previous studies [17,28].
Light energy use efficiency is directly influenced by the canopy structure. An optimal canopy structure is the basis for improving the photosynthetic efficiency and achieving high crop yields [29,30,31]. Different tree shapes have a strong impact on canopy parameters such as LAI, MTA, DIFN, and k in peach trees. LAI is the ratio of the sum of the leaf area of the tree canopy leaves to the area of the canopy ground projection [23]. The results showed that the leaf area coefficient of peach trees with different main branch opening angles increased with new growth during the growing season, reached a maximum in September and then decreased, and was significantly higher at 85° than at 65° and 45°. The reason for this may be that the lower temperature caused the leaves to curl up, dry, and fall off. MTA is a major characteristic indicator of the canopy structure, and its value affects the effective photosynthetic area of the leaves [32]. The MTA gradually decreased during the growing period, probably because the leaves gradually matured, and the accumulated nutrients made the single leaf weight increase, causing leaf droop due to gravity. The MTA at 85° was greater than that at 45° and 65°, probably because the 85° main branch opening angle significantly inhibited the outward transport of photosynthetic products in the leaves, resulting in higher leaf weight and drooping at 85°. The DIFN calculated in combination with the gap portion indicates the portion of the sky that is not obscured by leaves. The magnitude of this value ranges from 0 to 1. The upper leaves of the fruit tree canopy receive mainly direct and scattered radiation, while the leaves at the bottom of the canopy receive a smaller proportion of direct radiation [33]. The DIFN of the three angles gradually decreased during the growth period, implying that the shading effect of the canopy peripheral leaves on the inner chamber light became gradually obvious. The DIFN of ‘Lu Hong 618’ at 85° was higher than that at 45° and 65°, indicating that the inner part of the 85° canopy received more light radiation with better light transmission conditions. k is an important parameter to describe the light distribution of the population. The extinction coefficient of each level within the canopy reflects the light inside the canopy [34]. The k value of ‘Lu Hong 618’ showed a pattern of increasing and then decreasing from June to October, indicating that the overall light transmission capacity of the canopy decreased and then increased, and the proportion of solar radiation penetrating the middle and upper leaves to the bottom of the canopy decreased and then increased. The canopy at 85° had better light transmission conditions in the middle and upper part of the canopy, the canopy was more open, and the lower canopy intercepted more direct solar radiation, which is beneficial to photosynthesis. In September and October, the leaves aged, curled, and even fell off due to the influence of atmospheric temperature and other environmental factors, and the k value for the 45° canopy decreased most obviously.
The distribution of the relative light intensity within the canopy of peach trees is closely related to the tree shape and branch composition [35]. In this study, we found that the trend of the relative light intensity at different levels of the canopy decreased gradually from outside to inside and from top to bottom, which is consistent with the results of Zhang et al. [20], Yue et al. [21], and Lu et al. [36]. In addition, the distribution of the canopy light intensity and the proportion of different light intensities differed for different main branch opening angles. In the early stage of canopy formation, the branch growth potential was stronger, the proportion of different light intensities at different levels for 45° and 65° were more similar, and the differences were greater between 85° and 45° and 65°. The proportion of high light areas at the upper level at 85° reached 79.7%, higher than the other values, i.e., 35.7% at 45° and 36.9% at 65°. At the end of canopy formation, as the angle of pulling increased, the canopy light situation was ideal, and the percentage of the high light area in the upper layer at 85° was 63.3%, significantly greater than the values (18.9% and 33.7%) at 45° and 65°. We generally believe that relative light intensity below 30% is an ineffective light zone, while fruits that receive light intensity higher than 80% are prone to sunburn and rough surfaces, resulting in lower fruit quality. The overall light condition at 85° was better than that at 45°; in particular, the relative light intensity in the inner chamber was obvious, so the high light efficiency of ‘Lu Hong 618’ was higher than that at 45°.
In this study, as the main branch opening angle increased, the faster the growth rate of the tree and the growth rate of new shoots at different levels. The leaf-soluble sugar and starch contents decreased gradually from top to bottom, and in the same parts of the leaves, values at 45° and 85° were significantly greater than those at 65°, and the difference between 45° and 85° was not significant overall. Canopy light distribution had a greater effect on photosynthesis than other factors [37]. Light intensity was not uniformly distributed in the 65° canopy, and the canopy branches and leaves were densely shaded by each other, causing reduced photosynthesis. There was no significant difference in the leaf SPAD values between different parts, the difference between different main branch opening angles was not significant, and the trend was not regular. The inner chamber at 85° had a significantly higher CO2 concentration difference than that at 45° and 65° in a day, which might be due to the relatively open canopy inner chamber at 85° and poor ventilation conditions, which increased the photosynthesis of leaves and thus promoted the accumulation of photosynthetic products [38].
The shape of fruit trees determines the canopy structure, which is closely related to the branch volume, tree ventilation, and light penetration ability, so a reasonable tree shape is the basis for high-quality fruit yield [39]. Zhaoyuan et al. [40] concluded that fruit texture and yield distribution in different positions of the peach tree canopy are significantly correlated with relative light intensity, which gradually decreases from outside to inside and from the top to the bottom of the canopy. To increase the yield of high-quality fruits, the relative light intensity must be greater than 41.83%. Among the three main branch opening angles at the same canopy site, the single fruit weight at 45° or 85° was significantly greater than the single fruit weight at 65°. Lu et al. [35] found that different relative light intensities at different canopy positions resulted in significant differences in the mean fruit weight per unit, hardness, soluble solids, and anthocyanin content, and Lewallen and Marini [41] found that the light environment conditions under which the fruit was located determined fruit quality more than the position of the fruit in the canopy. In this study, flesh firmness gradually increased from top to bottom at the same branch opening angle, and between different branch opening angles at the same fruiting site, flesh firmness was significantly higher at 45° than at 65° and 85°; the soluble solids showed a gradual decrease from top to bottom, and at the same fruiting site, 85° > 65° > 45°. The trend of the fruit titratable acid content was the opposite to that of the soluble solids content, with the fruiting site gradually increasing from top to bottom, and between different main branch opening angles at the same fruiting site, the content at 65° was significantly higher than that at 45° and 85°.

5. Conclusions

In this study, we investigated the effects of different main branch opening angles (three treatments: 45°, 65°, and 85°) on the canopy light distribution, canopy characteristics, fruit quality, and flower bud quality of ‘Y’-shaped peach trees. (i) The 85° main branch opening angle had good branch structure and leaf morphology, better ventilation, and light penetration in the inner canopy and improved the relative light intensity of the canopy. (ii) With the increase in the main branch opening angle, the new growth of peach trees and the growth of the main branch trunk showed an inhibitory effect. The stomatal morphology and the soluble sugar and starch contents of leaves at different levels of the canopy were affected by canopy light. (iii) For an 85° main branch opening angle, there was a tendency for C/N to increase within the flower buds of fruiting branches. In addition, the distribution pattern of fruit quality in the canopy was similar to that of the light distribution. Fruit quality was higher at 85° and 45° than at 65° in the same fruiting area. The effects of different branch opening angles on fruit weight, flesh firmness, titratable acid, and soluble solids were more significant. Therefore, a main branch bending angle of 85° is recommended for a 3-year-old “Luhong 618” peach, which can effectively improve canopy characteristics, promote flower bud formation, and improve fruit quality. Additional research is needed to better understand the effects of different branch opening angles on fruit tree growth.

Author Contributions

Conceptualization, F.P. and Y.X.; methodology, F.Z.; software, B.Z.; validation, B.Z., F.Z. and W.G.; formal analysis, B.Z.; investigation, B.Z.; resources, F.P.; data curation, F.Z.; writing—original draft preparation, B.Z.; writing—review and editing, B.Z., F.Z. and H.D.; visualization, B.Z.; supervision, Y.X.; project administration, F.P.; funding acquisition, F.P. All authors have read and agreed to the published version of the manuscript.

Funding

This work was supported by the Rural Revitalization Science and Technology Innovation Action Plan Project of Shandong (2021TZXD013), the National Modern Agro-industry Technology Research System Fund (Grant No. CARS-30-2-02).

Data Availability Statement

The data presented in this study are available on request from the corresponding author.

Conflicts of Interest

The authors declare no conflict of interest.

References

  1. Bartolini, S.; Leccese, A.; Andreini, L. Influence of canopy fruit location on morphological, histochemical and biochemical changes in two oil olive cultivars. Plant Biosyst.-Int. J. Deal. All Asp. Plant Biol. 2014, 148, 1221–1230. [Google Scholar] [CrossRef]
  2. Farina, V.; Bianco, R.L.; Inglese, P. Vertical Distribution of Crop Load and Fruit Quality within Vase-and Y-shaped Canopies of ‘Elegant Lady’ Peach. HortScience 2005, 40, 587–591. [Google Scholar] [CrossRef] [Green Version]
  3. Anthony, B.M.; Minas, I.S. Optimizing peach tree canopy architecture for efficient light use, increased productivity and improved fruit quality. Agronomy 2021, 11, 1961. [Google Scholar] [CrossRef]
  4. Manganaris, G.A.; Minas, I.; Cirilli, M.; Torres, R.; Bassi, D.; Costa, G. Peach for the future: A specialty crop revisited. Sci. Hortic. 2022, 305, 111390. [Google Scholar] [CrossRef]
  5. Minas, I.S.; Tanou, G.; Molassiotis, A. Environmental and orchard bases of peach fruit quality. Sci. Hortic. 2018, 235, 307–322. [Google Scholar] [CrossRef]
  6. De Macedo, T.A.; da Silva, P.S.; Sander, G.F.; Welter, J.F.; Rufato, L.; de Rossi, A. Productivity and quality of ‘Fuji Suprema’ apple fruit in different rootstocks and growing conditions. Sci. Hortic. 2019, 256, 5. [Google Scholar] [CrossRef]
  7. Lauzike, K.; Uselis, N.; Samuoliene, G. The Influence of Rootstock and High-Density Planting on Apple cv. Auksis Fruit Quality. Plants 2021, 10, 11. [Google Scholar] [CrossRef]
  8. Legua, P.; Martinez-Cuenca, M.R.; Bellver, R.; Forner-Giner, M.A. Rootstock’s and scion’s impact on lemon quality in southeast Spain. Int. Agrophys. 2018, 32, 325–333. [Google Scholar] [CrossRef]
  9. Lu, X.; Gao, Y.; Wang, K.; Sun, S.M.; Liu, Z.; Yan, P.; Feng, J.R.; Li, Q.S.; Li, L.W.; Wang, D.J. Dwarf Interstocks Improve Aroma Quality of ‘Huahong’ Apple (Malus × domestica). Agriculture 2022, 12, 13. [Google Scholar] [CrossRef]
  10. Musacchi, S.; Gagliardi, F.; Serra, S. New training systems for high-density planting of sweet cherry. HortScience 2015, 50, 59–67. [Google Scholar] [CrossRef]
  11. Reig, G.; Lordan, J.; Fazio, G.; Grusak, M.A.; Hoying, S.; Cheng, L.L.; Francescatto, P.; Robinson, T. Horticultural performance and elemental nutrient concentrations on ‘Fuji’ grafted on apple rootstocks under New York State climatic conditions. Sci. Hortic. 2018, 227, 22–37. [Google Scholar] [CrossRef]
  12. Stachowiak, A.; Bosiacki, M.; Swierczynski, S.; Kolasinski, M. Influence of rootstocks on different sweet cherry cultivars and accumulation of heavy metals in leaves and fruit. Hortic. Sci. 2015, 42, 193–202. [Google Scholar] [CrossRef] [Green Version]
  13. Jung, S.-K.; Choi, H.-S. Light penetration, growth, and fruit productivity in ‘Fuji’ apple trees trained to four growing systems. Sci. Hortic. 2010, 125, 672–678. [Google Scholar] [CrossRef]
  14. Jung, S.-K.; Ryu, H.-U.; Gu, M.; Choi, H.-S.; Ryu, J.-H.; Cho, Y.-K. Growth and fruit production in young ‘Fuji’ apple trees as affected by time of downward bending of branches. J. Hortic. Sci. Biotechnol. 2012, 87, 519–523. [Google Scholar] [CrossRef]
  15. Jung, J. Effect of Pruning Methods on the Tree Growth, Yield and Quality of Fruits in Dwarf Apple Trees (‘Fuji’/M. 26/Malus prunifolia seedlings). Ph.D. Thesis, Kyung Hee University, Yongin, Korea, 1993. [Google Scholar]
  16. Zhang, M.; Han, M.; Ma, F.; Shu, H. Effect of bending on the dynamic changes of endogenous hormones in shoot terminals of ‘Fuji’ and ‘Gala’ apple trees. Acta Physiol. Plant. 2015, 37, 76. [Google Scholar] [CrossRef]
  17. Zhang, M.; Ma, F.; Shu, H.; Han, M. Branch bending affected floral bud development and nutrient accumulation in shoot terminals of ‘Fuji’ and ‘Gala’ apples. Acta Physiol. Plant. 2017, 39, 156. [Google Scholar] [CrossRef]
  18. Robinson, T.L.; Lakso, A.N.; Ren, Z.-b. Modifying apple tree canopies for improved production efficiency. HortScience 1991, 26, 1005–1012. [Google Scholar] [CrossRef] [Green Version]
  19. Lakso, A.N.; Robinson, T.L. Sunlight, yield, and productivity of apples. N. Y. Fruit Q. 2014, 22, 7. [Google Scholar]
  20. Zhang, Y.-Q.; Wen, Y.; Bai, Q.; Ma, Z.; Ye, H.-L.; Su, S.-C. Spatio-temporal effects of canopy microclimate on fruit yield and quality of Sapindus mukorossi Gaertn. Sci. Hortic. 2019, 251, 136–149. [Google Scholar] [CrossRef]
  21. Yue, W.; Shu-chai, S.; Ma, L.-y.; Shao-yan, Y.; Yu-wei, W.; Wang, X.-n. Effects of canopy microclimate on fruit yield and quality of Camellia oleifera. Sci. Hortic. 2018, 235, 132–141. [Google Scholar] [CrossRef]
  22. Lakso, A.; Corelli Grappadelli, L. Implications of pruning and training practices to carbon partitioning and fruit development in apple. In International Symposium on Training and Pruning of Fruit Trees; ISHS: Sheprdstown, WV, USA, 1991; Volume 322, pp. 231–240. [Google Scholar]
  23. Buler, Z.; Mika, A. The influence of canopy architecture on light interception and distribution in ‘Sampion’ apple trees. J. Fruit Ornam. Plant Res. 2009, 17, 45–52. [Google Scholar]
  24. Han, H.-H.; Coutand, C.; Cochard, H.; Trottier, C.; Lauri, P.-E. Effects of shoot bending on lateral fate and hydraulics: Invariant and changing traits across five apple genotypes. J. Exp. Bot. 2007, 58, 3537–3547. [Google Scholar] [CrossRef] [PubMed]
  25. Robinson, T.; Hoying, S.; Barritt, H. Descriptions of orchard planting systems. Compact. Fruit Tree 2003, 36, 50–64. [Google Scholar]
  26. Costes, E.; Lauri, P.-E.; Regnard, J.-L. Analyzing fruit tree architecture: Implications for tree management and fruit production. Hortic. Rev. 2006, 32, 1–61. [Google Scholar]
  27. Lauri, P.; Laurens, F. Architectural types in apple (Malus × domestica Borkh.). In Crops Growth Quality Biotechnology; World Food Limited: Helsinki, Finland, 2005; pp. 1300–1314. [Google Scholar]
  28. Xing, L.; Zhang, D.; Zhao, C.; Li, Y.; Ma, J.; An, N.; Han, M. Shoot bending promotes flower bud formation by mi RNA-mediated regulation in apple (Malus domestica Borkh.). Plant Biotechnol. J. 2016, 14, 749–770. [Google Scholar] [CrossRef] [Green Version]
  29. Ball, R.A.; Purcell, L.C.; Carey, S.K. Evaluation of solar radiation prediction models in North America. Agron. J. 2004, 96, 391–397. [Google Scholar] [CrossRef]
  30. De Bruin, J.L.; Pedersen, P. Effect of row spacing and seeding rate on soybean yield. Agron. J. 2008, 100, 704–710. [Google Scholar] [CrossRef]
  31. Giunta, F.; Motzo, R.; Pruneddu, G. Has long-term selection for yield in durum wheat also induced changes in leaf and canopy traits? Field Crops Res. 2008, 106, 68–76. [Google Scholar] [CrossRef]
  32. Feng, G.; Luo, H.; Zhang, Y.; Gou, L.; Yao, Y.; Lin, Y.; Zhang, W. Relationship between plant canopy characteristics and photosynthetic productivity in diverse cultivars of cotton (Gossypium hirsutum L.). Crop J. 2016, 4, 499–508. [Google Scholar] [CrossRef] [Green Version]
  33. Huang, G.; Liu, Y.; Guo, Y.; Peng, C.; Tan, W.; Zhang, M.; Li, Z.; Zhou, Y.; Duan, L. A novel plant growth regulator improves the grain yield of high-density maize crops by reducing stalk lodging and promoting a compact plant type. Field Crops Res. 2021, 260, 107982. [Google Scholar] [CrossRef]
  34. Tabarzad, A.; Ghaemi, A.A.; Zand-Parsa, S. Extinction coefficients and radiation use efficiency of barley under different irrigation regimes and sowing dates. Agric. Water Manag. 2016, 178, 126–136. [Google Scholar] [CrossRef]
  35. Sharma, Y.; Singh, H.; Singh, S. Effect of light interception and penetration at different levels of fruit tree canopy on quality of peach. Curr. Sci. 2018, 115, 1562–1566. [Google Scholar] [CrossRef]
  36. Lu, Y.; Si, Y.; Zhang, L.; Sun, Y.; Su, S. Effects of Canopy Position and Microclimate on Fruit Development and Quality of Camellia oleifera. Agronomy 2022, 12, 2158. [Google Scholar] [CrossRef]
  37. Xie, T.-T.; Su, P.-X.; An, L.-Z.; Shan, L.-S.; Zhou, Z.-J.; Chai, Z.-P. Physiological characteristics of high yield under cluster planting: Photosynthesis and canopy microclimate of cotton. Plant Prod. Sci. 2016, 19, 165–172. [Google Scholar] [CrossRef] [Green Version]
  38. Kostopoulou, P.; Karatassiou, M. Lotus corniculatus L. response to carbon dioxide concentration and radiation level variations. Photosynthetica 2017, 55, 522–531. [Google Scholar] [CrossRef]
  39. Hampson, C.R.; Quamme, H.A.; Brownlee, R.T. Canopy growth, yield, and fruit quality of ‘Royal Gala’ apple trees grown for eight years in five tree training systems. HortScience 2002, 37, 627–631. [Google Scholar] [CrossRef] [Green Version]
  40. Zhaoyuan, W.; Qihang, T.; Yong, G.; Chang, R.; Guojian, L.; Hu, C.; Yonghong, L. The Distribution of Relative Light Intensity in a Peach Tree Canopy Affects Fruit Yield and Texture. Agric. Biotechnol. 2021, 10, 2164–4993. [Google Scholar]
  41. Lewallen, K.S.; Marini, R.P. Relationship between flesh firmness and ground color in peach as influenced by light and canopy position. J. Am. Soc. Hortic. Sci. 2003, 128, 163–170. [Google Scholar] [CrossRef] [Green Version]
Figure 1. Effects of different main branch base angles on flower bud quality in peach. (A) Total nitrogen content; (B) total phosphorus content; (C) total potassium content; (D) total carbon content; (E) carbon–nitrogen ratio. Different small letter superscripts mean significant difference (p < 0.05).
Agronomy 13 01058 g001
Figure 2. Differences in the canopy characteristics of peach trees with different main branch opening angles. (A) Leaf area index; (B) mean tilt angle; (C) diffuse non-interceptance; (D) extinction coefficient. Within the same period, means followed by different letters are significantly different (p < 0.05).
Agronomy 13 01058 g002
Figure 3. Fish-eye photos of the canopy under different main branch opening angles ((A): 45°; (B): 65°; (C): 85°).
Agronomy 13 01058 g003
Figure 4. Daily variation patterns of carbon dioxide in summer (A) and autumn (B) within the canopy of peach trees with different main branch opening angles. * stands for multiplication.
Agronomy 13 01058 g004
Figure 5. Three-dimensional distribution of the relative light intensity in the canopy of the peach trees at the early stage of canopy formation. UP ((A): 45°; (B): 65°; (C): 85°); MID ((D): 45°; (E): 65°; (F): 85°); LOW ((G): 45°; (H): 65°; (I): 85°).
Agronomy 13 01058 g005
Figure 6. Three-dimensional distribution of the relative light intensity in the canopy of the peach trees at the end of the crown formation. UP ((A): 45°; (B): 65°; (C): 85°); MID ((D): 45°; (E): 65°; (F): 85°); LOW ((G): 45°; (H): 65°; (I): 85°).
Agronomy 13 01058 g006
Figure 7. Photosynthetic rate and photosynthetic products of leaves in different parts of the canopy. (A) Net photosynthetic rate; (B) SPAD value; (C) soluble sugar; (D) starch content. Different lowercase letters indicate significant differences between treatments (p < 0.05).
Agronomy 13 01058 g007
Figure 8. Differences in the stomatal morphology of leaves in different parts of the canopy. (A) Stomatal morphology; (B) stomatal circumference; (C) stomatal area. Different lowercase letters indicate significant differences between treatments (p < 0.05).
Agronomy 13 01058 g008
Figure 9. Effects of different main branch base angles on fruits quality in peach. (A) Friut weight; (B) average firmness of pulp; (C) soluble solid; (D) titratable acid. Different lowercase letters indicate significant differences between treatments (p < 0.05).
Agronomy 13 01058 g009
Figure 10. Correlation analysis between relative light intensity and leaf and fruit characteristics.
Agronomy 13 01058 g010
Table 1. Differences in peach tree canopy size with different main branch opening angles.
AngleHeight (m)East–West Crown Diameter (m)North–South Crown Diameter (m)
45°4.08 ± 0.07 a2.56 ± 0.15 b2.20 ± 0.10 a
65°3.82 ± 0.06 b3.10 ± 0.26 ab2.16 ± 0.25 a
85°3.01 ± 0.06 c3.36 ± 0.50 a2.46 ± 0.06 a
Note: Different lowercase letters indicate significant differences between treatments (p < 0.05).
Table 2. Effects of different opening angles on the composition of branches.
AngleShort Fruiting BranchMedium Fruiting BranchLong Fruiting BranchEpicormic BranchNew Shoot
Length (cm)
Main Branch Length (cm)Main Trunk
Length (cm)
45°79.3 ± 11.0 a59.3 ± 1.8 a60.3 ± 3.9 a5.0 ± 0.6 b37.8 ± 2.27 a4.07 ± 0.3 a21.67 ± 1.2 a
65°58.7 ± 5.2 ab54.7 ± 5.4 ab49.3 ± 1.5 b12.0 ± 2.1 a36.1 ± 1.89 ab3.83 ± 0.18 a16.67 ± 0.35 b
85°43.0 ± 6.1 b44.0 ± 2.6 b38.0 ± 2.6 c8.3 ± 0.9 ab29.56 ± 2.5 b2.73 ± 0.23 b9.33 ± 0.17 c
Note: Different lowercase letters indicate significant differences between treatments (p < 0.05).
Table 3. The proportion of light intensity under the different opening angles of the main branches in the early stage of crown formation (%).
AngleLocation<30%30–60%>60%
Upper15.249.135.7
45°Middle33.852.413.8
Lower56.535.28.3
Upper22.240.936.9
65°Middle39.552.77.8
Lower59.836.93.3
Upper3.416.979.7
85°Middle13.276.99.9
Lower39.558.12.4
Table 4. The proportion of light intensity under the different main branch opening angles in the final stage of crown formation (%).
AngleLocation<30%30–60%>60%
Upper33.947.218.9
45°Middle39.547.812.7
Lower56.137.86.1
Upper25.440.933.7
65°Middle30.957.811.3
Lower74.525.20.3
Upper5.930.863.3
85°Middle13.958.627.5
Lower54.5441.5
Disclaimer/Publisher’s Note: The statements, opinions and data contained in all publications are solely those of the individual author(s) and contributor(s) and not of MDPI and/or the editor(s). MDPI and/or the editor(s) disclaim responsibility for any injury to people or property resulting from any ideas, methods, instructions or products referred to in the content.

