1. Introduction
Cotton fiber length is naturally variable due to the indeterminate growth of cotton plants, genetic background, environmental factors, agronomic practices, harvesting, and post-harvesting handling [
1,
2]. Cotton bolls within a plant do not appear on the plant at the same time. Therefore, at the time of harvesting, fibers in the bolls appearing late in the season are typically less mature and, as such, are more likely to break during harvesting and post-harvesting handling [
3]. Furthermore, the lengths of all of the fibers on a single seed surface are not the same. Environmental factors such as the temperature, soil pH, humidity, and organic matter content contribute to the variability in cotton fiber length among plants [
4,
5,
6,
7]. Additionally, different harvesting techniques could result in different levels of fiber length variation [
8,
9,
10,
11,
12]. Spindle picker harvesters capture seed cotton only from well-opened bolls that typically contain mature fiber. Alternatively, mechanical stripper harvesters capture fiber from a larger percentage of all bolls, including those containing less mature fibers that have a higher propensity to break during post-harvest processing. Compared to picker-harvested cotton, stripper-harvested cotton requires additional cleaning at the gin to remove undesirable vegetative foreign material from the lint. These cleaners are aggressive and generate more short fiber content due to breakage [
9,
13,
14]. All of these factors contribute to the variation in length within one bale as well as among bales. The within-sample variation in fiber length influences the yarn processing performance and, hence, the yarn quality [
15,
16,
17].
Cotton bales with long staple-length fibers produce finer and stronger yarns than the bales with short staple-length fibers considering all the other fiber properties as being identical [
15,
17,
18]. However, the average length of the longest fiber is not the only important fiber length parameter in the cotton industry [
19,
20,
21,
22]. The complete fiber length distribution also affects yarn quality [
17]. Cotton bales with higher within-sample variation in fiber length will result in poorer yarn quality [
23] and can also cause more stoppage during processing which reduces the efficiency of yarn processing and increases waste. Therefore, textile mills need to know the within-sample variation in fiber length to determine the quality of their end product and optimize the machine setup accordingly.
The HVI is the most widely used instrument to characterize the fiber length information along with fiber strength, micronaire, color, and trash. Two length parameters, UHML and UI, are currently reported using the HVI, where UI is the ratio of mean length (ML) to UHML expressed as a percentage. These fiber length measurements are used in US cotton classification and in the cotton marketing system. Spinning mills purchase cotton bales based on their fiber properties measured using the HVI. Cotton breeders also primarily rely on the HVI for screening their germplasm to select breeding lines with improved fiber length. However, these two length parameters, UHML and UI, are not enough to characterize the complete within-sample fiber length variation [
20,
24].
Fiber length measurements via the HVI follow the fibrogram principle proposed by Hertel in 1940 [
25]. Hertel’s fibrogram theory was based on a fiber beard prepared from a sliver. Later, Chu and Riley modified Hertel’s theory which applies to a fiber beard prepared using the fibrosampler [
26,
27]. In this setup, a comb clamps fibers from a fibrosampler and prepares a fiber beard [
26]. This fiber beard is then brushed to remove extraneous material and floating fibers before being scanned between a row of red light-emitting diodes (LEDs) and a row of sensors. The fiber beard scanning starts at 3.81 mm (0.15 inch) away from the comb and travels toward the tip of the fiber beard [
28]. As it moves, the HVI system records the amount of optical light absorbed versus the distance traveled by the beard. It is assumed that the point at which scanning starts (3.81 mm from the comb) contains the greatest number of fibers. For the purpose of normalization, this point is considered to exhibit 100% light attenuation. As the LED–sensor platform travels toward the tip of the fiber beard, fewer and fewer fibers are available to be scanned until it reaches a point where there are no fibers, resulting in zero percent attenuated light. The function of attenuated optical light against the traveled distance is called the fibrogram curve (
Figure 1). The HVI system uses this curve to measure UHML and ML, which are used to report UHML and UI.
Over time, breeders have been able to improve the cotton fiber staple length (
Figure 2). However, their efforts have not resulted in improved UI (
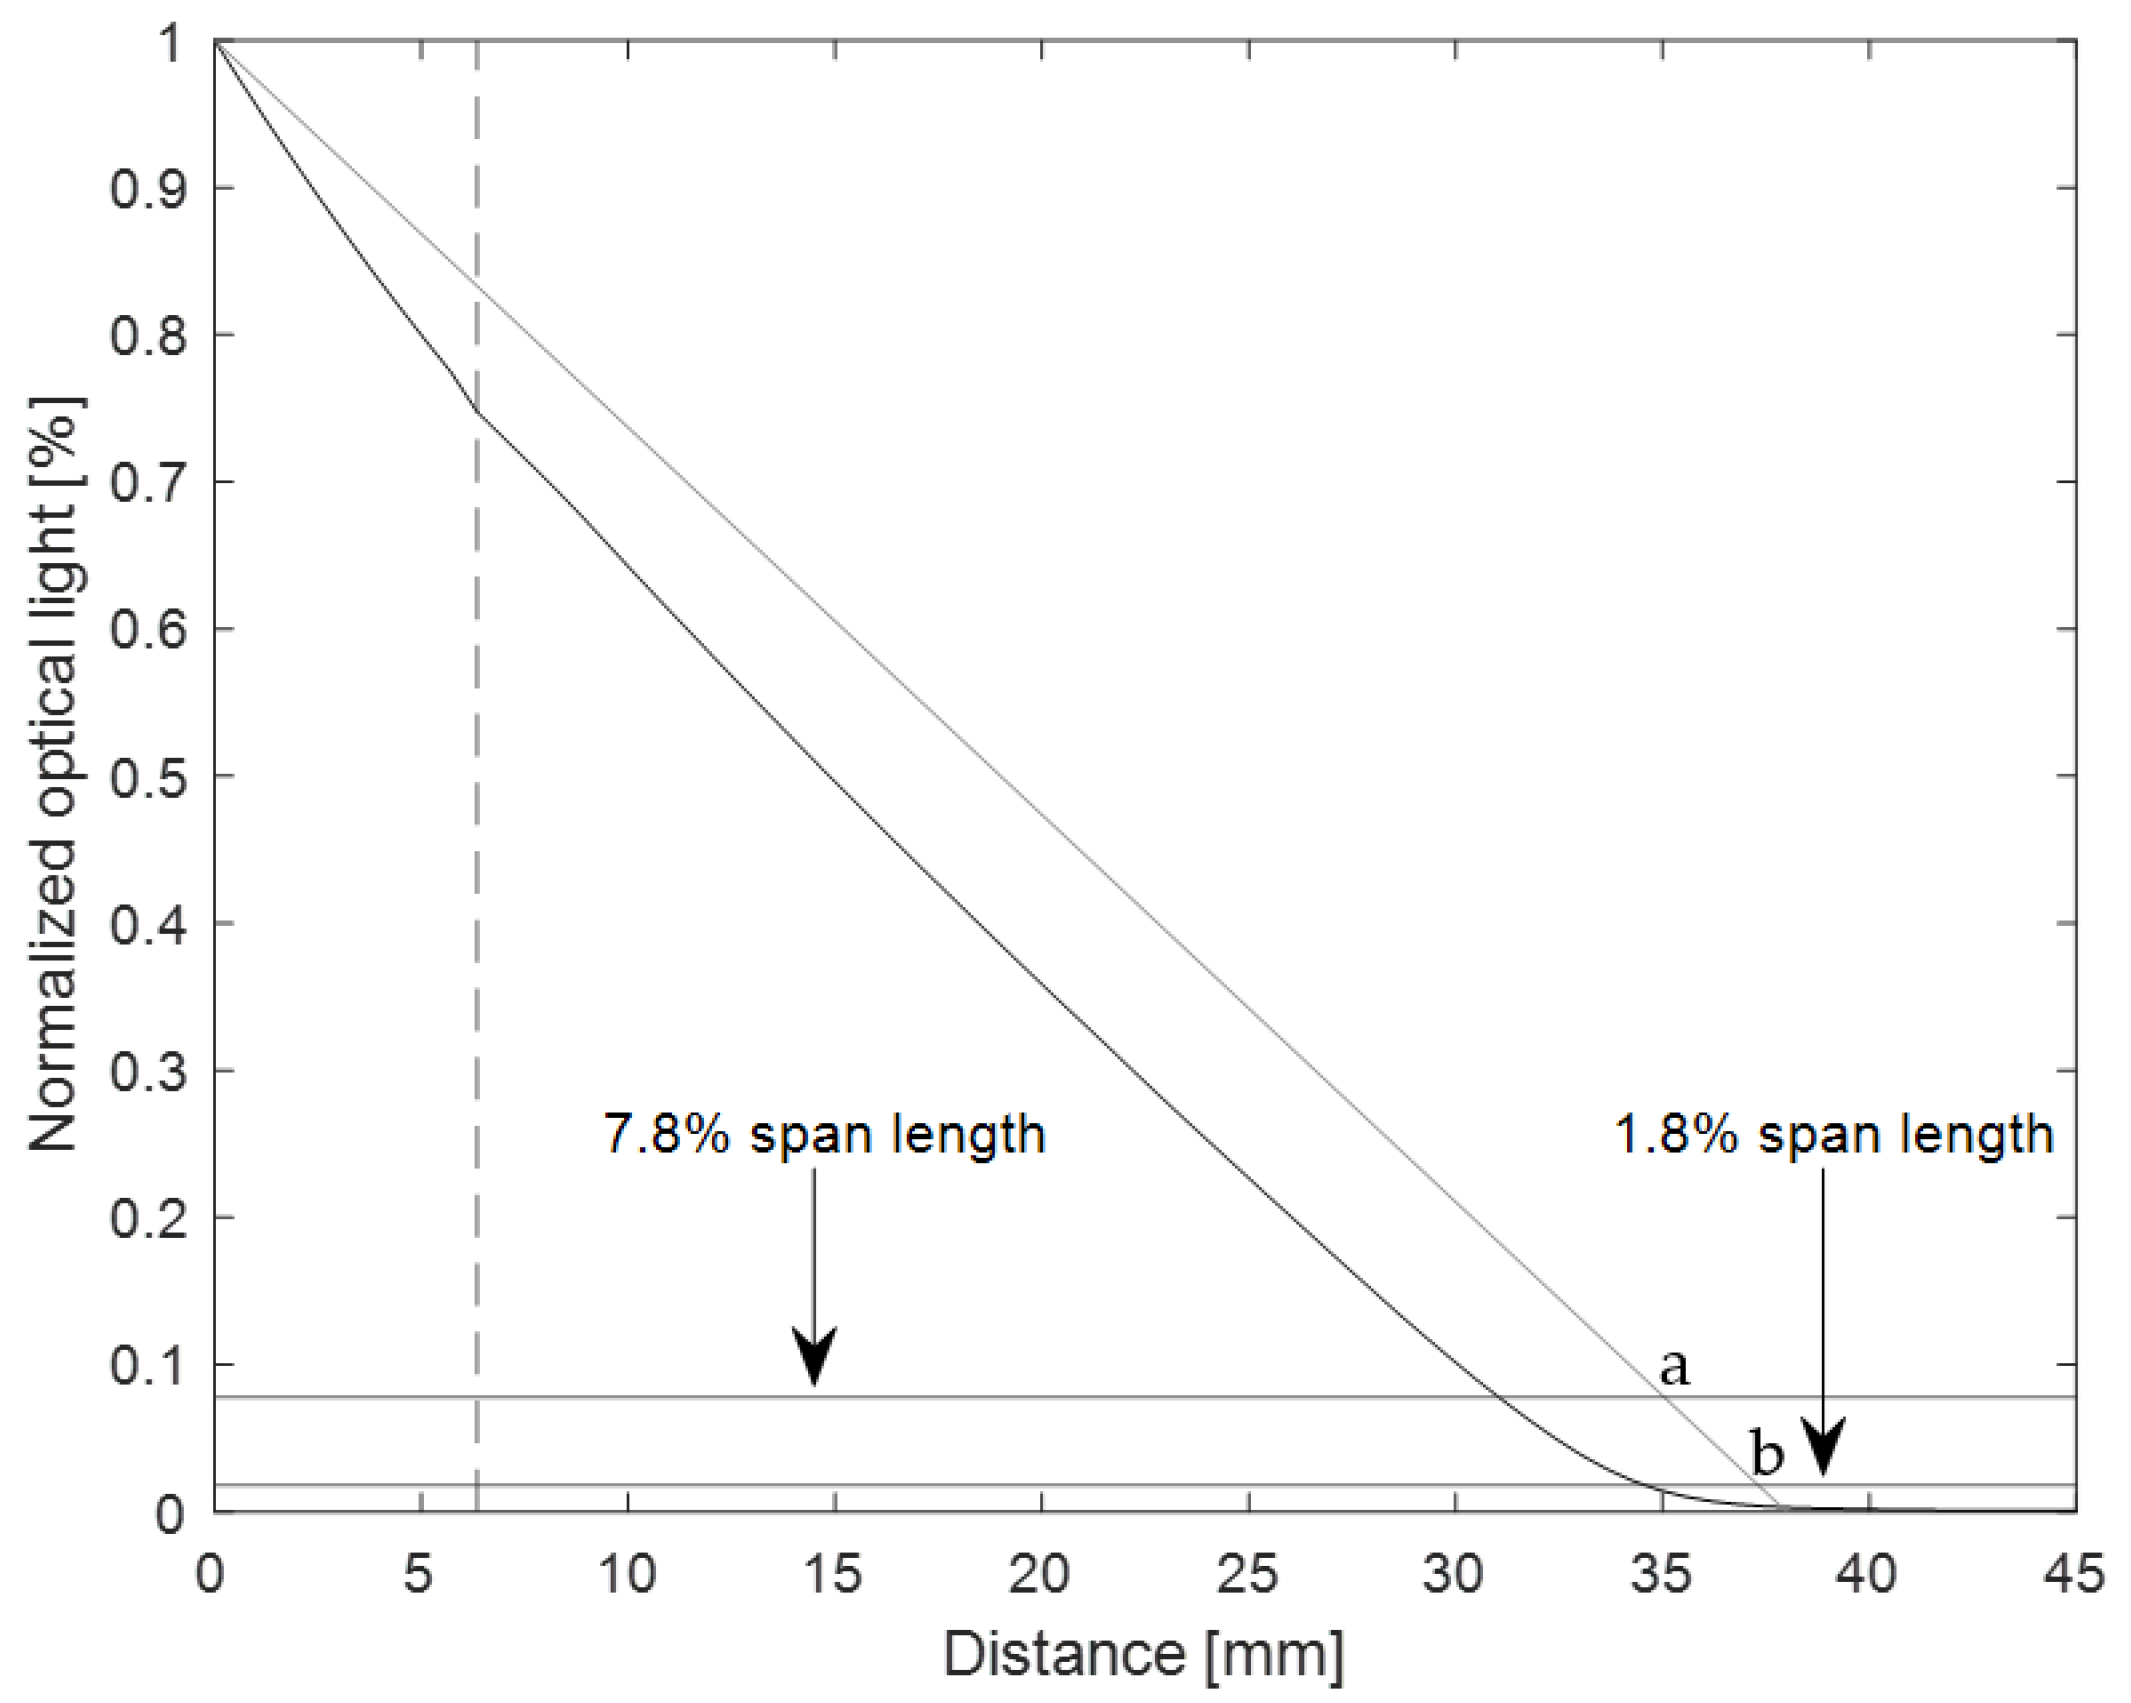
Figure 3). The average UI of the cotton fiber length was about 81% in 2010, and in 2021, it was still approximately 81%. The reason behind this could be that the UI is not a good fiber length parameter to characterize the length uniformity. In 2021, Sayeed et al. showed that UHML and ML measured using the HVI were highly correlated (R
2 = 0.95), meaning that the HVI-reported UI is the ratio of 2 similar fiber length measurements [
24]. They also showed that the UHML and ML represent the 1.8% and 7.8% span lengths, respectively, in the fibrogram curve, which only represents the longest fibers. These research findings demonstrate that the current HVI system does not consider the whole fibrogram curve while reporting the UI of a sample. Therefore, it does not represent the uniformity of the whole cotton sample.
As for the current UI, it is impossible for the HVI to report 100% uniformity. The current UI is the ratio of two span lengths (7.8% as ML and 1.8% as UHML) from the fibrogram (
Figure 1). For an ideal mono-length sample (more details later), the fibrogram would be triangular. For a triangular fibrogram, 7.8% span length and 1.8% span length cannot be equal, meaning that the ratio of these two measurements cannot be 100%. Because the current UI is not a very relevant fiber length parameter, the U.S. cotton marketing system does not provide a significant premium or discount for this parameter (
Table 1). When shorter staple-length cottons are heavily discounted and longer staple-length cottons receive a high premium price, low uniformity or high uniformity does not either become discounted nor obtain a high premium price. In
Table 1, the premium and discount points for the UI are very low in comparison to the premium and discount points for cotton fibers’ staple length. Therefore, it is important to find an alternative method that is still fast and reliable to measure cotton fiber length uniformity.
The importance of cotton fiber qualities is not the same for different types of spinning technologies, nor is it the same for different yarn quality targets. For example, fiber length is the most important parameter for the dominant spinning system, ring spinning, while strength is the most important parameter for rotor spinning. Fine and strong yarn requires long, strong, mature, and fine fibers. In order to make the spinning process cost-effective, the textile industry is continually developing more automated and faster technologies. Ring spinning technology is becoming faster over time, which increases the aggressiveness of the process, which, in turn, requires better-quality fibers to reduce the fiber breakage during processing. Due to the increasing labor cost and higher demand from the consumer, the textile industry is looking for alternative spinning technologies such as Airjet or Vortex spinning [
31,
32]. Airjet spinning produces yarn directly from a sliver which reduces roving and winding and saves labor, space, and time. Airjet spinning is 3 times faster than rotor spinning and 20 times faster than ring spinning [
13]. In addition to the speed, Airjet spinning could produce spun yarn that could be competitive with ring spinning in some cases, such as 30 Ne of spun yarn which is the target market for U.S.-grown cotton [
13]. Airjet spinning technology was originally designed to spin synthetic fibers and is highly sensitive to the within-sample variation in fiber length. High within-sample variation in fiber length prohibits using cotton as a raw material in Airjet spinning. Modification of the fiber length distribution with combing is a possible solution to this issue. The process of combing removes shorter fibers and increases waste, resulting in a lower profit for the textile mills. To meet the fiber quality demands of Airjet spinning technology, cotton breeders need to improve the within-sample variation in fiber length. However, to accomplish this, they need a more accurate measurement of this property than what is currently provided by the HVI.
In recent years, there has been a lot of work conducted to illustrate the use of the complete fibrogram to characterize fiber length information. In 2021, Sayeed et al. demonstrated that the whole fibrogram curve captures additional fiber length information than what is provided by the current HVI length parameters [
24]. Later, they developed a method to calibrate the whole fibrogram and showed that the whole fibrogram could be calibrated to bring the measurement to a similar level across multiple HVIs [
33]. Addisu et al. showed that several span lengths can be calibrated to compare the fibrogram measurements across multiple HVIs [
34]. Addisu et al. also showed that the fibrogram measurement is stable over a short-term and long-term period, meaning that measurements based on the whole fibrogram curve could be used across the cotton industry. Turner et al. developed an algorithm to reconstruct the fiber length distribution from the fibrogram, which allows for calculating any fiber length parameters [
27]. Some of the mathematical aspects of this algorithm were used in this research experiment.
In this research, we are proposing an alternative method to calculate the uniformity of a cotton sample using the complete HVI fibrogram curve. Then, we show the yarn quality prediction power of the newly calculated length uniformity compared to the current HVI UI.
2. Proposed Method to Measure Cotton Fiber Length Uniformity
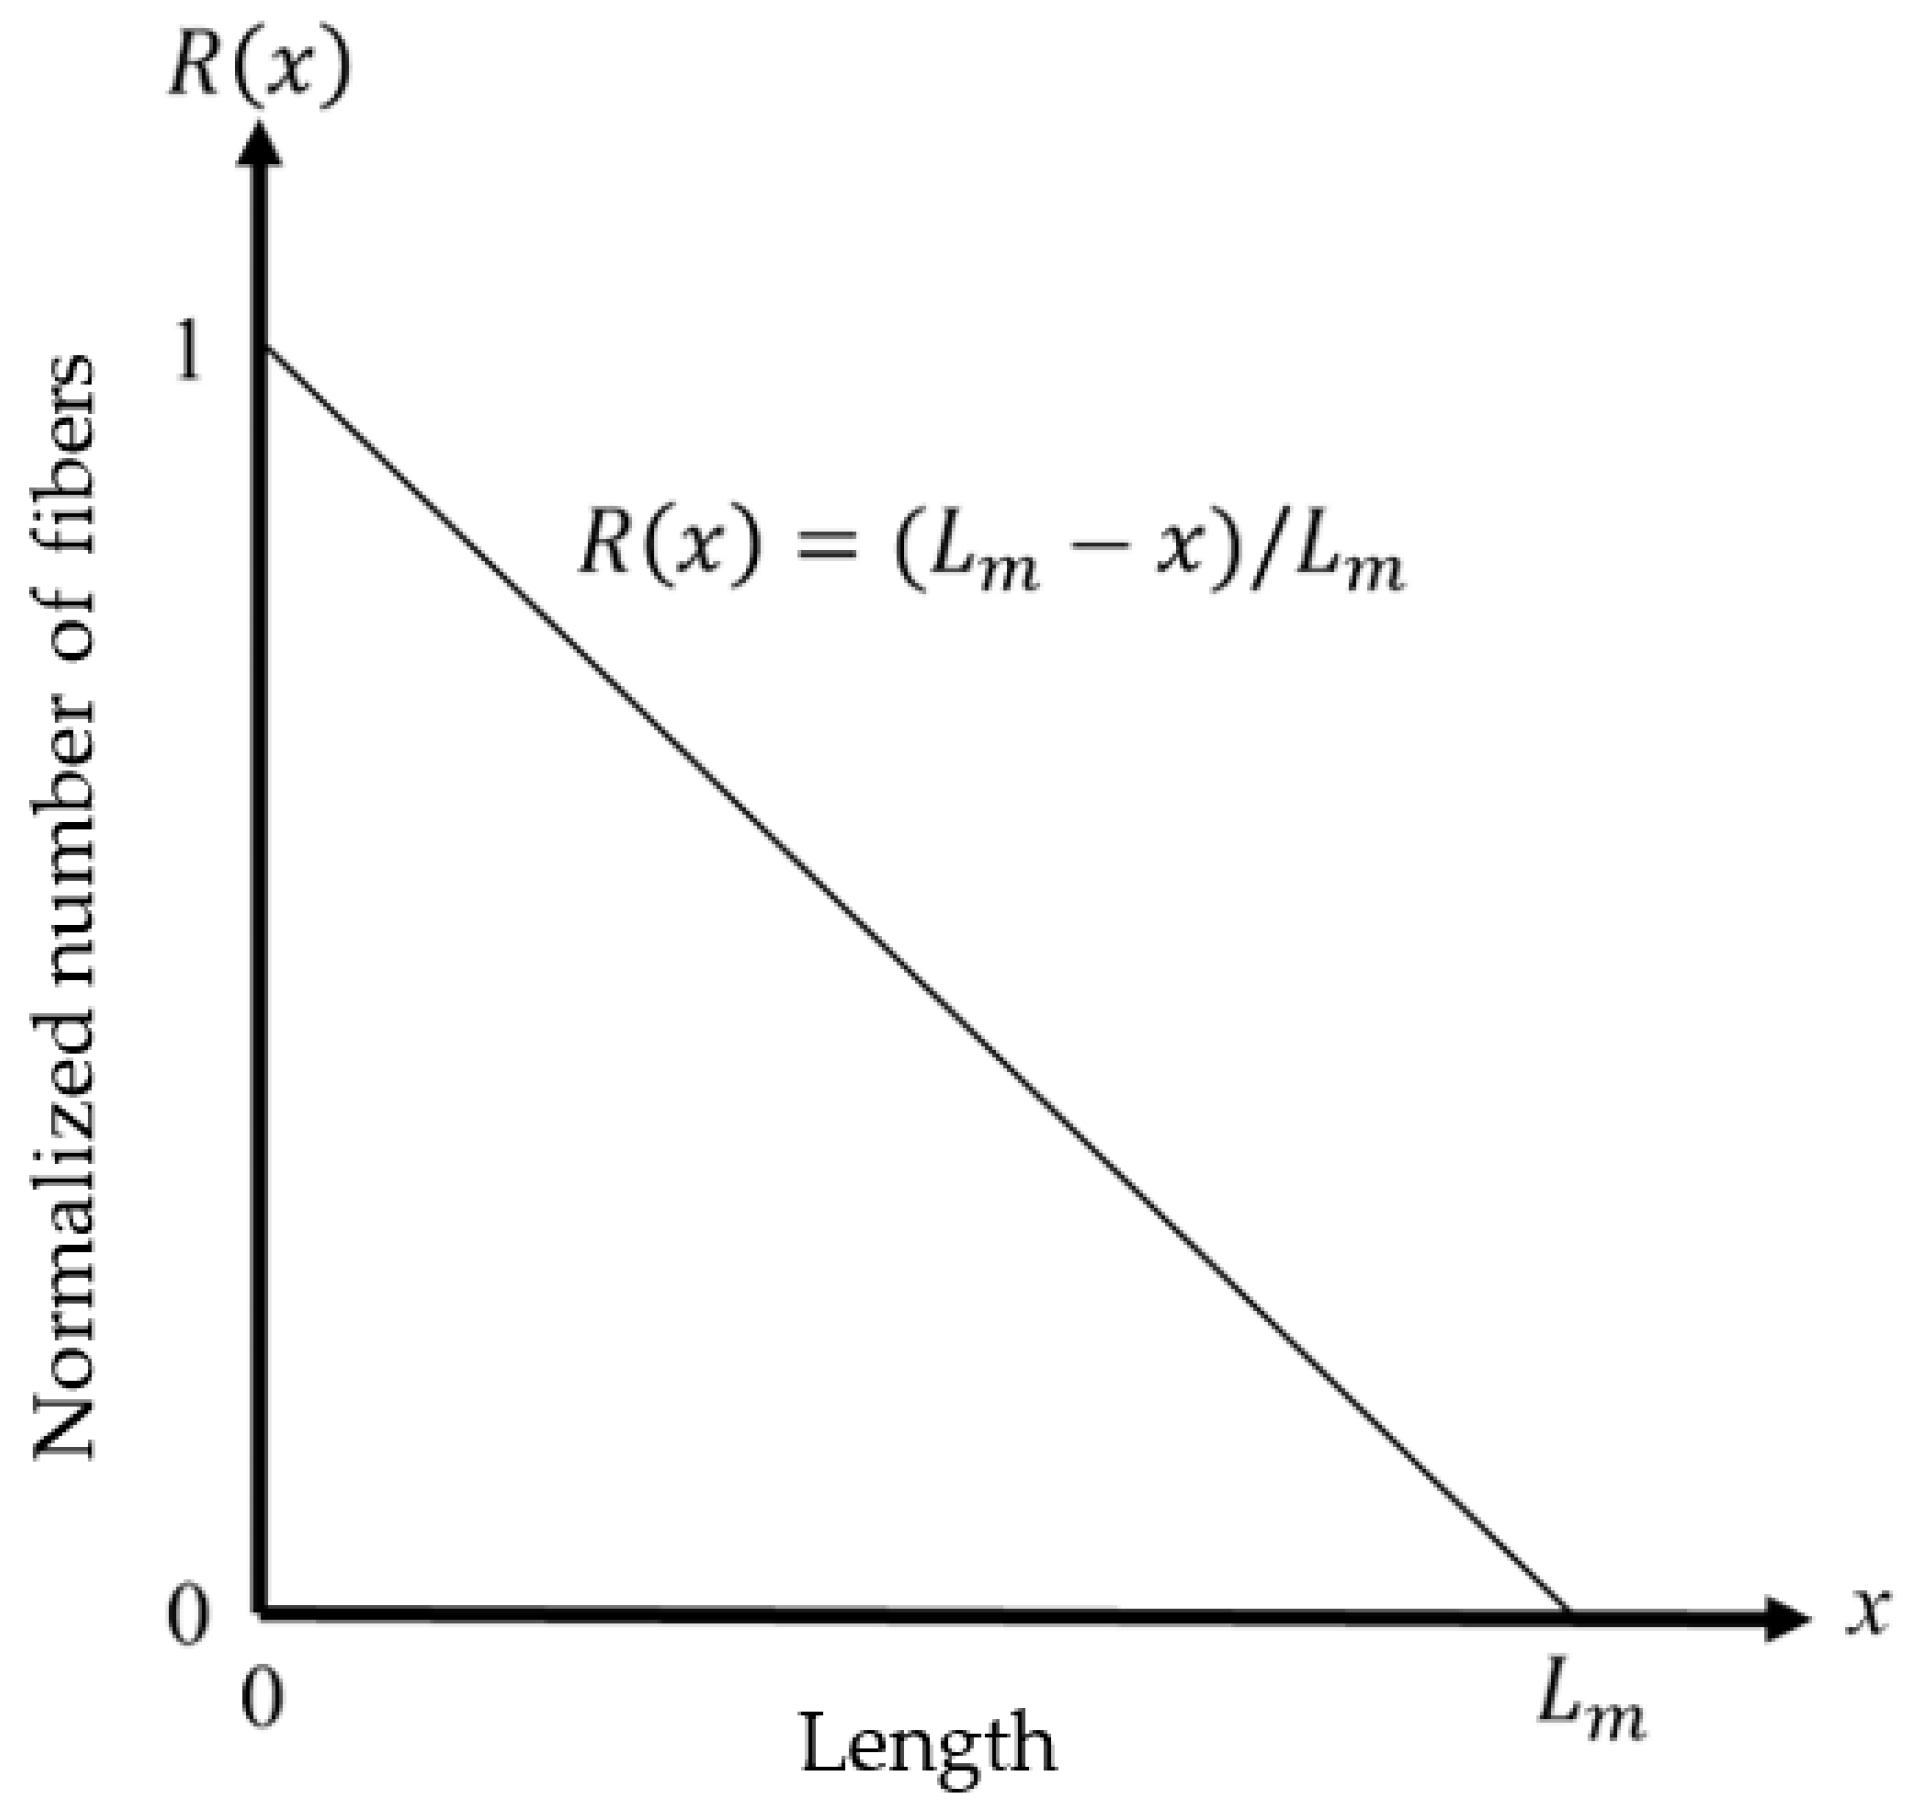
Based on the theory proposed by Chu and Riley, the equation of a fibrogram,
R(
x), is given as
where
Lm is the length of the longest fibers in the sample and
n(L) is the length distribution of the fibers in the sample. Consider a mono-length sample of length
Lm; in which case, the distribution,
n(L), is an impulse function, i.e.,
n(Lm) = 1 and
n(L) = 0 ∀
L ≠ Lm. In this case, the fibrogram is a straight line, i.e.,
While
Figure 4 represents a theoretical extreme, it is important to note that in real samples, other factors such as trash, leaf, and seed coat fragments could influence the beard preparation and subsequent scanning [
35,
36] (Hertel, 1964; Krowicki and Thibodeaux, 1990; Morais et al., 2020). Furthermore, Turner et al. discussed the occurrence of concavities in the HVI fibrogram due to the above-mentioned artifacts, as well as light interaction with the comb when the comb is near the sensors [
27].
Therefore, if no other factors influence the HVI fiber beard scanning, then a fiber beard prepared from a mono-length fiber sample would produce a straight line (triangular fibrogram). However, cotton is naturally variable. Thus, testing a cotton fiber beard with the HVI produces fibrogram curves that deviate from the triangular shape due to the within-sample variation in length (
Figure 5). A sample with a greater quantity of shorter fibers deviates more from the straight line.
Based on the above assumption, we propose to calculate the ratio of the area under the two curves, i.e.,
where UA stands for uniformity by area. Chu and Riley showed that the area under the fibrogram curve is half of the mean length of the sample [
26]. Furthermore, we know that for a theoretical mono-length sample, the mean length is
Lm. Thus, Equation (3) can be rewritten as
where
ML is the mean length and
Lm is the length of the longest fibers in that sample. This representation reveals that the ratio of the area under the two curves in
Figure 5 is the ratio of the mean length to the length of the longest fibers in the sample.
3. Materials and Methods
To demonstrate whether the HVI follows the fibrogram principle, one man-made fiber, a viscose sample, was used in this experiment. In addition, to characterize the new length uniformity (UA) and investigate its usefulness, three sets of cotton samples were used in this experiment. All of these samples were conditioned at 21 ± 1 °C and 65 ± 2% RH for at least 48 h prior to testing.
3.1. Determine the Longest Fibers in the Sample and Extrapolate the Unscanned Portion of the Fibrogram
As previously mentioned, the HVI begins scanning the fiber beard at 3.81 mm. It also continues scanning the beard up to 54.61 mm (2.15 inch) away from the comb, which is beyond the length of the longest cotton fibers. To apply the method proposed above, one must (1) estimate the initial missing part of the fibrogram (0 mm to 3.81 mm) and (2) determine the length of the longest fibers, Lm, i.e., the point at which the fibrogram reaches 0. Turner et al. proposed a method to recover the fiber length distribution from an HVI fibrogram, which, as part of the algorithm, achieved both of these objectives [
27]. They suggested that the initial part of the fibrogram can be estimated using an exponential of the form
Coefficients
a,
b, and
c were estimated using the given fibrogram data from 6.35 mm to 12.7 mm. Then, the data from 0 mm to 6.35 mm were reconstructed using
g(
x). Note that this also “overwrites” the original data from 3.81 mm to 6.35 mm, which, according to the authors, is unreliable data due to concavities in this region of the fibrogram. Additionally, according to Turner et al., the end of the fibrogram (i.e., the length of the longest fibers) can be determined when either a) the value of the fibrogram is zero or b) the first derivative of the fibrogram is greater than or equal to zero—whichever comes first [
27].
3.2. Fibrogram Theory in Practice
Our first experiment was designed to investigate how close the HVI can get to the theoretical extreme expressed by Equation (1). To this end, we selected a viscose sample and a man-made cellulosic fiber, with a fixed fiber length of 38 mm and linear density of 1.3 dtex, sourced from Lenzing (Lenzing Fibers, Inc., Axis, AL, USA). In order to make the fibers testable with the HVI, the fibers in the sample needed to be randomly oriented to resemble a sample of raw cotton lint. This was achieved by processing the viscose sample using a mechanical processor (Shirley Analyzer 2), which is aggressive and may break some fibers. The viscose sample was tested for 30 replications of length on the HVI which included the fibrograms, and the average of these 30 replications was visualized.
3.3. Characterization of UA
In order to characterize UA, we needed a set of samples representing a wide range of fiber lengths. Every year, the Fiber and Biopolymer Research Institute (FBRI) receives approximately 3000 USDA commercial samples, which represent the cotton produced across 17 cotton-producing states in the U.S. In 2018, a set of 991 commercial samples from the population of ~3000 samples was selected for this experiment. These samples were tested following an HVI research protocol 4-4-10 (4 micronaire, 4 color/trash, and 10 length/strength) which included 10 replications of fibrogram.
The range of the UI of these samples was 74.50% to 85.20%, and the UHML ranged from 0.94 inches to 1.29 inches. They also exhibited a wide range for other fiber quality parameters such as micronaire, strength, elongation, yellowness (+b), and reflectance (Rd) (
Table 2).
After retrieving the fibrogram, the unscanned portion of the fibrogram curve was extrapolated. An equation was fitted to the curve after determining the end of the fibrogram following the method developed by Turner et al. From the fitted fibrogram curve, the new length uniformity by area was calculated using the proposed method above and then compared with the current UI.
3.4. Analyzing Fiber Length Distribution Measured Using Advanced Fiber Information System (AFIS)
In order to investigate the shape of the fiber length distribution based on the UA calculated from the fibrogram, samples were also tested using the Advanced Fiber Information System (AFIS) with 3 replications of 3000 fibers for fiber length distribution by number. We analyzed the new UA to see whether it could be used to identify the shape of the AFIS length distribution by number.
3.5. Usefulness of New Length Parameters
Within-sample variation in fiber length depends on genetic background, environment, and processing [
1,
3]. Breeder samples and commercial samples are not the same in terms of genetic background, and agronomic practices are different. Breeders’ samples are grown on small-scale plots and typically exhibit a wider range of fiber quality than commercial samples. Harvesting, ginning, and other mechanical processing methods are different between these sample types. Therefore, it is important to determine how this newly calculated fiber length uniformity performs for both commercial samples and breeder samples. For this, we selected 60 Plains Cooperative Improvement Committee (PCIC) samples representing commercial-like varieties and 127 samples representing highly diverse fiber qualities. These two sets of sample data were used in one of our previous publications [
24].
3.5.1. Commercial-like Samples
Twelve varieties were grown in five different locations across the Texas High Plains in the 2016 crop year. Samples were harvested using a commercial-like stripper harvester (John Deere 7460 stripper) and ginned with a continental 93-saw gin Double eagle (1575 mm wide) at the United States Department of Agriculture (USDA) Agricultural Research Service (ARS) Cotton Production and Processing Research Unit in Lubbock, Texas.
3.5.2. Breeders’ Set
The breeders’ sample set contains a wide genetic background. Some of the samples were breeders’ lines, some were developed without HVI screening, and some were commercially grown varieties. These samples were grown with one field rep at the Weslaco Research and Extension Center in Weslaco, Texas.
Both sets of samples were measured using an HVI research protocol of 4-4-10 (4 micronaire, 4 color and trash, 10 lengths and strengths including fibrograms) at the Texas Tech University Fiber and Biopolymer Research Institute. Using the method described above, the UA was calculated for each rep and averaged over the 10 reps per sample.
3.6. Yarn Production
As the target market for U.S. cotton is 30 Ne ring-spun yarn, our goal was to investigate yarn quality prediction for this type of yarn. This was possible for the commercial-like samples; however, due to the wider range of fiber quality of the breeders’ set, some samples could not be spun at 30 Ne due to a lower fiber quality. Therefore, a coarser count, 24 Ne, was selected for this set of samples. At least 10 lbs of cotton lint for each of the samples was used for the yarn production.
3.6.1. Commercial-like Samples
Card slivers were produced from the commercial-like samples using a Truetzschler (DK 903) card with a production rate of 54 kg/h. To minimize within-sliver mass variability, card slivers were drawn twice with speeds of 548 and 365 m/minutes. A ring spinning frame (Suessen, Fiomax1000) was then used with a speed of 14,588 rpm and a twist multiplier (TM) of 3.62 to produce 10 bobbins of 30 Ne yarn.
3.6.2. Breeders’ Set
A Rieter card (C4) was used to produce card slivers with a production rate of 9 kg/h. The drawing speed for card slivers was 275 m/minute. Then, the same ring spinning frame (Suessen, Fiomax1000) as above was used with a speed of 13,588 rpm and a TM of 3.75 to produce 10 bobbins of 24 Ne yarn.
Yarn tensile properties were then measured using the STATIMAT DS (Textechno STATIMAT, Textile Testing Technology, Mönchengladbach, Germany) on 20 single-end breaks, along with the yarn count on each bobbin at 220 m. The yarn evenness was tested using the Uster Tester 5 (Uster® Technologies AG, Uster, Switzerland) on 400 m of yarn per bobbin.
3.7. Yarn Quality Prediction Models
Cotton fiber quality parameters are used to estimate the quality of the end product, yarn. Intercorrelation among fiber properties could result in the overfitting of the yarn quality prediction models. Therefore, to evaluate the effectiveness of the newly calculated uniformity by area, it is important to use a statistical technique that can eliminate multicollinearity. As such, partial least square regression was used to develop the prediction models.
Two Partial Least Square Regression Models Were Developed
Model 1: Non-length HVI parameters + UHML, UI (both reported by HVI)
Model 2: Non-length HVI parameters + UHML (reported by HVI), UA
In each model, the non-length HVI parameters refer to strength, elongation, micronaire, reflectance (Rd), and yellowness (+b). The effects of these non-length parameters on yarn quality are well established (Sayeed et al., 2021; EI Mogahzy, 2001) [
6,
24]. To investigate each model’s performance, leave-one-out cross-validation was performed, where we took one sample out and developed the prediction model using the rest of the samples. Then, we predicted the yarn quality of the sample we took out using the model and calculated the error of the prediction. Finally, the average R
2 of the training sets for each model was calculated as well as the mean squared error (MSE) of the predictions for each removed sample.
5. Conclusions
The current length uniformity measurement reported by the HVI, UI, does not represent the total within-sample variation in fiber length. Instead, it is the ratio of two highly correlated span lengths in the fibrogram curve and ignores a large portion of the curve. The results presented in this article demonstrate that the proposed method of calculating a new length uniformity, UA, using the complete fibrogram curve potentially offers a better alternative for quantifying variation in fiber length within a sample.
The investigation of the new length uniformity (UA) and current UI measurement based on 991 commercial samples showed that the UA captures better length uniformity than the UI. The UA can be useful for breeders and other researchers to perform preliminary screening to eliminate samples that exhibit a higher amount of shorter fibers in a sample without testing them using AFIS.
The yarn prediction results based on commercial-like samples demonstrate that the new length uniformity can explain and predict yarn quality better than the current UI. As textile industries solely depend on the HVI fiber qualities when purchasing cotton bales, this new information could help them to make better decisions. This new length uniformity could also lead spinning mills to better optimize their machine setup, which, in turn, could lead to better processing performance and higher profits.
Based on the results obtained, it could be concluded that the UA could be an alternative to the UI to better characterize the total within-sample variation in fiber length. This improvement could be made without the need for any additional testing or additional infrastructure. It would only require developing software to capture the whole fibrogram curve at the same time that a sample is tested and perform the proposed analysis.
While these results are promising, further research is required. The results obtained for the two prediction models using commercial-like samples need to be validated on a large set of commercial bales. Currently, UHML and ML are calibrated on the HVI. To implement the proposed UA, a calibration process would need to be developed. This would require the identification of appropriate calibration cotton and the development of calibration standards.


 ,
, 


