1. Introduction
The origin of wheat is Southwest Asia, Türkiye, Syria, Iraq and Iran [
1,
2]. Small farmers in Türkiye, a prominent wheat gene center, still cultivate einkorn (
Triticum monococcum L.) and emmer (
Triticum dicoccum L.) wheat varieties, which are considered precursors to modern wheat [
3,
4]. The einkorn and emmer wheat varieties are considered significant genetic resources for increasing both the yield and quality of wheat as part of wheat breeding initiatives [
3].
Cultivars have grown more genetically uniform and contain less genetic variability than their local varieties, transitional forms and wild relatives [
5]. When local types are improved using the correct selection method, they have the potential to be used in plant breeding studies to increase genetic diversity [
6,
7]. It is essential to recognize the relationship between improved agronomic traits and their mutual influence. Knowing the means by which wild-grown genotypes increase seed yield will contribute to proper selection [
8]. For this purpose, the use of correlation analyses is common [
9]. However, in order to properly determine the relationship between yield and agronomic traits for plant breeding studies, more sophisticated analysis techniques are needed than are found in the literature, i.e., multivariate adaptive regression splines (MARSs) algorithms and chi-square automatic interaction detectors (CHAIDs) [
10].
MARS is a non-parametric regression technique that detects the complex relationship between predictors and response variables [
11]. It has been found that MARS modeling can enable plant breeders to establish agronomic traits that positively influence yield traits vis a criteria indirect selection framework in plant breeding studies [
12]. In this regard, several previous studies on path analysis for different plant species can be found in the literature [
13]. For example, through correlation and path analyses, Janmohammadi et al. [
14] positively identified agronomic traits associated with grain yield in bread wheat. However, the application of a predictive model built by the MARS algorithm, without the need for distributional assumptions and functional variables, to different plant species is still rare in plant breeding research [
12].
A regression tree is a method of analysis that detects the relationship and interaction between independent and dependent variables [
15]. The hierarchical tree structure of decision tree algorithms makes them easy to understand and use for classification and regression [
16]. Additionally, regression trees and the CHAID algorithm are used to determine the relationship between independent and dependent variables [
17]. CHAID is a technique that performs Bonferroni correction to calculate adjusted
p-values at the split points of a regression tree created for a continuous response using an
F-significance test with ten-fold cross-validation [
11]. CHAID has been successfully used to predict crop fields based on sunflower plant traits [
10]. It has also been used to estimate the water requirement of maize at different growth stages [
16].
To the best of our knowledge, the description of the relationship between grain yield (GY) and agronomic traits of current wheat genotypes under microclimate conditions has not yet been documented using MARS or CHAID analysis. Therefore, the present study attempts to determine the agronomic traits positively affecting the GY of these 26 wheat genotypes (which have different levels of ploidy) under the microclimate conditions of Igdir province in the eastern part of Türkiye, by means of correlation analysis (CHAID) techniques, and in particular used MARS analysis as a powerful non-parametric regression technique that allows for describing multivariate relationships between sets of dependent factors and predictors.
4. Discussion
Landraces are considered important genetic sources for the development of new cultivars due to their exceptional resistance to conditions featuring both biotic and abiotic stress factors [
32,
33]. In studies, landraces have been shown to be very useful sources for breeding due to their considerable variation among populations [
34,
35]. In the present study, the range of variability remained high. This is evidenced by the large difference between the lowest and highest values of the observed variables for the wheat plant studied (
Table 4). Significant coefficients (
p < 0.0001) were found for all variables.
Correlation analysis is used to measure the relationship between pairs of different agronomic traits, and the information obtained can be used to determine agronomic traits positively related to crop yield as part of the intermediate selection criteria to improve crop yield for breeding purposes [
36,
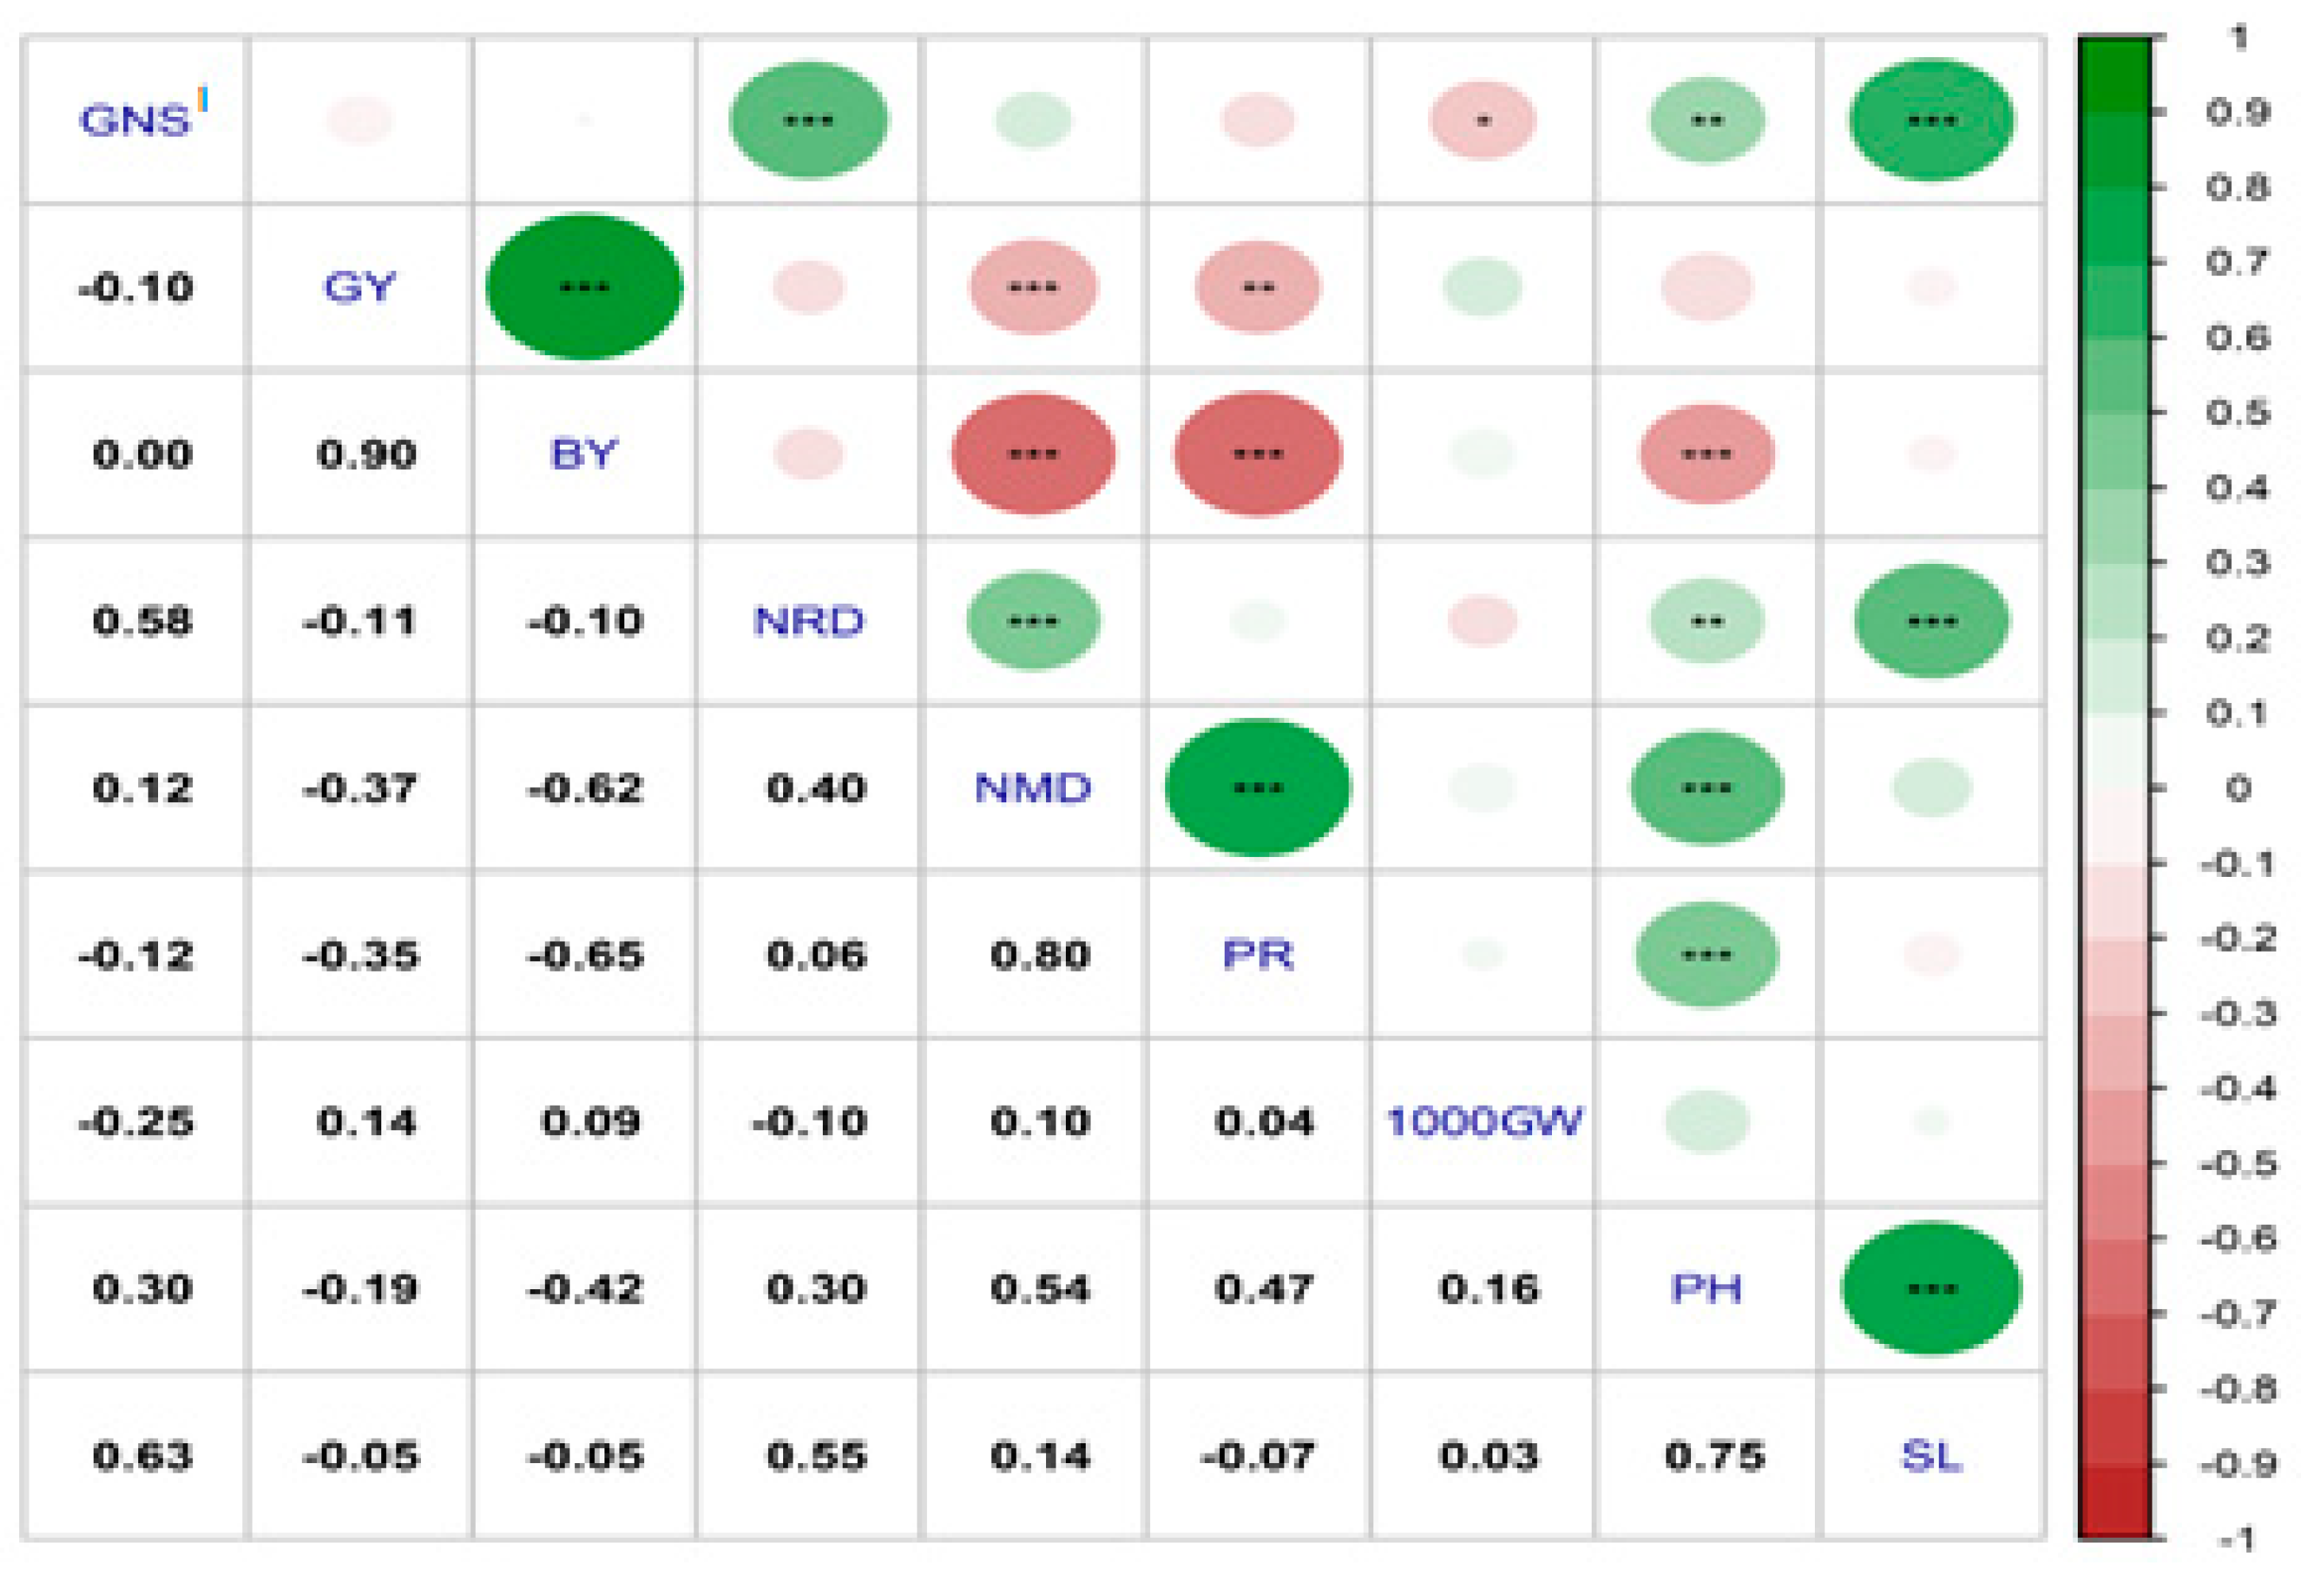
37]. The results show that BY has a significant positive correlation with grain yield, but NMD, PR and PH are significantly negatively correlated with grain yield (
Figure 2). Aydogan and Soylu [
38] reported significant negative correlations between GY and PR. Polat et al. [
8] reported a significant positive relationship between PH and SL. Çığ and Karaman [
39] found a significant positive correlation between BY and GY. İpeksever and Özberk [
40] showed a significant positive correlation between NMD and NRD. Yağmur and Kaydan [
41] obtained a significant positive correlation between PH, SL, and GNS and SL. Kara and Akman [
42] found a significant negative correlation between 1000-GW and GNS. In addition, they noted a significant positive correlation between GNS and SL. Güngör and Dumlupinar [
43] showed a significant positive correlation between SL and GNS. The correlation results in the present study are consistent with these findings.
Wheat yield prediction is based on a number of factors, including crop area, production, rainfall, genotype and climate conditions, among others [
44]. Understanding how one or more of these components work can help produce more precise estimates. In this context, the correct determination of grain yield estimate is strongly linked to the use of effective statistical methods, particularly data mining algorithms such as MARS and CHAID [
44,
45]. This is because these approaches are closely related to the use of effective statistical techniques. It is also important that the statistical techniques used to predict GY based on specific traits, which can vary even between species, have a high level of accuracy.
Using MARS and CHAID algorithms, various GY prediction models can be developed for this study. Within this context, the performance of the models is evaluated according to goodness-of-fit criteria [
39].
Table 6 shows the presentation of the model that resulted from the MARS analysis. The SD coefficient value (0.203) for the MARS algorithm was less than 0.40 and represented a good fit. Grzesiak and Zaborski [
28] stated that a good model fit was satisfactory if the SD coefficient was less than 0.40, and Eyduran et al. [
24] confirmed this. The MARS model explained 95.7% of the total variance (
Table 5). Several previous studies [
9,
10,
11,
24] are available on the application of the MARS algorithm in agricultural science. The better performance of MARS modeling studies has been reported in describing the relationship between different agronomic traits in soybean varieties for plant breeding purposes [
12]. However, there is a lack of information on the prediction of GY based on several agronomic traits in wheat. Therefore, further studies on GY prediction may become more importance. These results will allow plant breeders to gain valuable insights related to wheat breeding programs.
Regression trees and CHAID analysis methods are easy to understand visually because their assumptions are smaller than those of other statistical methods [
17]. The SD coefficient value (0.301) for the CHAID algorithm was less than 0.40 and represented a good fit. Eyduran et al. [
24] reported that a good model fit was considered sufficient if the SD coefficient was less than 0.40. The CHAID model was able to account for 89% of the overall variability in the data. No literature data found significant predictors affecting the GY of wheat plantings that were included in the CHAID algorithm. In contrast, Celik et al. [
45] successfully determined algorithms to analyze the influence of yield factors, oil production rate and plant height in sunflowers using various models, including CHAID.
A high correlation was found between biological yield and grain yield (
Figure 2). Therefore, similar to the correlation result, biological yield was included in the model as the most important factor in the CHAID algorithm (
Supplementary Figure S1). In addition, the second term in the MARS algorithm was also included in the model (
Table 6). Ahmad et al. [
19] also reported that the correlation coefficient and direct effect of biological yield on grain yield are the highest. It was reported that the effect of biological yield on grain yield is significant even in drought-stressed wheat [
31,
46]. In addition, the results of the study are consistent with studies on durum wheat [
47] and bread wheat [
48,
49].


 ,
, 


