Article

Determination of Physiochemical Characteristics Associated with Various Degrees of Cadmium Tolerance in Barley Accessions

by
Nawroz Abdul-razzak Tahir
1,*,
Djshwar Dhahir Lateef
2,
Kamil Mahmud Mustafa
2,
Kamaran Salh Rasul
1 and
Fawzy Faidhullah Khurshid
2
1
Horticulture Department, College of Agricultural Engineering Sciences, University of Sulaimani, Sulaimani 46001, Iraq
2
Biotechnology and Crop Sciences Department, College of Agricultural Engineering Sciences, University of Sulaimani, Sulaimani 46001, Iraq
*
Author to whom correspondence should be addressed.
Submission received: 19 May 2023 / Revised: 26 May 2023 / Accepted: 29 May 2023 / Published: 30 May 2023

Abstract

:
Soil contamination by heavy metals such as cadmium (Cd), which is present as a result of agricultural and industrial practices, is a critical problem in many countries around the world. High Cd concentrations in crops during the seedling stage can have a negative impact on performance and growth. The aim of the present study, which involved 59 barley accessions, was to investigate the effects of different Cd concentrations (125, 250, and 500 µM) on the responses of the barley accessions and to identify the biomarker parameters that would aid in the early growth stage selection of the best-performing accession. Barley accessions differed significantly in their morphological and physiochemical characteristics. Compared to the untreated plants, treatments with Cd lowered germination percentages by 1.75–64.28%, 1.67–46.62%, and 1.66–61.90% for concentrations of 125, 250, and 500 μM, respectively. The average of all genotypes showed significant reductions in root length, shoot length, and fresh weight of seedlings, ranging from 37.08% to 77.88%, 18.70% to 44.10%, and 7.69% to 35.87%, respectively. In comparison to untreated plants, the average seed water absorption (WU) increased across all accessions by 42.21% and 20.74%, respectively, under Cd-125 and Cd-250 stress conditions. In contrast, all biochemical measurements increased when Cd concentrations were elevated, with the exception of guaiacol peroxidase (GPA) and catalase (CAT). Across all genotypes, the mean of proline (PC) and sugar (SSC) contents showed the largest increases (123% for PC and 98.63% for SSC) under the Cd-500 stress condition. Three barley accessions: Acsad-14, ABN, and Arabi Aswad, were found to be the most tolerant accessions under all cadmium exposure, whereas the performance of the other tested accessions: Black-Kalar, Bujayl 1-Shaqlawa, and Black-Chiman was inferior. The OMIC analysis identified the biomarker parameters for differentiating the high, moderate, and low tolerant groups as the WU for Cd-125 stress, GPA, WU, CAT, total phenolic content for Cd-250 stress, and all physiochemical traits, with the exception of the CAT feature for Cd-500 treatment. The majority of trait pairings showed significant correlations. Hence, Acsad-14, ABN, and Arabi Aswad barley accessions that had great performance under cadmium conditions can be candidates for selection in a breeding program to improve the growth of plants and output in lands infected by cadmium. It can be concluded that seed water uptake, guaiacol peroxidase, and proline content were biomarker traits that would aid in the early growth stage selection of the best-performing accession under Cd stress conditions.

1. Introduction

From both natural and anthropogenic sources, heavy metals are unstoppably released into the environment. The former usually does not have a harmful impact on plants and includes volcanic activity and weathering of the bedrock [1]. The latter has strong direct effects on plants, which comprise the leftover chemical products resulting from industrial activities and agricultural wastes such as pesticides, fertilizers, and herbicides, which increase the accumulation of heavy metals in soil. One of the most severe anthropogenic environmental stressors is soil pollution with heavy metals, which causes plant growth inhibition and has negative effects on productivity. In addition, heavy metals can cause long-term toxic effects on the health of the ecosystem as they are non-degradable [2,3].
In general, all species of plants can tolerate the stress of heavy metals at different rates, depending on the variety of plant and the type of heavy metal [4]. Numerous biochemical and physiological changes, from the sub-cellular to the systemic, are triggered by heavy metal exposure in plants [5]. Reactive oxygen species (ROS) are produced as a result of one of these alterations and are toxic to plant metabolism. In this way, plants will develop their own unique strategies to overcome this problem [6,7]. A normal amount of reactive oxygen species (ROS) is necessary for plant metabolism, but excessive amounts can be detrimental. In response, plant cells have developed antioxidant defense mechanisms to limit oxidative stress and shut down harmful active oxygen species. For this purpose, regular antioxidants scavenge for and neutralize free radicals [8].
In order to counteract the toxic effects of heavy metals (HMs), plants undergo a complex series of physiological, biochemical, and molecular adaptations. Plants use a homeostatic mechanism to control the uptake, accumulation, transport, and detoxification of heavy metals in order to keep the concentration of essential metals (Cu, Zn, Mn, and Fe) within physiological limits and to mitigate the negative effects of non-essential HMs (Cd, Hg, Ag, and Pb) [9]. The production of ROS is mainly organized by several biochemical compounds, comprising ascorbate peroxidase (APX), catalase (CAT), superoxide dismutase (SOD), proline oxidase (POX), mono-dehydroascorbate reductase, and many others, whereas non-enzymatic catalysts include glutathione, ascorbate, carotenoids, phenolic compounds, proline, glycine betaine, and sugars [10]. Metal-binding ligands play essential roles in plant metabolism as they are involved in the detoxification of heavy metals with naturally occurring ligands such as organic acids, amino acids, polypeptides, and peptides [11]. Multiple stress-responsive genes, including phytochelatin synthase (PCS), metallothioneins (MTs), and proteins that mediate stress tolerance and plant growth, are upregulated in response to HM accumulation [9]. Phytochelatins are glutathione-derived peptides, and they are responsible for reducing free metal concentrations in plant tissues and protecting plant tissues from the damage that will take place in the presence of heavy metals [12]. This compound supports the detoxification of cells by creating stable complexes with metal ions and decreasing the contrary effects of heavy metal stress in plants. Metallothioneins seem to function similarly to phytochelatins [13]. These ion chelators have cysteine sulfhydryl groups in their structures and allow storage in the cell wall and the vacuole by binding to heavy metals and establishing stable complexes [14]. Several organisms’ HM–physiochemical interactions have been investigated. There has been new speculation about the potential role of gaseous pollutants such as SO2 and other secondary metabolites in regulating a plant’s tolerance to heavy metals [9,15]. Moreover, several researchers have studied the association between HM tolerance and physiochemical characters in barley and have discovered a connection between HM and physiochemical responses [16,17].
One of the most important stages in a plant’s life is the germination of seed, which is delicate to the physiochemical conditions of the rhizosphere [18]. In response to heavy metals such as cadmium, most plant seeds and seedlings display a decline in germination and vigor, while to some extent, the coat of the seed can act as a principle barrier limiting the destructive effects of heavy metals [19]. From this point on, the impacts of such a heavy metal on seedling and germination growth stages are essential research areas that need to be extensively conducted. Recent research has established that cadmium can hinder the germination and growth of barley seed via disruption of cellular osmoregulation, obstruction of food store mobilization, decrease in radical production, and degradation of proteolytic activities [20,21,22]. So, defining the relationship between the physiochemical characteristics and the degree of tolerance was the study’s hypothesis. To our knowledge, only a few small-scale studies using a large number of accessions have been conducted to investigate the effect of Cd on early-stage barley crops. There has not been any field-scale research using OMICS analysis to describe the physiochemical traits related to the different degrees of Cd tolerance in barley plants. This study set out to identify characteristics linked to cadmium tolerance by examining the phenotypic, physiological, and biochemical responses of 59 barley accessions from all regions of Iraq to three different cadmium concentrations at seedling stage.

2. Materials and Methods

2.1. Plant Materials

The plant material was comprised of 59 accessions, which were collected from almost all of Iraq’s scientific research centers (Table S1 in Supplementary Materials). In three geographical regions of Iraq, these accessions are the most frequently grown crops. All experiments were conducted at the University of Sulaimani’s College of Agricultural Engineering Sciences.

2.2. Germination Test and Phenotypic Character Measurements under Cd Stress Conditions

All of the barley accessions’ seeds were treated with a 1% sodium hypochlorite solution for 12 min, followed by five washes in autoclaved distilled water. Before conducting this experiment, all materials, including Whatman paper and Petri dishes, were sterilized in an autoclave. Twenty healthy seeds of each accession were placed in a Petri dish (9 cm in diameter), which already had two filter papers inside. Three different cadmium chloride hemi-pentahydrate (Sigma Aldrich, Taufkirchen, Germany) concentrations, namely, 125, 250, and 500 µM were prepared. The experiment was divided into two groups: control and Cd treatment. There were three replications (three Petri dishes) for each accession in the control and Cd treatment groups. Each Petri dish received 9 mL of distilled water for the control group or Cd concentrations for the Cd treatment group. This investigation was carried out in an incubator with the temperature preserved at about 20 ± 0.2 °C. Germinated seeds were measured and taken into account when the root length of the seeds reached 2 mm or more. Seedlings were taken out after the duration of 8 days of placing the seeds on the Petri dishes to evaluate the morphological parameters, including germination percentage (GP in %), shoot length (SL in cm), root length (RL in cm), seedling fresh weight (SFW in mg), and seedling dry weight (SDW in mg). This equation is considered for germination percentages [23]:
G P % = N G S T N S U × 100
where GP stands for germination percentage, NGS for number of germinated seeds, and TNSU for total number of seeds utilized.

2.3. Physiochemical Measurements

Seed water uptake (WU in %), total phenolic content (TPC in µg gallic acid g−1 seedling fresh weight), proline content (PC in µg proline g−1 seedling fresh weight), soluble sugar content (SSC in µg glucose g−1 seedling fresh weight) [23,24,25].
Grinded fresh seedlings (0.1 g) were mixed with 0.90 mL of acidic methanol (99% methanol and 1% HCl) to test their antioxidant potential. The sample was incubated at 6 °C for 12 h after being shaken for 13 min. The supernatant was recovered after centrifuging the mixture for 13 min at 13,000 rpm. The antioxidant study made use of the supernatant. The antioxidant capacity or radical scavenging activity (AC in µg Trolox g−1 seedling fresh weight) of the supernatant (extract) was measured using the 1-diphenyl-2-picrylhydrazyl (DPPH) method described by Lateef et al., Rasul et al., Tahir et al. [23,24,25]. Guaiacol Peroxidase Activity (GPA in units min−1 g−1 seedling fresh weight), and catalase activity (CAT in units min−1 g−1 seedling fresh weight) were determined as described by Lateef et al. [23], Rasul et al. [24], and Tahir et al. [25].
As a biomarker of membrane oxidative damage caused by the diverse concentrations of cadmium used in this research, the concentration of malondialdehyde (MDA), which is the final product of lipid peroxidation (LP in nmol g−1 seedling fresh weight), was measured according to the procedure of Tahir et al. [26].

2.4. Statistical Data Analysis

To investigate the normality, the Kolmogorov–Smirnov test was applied. Statistical tests (one-way ANOVA, Duncan’s multiple-range test at p ≤ 0.01, and OMIC analysis) were conducted using XLSTAT version 2019.2.2 (Boston, MA, USA). Both the radar and box plots were created in XLSTAT 2019.2.2. Each value is the average of three replications (10–15 seedlings per replication) for phenotypic and physicochemical parameters. The mean and standard deviation (SD) are used to represent the value. Q Research software (Market Research Software, Sydney, Australia) was used to perform correlation analysis. Additionally, using various calculated characters, the ranking method proposed by Ketata et al. [27] was used to identify the best accessions. The criteria for selecting the best accessions for all traits were introduced using the stress tolerance index (STI) and the average number of ranks (ASRs). The best accessions for this assessment had the highest STI and lowest ASR values [23,28].

3. Results

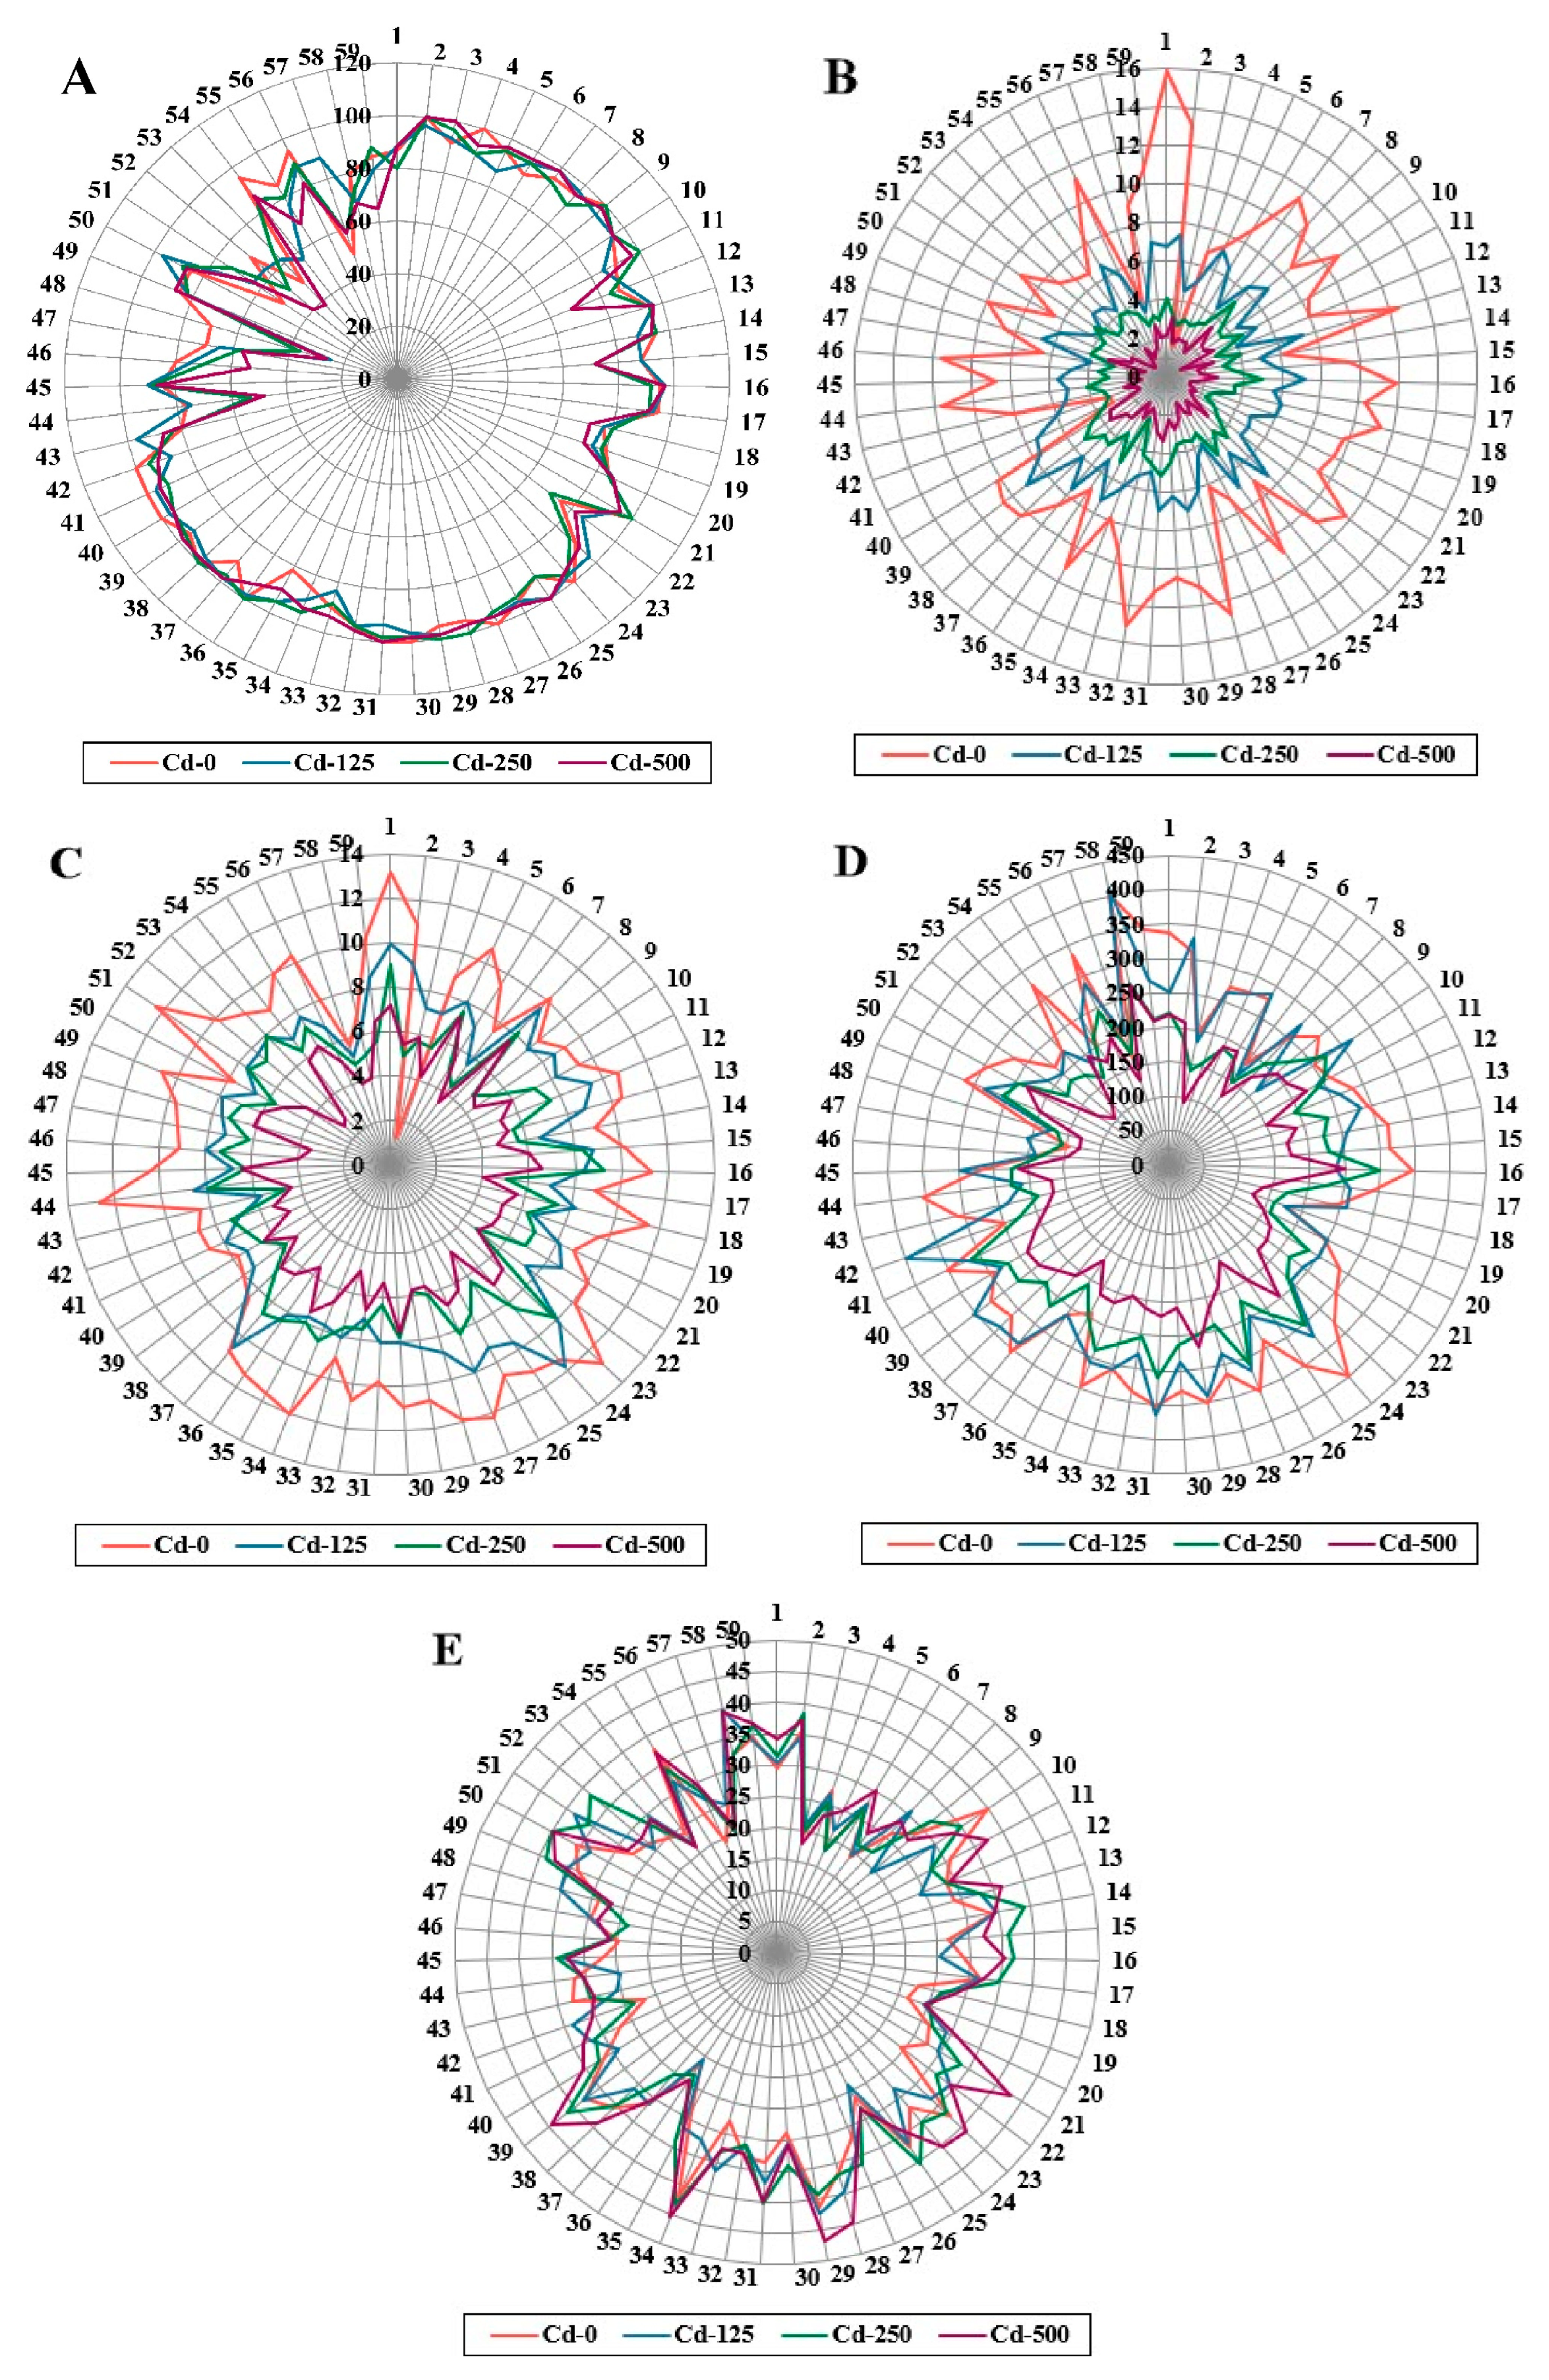
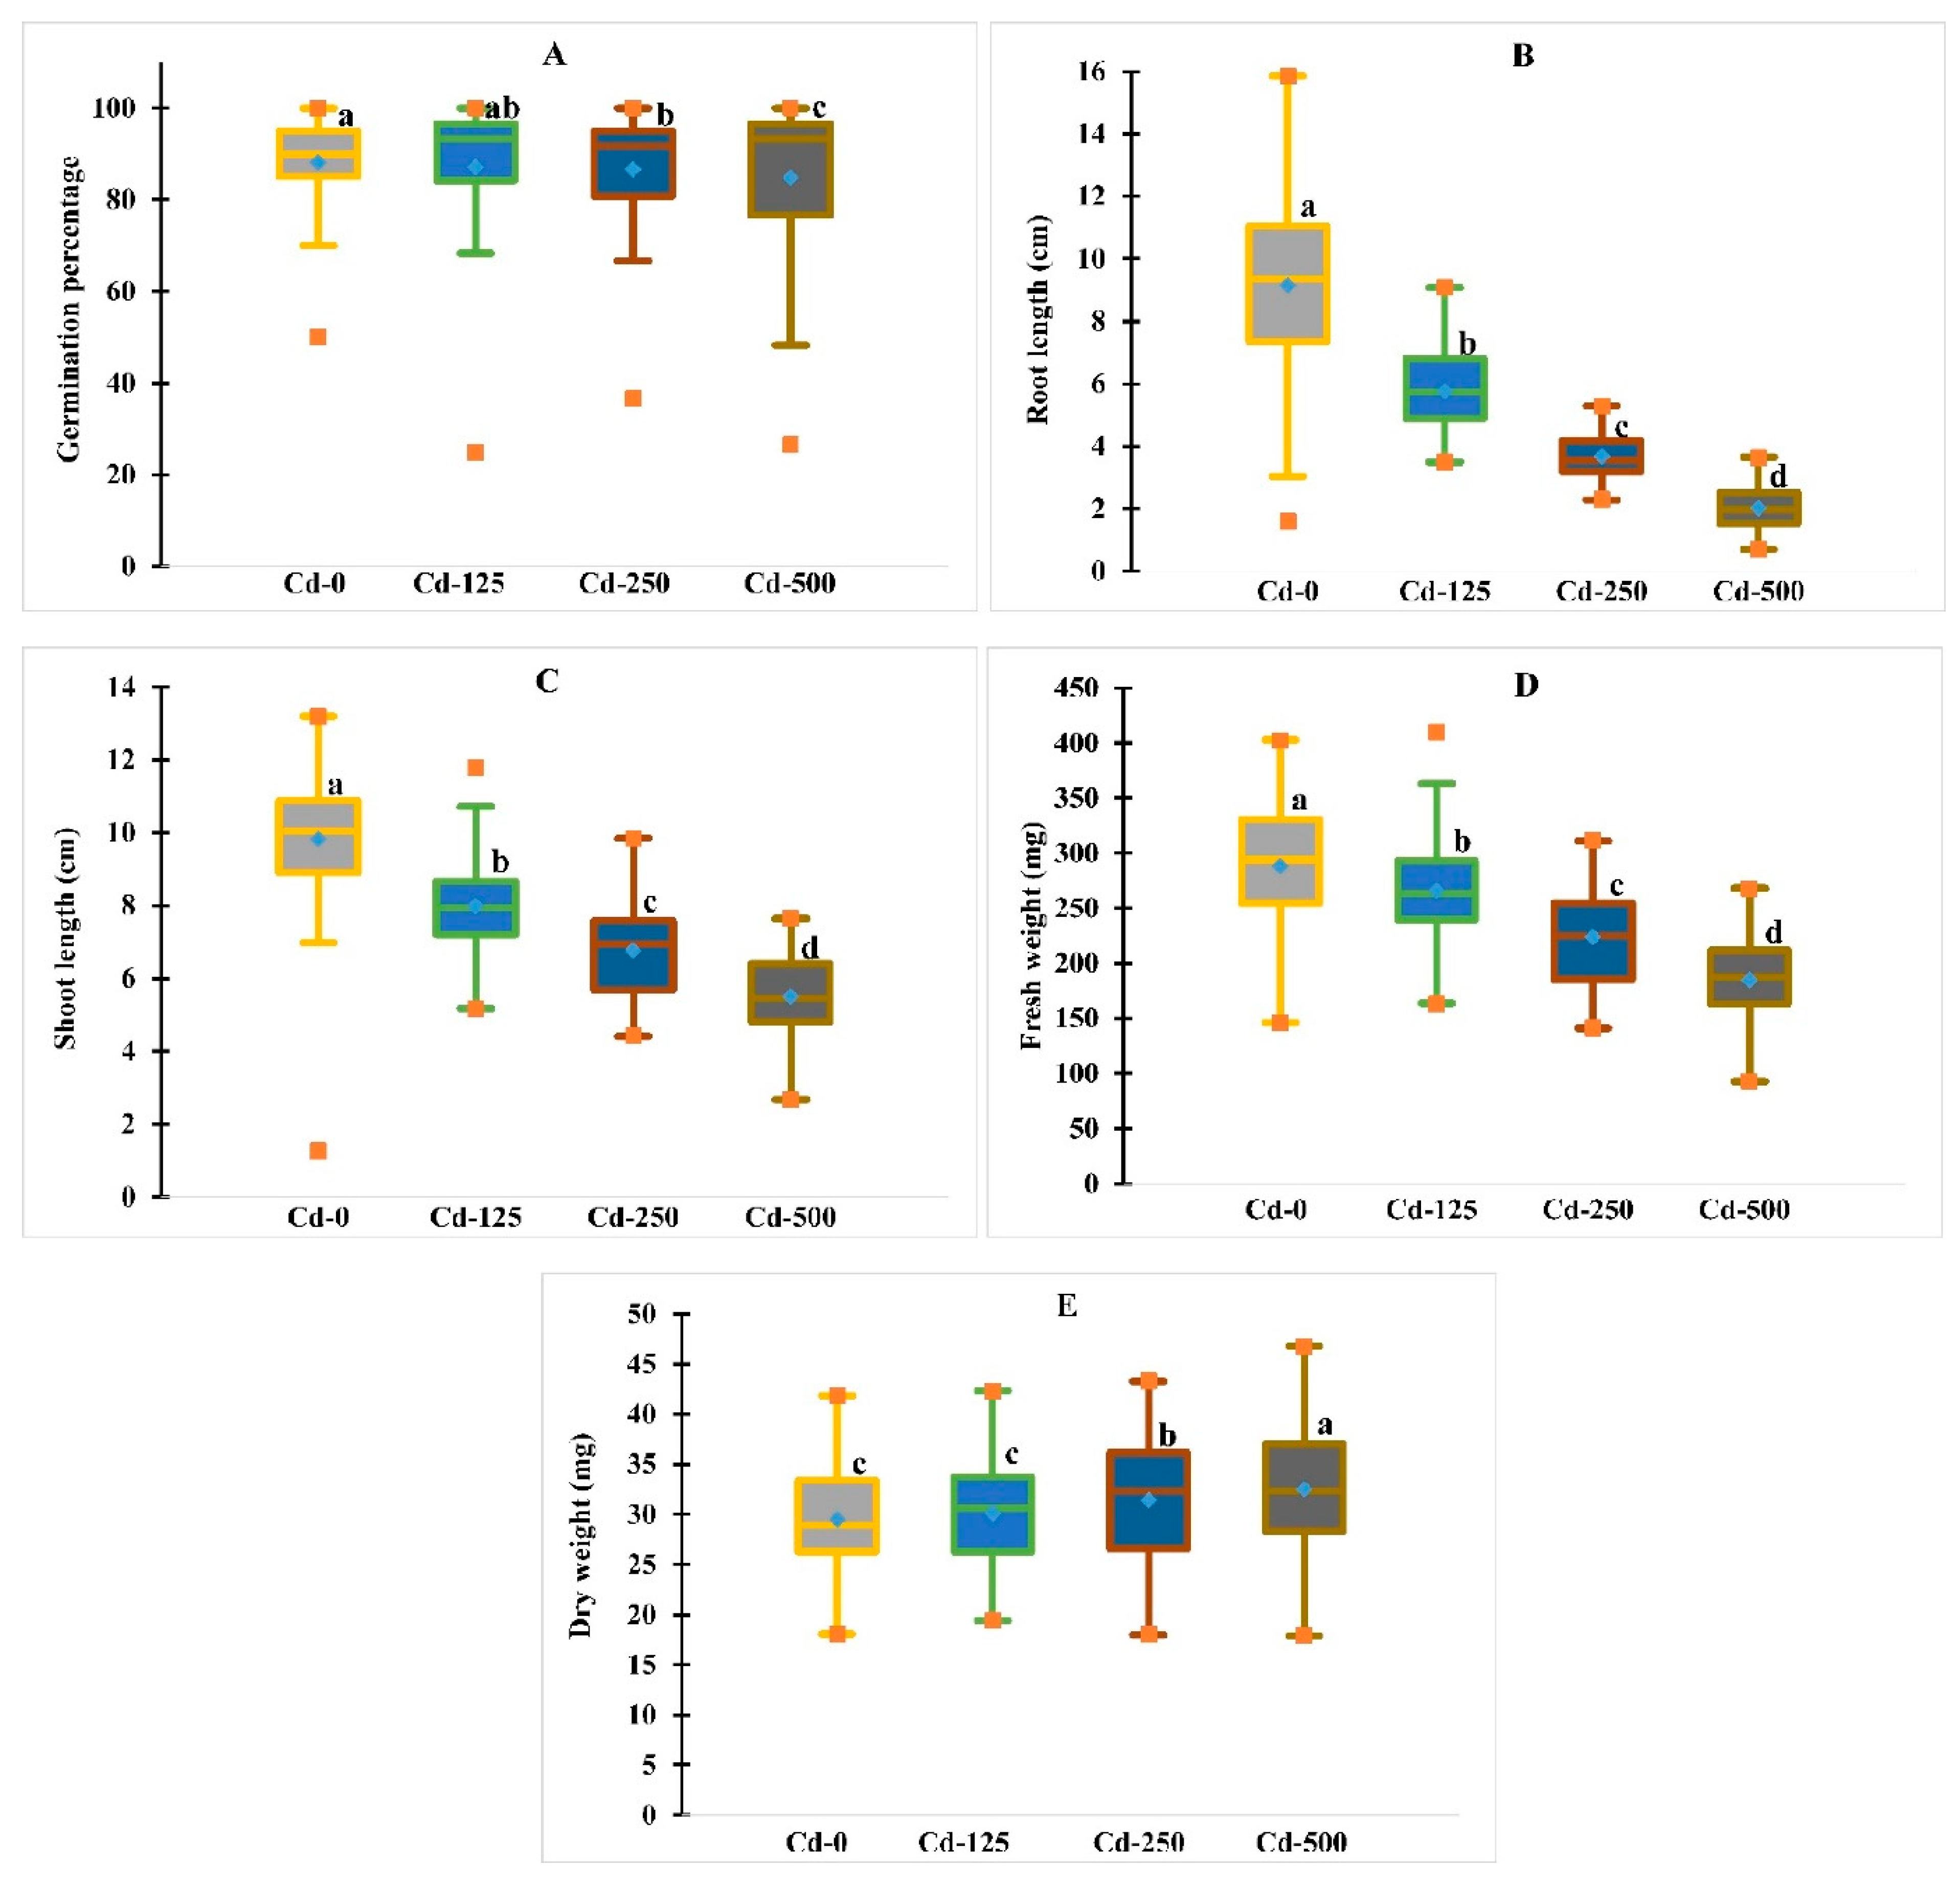
3.1. Performance of Morphological Traits under Cadmium Heavy Metal Stress Conditions

In this investigation, barley accessions were cultivated in control medium (Cd-0) and medium supplemented with three different levels of cadmium concentration: 125 (Cd-125), 250 (Cd-250), and 500 μM (Cd-500), to determine the cadmium effects of the tested barley accessions on growth traits, mainly germination percentage (GP), root length (RL), shoot length (SL), fresh weight of seedling (FWS), and dry weight of seedling (DWS). Eight days after treatments, typical symptoms of Cd toxicities among barley accessions developed, where clear necrotic lesions and dark-brown dots were observed on both roots and shoots (Figure S1). For all investigated morphological traits, highly significant differences between barley accession were found (Table S2). Regarding the analysis for GP under control conditions, the performance of this trait ranged between 50% and 100%, with a mean of 88.19%. The 13 barley accessions among all tested accessions were fully germinated, while poor performance by 3 accessions, namely, Abrash, Bujayl 2-Shaqlawa, and Warka-B12, was observed (Figure 1 and Tables S4–S7). For the analysis of root length (RL), the measured scores for the accessions under control conditions ranged from 1.59 to 15.85 cm, with a mean value of 9.16 cm for the barley accessions radical and Shoaa, respectively. In contrast to Clipper, where this accession’s highest root length of 9.08 cm was recorded under treatment with Cd-125, barley accession Bhoos-244 showed the lowest length of 3.50 cm. The mean length in this particular state was 5.77 cm. Following the increase in concentration caused by Cd-250, the length of the studied trait (RL) was measured for the barley accessions Iran and Numar and ranged from 2.29 to 5.29 cm, with a mean value of 3.68 cm.
According to results for shoot length (SL) under control conditions, the barley accession Shoaa showed the best performance for the SL trait, with a value of 13.19 cm, while the accession radical was the shortest, with a value of 1.27 cm, and the mean value for this specific condition was 9.83 cm. With a value of 11.80 cm for the lowest dose of cadmium (Cd-125) used in our study, GOB accession had a greater potential to elongate. The shortest shoot length (5.17 cm) was found in the barely accession Warka-B12, with a mean value of 7.99 cm. Al-warka recorded the shortest shoot length (4.41 cm), while Samr performed admirably, documenting a length of 9.84 cm under the second higher exposure of cadmium (Cd-250), with a mean value of 6.77 cm as shown in Tables S4–S7. For the studied trait (SL), a significant reduction was seen when the highest dose (Cd-500), where the mean value was 5.49 cm, was present. Again, the Bujayl 1-Shaqlawa barley accession showed the same pattern as that for root length, maintaining the shortest length for its shoot (2.66 cm), while the Numar accession outperformed the others, having a 7.64 cm shoot length.
In the current investigation, fresh weight seedlings (FWSs) were used to evaluate different cadmium concentrations in barley accessions (Tables S4–S7 and Figure 1). Under control conditions, Black-Garmiyan, a barley accession, had the lowest FWS at 146.07 mg, while Al-Hazzar had the highest FWS at 402.72 mg. Al-Hazzar, a barley accession, performed better for the FWS trait than the other accessions when exposed to 125 µM of cadmium, recording a value of 410.33 mg, whereas Al-warka and Al-amal recorded the lowest value of 163.48 mg. When accessions were exposed to 250 and 500 µM of cadmium exposure, respectively, remarkable reductions in FWS were found, as shown in Tables S6 and S7 for the barley accession radical with values of 141.08 and 92.76 mg. The highest values were recorded by the barley accessions BN2R (311.23 mg) and Al-Hazzar (267.47 mg) under the same increasement.
After determining the fresh weight, barley accessions were fully dried in an oven to determine the dry weight of the seedling (DWS). Under untreated conditions, dry accumulation for barley accession Irani was highest at 41.85 mg, compared to 16 HB at 18.07 mg. Similar to FWS, the barley accession Acsad-14 had the highest value of dry weight (42.32 mg), while both Al-warka and Al-amal had the lowest rate of dry accumulation (19.41 mg) under Cd-125. Irani collected more dry material (43.30 mg) in the presence of a 250 µM cadmium dose compared to 16 HB (17.98 mg), while Acsad-14 barley accession, which is similar to Cd-125 conditions, had the highest accumulation, with values of 46.75 mg compared to radical’s values of 17.90 mg under exposure to the final cadmium dose (Tables S4–S7 and Figure 1).
The plant growth traits under both untreated and treated conditions with different concentrations of Cd showed significant phenotypic diversity at level (p ≤ 0.01) among tested barley accessions, as shown by the box charts (Figure 2). Statistically significant differences were found between Cd-0, Cd-125, Cd-250, and Cd-500 for all morphological traits, as indicated by the lower and upper box plot limits for each trait. When barley accessions were exposed to high doses of cadmium, significant reductions in GP, RL, SL, and FWS were inhibited. The reduction started and continued from the lowest dose of 125 µM to the highest dose of 500 µM, while the dry weight of the barley seedling displayed more accumulations as the cadmium dosage increased. Compared to stressed conditions, higher trait values in normal conditions in overall tested barley accessions were detected in almost all studied parameters, with the only exception of DWS. All accessions showed more severe alterations in germination and seedling growth parameters after being exposed to Cd-500, as shown by these results. According to Figure 2, the overall effectiveness of the barley accessions showed a gradual decline in the FWS from the lowest Cd-0 to the highest Cd-500 dose, with mean values of 288.28, 266.11, 224.18, and 184.86 mg, respectively. All barley accessions tested under Cd-250 and Cd-500 conditions showed a slight increase, with mean values of 31.43 and 32.52 mg, respectively. There were few differences between the barley accessions tested under control and Cd-125, which both shared a mean value of 29.51 and 30.11 mg, respectively.

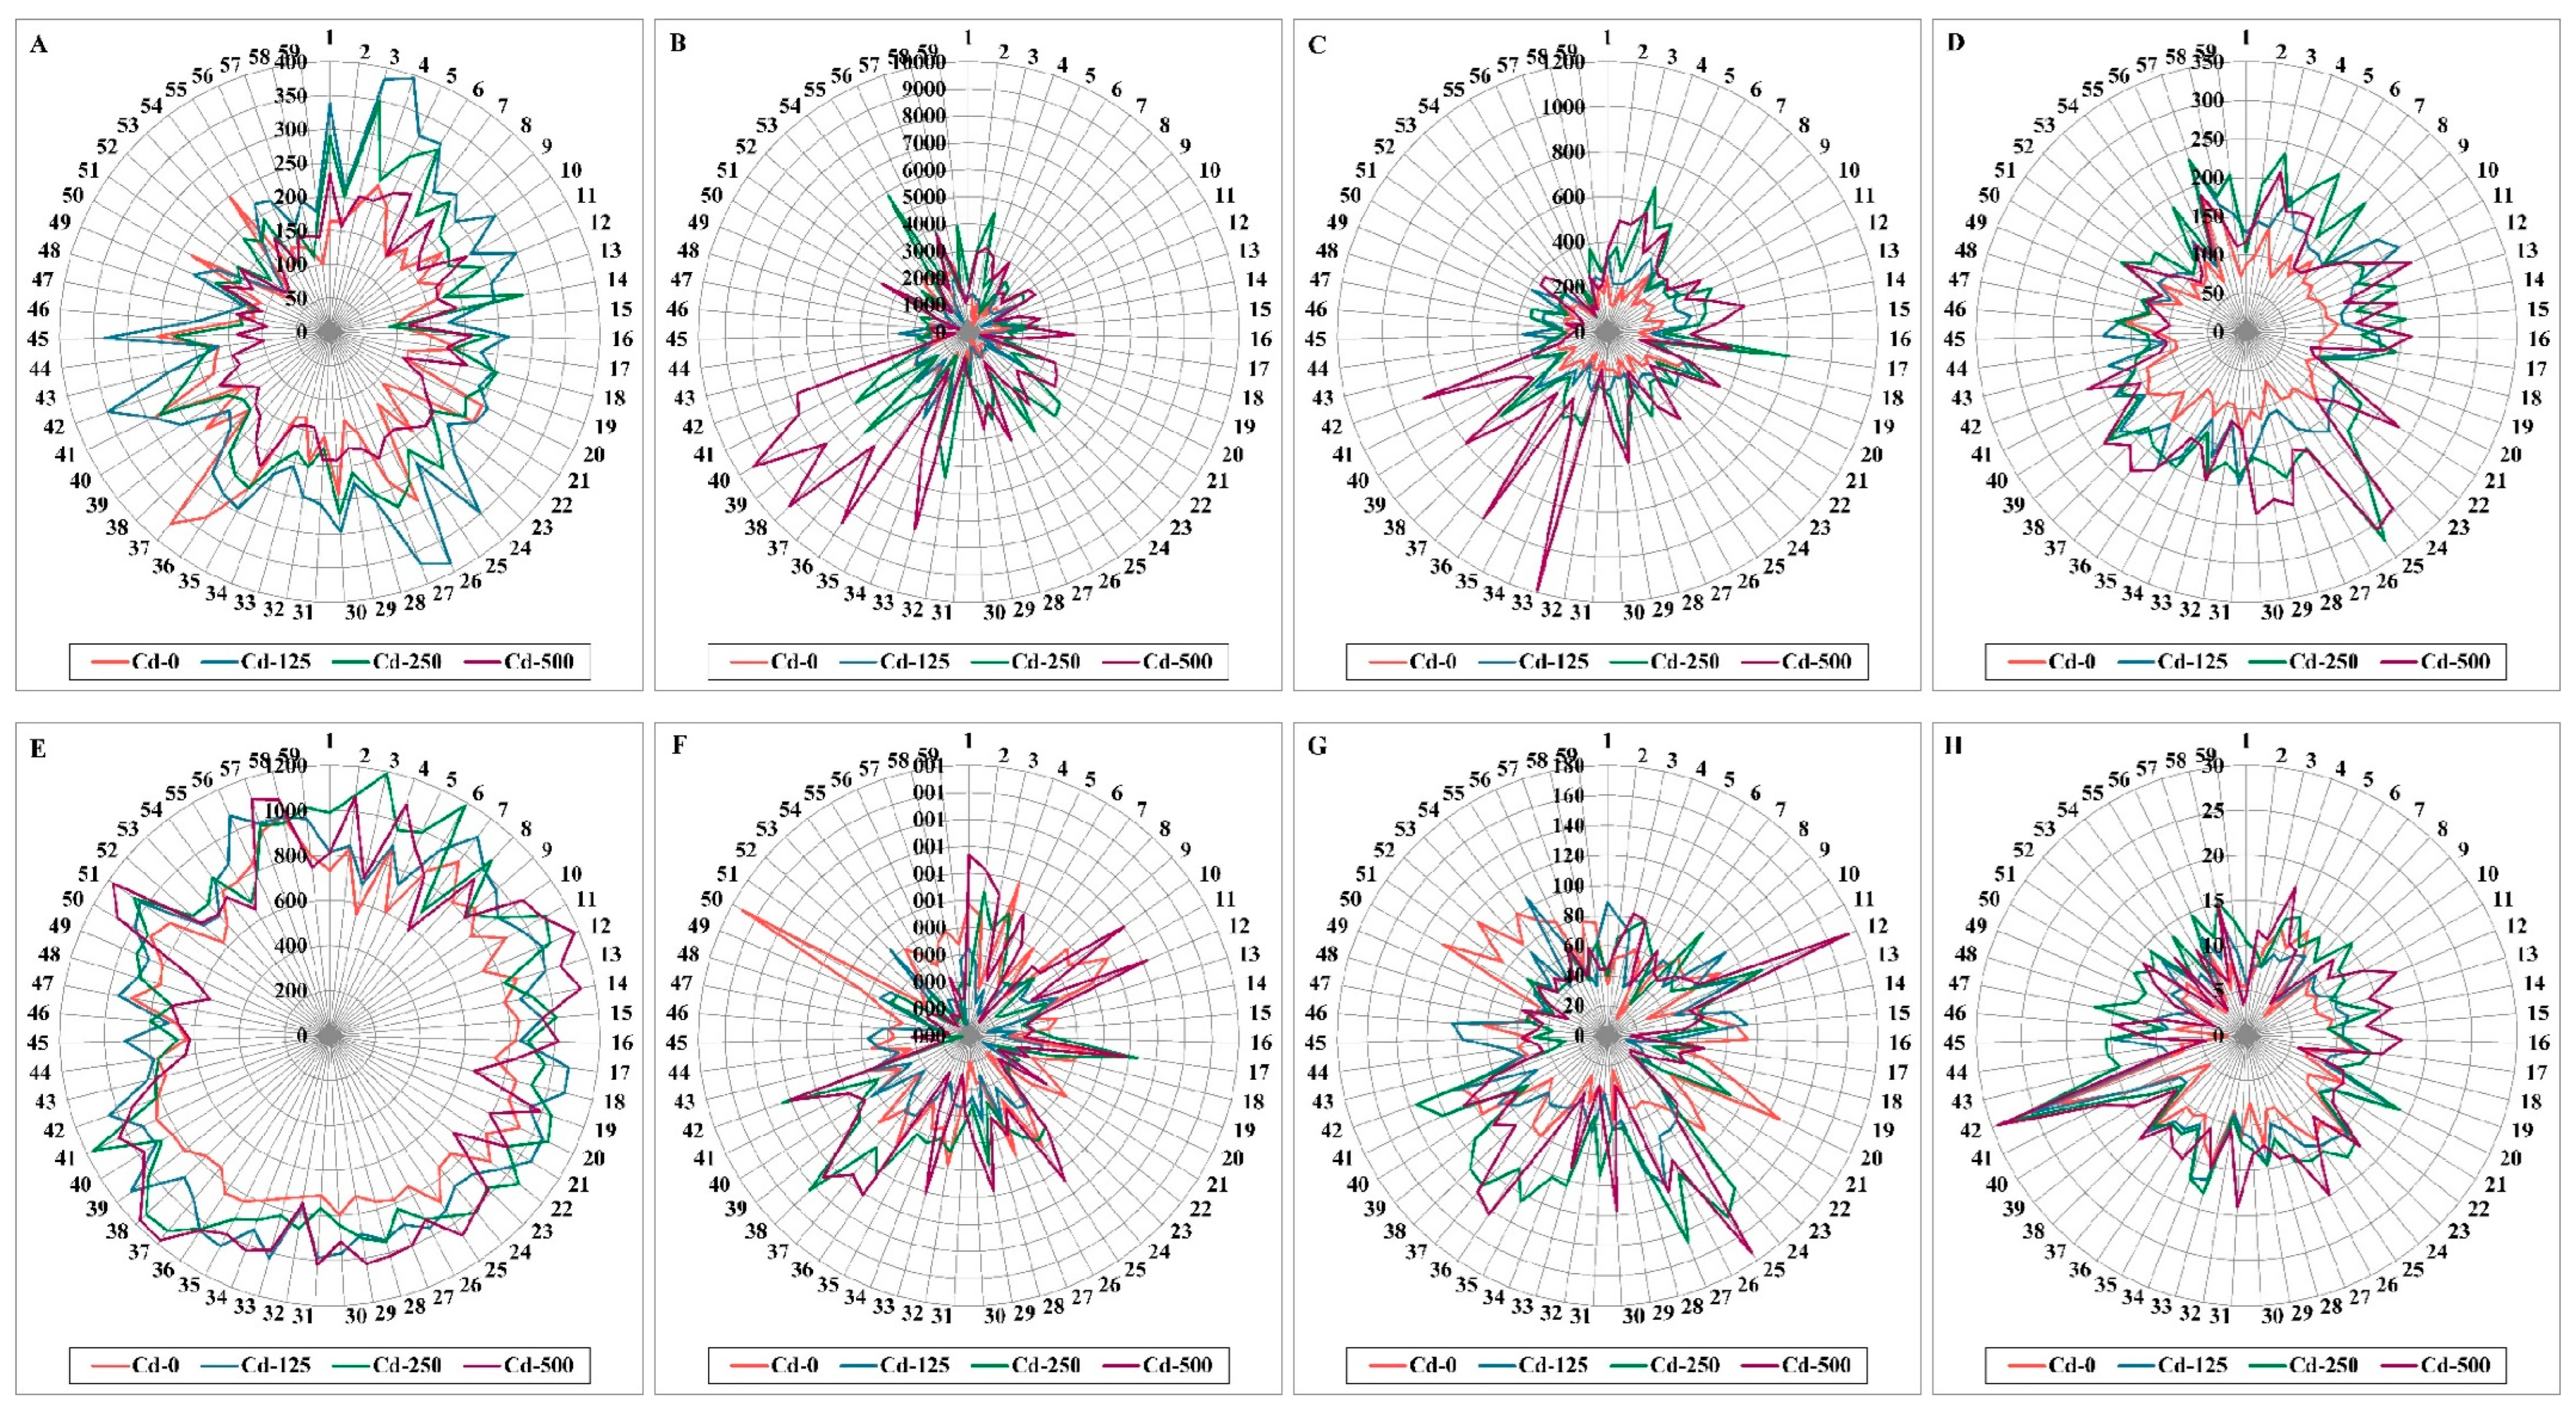
3.2. Physio-Biochemical Markers Assays

In our investigation, seven physiobiochemical markers, including; seed water uptake (WU), proline content (PC), total phenolic content (TPC), antioxidant activity (AC), soluble sugar content (SSC), catalase (CAT), guaiacol peroxidase activity (GPA), and lipid peroxidation (LP), were conducted to observe the response of tested barley accessions to different concentrations of cadmium. Highly significant physiobiochemical responses at level p ≤ 0.001 were observed among tested barley accessions under both control and treatment with different concentrations of Cd (Table S3). The lowest value in the three Cd treatment conditions was recorded by accession Bujayl 1-Shaqlawa, whereas the highest values were found, respectively, by ABN (368.17%), Arivat (395.08%), and Furat 9 (236.91%). In addition to these circumstances, the barley accession Bhoos-244 (87.68%) demonstrated the lowest record, as opposed to the barley accession radical (349.26%) under the condition of Cd-250 (Figure 3 and Tables S8–S11).
The mean value when the PC data were analyzed in an untreated condition was 1303.15 µg g−1, and the values ranged from 16 HB (294.00 µg g−1) to Black-Bhoos-B (2907.33 µg g−1). In the following condition, A1 (3598.36 µg g−1) collected more PC than Ukranian-Zarayan (367.59 µg g−1) with a mean value of 1371.76 µg g−1, whereas under Cd-250, different patterns of response by the barley accessions were seen for this specific trait. In which mean values were almost doubled compared with previous cadmium supply and Rehaan aggregated more PC compared to Furat 9 with the values of 5836.56 and 769.64 µg g−1, while a slight increase by all accessions was documented for PC under the final concentration of cadmium exposure compared to the intermediate cadmium condition with a mean value of 2913.45 µg g−1, and the performance of barley accession ranged between 9390.41 and 358.62 µg g−1 for barley accessions Bhoos-H1 and Black-Chiman, respectively (Figure 3 and Tables S8–S11).
Tested accessions’ responses to cadmium were measured using TPC. Overall, the barley accessions stored more phenolic compounds at the second dose of cadmium exposure, with a mean value of 172.21 µg g−1, followed by the final exposure to cadmium and the first dose, with mean values of 161.05 and 149.05 µg g−1, respectively, in conjunction with the control condition of 107.42 µg g−1. Under intermediate cadmium conditions, the maximum storage for the studied trait was documented by Abiad (323.93 µg g−1). On the other hand, barley accession Bujayl 2-Shaqlawa stored less TPC (102.21 µg g−1). In spite of the extreme cadmium exposure in our experiment, Abiad again showed superior performance for TPC storage with a value of 307.27 µg g−1 compared to Akre’s value of 86.10 µg g−1. However, different patterns of TPC accumulation were documented under first cadmium exposure, and the highest and lowest levels of TPC were recognized by barley accessions Warka-B12 (234.42 µg g−1) and Sameer (91.80 µg g−1). In the absence of cadmium conditions, the TPC accumulation ranged between 177.12 and 68.88 µg g−1 for barley accessions Warka-B12 and MSEL, respectively (Figure 3 and Tables S8–S11).
Similar patterns of responses by the barley accessions in comparison with PC were detected for SSC. Under extreme cadmium application for this trait, the maximum scores were achieved for mean value by overall accessions (379.39 µg g−1), followed by the intermediate and first dose of cadmium with values of 340.21 and 272.74 µg g−1, respectively, whereas the accumulations of soluble sugar were not as great by the accessions compared with the untreated condition (191.01 µg g−1). Under all cadmium treatments, the barley accession Bujayl 3-Shaqlawa showed an almost similar pattern of SSC accumulation and was considered the worst accession in comparison with the rest of the accessions for collecting soluble sugar in their cell organs. The values of these accessions from the first to the final cadmium exposure were 94.20, 82.16, and 90.80 µg g−1, respectively. By contrast, White-Zaxo (406.85 µg g−1), White-Akre (809.01 µg g−1), and Black-Bhoos-B (1185.86 µg g−1) under the three cadmium applications Cd-125, Cd-250, and Cd-500, respectively, reached the pick regarding the gathering of SSC, while different distributions by all accessions were noted under the control condition, in which the values ranged between 105.10 and 374.34 µg g−1 for barley accessions Bujayl 2-Shaqlawa and Black-Zaxo, respectively (Figure 3 and Tables S8–S11).
The results displayed that the effect of the provided treatments of cadmium was significant on antioxidant activity (AC), especially when the barley accessions were treated with the first and second doses of cadmium and followed by the third dose with mean values of 930.74, 930.85, and 910.95 µg g−1, respectively, while the mean value of the control condition was less with a value of 799.91 µg g−1. The barley accession radical in control and the first dose of cadmium treatment were considered an accession that retained the lowest AC with values of 552.43 and 686.89 µg g−1, respectively, while in the case of the second dose, the accumulation of this trait by the same accession boosted it to become the superior accession among others with a value of 1188.92 µg g−1. Under control conditions, as shown in Figure 3, barley accession Al-Hazzar with a value of 994.32 µg g−1 owned the greatest value for AC accumulation, while in the first dose of cadmium treatment, barley accession Clipper with a value of 1118.65 µg g−1 was similarly considered the best-performing accession for AC storage compared to the rest of the accessions. The subsequent increase in treatment revealed that barley accession White-Kalar, with a value of 678.11 µg g−1, had limited ability to collect AC. Regarding the accumulation of AC under severe concentrations of heavy metals in our study, the values ranged between 557.16 and 1179.46 µg g−1 for barley accessions Black-Chiman and ABN, respectively (Figure 3 and Tables S8–S11). Diverse responses by barley accessions were obtained for GPA enzyme activities in the presence of toxic cadmium conditions. Under the control conditions, the mean value was 0.34 units min−1 g−1, and the responses for GPA activities ranged between 0.09 and 0.96 units min−1 g−1 for Samr, Gk-Omega, and White-Zarayan, while under the first cadmium application, the minimum response was observed compared with the second and third doses with mean values of 0.23, 0.30, and 0.32 units min−1 g−1.
The maximum GPA activities were detected by Bujayl 2-Shaqlawa (0.43 units min−1 g−1) compared to Al-Hazzar (0.04 units min−1 g−1) under Cd-125. Following the next two doses of cadmium, the barley accession Arabi Aswad achieved the highest possible GPA activities with values of 0.82 and 0.75 units min−1 g−1, respectively, while the tiniest activities in the same order of cadmium application were spotted by the barley accession Black-Kalar (0.02 units min−1 g−1) and Bujayl 1-Shaqlawa (0.05 units min−1 g−1) (Figure 3 and Tables S8–S11).
Under intermediate cadmium contamination, the catalase activity (CAT) significantly increased with a mean value of 71.36 units min−1 g−1 compared with the rest treatments, while similar responses by all barley accessions were documented for both treatments (control and Cd-500) with the mean values of 65.67 and 64.67 units min−1 g−1, respectively (Tables S8–S11 and Figure 3). This was followed by the first treatment of cadmium with a mean value of 61.29 units min−1 g−1. Under conditions without cadmium, the activity of catalase in barley accessions Furat 9 and White-Zaxo ranged from 12.99 to 127.27 units min−1 g−1. However, different concentrations of cadmium caused different responses in the activity of this enzyme in different barley accessions. Under continuous doses of cadmium, Rehaan (106.88 units min−1 g−1), MSEL (148.05 units min−1 g−1), and Abiad (174.03 units min−1 g−1) recorded the highest activities for this particular enzyme activity, while Black-Bhoos Akre, White-Halabja, and IBAA-265, with values of 12.99, 20.78, and 15.58 units min−1 g−1, respectively, were considered accessions for fewer CAT activities (Figure 3 and Tables S8–S11).
Strong associations were identified in the analysis of our data in response to cadmium heavy metals by testing accessions between TPC and MDA. As presented by the boxplot in Figure 3 and Tables S8–S11, similar distributions and responses were observed for all treatment conditions. Significant increases in lipid peroxidation in the second level of cadmium were observed, followed by the third and first levels with mean values of 13.25, 12.20, and 10.10 nmol g−1, respectively, while over the rest of the cadmium treatments, the activities of lipid peroxidation were lessened by all barley accessions with a mean value of 9.103 nmol g−1. Among all tested barley accessions, BA4 in all experiment conditions, starting from control to the maximum level of cadmium, reached the peak activities of lipid peroxidation with values of 22.290, 25.274, 27.484, and 29.403 nmol g−1, respectively. In the same chronological order, the least content of MDA was observed by barley accessions White-Kalar (2.081 nmol g−1), Numar (5.177 nmol g−1), Rehaan (7.548 nmol g−1), and IBAA-995 (3.435 nmol g−1) (Figure 3 and Tables S8–S11).
In terms of the analysis of WU, as shown by the boxplot in the first and second doses of cadmium treatment, the barley accessions tended to accumulate more water or cadmium at this specific growth stage, whereas no obvious differences were seen for the third dose when compared to the respective control condition. According to the boxplots in Figure 4, a significant increase was seen when the highest dose of cadmium treatment (Cd-500) was applied, particularly for PC and SSC, and was followed by TPC, AC, CAT, GPA, and LP. In contrast, the barley accessions exposed to cadmium for the second dose (Cd-250) also responded very favorably to this particular circumstance. For instance, the highest accumulations were found in TPC, AC, LP, and CAT, followed by PC and SSC. The incentives were lower in the case of the lowest dose of cadmium (Cd-125) than the other highest dose of cadmium exposure, with the exception of AC, where, similar to second-dose barley accessions, they collect more AC in their cells to prevent the toxicity effects of cadmium. For PC, SSC, TPC, AC, LP, GPA, and CAT, respectively, the increasing percentages ranged from 5.26% to 123.57%, 42.79% to 98.62%, 38.75% to 49.98%, 13.88% to 16.36%, 20.79% to 45.59%, 5.42% to 31.42%, and 1.50% to 6.6.67% compared to the control groups.

3.3. Ranking of Barley Accessions for Morphological Traits under Cadmium Stress Conditions

The ranking technique was carried out under all treatment conditions in accordance with the process established by Ketata et al. [27]. The average rank (AR) and stress tolerance index (STI) were used as indicators for selecting the best barley accessions. In light of this, the best-performing accession for the traits obtained the lowest AR and heights STI and was deemed to be tolerant to various concentrations of cadmium heavy metal stress, in contrast to susceptible barley accessions.
Based on the available data in our study, three barley accessions, Acsad-14, GOB, and Abiad, as indicated in Table 1 under the first cadmium exposure (Cd-125), showed low AR value; therefore, these accessions can be recommended as the cadmium tolerant accessions under this particular dose of cadmium. In contrast, Black-Chiman, Al-Hazzar, and Bujayl 1-Shaqlawa revealed high AR values, which point to their susceptibility to cadmium under the same condition. Under intermediate cadmium exposure (Cd-250), as shown in Table 2, the responses by barley accessions were changed. The best-performed barley accessions for studied traits based on the lowest values of AR can be selected for their tolerance which includes MORA, Arabi Aswad, and Al-khayr. On the contrary, both barley accessions Black-Chiman and Bujayl 1-Shaqlawa, similar to the first dose of cadmium, indicated as the least performed accessions, followed by Black-Garmiyan. Arabi Aswad significantly responded to the final cadmium dose (Cd-500). With a low AR value, it was one of the three best-performing barley accessions, while Black-Chiman and Bujayl 1-Shaqlawa were regarded as the susceptible accessions with high AR values (Table 3).
For comparison between the best-performing barley accessions that are tolerant to cadmium and the least-performing barley accessions that have a sensitive response to cadmium stress, the mean value of the investigated traits for three cadmium stress conditions was measured and is shown in Table 4. Accordingly, Acsad-14 was thought to be the best-performing barley accession in response to all cadmium treatments, followed by Arabi Aswad and ABN, whereas Black-Chiman was considered to be the worst-performing barley accession in response to cadmium exposure, followed by Bujayl 1-Shaqlawa and Black-Kalar.

3.4. Relationship between Tolerance Degree and Physiochemical Traits

Statistical differential expression (OMICS approach) was used in the field of genomics [29] and biochemistry [30] to help identify features that are affected by descriptive variables. In our case scenario, the degree of tolerance and susceptibility were indicated by using the mean value of physiochemical traits presented in Table 5 that were obtained in response to different exposures of cadmium. In this particular analysis, three levels of responses were set. For indicating high tolerance responses by all barley accessions, the range of the stress tolerance index was set between 0.95 and 1.20, while for moderate tolerance, it ranged between 0.60 and 0.94. For the third level, indicating low tolerance, the prediction was set between 0.10 and 0.59. In the first application of cadmium (Cd-125), the only trait that showed significant responses to alter the effect of cadmium was WU, and the mean values observed for this particular trait were 273.39, 229.81, and 129.67% for the high, moderate, and low tolerant responses, respectively, while no significant change was noted for other biochemical traits studied. Following an increment of cadmium (Cd-250), three traits, WU, CAT, and TPC, started to respond significantly to barley accessions, with the mean values for the mentioned traits ranging between 229.18% and 151.43%, 83.56 and 47.12 µg g−1, and 184.80 and 148.25 µg g−1, respectively. When the barley accessions were exposed to an excess of cadmium (Cd-500), all traits, with the exception of CAT, showed significant and potential power for the discrimination of three groups. Regarding the activity of CAT, no obvious significant differences were observed between the mean of this trait between the three groups.

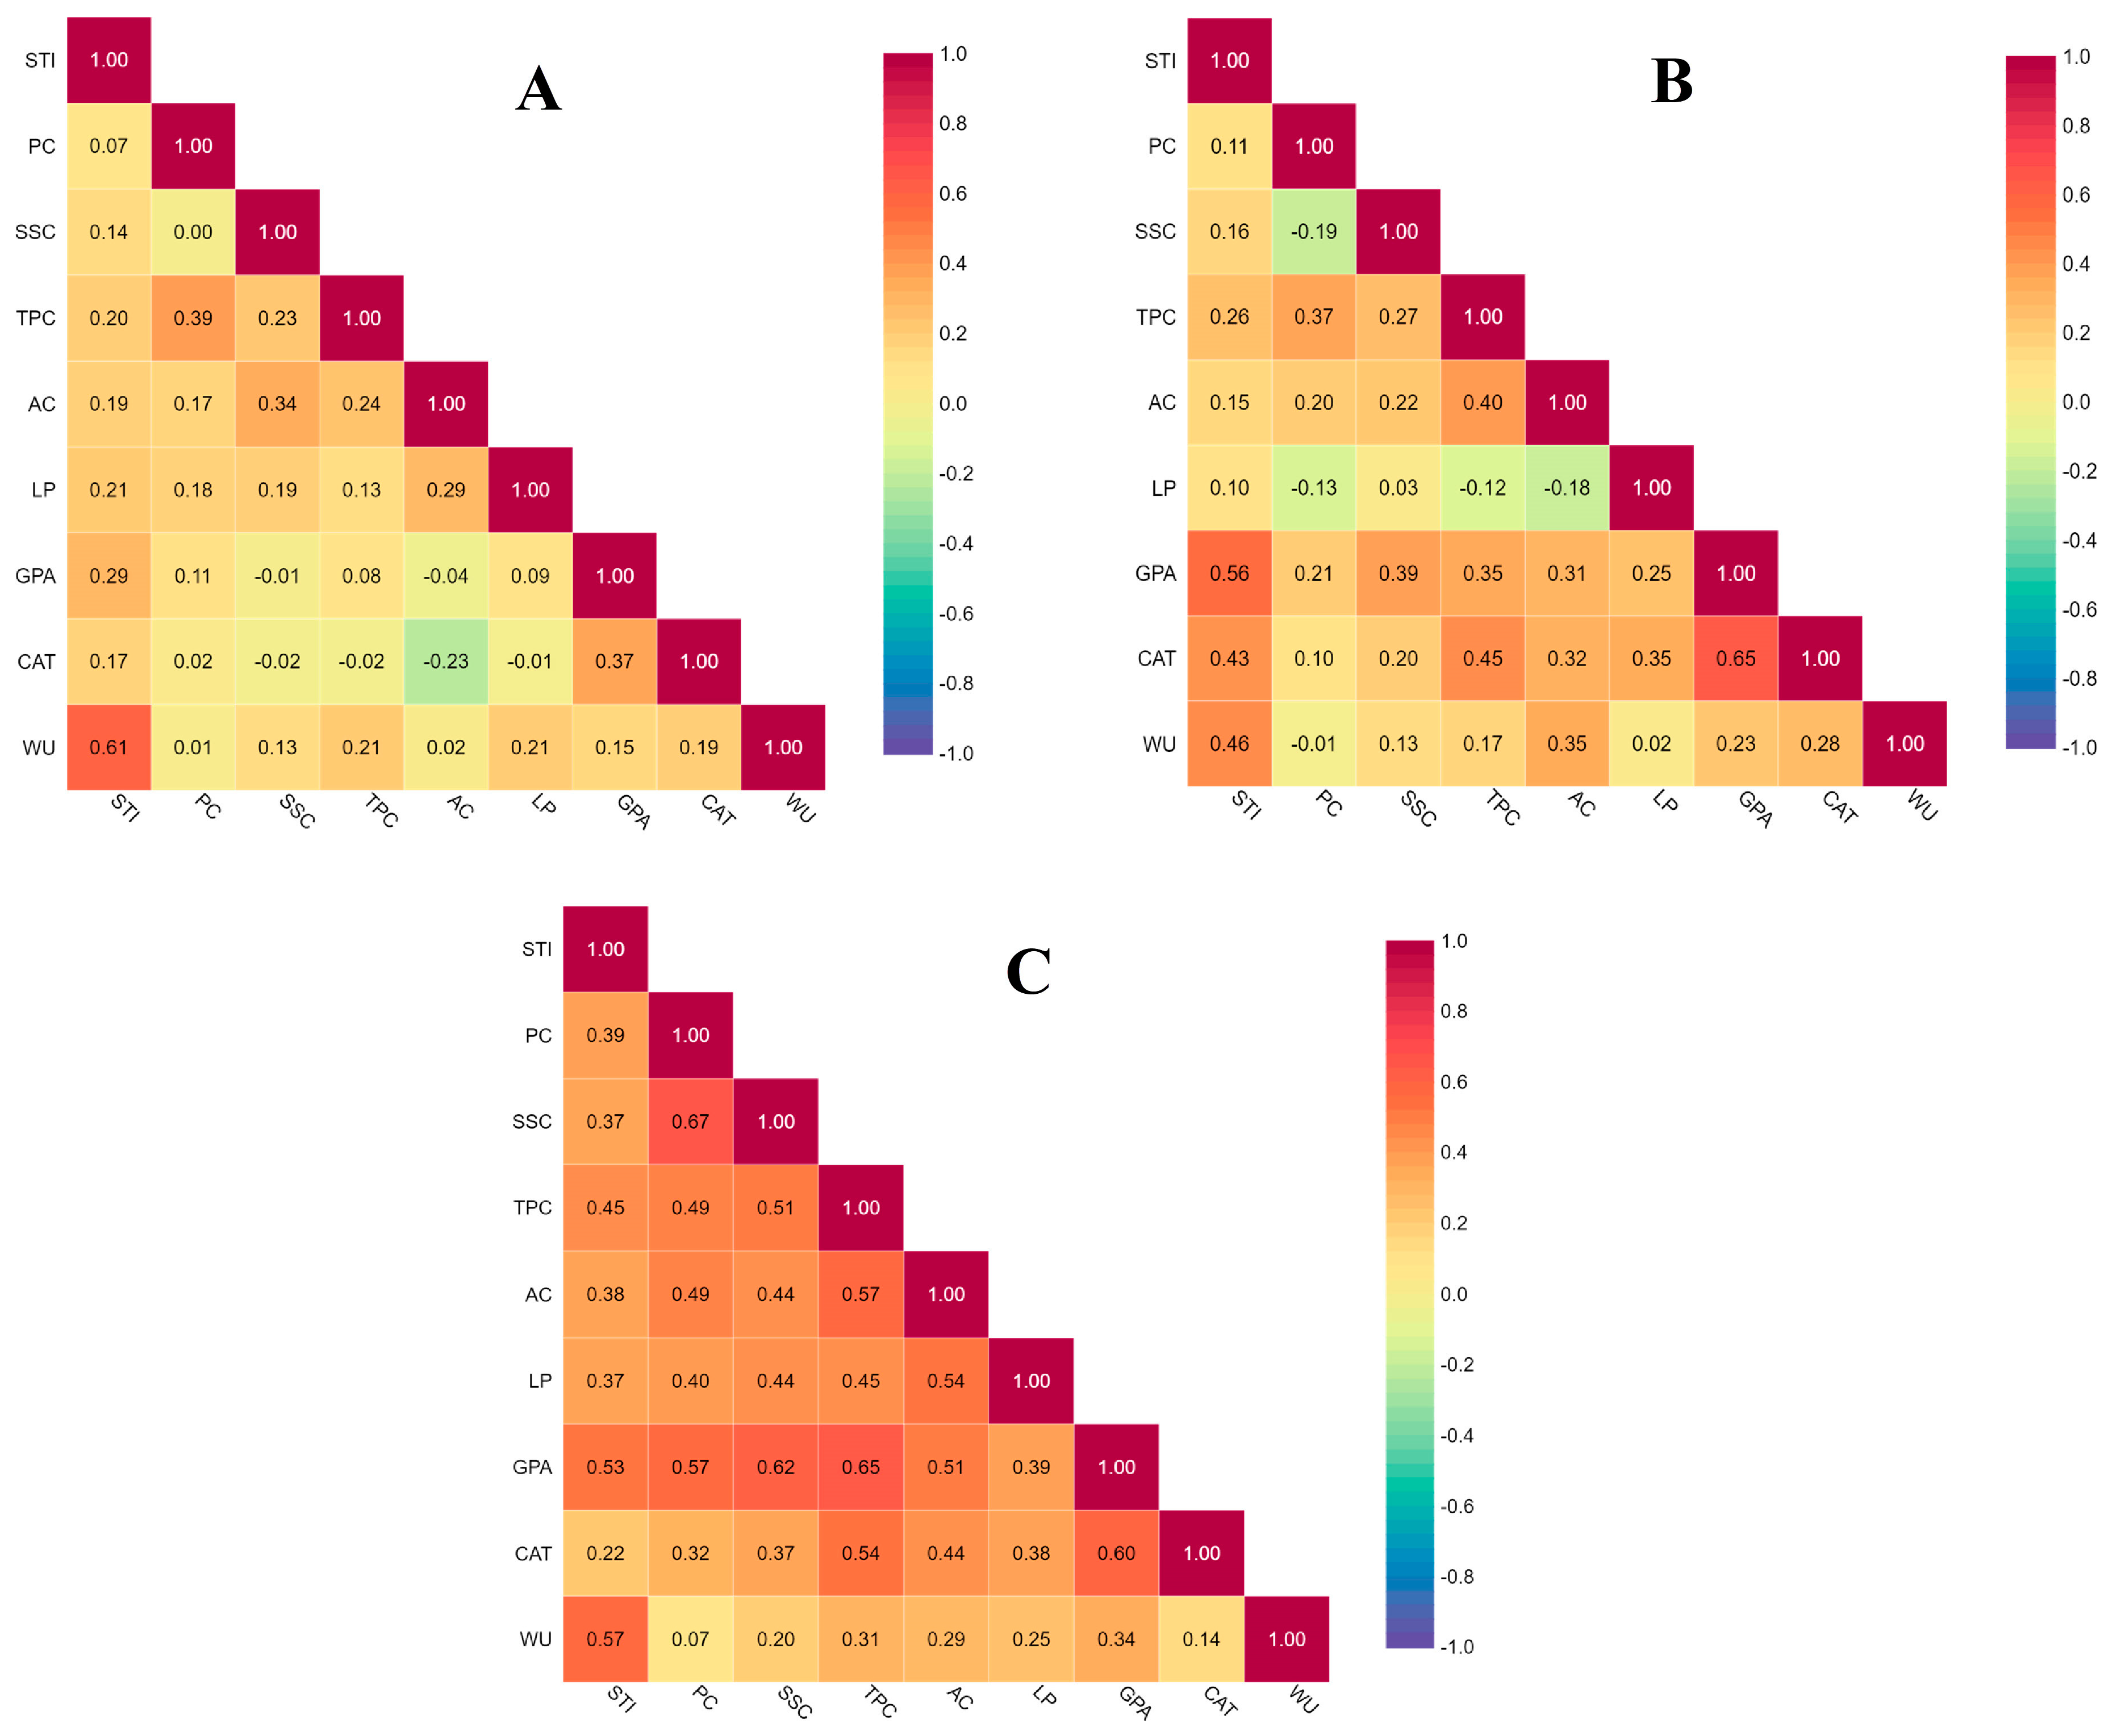
3.5. Correlations among Measured Traits under Three Different Concentrations of Cadmium

A Pearson correlation (r) analysis between STI and physiochemical traits under three stressed cadmium conditions was conducted. Under the first exposure (Cd-125), an equal portion of six positive and negative correlations was found (Figure 5A). The positive correlations among studied traits for r values ranged between 0.61 and 0.29, for there is a relationship between STI and WU, STI and GPA, and AC and LP, respectively. The STI in this particular cadmium condition showed only two positive correlations with WU (r = 0.61 ***, p = 0.0001) and GPA (r = 0.29 *, p = 0.02). PC, GPA, SSC, and AC documented only one positive association in comparison with the rest of the studied traits, which had r values of 0.39 (between PC and TPC), 0.37 (between GPA and CAT), 0.34 (between SSC and AC), and 0.29 (between AC and LP), while no positive correlations were observed for TPC, LP, and CAT. In contrast, two negative correlations were found by both SSC and AC in associations with GPA and CAT, followed by TPC and LP, which had only a negative linkage with CAT.
Under the cadmium condition of Cd-250, 16 positive and 5 negative correlations were revealed (Figure 5B). The r values for significant positive correlation ranged between 0.65 and 0.26 for the associations between GPA and CAT and between STI and TPC. Four positive linkages were documented by STI: GPA (r = 0.56 **, p = 0.001), WU (r = 0.46 **, p = 0.001), CAT (r = 0.43 **, p = 0.001), and TPC (r = 0.26 *, p = 0.04). TPC and AC showed three positive correlations with CAT, AC, and GPA, and WU, CAT, and GPA, respectively. SSC traits follow by presenting two positive correlations with GPA and TPC with r values of 0.39 ** and 0.27 *, respectively, while only one positive linkage was established between GPA and CAT (r = 0.65 **, p = 0.0001), PC and TPC (r = 0.37 *, p = 0.008), LP and CAT (r = 0.35 **, p = 0.006), and CAT and WU (r = 0.28 *, p = 0.03). PC under Cd-250 discovered three negative relations with SSC, LP, and WU, while TPC and AC showed negative correlations with LP.
Under the final cadmium treatment, Cd-500, positive correlations among almost all studied traits were detected, with the exception of CAT, which showed no positive linkage, and no negative correlations were found in this condition (Figure 5C). Among the observed traits, 31 significant r values were found: 7 for STI, 6 for PC, 5 for each SSC and TPC, 4 for AC, and 2 for each LP and GPA. The r values varied from 0.67 to 0.29 for associations between PC with SSC and AC with WU, respectively. The impressive positive significant linkage between PC and SSC (r = 0.67 ***, p < 0.0001) was detected, and then the relation between TPC and GPA came after (r = 0.65 ***, p < 0.0001), followed by SSC and GPA (r = 0.62 ***, p < 0.0001). These findings display that a positive and significant association between STI and other studied parameters was observed and improved by the tested barley accessions under the increment of cadmium conditions.

4. Discussion

The accumulation of cadmium in plant tissues inhibits growth and causes a number of toxicological symptoms. The first sign of Cd buildup in plants is a decline in their growth and development [3]. This effect is seen at various levels, including the lengthening of roots and shoots, germination, and the accumulation of cadmium in plant tissue organs in various plant species [31]. The negative effects of Cd toxicity on plants, including disruption of their basic physiological systems, are well established [32]. Reactive oxygen species (ROS) are produced when plants are exposed to heavy metals; these ROS react with lipids, proteins, nucleic acids, and other molecules, leading to lipid peroxidation, membrane damage, and enzyme inactivation [22,33,34]. Results showed that cadmium toxicity had a significant impact on the development and productivity of tomato plants. Several factors are responsible for these decreases [32], including the inhibition of cell division and elongation via the glycolysis pathway [35], the decrease in the mitotic division of meristematic cells [36], the decrease in nutrient uptake and photosynthetic efficiency, which weakens their photosynthetic production capacity, and the increase in production of ROS, which damages the cell membrane and macromolecules [37]. Numerous studies have already shown that Cd has negative effects on tomato plant growth and yield [38,39,40,41,42].
Cd had a greater effect on the shoot and root biomass of the Cd-sensitive genotypes (Bujayl 1-Shaqlawa and Black-Kalar) than on the Cd-tolerant genotypes (Arabi Aswad and ABN). Root growth was significantly reduced when compared to the shoot portion. This could be explained by the fact that these Cd-stressed accessions have lower aboveground Cd concentrations than their roots, combined with the lack of toxicity symptoms. This could support the significance of Cd root-retention mechanisms developed by tolerant accessions to shield aerial parts from the toxic influence of Cd [43]. The accumulation of a high amount of Cd in the roots had a negative impact on the roots’ morpho-physiological processes, leading to a decline in underground biomass that was more severe than the decline in aboveground biomass [43]. Plants store more Cd in their root cell walls and vacuoles to limit its movement throughout the plant’s shoot system and protect physiological and metabolic processes active in tissues such as photosynthetic ones [44,45]. The biosynthesis of phytosiderophore chelation in the presence of heavy metals is one of several mechanisms that have been proposed to inhibit cadmium uptake and protect plants from toxicity [46]. This kind of chelator, according to research conducted on barley by Kudo, Kudo et al. in 2007, may mediate cadmium mobilization around the root and lead to an improvement in cadmium aggregation in the radical. From those points, it can be deduced that most accessions relate to this mechanism by increasing the weight of seedlings, particularly for the first and second doses of cadmium application.
Through secondary metabolism in plants, a large number of compounds are provided that mostly function to enhance plants’ tolerance to different stress conditions [5,47]. Secondary metabolites and phytohormones precisely participate in reducing the adverse effects of heavy metals by chelating the metal ions of cadmium and other heavy metals, reducing the level of ROS, limiting the synthesis of free radicals, and providing an osmotic homeostasis balance of nutrients [48]. Some critical markers that affect the response of plants in secondary metabolism production are the concentrations of heavy metals. As mentioned by Balali-Mood et al. [49], low levels of heavy metals increase the production of secondary metabolites, while the synthesis and its production will be reduced in plants with a higher dose of heavy metals. Physio-biochemical tests of the seedling were performed both in normal and Cd stress conditions to better understand the responses of tolerant and sensitive genotypes to Cd stress. The uptake of water is the first step for seed germination and ends with the start of elongation by the radicle. Under several physical and heavy metal stress conditions, the dynamics of seed germination are altered. There have been many studies on the effect of heavy metals on germination mechanisms and water uptake [50,51,52].
Under the presence of heavy metals, PC can directly chelate these substrates and, accordingly, reduce the toxic effects of metals on plant organs [53]. The accumulation of proline is also related to carbohydrate metabolism. Arnao et al. [54] stated that the accumulation of proline requires carbohydrates. Interestingly, in our investigation, similar patterns of responses by barley accessions were stated for both proline and soluble sugar content accumulations. The functions of soluble sugars are signaling and sensing molecules in plants, and in that way, they regulate and activate several genes that are involved in metabolic and protection activities against diverse stress conditions, including heavy metals [55]. In our study, high levels of PC, SSC, and TPC accumulation in barley plants suggest that these molecules were used by the plants to mitigate the toxicity of Cd. Through the chelating of metals or neutralizing the free radicals produced by the metals, phenolic substances can reduce the oxidative damage caused by heavy metal stress [56]. This is why the levels of phenolic components in a plant’s tissues are often used as a surrogate for the impact of environmental stressors on the plant. This could explain why phenolic compound levels increased in response to Cd stress. Phenolic chemicals are used by barley plants as a defense mechanism against Cd stress, as shown by the increased accumulation of phenolics in tissue following Cd exposure [57].
Increased ROS elimination capacity, enhanced chelation abilities toward Cd metals in root plants, and decreased translocation of Cd from the roots to the shoots were all observed in barley plants with a higher content of phenolic compounds in their tissues [58]. It is possible that this chelated Cd metal will be taken up by the roots and stored in vacuoles [59]. Soluble phenolic molecules, such as those involved in lignin biosynthesis, help plants build physical barriers between their cells and the toxic effects of Cd, making the plant more resistant to the metal. In our study, the antioxidant substances such as phenolic compounds, GPA, and CAT increased under stress conditions, and antioxidant molecules, including phenolics, CAT, and GPA, may act as a defense mechanism against the stress of hazardous metals such as Cd [22]. Increasing the activity of the protective enzyme systems (GPA and CAT) has been shown in some studies to decrease lipid membrane peroxidation and preserve membrane integrity [60,61,62]. Arabi Aswad and ABN, two Cd-tolerant genotypes, accumulated more PC, SSC, TPC, AC, and antioxidant enzymes than Cd-sensitive genotypes (Bujayl 1-Shaqlawa and Black-Kalar). This buildup may be the cause of the Cd’s reduced impact on seedling growth in Cd-tolerant genotypes. The results of the OMICS analysis revealed that the physiochemical markers associated with the different degrees of tolerance are affected by Cd concentration. The correlation findings confirmed this result.
Several researchers studied the impact of Cd on the growth of barley. Research conducted by Kintlová et al. [63] showed inhibitory effects of cadmium on barley growth, particularly on root length, using 11 different concentrations of cadmium ranging between 0.01 μM and 1000 μM. It is worth mentioning that even with high concentrations of cadmium, the barley roots survived in their research. In accordance with our findings. Kalai et al. [64] revealed that under three different concentrations of cadmium, namely 25, 50, and 100 µM compared to an untreated barley plant, the growth of roots and shoots decreased even with the lowest dose of cadmium conducted in their research compared to our investigation. In addition, they found clear inhibition of seed germination after cadmium exposure because of failure in reserve mobilization from the endosperm, not as a consequence of limiting water uptake by barley seeds. Through diverse mechanisms, cadmium is known to inhibit the germination of seeds [19]. Recent studies on the transcriptomic responses of barley to cadmium by Kintlová et al. [65] from the Czech Academy of Sciences demonstrated a significant decrease in barley growth at the seedling stage for both shoot and root under exposure of the barley plant to 80 μM of cadmium.

5. Conclusions

From our findings, it can be deduced that there is a sizable genetic distance between 59 accessions of barley. Based on the amount of cadmium exposure, the responses of the barley accessions varied. According to our findings, most biochemical traits tested by most accessions were stimulated by intermediate exposure to cadmium (Cd-250). The barley accessions Asad-14, Arabi Aswad, and ABN displayed favorable behavior under all cadmium exposures. The physiochemical markers can be used to distinguish between groups with high, moderate, and low tolerances, depending on the cadmium level. The only marker for identifying the three groups of tolerance under all Cd stress conditions was WU. The mechanisms that regulate cadmium uptake, transportation, and accumulation are still not fully understood. Many further studies are required at the molecular level to better understand the genetic functions that reduce the adverse effects of cadmium and to ensure better crop production under cadmium stress conditions.

Supplementary Materials

The following supporting information can be downloaded at https://0-www-mdpi-com.brum.beds.ac.uk/article/10.3390/agronomy13061502/s1, Figure S1. Effects of various cadmium concentrations on the growth of tolerant (A) and susceptible (B) barley accessions; Table S1. Code, origin, and name of 59 barley accessions included in this study; Table S2. Some descriptive statistics, F, and probability values of growth and biomass collected from 59 accessions of barley under normal and cadmium stress conditions; Table S3. Some descriptive statistics, F, and probability values of physiochemical collected from 59 accessions of barley under normal and cadmium stress conditions; Table S4. Comparison means of seedling morphological traits collected from 59 barley accessions under normal conditions; Table S5. Comparison means of seedling morphological traits collected from 59 barley accessions under 125 µM cadmium stress conditions; Table S6. Comparison means of seedling morphological traits collected from 59 barley accessions under 250 µM cadmium stress conditions; Table S7. Comparison means of seedling morphological traits collected from 59 barley accessions under 500 µM cadmium stress conditions; Table S8. Comparison means of seedling physiochemical parameters collected from 59 barley accessions under control conditions; Table S9. Comparison means of seedling physiochemical parameters collected from 59 barley accessions under 125 µM cadmium stress conditions; Table S10. Comparison means of seedling physiochemical parameters collected from 59 barley accessions under 250 µM cadmium stress conditions; Table S11. Comparison means of seedling physiochemical parameters collected from 59 barley accessions under 500 µM cadmium stress conditions.

Author Contributions

Conceptualization, N.A.-r.T. and K.M.M.; methodology, D.D.L. and K.S.R.; data curation, D.D.L. and K.S.R.; formal analysis, N.A.-r.T.; writing—original draft preparation, N.A.-r.T. and D.D.L.; writing—review and editing, N.A.-r.T., K.M.M., K.S.R., F.F.K. and D.D.L. All authors have read and agreed to the published version of the manuscript.

Funding

This research received no external funding.

Institutional Review Board Statement

Not applicable.

Informed Consent Statement

Not applicable.

Data Availability Statement

The article and supplementary files contain all data.

Acknowledgments

The authors would like to thank the College of Agricultural Engineering Sciences staff of the University of Sulaimani for their assistance and support during this work.

Conflicts of Interest

The authors declare no conflict of interest.

References

  1. Vareda, J.P.; Valente, A.J.M.; Durães, L. Assessment of heavy metal pollution from anthropogenic activities and remediation strategies: A review. J. Environ. Manag. 2019, 246, 101–118. [Google Scholar] [CrossRef] [PubMed]
  2. Osmolovskaya, N.G.; Dung, V.V.; Kudryashova, Z.K.; Kuchaeva, L.N.; Popova, N.F. Effect of cadmium on distribution of potassium, calcium, magnesium, and oxalate accumulation in Amaranthus cruentus L. Plants. Russ. J. Plant Physiol. 2018, 65, 553–562. [Google Scholar] [CrossRef]
  3. Qin, S.; Liu, H.; Nie, Z.; Rengel, Z.; Gao, W.; Li, C.; Zhao, P. Toxicity of cadmium and its competition with mineral nutrients for uptake by plants: A review. Pedosphere 2020, 30, 168–180. [Google Scholar] [CrossRef]
  4. Islam, M.; Sandhi, A. Heavy Metal and Drought Stress in Plants: The Role of Microbes—A Review. Gesunde Pflanz. 2022, 1–14. [Google Scholar] [CrossRef]
  5. Berni, R.; Luyckx, M.; Xu, X.; Legay, S.; Sergeant, K.; Hausman, J.-F.; Lutts, S.; Cai, G.; Guerriero, G. Reactive oxygen species and heavy metal stress in plants: Impact on the cell wall and secondary metabolism. Environ. Exp. Bot. 2019, 161, 98–106. [Google Scholar] [CrossRef]
  6. Tan, Y.; Duan, Y.; Chi, Q.; Wang, R.; Yin, Y.; Cui, D.; Li, S.; Wang, A.; Ma, R.; Li, B.; et al. The role of reactive oxygen species in plant response to radiation. Int. J. Mol. Sci. 2023, 24, 3346. [Google Scholar] [CrossRef]
  7. Zandi, P.; Schnug, E. Reactive oxygen species, antioxidant responses and implications from a microbial modulation perspective. Biology 2022, 11, 155. [Google Scholar] [CrossRef]
  8. Berwal, M.K.; Haldhar, S.M.; Ram, C.; Shil, S.; Kumar, R.; Gora, J.S.; Singh, D.; Samadia, D.K.; Kumar, M.; Mekhemar, M. Calligonum polygonoides L. as novel source of bioactive compounds in hot arid regions: Evaluation of phytochemical composition and antioxidant activity. Plants 2021, 10, 1156. [Google Scholar] [CrossRef]
  9. Thakur, M.; Praveen, S.; Divte, P.R.; Mitra, R.; Kumar, M.; Gupta, C.K.; Kalidindi, U.; Bansal, R.; Roy, S.; Anand, A.; et al. Metal tolerance in plants: Molecular and physicochemical interface determines the “not so heavy effect” of heavy metals. Chemosphere 2022, 287, 131957. [Google Scholar] [CrossRef]
  10. Irato, P.; Santovito, G. Enzymatic and Non-Enzymatic Molecules with Antioxidant Function. Antioxidants 2021, 10, 579. [Google Scholar] [CrossRef]
  11. Delangiz, N.; Khoshru, B.; Asgari Lajayer, B.; Ghorbanpour, M.; Kazemalilou, S. Molecular Mechanisms of Heavy Metal Tolerance in Plants. In Cellular and Molecular Phytotoxicity of Heavy Metals; Springer: Cham, Switzerland, 2020; pp. 125–136. [Google Scholar]
  12. Seregin, I.V.; Kozhevnikova, A.D. Phytochelatins: Sulfur-Containing Metal(loid)-Chelating Ligands in Plants. Int. J. Mol. Sci. 2023, 24, 2430. [Google Scholar] [CrossRef] [PubMed]
  13. Kushwaha, A.; Rani, R.; Kumar, S.; Gautam, A. Heavy metal detoxification and tolerance mechanisms in plants: Implications for phytoremediation. Environ. Rev. 2016, 24, 39–51. [Google Scholar] [CrossRef]
  14. Kobayashi, T.; Nozoye, T.; Nishizawa, N.K. Iron transport and its regulation in plants. Free Radic. Biol. Med. 2019, 133, 11–20. [Google Scholar] [CrossRef] [PubMed]
  15. Lin, G.; Wang, K.; He, X.; Yang, Z.; Wang, L. Characterization of physicochemical parameters and bioavailable heavy metals and their interactions with microbial community in arsenic-contaminated soils and sediments. Environ. Sci. Pollut. Res. 2022, 29, 49672–49683. [Google Scholar] [CrossRef]
  16. Guo, F.; Ding, C.; Zhou, Z.; Huang, G.; Wang, X. Effects of combined amendments on crop yield and cadmium uptake in two cadmium contaminated soils under rice-wheat rotation. Ecotoxicol. Environ. Saf. 2018, 148, 303–310. [Google Scholar] [CrossRef]
  17. Dawood, M.F.A.; Tahjib-Ul-Arif, M.; Sohag, A.A.M.; Abdel Latef, A.A.H. Fluoride mitigates aluminum-toxicity in barley: Morpho-physiological responses and biochemical mechanisms. BMC Plant Biol. 2022, 22, 287. [Google Scholar] [CrossRef]
  18. Pérez-García, L.-A.; Sáenz-Mata, J.; Fortis-Hernández, M.; Navarro-Muñoz, C.E.; Palacio-Rodríguez, R.; Preciado-Rangel, P. Plant-growth-promoting rhizobacteria improve germination and bioactive compounds in cucumber seedlings. Agronomy 2023, 13, 315. [Google Scholar] [CrossRef]
  19. Huybrechts, M.; Cuypers, A.; Deckers, J.; Iven, V.; Vandionant, S.; Jozefczak, M.; Hendrix, S. Cadmium and plant development: An agony from seed to seed. Int. J. Mol. Sci. 2019, 20, 3971. [Google Scholar] [CrossRef]
  20. Zulfiqar, U.; Jiang, W.; Xiukang, W.; Hussain, S.; Ahmad, M.; Maqsood, M.F.; Ali, N.; Ishfaq, M.; Kaleem, M.; Haider, F.U.; et al. Cadmium phytotoxicity, tolerance, and advanced remediation approaches in agricultural soils; A comprehensive review. Front. Plant Sci. 2022, 13, 773815. [Google Scholar] [CrossRef]
  21. Demecsová, L.; Zelinová, V.; Liptáková, Ľ.; Tamás, L. Mild cadmium stress induces auxin synthesis and accumulation, while severe cadmium stress causes its rapid depletion in barley root tip. Environ. Exp. Bot. 2020, 175, 104038. [Google Scholar] [CrossRef]
  22. Jawad Hassan, M.; Ali Raza, M.; Ur Rehman, S.; Ansar, M.; Gitari, H.; Khan, I.; Wajid, M.; Ahmed, M.; Abbas Shah, G.; Peng, Y.; et al. Effect of cadmium toxicity on growth, oxidative damage, antioxidant defense system and cadmium accumulation in two sorghum cultivars. Plants 2020, 9, 1575. [Google Scholar] [CrossRef] [PubMed]
  23. Lateef, D.; Mustafa, K.; Tahir, N. Screening of Iraqi barley accessions under PEG-induced drought conditions. All Life 2021, 14, 308–332. [Google Scholar] [CrossRef]
  24. Rasul, K.S.; Grundler, F.M.W.; Abdul-razzak Tahir, N. Genetic diversity and population structure assessment of Iraqi tomato accessions using fruit characteristics and molecular markers. Hortic. Environ. Biotechnol. 2022, 63, 523–538. [Google Scholar] [CrossRef]
  25. Tahir, N.A.; Ahmed, J.O.; Azeez, H.A.; Palani, W.R.M.; Omer, D.A. Phytochemical, antibacterial, antioxidant and phytotoxicity screening of the extracts collected from the fruit and root of wild Mt. Atlas mastic tree (Pistacia atlantica subsp. kurdica). Appl. Ecol. Environ. Res. 2019, 17, 4417–4429. [Google Scholar] [CrossRef]
  26. Tahir, N.A.; Rasul, K.S.; Lateef, D.D.; Grundler, F.M.W. Effects of Oak Leaf Extract, Biofertilizer, and Soil Containing Oak Leaf Powder on Tomato Growth and Biochemical Characteristics under Water Stress Conditions. Agriculture 2022, 12, 2082. [Google Scholar] [CrossRef]
  27. Ketata, H.Y.; Yau, S.K.; Nachit, M. Relative consistency performance across environments. In Proceedings of the International Symposium on Physiology and Breeding of Winter Cereals for stressed Mediterranean Environments, Montpellier, France, 3–6 July 1989; pp. 391–400. [Google Scholar]
  28. Pour-Aboughadareh, A.; Yousefian, M.; Moradkhani, H.; Moghaddam Vahed, M.; Poczai, P.; Siddique, K.H.M. iPASTIC: An online toolkit to estimate plant abiotic stress indices. Appl. Plant Sci. 2019, 7, e11278. [Google Scholar] [CrossRef]
  29. Verheijen, M.; Tong, W.; Shi, L.; Gant, T.W.; Seligman, B.; Caiment, F. Towards the development of an omics data analysis framework. Regul. Toxicol. Pharmacol. 2020, 112, 104621. [Google Scholar] [CrossRef]
  30. Bianchi, L.; Sframeli, M.; Vantaggiato, L.; Vita, G.L.; Ciranni, A.; Polito, F.; Oteri, R.; Gitto, E.; Di Giuseppe, F.; Angelucci, S.; et al. Nusinersen Modulates Proteomics Profiles of Cerebrospinal Fluid in Spinal Muscular Atrophy Type 1 Patients. Int. J. Mol. Sci. 2021, 22, 4329. [Google Scholar] [CrossRef]
  31. El Rasafi, T.; Oukarroum, A.; Haddioui, A.; Song, H.; Kwon, E.E.; Bolan, N.; Tack, F.M.G.; Sebastian, A.; Prasad, M.N.V.; Rinklebe, J. Cadmium stress in plants: A critical review of the effects, mechanisms, and tolerance strategies. Crit. Rev. Environ. Sci. Technol. 2022, 52, 675–726. [Google Scholar] [CrossRef]
  32. Haider, F.U.; Liqun, C.; Coulter, J.A.; Cheema, S.A.; Wu, J.; Zhang, R.; Wenjun, M.; Farooq, M. Cadmium toxicity in plants: Impacts and remediation strategies. Ecotoxicol. Environ. Saf. 2021, 211, 111887. [Google Scholar] [CrossRef]
  33. Juan, C.A.; Pérez de la Lastra, J.M.; Plou, F.J.; Pérez-Lebeña, E. The chemistry of reactive oxygen species (ROS) revisited: Outlining their role in biological macromolecules (DNA, lipids and proteins) and induced pathologies. Int. J. Mol. Sci. 2021, 22, 4642. [Google Scholar] [CrossRef] [PubMed]
  34. Dayem, A.A.; Hossain, M.K.; Lee, S.B.; Kim, K.; Saha, S.K.; Yang, G.-M.; Choi, H.Y.; Cho, S.-G. The Role of Reactive Oxygen Species (ROS) in the Biological Activities of Metallic Nanoparticles. Int. J. Mol. Sci. 2017, 18, 120. [Google Scholar] [CrossRef] [PubMed]
  35. Dalla Vecchia, F.; La Rocca, N.; Moro, I.; de Faveri, S.; Andreoli, C.; Rascio, N. Morphogenetic, ultrastructural and physiological damages suffered by submerged leaves of Elodea canadensis exposed to cadmium. Plant Sci. 2005, 168, 329–338. [Google Scholar] [CrossRef]
  36. Abbas, T.; Rizwan, M.; Ali, S.; Adrees, M.; Zia-Ur-Rehman, M.; Qayyum, M.F.; Ok, Y.S.; Murtaza, G. Effect of biochar on alleviation of cadmium toxicity in wheat (Triticum aestivum L.) grown on Cd-contaminated saline soil. Environ. Sci. Pollut. Res. 2018, 25, 25668–25680. [Google Scholar] [CrossRef] [PubMed]
  37. Abeed, A.H.A.; Mahdy, R.E.; Alshehri, D.; Hammami, I.; Eissa, M.A.; Abdel Latef, A.A.H.; Mahmoud, G.A.-E. Induction of resilience strategies against biochemical deteriorations prompted by severe cadmium stress in sunflower plant when Trichoderma and bacterial inoculation were used as biofertilizers. Front. Plant Sci. 2022, 13, 1004173. [Google Scholar] [CrossRef] [PubMed]
  38. Badawy, I.H.; Hmed, A.A.; Sofy, M.R.; Al-Mokadem, A.Z. Alleviation of cadmium and nickel toxicity and phyto-stimulation of tomato plant L. by Endophytic Micrococcus luteus and Enterobacter cloacae. Plants 2022, 11, 2018. [Google Scholar] [CrossRef]
  39. Carvalho, M.E.; Piotto, F.A.; Franco, M.R.; Borges, K.L.; Gaziola, S.A.; Castro, P.R.; Azevedo, R.A. Cadmium toxicity degree on tomato development is associated with disbalances in B and Mn status at early stages of plant exposure. Ecotoxicology 2018, 27, 1293–1302. [Google Scholar] [CrossRef]
  40. Carvalho, M.E.; Piotto, F.A.; Gaziola, S.A.; Jacomino, A.P.; Jozefczak, M.; Cuypers, A.; Azevedo, R.A. New insights about cadmium impacts on tomato: Plant acclimation, nutritional changes, fruit quality and yield. Food Energy Secur. 2018, 7, e00131. [Google Scholar] [CrossRef]
  41. Naciri, R.; Lahrir, M.; Benadis, C.; Chtouki, M.; Oukarroum, A. Interactive effect of potassium and cadmium on growth, root morphology and chlorophyll a fluorescence in tomato plant. Sci. Rep. 2021, 11, 5384. [Google Scholar] [CrossRef]
  42. Dad, K.; Nawaz, M.; Hassan, R.; Javed, K.; Shaheen, A.; Zhao, F.; Imran, M.; Shah, S.T.H.; Anwar, M.F.; Aurangzaib, M. Impact of biochar on the growth and physiology of tomato grown in the cadmium contaminated soil. Pak. J. Agric. Sci. 2021, 34, 454–462. [Google Scholar] [CrossRef]
  43. Abeed, A.H.A.; Salama, F.M. Attenuating Effect of an Extract of Cd-Hyperaccumulator Solanum nigrum on the Growth and Physio-chemical Changes of Datura innoxia Under Cd Stress. J. Soil Sci. Plant Nutr. 2022, 22, 4868–4882. [Google Scholar] [CrossRef]
  44. Cong, L.; Yu, L.; Jing, T.; Yanshu, Z.; Jinjuan, F. Changes in sucrose metabolism in maize varieties with different cadmium sensitivities under cadmium stress. PLoS ONE 2020, 15, e0243835. [Google Scholar]
  45. Yuan, H.M.; Huang, X. Inhibition of root meristem growth by cadmium involves nitric oxide-mediated repression of auxin accumulation and signalling in Arabidopsis. Plant Cell Environ. 2016, 39, 120–135. [Google Scholar] [CrossRef] [PubMed]
  46. Raza, A.; Habib, M.; Kakavand, S.N.; Zahid, Z.; Zahra, N.; Sharif, R.; Hasanuzzaman, M. Phytoremediation of cadmium: Physiological, biochemical, and molecular mechanisms. Biology 2020, 9, 177. [Google Scholar] [CrossRef]
  47. Isah, T. Stress and defense responses in plant secondary metabolites production. Biol. Res. 2019, 52, 39. [Google Scholar] [CrossRef]
  48. Hasanuzzaman, M.; Raihan, M.R.H.; Masud, A.A.C.; Rahman, K.; Nowroz, F.; Rahman, M.; Nahar, K.; Fujita, M. Regulation of Reactive Oxygen Species and Antioxidant Defense in Plants under Salinity. Int. J. Mol. Sci. 2021, 22, 9326. [Google Scholar] [CrossRef]
  49. Balali-Mood, M.; Naseri, K.; Tahergorabi, Z.; Khazdair, M.R.; Sadeghi, M. Toxic mechanisms of five heavy metals: Mercury, lead, chromium, cadmium, and arsenic. Front. Pharmacol. 2021, 12, 643972. [Google Scholar] [CrossRef]
  50. Kaur, H.; Nazir, F.; Hussain, S.J.; Kaur, R.; Rajurkar, A.B.; Kumari, S.; Siddiqui, M.H.; Mahajan, M.; Khatoon, S.; Khan, M.I.R. Gibberellic acid alleviates cadmium-induced seed germination inhibition through modulation of carbohydrate metabolism and antioxidant capacity in mung bean seedlings. Sustainability 2023, 15, 3790. [Google Scholar] [CrossRef]
  51. Nouri, M.; El Rasafi, T.; Haddioui, A. Responses of two barley subspecies to In vitro- induced heavy metal stress: Seeds germination, seedlings growth and cytotoxicity assay. Agriculture 2019, 65, 107–118. [Google Scholar] [CrossRef]
  52. Ali, J.; Ali, F.; Ahmad, I.; Rafique, M.; Munis, M.F.H.; Hassan, S.W.; Sultan, T.; Iftikhar, M.; Chaudhary, H.J. Mechanistic elucidation of germination potential and growth of Sesbania sesban seedlings with Bacillus anthracis PM21 under heavy metals stress: An in vitro study. Ecotoxicol. Environ. Saf. 2021, 208, 111769. [Google Scholar] [CrossRef]
  53. Spormann, S.; Nadais, P.; Sousa, F.; Pinto, M.; Martins, M.; Sousa, B.; Fidalgo, F.; Soares, C. Accumulation of proline in plants under contaminated soils-Are We on the same page? Antioxidants 2023, 12, 666. [Google Scholar] [CrossRef] [PubMed]
  54. Arnao, M.B.; Hernández-Ruiz, J.; Cano, A.; Reiter, R.J. Melatonin and Carbohydrate Metabolism in Plant Cells. Plants 2021, 10, 1917. [Google Scholar] [CrossRef] [PubMed]
  55. Jeandet, P.; Formela-Luboińska, M.; Labudda, M.; Morkunas, I. The Role of Sugars in Plant Responses to Stress and Their Regulatory Function during Development. Int. J. Mol. Sci. 2022, 23, 5161. [Google Scholar] [CrossRef] [PubMed]
  56. Chen, S.; Wang, Q.; Lu, H.; Li, J.; Yang, D.; Liu, J.; Yan, C. Phenolic metabolism and related heavy metal tolerance mechanism in Kandelia Obovata under Cd and Zn stress. Ecotoxicol. Environ. Saf. 2019, 169, 134–143. [Google Scholar] [CrossRef] [PubMed]
  57. Chao, Y.-Y.; Chen, C.-Y.; Huang, W.-D.; Kao, C.H. Salicylic acid-mediated hydrogen peroxide accumulation and protection against Cd toxicity in rice leaves. Plant Soil 2010, 329, 327–337. [Google Scholar] [CrossRef]
  58. Jiang, S.; Weng, B.; Liu, T.; Su, Y.; Liu, J.; Lu, H.; Yan, C. Response of phenolic metabolism to cadmium and phenanthrene and its influence on pollutant translocations in the mangrove plant Aegiceras corniculatum (L.) Blanco (Ac). Ecotoxicol. Environ. Saf. 2017, 141, 290–297. [Google Scholar] [CrossRef]
  59. Luo, J.-S.; Zhang, Z. Mechanisms of cadmium phytoremediation and detoxification in plants. Crop. J. 2021, 9, 521–529. [Google Scholar] [CrossRef]
  60. Galić, V.; Mlinarić, S.; Marelja, M.; Zdunić, Z.; Brkić, A.; Mazur, M.; Begović, L.; Šimić, D. Contrasting water withholding responses of young maize plants reveal link between lipid peroxidation and osmotic regulation corroborated by genetic analysis. Front. Plant Sci. 2022, 13, 2099. [Google Scholar] [CrossRef]
  61. Zhao, H.; Guan, J.; Liang, Q.; Zhang, X.; Hu, H.; Zhang, J. Effects of cadmium stress on growth and physiological characteristics of sassafras seedlings. Sci. Rep. 2021, 11, 9913. [Google Scholar] [CrossRef]
  62. Waheed, A.; Haxim, Y.; Islam, W.; Ahmad, M.; Ali, S.; Wen, X.; Khan, K.A.; Ghramh, H.A.; Zhang, Z.; Zhang, D. Impact of cadmium stress on growth and physio-biochemical attributes of Eruca sativa Mill. Plants 2022, 11, 2981. [Google Scholar] [CrossRef]
  63. Kintlová, M.; Blavet, N.; Cegan, R.; Hobza, R. Transcriptome of barley under three different heavy metal stress reaction. Genomics Data 2017, 13, 15–17. [Google Scholar] [CrossRef] [PubMed]
  64. Kalai, T.; Khamassi, K.; Da Teixeira Silva, J.A.; Gouia, H.; Bettaieb Ben-Kaab, L. Cadmium and copper stress affect seedling growth and enzymatic activities in germinating barley seeds. Arch. Agron. Soil Sci. 2014, 60, 765–783. [Google Scholar] [CrossRef]
  65. Kintlová, M.; Vrána, J.; Hobza, R.; Blavet, N.; Hudzieczek, V. Transcriptome response to cadmium exposure in barley (Hordeum vulgare L.). Front. Plant Sci. 2021, 12, 629089. [Google Scholar] [CrossRef] [PubMed]
Figure 1. Radar chart showing the effect of the different Cd treatments on the growth traits of barley genotypes. The numbers (1–59) represent the barley genotypes. (AE) refer to the germination percentage, root length per seedling, shoot length per seedling, fresh weight per seedling, and dry weight per seedling, respectively. Cd-0: control condition, Cd-125: treatment of seeds with 125 µM of cadmium, Cd-250: treatment of seeds with 250 µM of cadmium, Cd-500: treatment of seeds with 500 µM of cadmium.
Agronomy 13 01502 g001
Figure 2. Box plot comparing phenotypic characteristics of plants grown under normal and cadmium-stressed conditions. (A) seed germination, (B) root length per seedling, (C) shoot length per seedling, (D) fresh weight per seedling, and (E) dry weight per seedling. The values provided represent an average of the results from the three separate measurements. Cd-0: control condition, Cd-125: treatment of seeds with 125 µM of cadmium, Cd-250: treatment of seeds with 250 µM of cadmium, Cd-500: treatment of seeds with 500 µM of cadmium. Different letters represent a significant difference between the mean values according to Duncan’s multiple-range test (p ≤ 0.01).
Agronomy 13 01502 g002
Figure 3. Effect of the different Cd treatments on water uptake and biochemical traits of barley seedlings. (A) Seed water uptake, (B) proline content, (C) soluble sugar content, (D) total phenolic content, (E) antioxidant activity, (F) catalase activity, (G) guaiacol peroxidase activity, and (H) lipid peroxidation activity. The values specified are the mean values determined for the three measurements collected for control (Cd-0) and cadmium concentrations (Cd-125, Cd-250, and Cd-500 μM). The numbers (1–59) represent the barley genotypes.
Agronomy 13 01502 g003
Figure 4. Graph box indicating the differences in seed water uptake and biochemical traits under control and cadmium stress conditions. (A) Seed water uptake, (B) proline content, (C) soluble sugar content, (D) total phenolic content, (E) antioxidant activity, (F) catalase activity, (G) guaiacol peroxidase activity, and (H) lipid peroxidation activity. The values provided are the calculated averages of the three different assessments collected for control (Cd-0) and cadmium concentrations (Cd-125, Cd-250, and Cd-500 μM). According to Duncan’s multiple-range test, different letters indicate that there is a significant difference between the mean values (p ≤ 0.01).
Agronomy 13 01502 g004
Figure 5. Correlations among different biochemical traits with respect to stress tolerance index under different cadmium exposure: (A) 125 μM, (B) 250 μM, and (C) 500 μM. STI: stress tolerance index, WU: seed water uptake, PC: proline content, SSC: soluble sugar content, TPC total phenolic content, AC: antioxidant activity, CAT: catalase activity, GPA: guaiacol peroxidase activity, LP: lipid peroxidation activity.
Agronomy 13 01502 g005
Table 1. Rank of barley accessions calculated by an average number of ranks and stress tolerance index based on the morphological characteristics of seedlings under Cd-125 conditions.
Accession CodeASRSTIRankAccession CodeASRSTIRankAccession CodeASRSTIRank
AC2910.091.161AC2622.911.0621AC1437.000.9641
AC2410.641.172AC723.821.0722AC5337.730.4342
AC2510.731.143AC2124.361.1323AC1138.180.9243
AC3711.821.114AC5024.450.9324AC5639.001.0244
AC2311.911.135AC1024.911.0825AC5139.090.4745
AC1313.001.166AC4325.270.9126AC4239.270.9746
AC814.641.137AC3126.001.1427AC4942.730.8847
AC1614.641.158AC3427.270.9528AC3342.820.9148
AC215.451.229AC328.180.8629AC1843.360.7949
AC2816.001.1610AC1228.450.9530AC5943.730.8850
AC3616.361.1511AC1729.001.0531AC5548.550.8251
AC4116.361.0912AC3229.091.1132AC4450.180.7852
AC4017.271.1513AC4529.450.9333AC1950.730.7553
AC3817.641.1514AC1530.000.9734AC4651.270.7754
AC3017.911.1715AC131.091.0635AC4751.640.5755
AC2718.091.1516AC2233.270.8236AC5453.550.6556
AC3919.731.0917AC2033.910.9037AC5253.820.5857
AC3520.821.0018AC5734.090.5038AC5854.090.6658
AC621.451.0219AC535.731.0039AC4858.550.3059
AC922.181.1220AC436.731.0340
ASR: average number of ranks, STI: stress tolerance index. The numbers (AC1-AC59) represent the barley genotypes.
Table 2. Rank of accessions of barley determined by the average number of ranks and stress tolerance index depending on the morphological characteristics of seedlings under Cd-250 conditions.
Accession CodeASRSTIRankAccession CodeASRSTIRankAccession CodeASRSTIRank
AC367.181.151AC2622.451.0221AC5336.550.4541
AC389.451.152AC1623.001.0922AC2037.000.8542
AC1112.001.053AC1423.550.9923AC437.000.9943
AC3012.271.174AC623.820.9724AC5738.360.3444
AC2912.451.115AC324.450.8625AC1838.730.7945
AC2112.911.146AC1025.181.0426AC1239.910.8646
AC3712.911.057AC1326.361.0727AC5440.910.9147
AC2813.451.148AC827.451.0428AC141.910.9448
AC3113.911.169AC4128.000.9929AC4943.360.8549
AC2414.551.1210AC3329.820.9430AC5544.000.8250
AC3914.551.0711AC5030.360.8431AC1946.450.7551
AC915.091.1012AC4530.640.8832AC1549.640.7952
AC4219.271.0313AC2531.270.9933AC5850.730.6853
AC3219.821.1114AC731.821.0034AC4651.450.7154
AC3519.910.9815AC2332.181.0035AC2252.090.6655
AC220.181.1716AC5134.090.5336AC4454.820.5856
AC2720.181.1017AC5934.180.9037AC4754.820.5057
AC520.551.0418AC1734.271.0038AC5256.640.4758
AC3422.000.9719AC4334.820.7739AC4858.270.3759
AC4022.181.0920AC5634.821.0140
ASR: average number of ranks, STI: stress tolerance index. The numbers (AC1-AC59) represent the barley genotypes.
Table 3. Rank of barley accessions defined as the mean number of ranks and stress tolerance index depending on the morphological characteristics of seedlings under Cd-500 conditions.
Accession CodeASRSTIRankAccession CodeASRSTIRankAccession CodeASRSTIRank
AC3110.911.141AC1321.361.0721AC1734.640.9741
AC3811.001.112AC721.551.0222AC2235.000.7442
AC2912.361.093AC3422.730.9323AC5136.000.4443
AC3712.731.024AC2423.551.0724AC5736.270.3344
AC3913.181.065AC4125.180.9925AC5437.730.9145
AC3013.361.146AC3525.550.9126AC5640.910.8946
AC2513.731.057AC3325.730.9527AC1545.910.7547
AC214.451.178AC2326.551.0028AC1846.730.6848
AC814.641.079AC2126.641.0529AC1948.000.6749
AC3214.911.1010AC1026.911.0230AC5548.550.6850
AC515.731.0411AC1428.910.9631AC1249.090.6851
AC1616.001.0912AC3629.361.0332AC5849.640.6352
AC916.641.0813AC4330.450.7833AC5950.000.6853
AC1117.360.9914AC5030.910.8134AC4753.180.4654
AC2617.551.0315AC431.361.0035AC4653.450.5255
AC2719.731.0816AC4531.820.8636AC4454.450.4856
AC2819.911.0917AC4232.910.9637AC5356.640.2457
AC320.000.8818AC4934.090.8738AC5257.000.3358
AC4020.001.0719AC2034.180.8439AC4858.180.2859
AC620.270.9820AC134.450.9840
ASR: average number of ranks, STI: stress tolerance index. The numbers (AC1-AC59) represent the barley genotypes.
Table 4. Rank of barley accessions calculated by an average number of ranks and stress tolerance index depending on the morphological characteristics of seedlings under all cadmium stress conditions.
Accession CodeASRSTIRankAccession CodeASRSTIRankAccession CodeASRSTIRank
AC2910.091.121AC621.910.9921AC135.820.9941
AC3810.091.142AC4122.091.0222AC5736.270.3942
AC3711.091.063AC1122.450.9923AC5639.270.9743
AC2413.271.124AC2122.551.1124AC4939.820.8744
AC3914.641.075AC3222.551.1025AC5340.000.3745
AC3015.361.166AC323.360.8726AC2242.360.7446
AC2515.551.067AC524.001.0327AC1243.820.8347
AC2816.181.138AC3424.730.9528AC1545.450.8348
AC3116.361.159AC725.451.0329AC5946.000.8249
AC3616.451.1110AC1025.551.0530AC1846.090.7550
AC216.641.1911AC5028.090.8631AC5447.730.8251
AC1616.731.1112AC4529.270.8932AC5547.910.7752
AC817.551.0813AC1429.820.9733AC1948.910.7353
AC917.731.1014AC4330.270.8234AC5852.090.6654
AC2719.181.1115AC3331.910.9335AC4652.730.6755
AC4019.641.1016AC4232.270.9836AC4754.270.5156
AC2620.271.0417AC2032.820.8637AC4454.450.6157
AC2320.641.0418AC1733.091.0138AC5256.640.4658
AC1320.911.1019AC434.001.0139AC4858.550.3259
AC3521.550.9620AC5135.730.4840
ASR: average number of ranks, STI: stress tolerance index. The numbers (AC1-AC59) represent the barley genotypes.
Table 5. Statistical OMICS analysis for integrating the responses of tested materials by different biochemical traits in the presence of three different treatments of cadmium.
Cd-125
Featuresp-ValueSignificantHigh ToleranceModerate ToleranceLow Tolerance
WU0.00Yes273.39 a ± 22.54229.81 b ± 16.67129.67 c ± 11.23
LP0.50No11.61 a ± 2.8910.25 a ± 3.789.42 a ± 2.64
GPA0.50No0.25 a ± 0.010.22 a ± 0.010.18 a ± 0.01
AC0.61No946.52 a ± 49.09912.26 a ± 42.56888.43 a ± 38.82
CAT0.61No64.94 a ± 11.4255.74 a ± 16.3855.11 a ± 17.41
SSC0.78No275.63 a ± 28.21277.90 a ± 32.30240.78 a ± 38.19
TPC0.78No151.90 a ± 34.17146.29 a ± 29.51139.81 a ± 27.89
PC0.85No1410.00 a ± 167.421325.00 a ± 122.451274.00 a ± 156.73
Cd-250
Featuresp-ValueSignificantHigh ToleranceModerate ToleranceLow Tolerance
GPA0.00Yes0.38 a ± 0.0050.20 b ± 0.0020.12 c ± 0.006
WU0.00Yes229.18 a ± 12.21191.28 b ± 18.93151.43 c ± 17.28
CAT0.00Yes83.56 a ± 9.1256.23 b ± 8.5647.12 b ± 9.08
TPC0.02Yes184.80 a ± 23.02156.15 b ± 24.11148.25 b ± 13.26
SSC0.20No367.77 a ± 37.04305.40 a ± 49.03286.97 a ± 29.19
AC0.24No950.15 a ± 56.11921.59 a ± 42.22856.87 a ± 36.12
PC0.63No2530.00 a ± 112.082437.00 a ± 118.172022.00 a ± 119.23
LP0.66No13.55 a ± 0.9213.67 a ± 1.1012.17 a ± 1.21
Cd-500
Featuresp-ValueSignificantHigh ToleranceModerate ToleranceLow Tolerance
GPA0.00Yes0.44 a ± 0.0030.21 b ± 0.0010.11 c ± 0.001
WU0.00Yes181.08 a ± 13.12155.79 b ± 21.17115.35 c ± 16.03
PC0.00Yes3711.00 a ± 24.292130.00 b ± 19.831388.00 c ± 27.07
TPC0.00Yes183.47 a ± 9.76138.30 b ± 7.72119.77 b ± 8.86
SSC0.00Yes473.20 a ± 23.26270.21 b ± 19.19238.06 b ± 17.05
AC0.00Yes975.98 a ± 16.77843.01 b ± 17.03795.59 b ± 11.52
LP0.00Yes13.91 a ± 1.0710.66 b ± 1.158.63 b ± 1.17
CAT0.08No73.12 a ± 6.7856.13 a ± 7.2949.03 a ± 4.89
WU: seed water uptake, PC: proline content, SSC: soluble sugar content, TPC total phenolic content, AC: antioxidant activity, CAT: catalase activity, GPA: guaiacol peroxidase activity, LP: lipid peroxidation activity. According to Duncan’s multiple-range test, different letters indicate that there is a significant difference between the mean values (p ≤ 0.01).
Disclaimer/Publisher’s Note: The statements, opinions and data contained in all publications are solely those of the individual author(s) and contributor(s) and not of MDPI and/or the editor(s). MDPI and/or the editor(s) disclaim responsibility for any injury to people or property resulting from any ideas, methods, instructions or products referred to in the content.

