Article

Changes in Drip Irrigation Water Distribution Patterns Improve Fruit Quality and Economic Water Productivity in Early-Season Lemon Trees

by
Juan Miguel Robles
1,*,
José García-García
2,
Josefa María Navarro
1,
Pablo Botía
1 and
Juan Gabriel Pérez-Pérez
1,3
1
Equipo de Riego y Fisiología del Estrés, Instituto Murciano de Investigación y Desarrollo Agrario y Medioambiental (IMIDA), 30150 La Alberca, Region of Murcia, Spain
2
Equipo de Bioeconomía, Instituto Murciano de Investigación y Desarrollo Agrario y Medioambiental (IMIDA), 30150 La Alberca, Region of Murcia, Spain
3
Centro Para el Desarrollo de la Agricultura Sostenible, Instituto Valenciano de Investigaciones Agrarias (IVIA), 46113 Moncada, Valencia Province, Spain
*
Author to whom correspondence should be addressed.
Submission received: 19 April 2023 / Revised: 19 May 2023 / Accepted: 22 May 2023 / Published: 31 May 2023
(This article belongs to the Special Issue Effects of Agronomical Practices on Crop Quality and Sensory Profile)

Abstract

:
The physiological and agronomic responses of two irrigation systems were compared in ‘Fino 49′ lemon trees (Citrus limon [L.] Burm. fil.). The irrigation systems consisted of different designs of the irrigation installation (same amount of water and irrigation frequency): a conventional design (2L, two drip lines with six drippers per tree), and a design with a larger wetted surface (3L, implementing the conventional design with a third drip line with nine drippers per tree). Results indicated that the 3L design promoted a better distribution of water and fertilisers in the soil profile, improving some gas-exchange parameters in periods of low evaporative demand or after rain. The agronomic response showed two main effects on fruit quality: (1) the total numer of fruits affected by endoxerosis was reduced, and (2) the first harvest (the earliest fruits harvested) moved forward in time. From an economic point of view, economic water productivity was increased, mainly due to an increment in the proportion of first-harvested lemon, but also due to the decrease in lemon produced for the industry (affected by endoxerosis). The 3L irrigation system could be an interesting alternative to favour fruit precocity, improving the use of the available water resources for early lemon tree growers.

1. Introduction

Along with Turkey, Spain is one of the leading lemon producers in the Mediterranean basin [1]. The main areas of lemon production are located in south-eastern Spain, with a total production of 1,127,509 t in 2018 [2]. In Spain, lemons are mainly intended for fresh consumption (74%), with exports amounting to 61% of the total [3], and there are chiefly two main groups of lemon varieties: early/mid-season, such as ‘Fino’ (harvested from October to March), that account for 81% of total production, and late-season, such as ‘Verna’ (harvested from April to June).
In this region, the climate is semi-arid Mediterranean, and it is therefore characterised by dry, low-rain summers, with high temperatures and evaporative demand. Climate change is affecting the sustainability of the crops through an increase in water scarcity in several regions [4]. Rising temperatures and a probable increase in the amount of evaporation, combined with more rainfall uncertainty, have a significant influence on the irrigation-water requirement of citrus plants, especially in summer [5], increasing crop-water demand, which can promote an imbalance between the irrigation-water demand and the available resources of the plant [6].
Under this scenario, in citrus species, high water demand causes strong stomatal regulation to enable trees to limit water losses in semi-arid environments [7]. Eventual water deficits can occur in plants because transpiration losses exceed the hydraulic capacity of the plant to replace the water demanded, although the soil water amount may be at optimum levels. In summer, when the atmospheric demand exceeds the capacity of the roots to meet these deficits, this can be partly made up by the closure of stomata [8]. In the case of lemon trees, this effect is greater due to the larger tree size with regard to other citrus trees, such as sweet orange and mandarin. In lemon trees, the whole-tree transpiration of well-irrigated individuals commonly exceeds root water uptake, causing temporary water deficits and triggering stomatal closure to reduce transpiration [9]. In this sense, other authors have recently demonstrated in almond trees that tree transpiration can be limited by insufficiently wetted soil, even when supplied with an adequate irrigation dose, due to high hydraulic resistance during times of high evaporative demand [10].
Citrus are mostly cultivated using localised irrigation, which implies that the wetted soil does not cover the ground in full and permits a reduction in evaporation from the soil, increasing water use efficiency [11]. The volume of wetted soil has an important influence on tree response even when trees are supplied with adequate water; thus, implications for the design and operation of drip irrigation systems would be highly relevant [10]. In adult citrus trees, it is recommended to wet around 40–50% of the ground to ensure an adequate development of the crop [12]. The dimensions of the wetted bulb are related to the number of emitters per plant, the location where most of the roots are concentrated, and the fact that the latter presents an adequate development due to a high frequency of irrigation, allowing them to satisfy the requirements of the aerial part of the tree [13]. In the cultivation of citrus in Spain, between four and six emitters per tree are used in a 6 × 4 m tree-spacing [12]. In addition, the number of emitters per tree in drip irrigation can be determined depending on the age of the tree and the texture of the soil in the case of not having field tests [14]. Generally speaking, a single drip line is recommended per row of trees, but in practice the best results (both in terms of production and quality) are achieved with two drip lines per row of trees [12]. The use of two drip lines allows for a more even distribution of roots, but implies a greater investment [15]. Previous studies carried out by our group at the same experimental orchard showed that, in well-irrigated trees, the use of two drip lines in ‘Fino 49′ lemon trees allowed for the maintenance of a better plant water status (Ψstem ≈ −1.2 MPa) [16] than in those cases in which ‘Verna’ lemon trees were irrigated with a single drip line (Ψstem ≈ −1.5 MPa) [17] during high-demand periods. On the other hand, [18] compared the use of two drip lines versus one drip line per row in ‘Fino 95 lemon’, specifying that plant water status had not been altered and that both agronomic designs maintained a similar production when they was carried out in a single harvest.
In lemon trees, these transient water stress situations can coincide with one of the most critical stages in the development of the fruit (phase II), which can cause physiological alterations such as endoxerosis, which reduces the quality of the fruit [19,20]. The causes of this alteration, which has a greater incidence in dry years, have been related to water imbalances of the plant so that the fruit, in conditions of high temperature and transpiration, can bring water to the leaves [21]. In order to improve the application of the available water, it is necessary to look for simple, sustainable, and economically viable solutions that enhance the hydraulic capacity of the plant, promoting an advance in production and allowing for the obtention of an optimum fruit quality able to maintain market competitiveness.
Under these premises, our working hypothesis was that using an extra drip line in the agronomic design with two drip lines, but applying the same irrigation-water dose per tree, will allow for an increase in the wetted soil volume and for a greater uniformity in the water distribution in the soil, which should favour the agronomic response of the early ‘Fino 49’ lemon. This arrangement of drip lines would be novel and has not been studied in citrus.
Therefore, the objective of the study was to evaluate whether an increment in the wetted soil volume by increasing the number of drips per tree with a third drip line can reduce water imbalances in the plant produced during the months of maximum evaporative demand, thus enhancing the productive response and minimising physiological alterations of the fruit in early lemon trees.

2. Materials and Methods

2.1. Background Introduction, Experimental Conditions and Plant Material

The study was performed over three consecutive years (2017, 2018 and 2019) in an experimental station of the IMIDA located in Torre Pacheco, Murcia (south-eastern Spain). The soil was classified as an aridisol, with 24% clay, 18% loam and 58% sand (sandy clay loam soil), an organic-matter content of 1.88% (w/w), EC for a soil water extract (25 °C) of 1.24 mS cm−1, 12.84% active CaCO3 and a pH of 7.4. The estimated values of field capacity and permanent wilting point for our soil texture were 35% and 16%, respectively, for the entire soil profile (0–100 cm). The irrigation water that was used came from the Campo de Cartagena irrigation community, with a mean EC value during the experiment of 1.28 dS m−1. The climate was semi-arid Mediterranean, with a mean daily solar radiation during the 3 years of the experiment of 214 W m−2 (≈9.8 solar hours), a mean air temperature of 17.6 °C, an annual rainfall of 359 mm, and a total annual reference evapotranspiration (ETo), calculated via the Penman-Monteith method [22,23], of 1234 mm (three-year average) (Table 1). Climatic parameters were obtained daily from a weather station located in the experimental orchard (station TP-91 of the network of stations of the Servicio de Información Agraria de Murcia [SIAM-IMIDA]).
The experiment was performed in a 1 ha orchard on 24-year-old ‘Fino 49’ lemon trees (Citrus limon [L.] Burm. fil.) grafted on Citrus macrophylla Wester rootstock, with a tree-spacing of 8 m × 3 m. Two irrigation systems were applied, based on different agronomic designs of the irrigation installation: a conventional design (2L) with two drip lines, one on each side of the tree (1.5 m apart from the trunk), and with six drippers per tree; and a design with a larger wetted surface (3L), in which the conventional design was implemented with a third drip line installed next to the trunk, with a total of nine drippers per tree (Figure 1).
The drip line (UniRamTM, Netafim, Tel Aviv, Israel) consisted of self-compensated, anti-siphon, and anti-drainant drippers (3.5 L h−1) that were placed 1 m apart from each other. In both irrigation systems, the dose and frequency of irrigation were the same (100% of daily crop evapotranspiration [ETc]), and only the irrigation time was modified according to the number of drippers of each treatment, in order to apply the same amount of irrigation water. The irrigation scheduling was carried out by estimating the dose of irrigation based on ETc accumulated during the previous week, obtained according to the Doorenbos and Pruitt equation [22]:
E T c = [ 1 7 ( E T o E R ) ] × K r × K c
The summation 1 to 7 is the accumulated sum from Monday to Sunday of EToER, where ETc and ETo are in mm, Kr is the coefficient factor as a function of the shaded area for the crop [24], Kc is the crop coefficient and the effective rain (ER) for dry climates was estimated by the equation ER = 0.75 × (daily rain − 5 mm), considering that rains lower than 5 mm do not add significant moisture to the soil [25]. The Kr applied in all season was 1.00. Kc values applied during the experimental period were obtained from the “Servicio de Información Agraria de Murcia (SIAM-IMIDA)” for early-harvested ‘Fino’ lemon trees grafted on C. macrophylla. The average annual amount of fertiliser applied in both irrigation systems during the experiment was 646 g of N, 220 g of P2O5, 522 g of K2O, 21 g of MgO and 111 g of Fe chelate per tree, supplied through the fertigation system. Irrigation and fertigation were controlled automatically by a head-unit program (mod. Xilema NX300, Novedades Agrícolas, Torre Pacheco, Spain) and electro-hydraulic valves (mod. uPVC, Regaber, Parets del Vallès, Spain). The frequency of irrigation differed according to the season, from two days per week in winter to daily in summer in both irrigation systems. The amount of water applied for each irrigation system was measured with flowmeters. Pest control practices were those commonly used by growers for early-harvested lemon varieties in the area, according to technical standards of integrated production in citrus cultivation in the Region of Murcia (BORM, 2002) [26], as well as the update bulletins on the active substances authorised in lemon and grapefruit crops and their Maximum Residue Limits [3]. Pruning was performed manually after the harvest of the second cut of fruits, at the end of winter to avoid the risk of frost, as is typically done for this variety [14]. The layout of the experiment took the form of four completely randomised plots, with two irrigation systems per plot and three monitored trees per irrigation system within each plot (twelve trees per treatment). In each row, border trees were excluded from the study to eliminate potential edge effects.

2.2. Measurement

The volumetric water content (θv) of the soil was measured from 0 to 100 cm of depth every 10 cm with an in situ calibrated frequency domain reflectometer (FDR) (Diviner 2000®, Sentek Pty. Ltd., Stepney, South Australia). Eight access tubes per irrigation system were installed within the emitter-wetting area under the canopy and 10 cm away from the drip head, and with a perpendicular orientation with regard to the drip lines. Measurements were taken between 12:00 and 13:00 GMT every 15 days during the experiment.
Midday stem water potential (Ψstem) was measured fortnightly in one mature, fully expanded leaf in the middle third of the tree, in twelve trees per irrigation system. Leaves were enclosed within foil-covered plastic and aluminium envelopes at least 2 h before the midday measurement [27]. Specifically, during the 2019 season, midday fruit water potential (Ψfruit) was measured both in individuals that were both non-affected and in individuals affected by endoxerosis, for a total of twelve trees per irrigation system. The Ψstem and Ψfruit were measured at noon with a pressure chamber (model 3000; Soil Moisture Equipment. Corp., Santa Barbara, CA, USA) following the recommendations of [28].
Gas exchange measurements were made periodically, between 08:00 and 10:00 GMT, in daylight hours (to avoid high afternoon temperatures and air vapour pressure deficit). Measurements were made on healthy, fully expanded mature leaves (one leaf per tree, twelve trees per irrigation system) exposed to the sun in exterior mid-canopy positions. The leaf net photosynthesis rate (A), stomatal conductance (gs), and leaf transpiration (E) were measured with a portable photosynthesis system (Li-6400, Li-Cor, Lincoln, NE, USA) equipped with a broad leaf chamber (6.0 cm2). Instantaneous (A/E) and intrinsic (A/gs) leaf water use efficiency and intercellular CO2 concentrations (Ci) were calculated automatically by the internal program of the Li-6400, based on the equations of [29]. The air flow rate inside the leaf chamber was 500 μmol s−1. At the beginning of the measurements each day, the temperature of the block of the leaf chamber was fixed using the air temperature reference (15–26 °C). PorTable 12 g cartridges of high-pressure, liquefied, pure CO2 were attached to the console by an external CO2 source assembly and were controlled automatically with a CO2 injector system (6400-01 LiCOR, Lincoln, NE, USA). The reference CO2 concentration was fixed at 400 μmol mol−1. All of the measurements were made using a red–blue light source (6400-02B light emitting diode; Li-COR, Lincoln, NE, USA) attached to the leaf chamber, and the PPFD was fixed at the average value of the natural daylight at the time of measurement, 1200 μmol m−2 s−1, which exceeded the saturating light intensity for the photosynthesis of citrus leaves [30,31] but was not enough to provoke photoinhibition [32].
In the month of November of each season, leaf samples were taken for a mineral analysis of the leaves, and macronutrients (N, P, K, Ca, Mg, Na, and Cl) and micronutrients (Fe, Cu, Mn and Zn) were determined. Leaf samples consisted of twelve samples per irrigation system (three samples per block, from different trees), each composed of 25 fully mature leaves (five to eight months old). Leaves were briefly rinsed in deionised water, oven-dried at 60 °C, weighed and ground with a centrifugal mill before being passed through a 5 mm diameter sieve. The dried and ground leaf tissue was ashed and dissolved in HNO3 to determine the presence of P, K, Mg, Ca, Na, Fe, Cu, Mn and Zn using an ICP (Varian MPX Vista, Palo Alto, CA, USA). Total N was determined with a Leco FP-428 (Leco‚ Co., St. Joseph, MI, USA) direct combustion nitrogen analyser. Chlorides were extracted from 0.5 g of ground leaves with 25 mL deionised water and measured using ion chromatography with a liquid chromatograph (Thermo Scientific Dionex, Model ICS-3000., Poway, CA, USA).
To determine trunk growth, permanent band dendrometers (model D1, UMS) were installed, and trunk diameter (D) was read at representative moments of the season in twelve trees per irrigation system. Trunk cross-sectional area (TCSA, cm2) and absolute growth rate of the TCSA (AGRtrunk) were calculated according to [16]. At the end of each crop season, the individual pruning weight (kg tree−1) was measured in twelve trees per irrigation system.
Fruit harvesting was carried out in two harvests (first and second harvest) in twelve trees per irrigation system. Normally, in south-eastern Spain, two harvests of ‘Fino’ lemon take place, especially in years in which the production is mainly intended for the obtention of fresh lemon for the national market and, above all, for its exportation to Europe [33,34]. The first harvest was carried out in October, making a distinction between fruits provided to the industry with symptoms of endoxerosis (affected fruits) and commercial fruits with a fruit diameter higher than 58 mm (non-affected fruits). The second harvest was carried out in December, and all of the remaining fruits were harvested. With regard to the economic effects of the use of a third drip line, we only wanted to verify whether an increase in productivity can be verified through two common indicators: technical and economic productivity of water. Below, we present the data and methodology used for this purpose. In both harvests, the individual tree yield (expressed as kg tree−1), the number of fruits per tree and the total fruit weight were measured. Commercialisation was carried out through the San Cayetano Cooperative. This company markets a production corresponding to an area of 2200 hectares, lemon being one of the main products they offer. Fresh fruits of different sizes (1 to 7) and fruits for industry were controlled at the entrance of the cooperative. Fruit prices (Table 2), destination and calliper were those factors applied for the members of the cooperative in that moment. An economic analysis must use average production and price values to obtain representative results; in this sense, it was considered that the product classification and the availability of three-year production data were sufficient to determine values for an average year.
From the production and price data of each harvest, destination, size and year (Equations (2) and (3)), the technical water productivity (TWP) indicator (kg m−3) was calculated as a relationship between gross production (GP) and water supplied through irrigation (IW) (Equation (4)). The economic water productivity (EWP) indicator (EUR m−3) was also calculated as the relationship between gross income (GI) and water applied through irrigation (IW) (Equation (5)). Indicators were calculated each year and, finally, as an average value for the period.
GP year = s 1 s 7 Y F H s i + s 1 s 7 Y S H s i + Y I N
GI year = s 1 s 7 ( Y F H s i × P r F H s i ) + s 1 s 7 ( Y S H s i × P R S H s i ) + Y I N × P r I N
  • YFHsi = Yield in first harvest (sizes 1 to 7);
  • YSHsi = Yield in second harvest (sizes 1 to 7);
  • YIN = Yield to industry;
  • PrFHsi = Lemon price in first harvest per size (sizes 1 to 7);
  • PrSHsi = Lemon price in second harvest per size (sizes 1 to 7);
  • PrIN = Lemon price for industry.
TWP = GP/IW (kg m−3)
EWP = GI/IW (€ m−3)
There are several important bibliographic references that evaluate the productivity of irrigation water through certain indicators. The TWP applied in this work is similar to the so-called water productivity used for other papers and crops, which was analysed both in terms of harvest (kg) and value (EUR) per m3 of water applied [35,36,37].
At harvest, a sample of nine commercial fruits in the controlled trees was collected (twelve samples per irrigation system) to analyse fruit quality. The external peel colour was measured using a tri-stimulus colour difference meter (Minolta CR-300), at three locations around the equatorial plane of the fruit. The Hunterlab parameters L, a* and b* were used, and the external colour index (ECI) was calculated using the equation:
ECI = (a* × 1000)/(L × b*)
where L indicates lightness and a* and b* are the chromaticity coordinates. ECI had a high correlation with the visual appreciation of the fruit colour, and ranged from negative (green) to positive (orange-red). Fruits were cut in the equatorial area, and peel thickness was measured at three points with a digital calliper. Fruits were squeezed, and the juice was filtered to measure TSS (total soluble solids) and TA (titratable acidity). Fruit fractions were separated, weighed, and expressed in the forms of juice, peel, and pulp percentages. The TSS of the juice was measured at 25 °C with a digital refractometer (Atago, Palette PR100), and TA (expressed as the percentage of citric acid in the juice) was determined by titration with 0.1 N NaOH to pH 8.1, using an automatic titrator (CRISON TitroMatic 2S, Crison Instruments S.A., Barcelona, Spain). Maturity index (MI) was expressed as the TSS × 10/TA ratio.

2.3. Statistical Analysis

Data were subjected to one-way analysis of variance (ANOVA) (Statgraphics Centurion XV statistical package; Statpoint Technologies Inc., Warrenton, VA, USA), with two irrigation systems and twelve replicate trees per irrigation system (three monitored trees per irrigation system and plot).

3. Results

3.1. Climate Data, Applied Irrigation Water and Soil Water Content

The annual ETo was similar in 2017 (1264 mm) and 2018 (1246 mm), but slightly lower in 2019 (1192 mm) (Table 1). The annual rainfall showed different patterns during the experimental period, with 2017 being considered a dry season (165 mm) compared to 2018 and 2019, when accumulated precipitation reached 400 mm and 512 mm, respectively (Table 1). During the experimental period, the temporal distribution of rainfall followed a similar pattern, one that was characterised by scarcity during the months of May, June, July and mid-August (approximately between DOYs 121–227) and regular rainfall distributed throughout the rest of the season (Figure 2A–C). However, the year 2019 was defined by a very high rainfall in September (250 mm), between DOYs 254 to 256 (Figure 2C). The water dose applied in each irrigation system was similar during the experimental period (Table 1). The use of a different number of emitters did not alter seasonal patterns of soil water content in the soil profile (0–50 cm) in 2017 and 2018 (Figure 2A,B). However, in 2019, the trend in the soil water content of the irrigation system was slightly different. In this season, θv values in 2L trees were higher than in 3L trees at 0–50 cm of the soil profile, especially during the summer months (Figure 2C). With regard to the seasonal pattern of θv in deeper soil profiles (60–100 cm), 3L trees showed slightly lower values than 2L trees during the 2017 and 2019 seasons, with similar values in 2018 (Figure 2D–F).

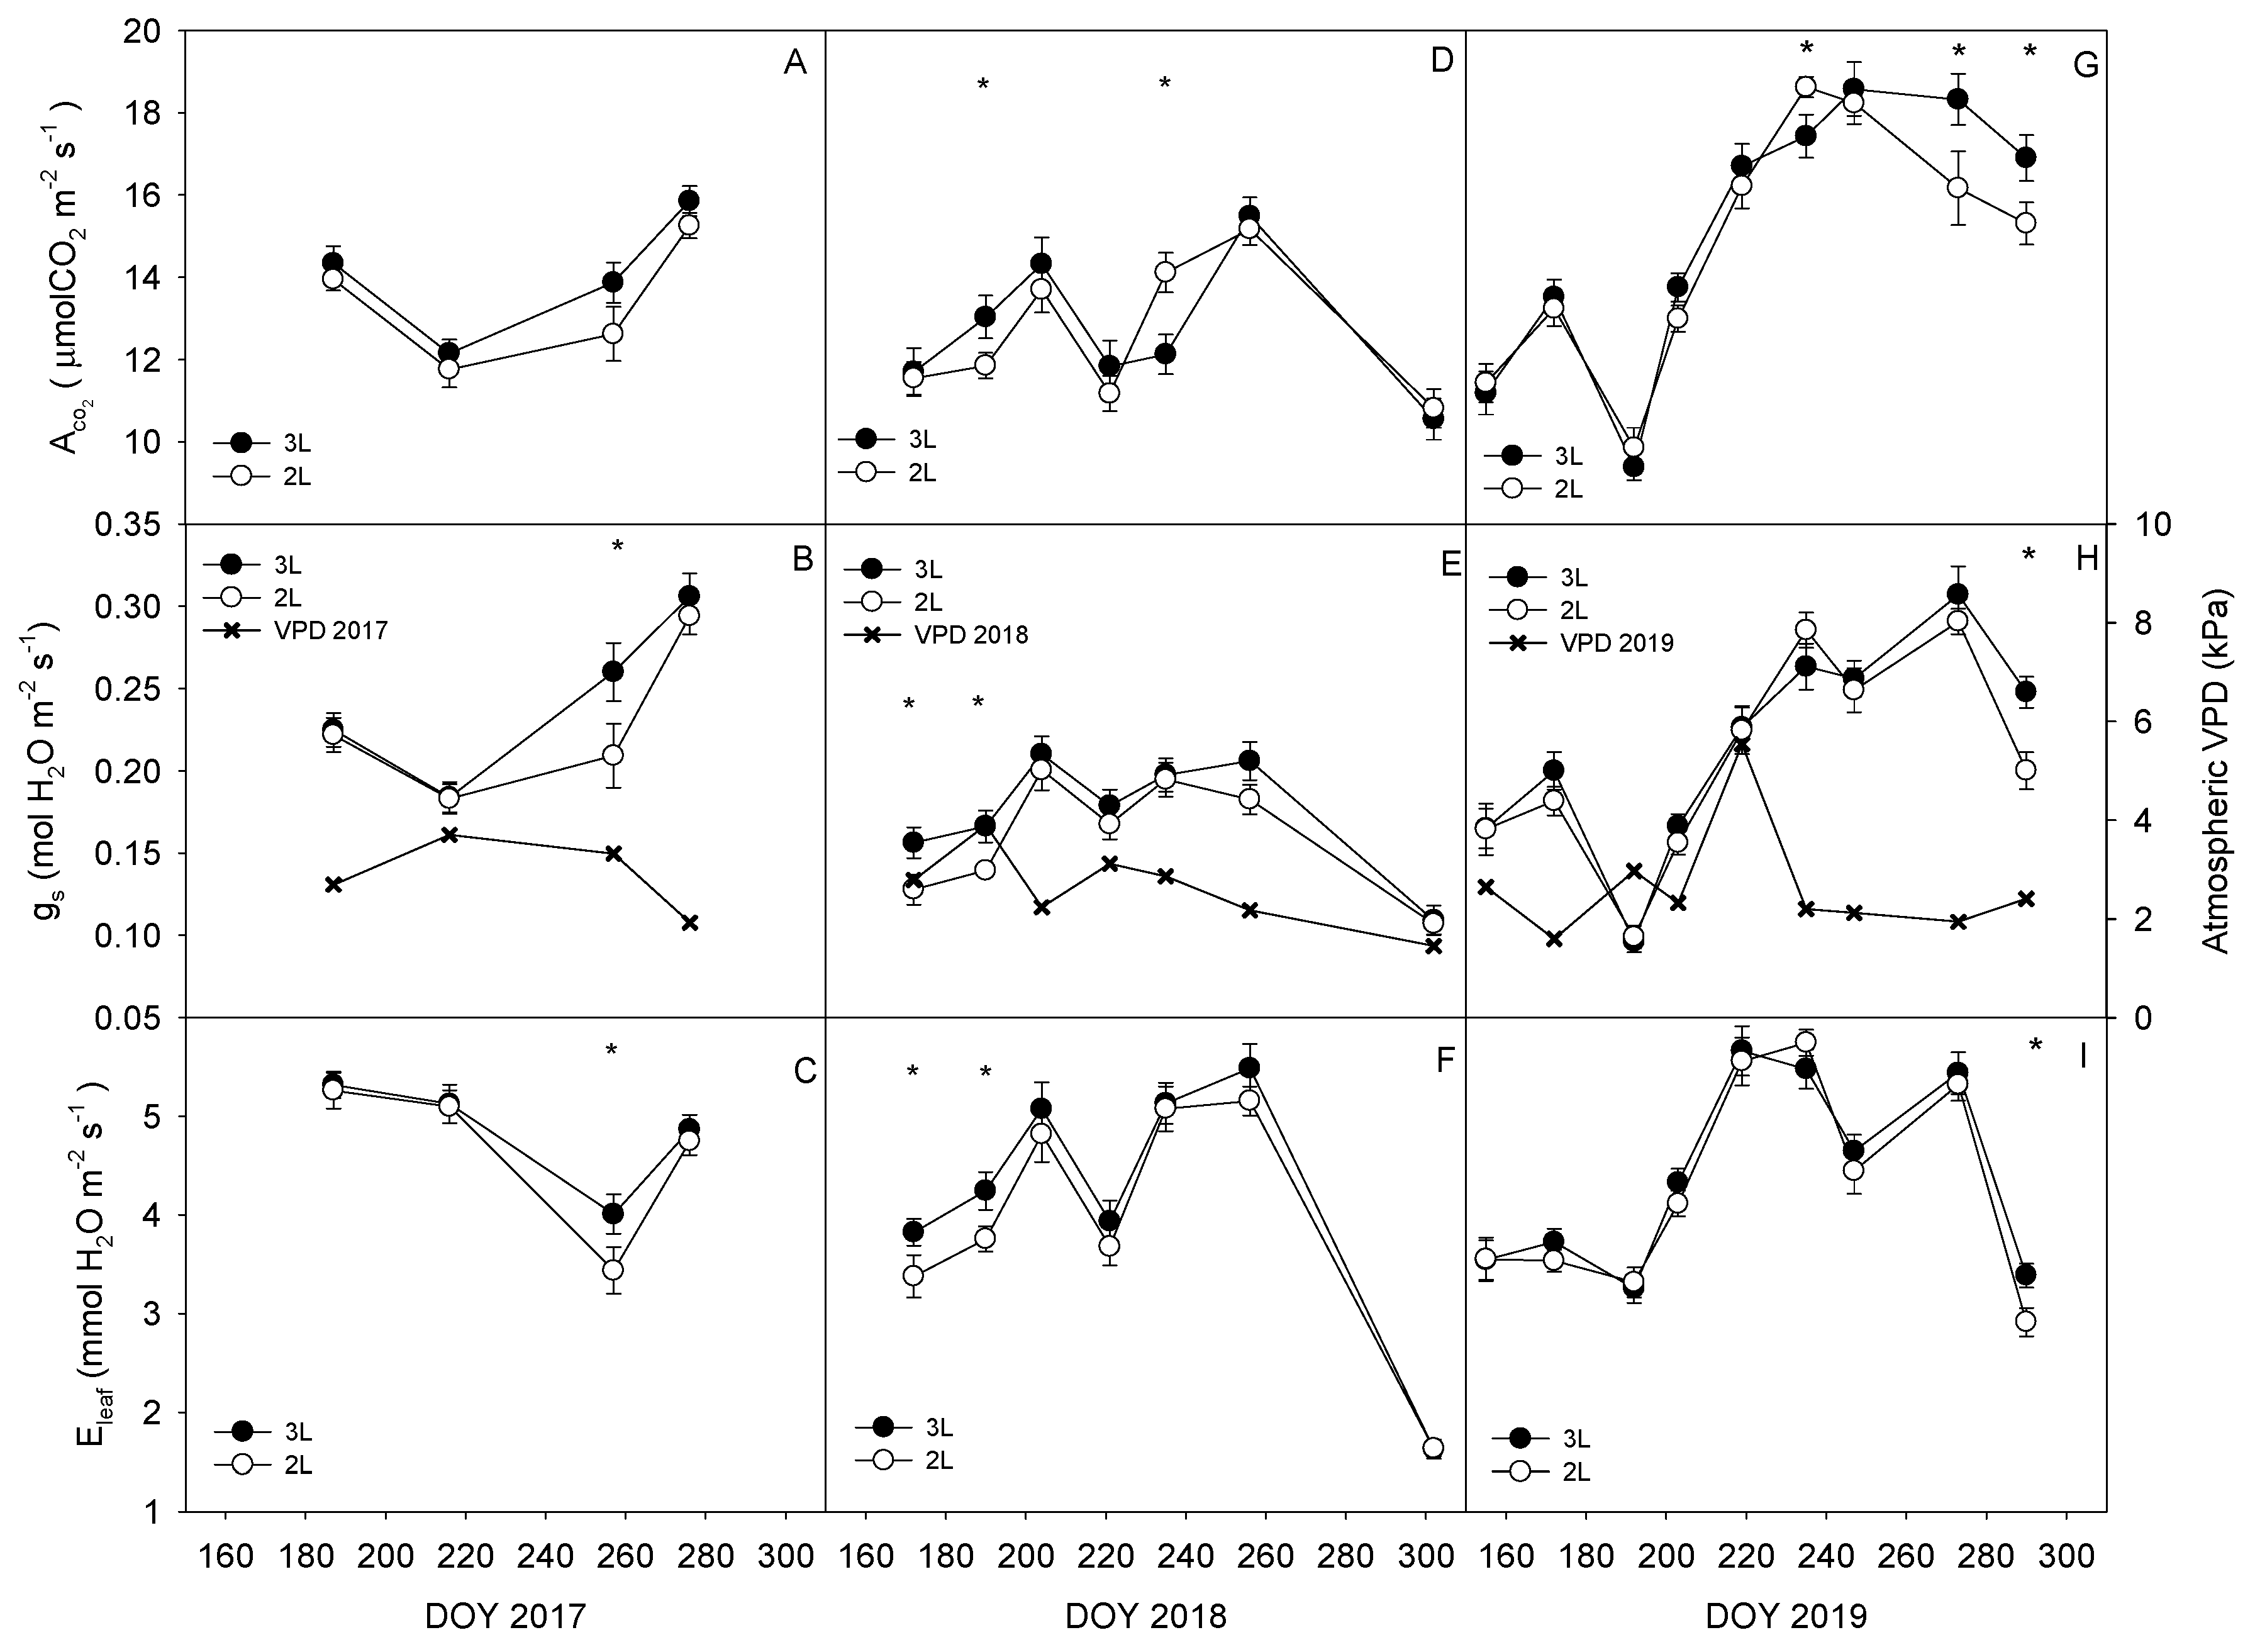
3.2. Plant and Fruit Water Relations and Leaf Gas Exchange

The temporal pattern of midday stem water potential (Ψstem) was similar between irrigation systems in the three seasons of the experiment (Figure 2G–I). During the low-evapotranspiration months, Ψstem was maintained at around −0.80 and −1.0 MPa, but when evaporative demand increased in July and early August (DOYs 182–227, approximately) it decreased, reaching similar values in both irrigation systems, with around −1.4 MPa in all of the studied years (Figure 2G–I). Differences between irrigation systems were partially observed in 2017 and 2018. In DOY 193 of 2017, 3L trees presented Ψstem values higher than 2L trees (Figure 2G). In 2018, at the beginning of the season (DOYs 114 and 128), which corresponded to the low evaporative demand period, 3L trees had significantly lower values of Ψstem than 2L trees (Figure 2H). In contrast, this year, during the high evaporative demand period (DOY 221), Ψstem values in 3L trees were lower than in 2L. In 2019, no significant changes were found in Ψstem between both irrigation systems (Figure 2I).
In 2019, differences in fruit water status between fruits affected and non-affected by endoxerosis were analysed. At DOY 290 (a few days prior to the first harvest), the midday fruit water potential (Ψfruit) was significantly higher in affected fruits (Figure 3). However, no significant changes were found in Ψfruit induced by the irrigation systems.
Generally speaking, leaf gas exchange parameters of trees under 2L and 3L treatments followed a similar pattern, although some differences were found between both irrigation systems (Figure 4). In 2017, significant differences in leaf gas exchange parameters (gs and Eleaf) between irrigation systems were only found in DOY 257 (Figure 4B,C), after the rains that occurred at the end of August (28.8 mm). At that time, trees from both irrigation systems had similar ACO2 values (Figure 4A), but gs was significantly higher in 3L trees (Figure 4B), which produced a decrease of A/gs in 3L trees (12% lower, in comparison to 2L trees) (Figure 5B). In 2018, 3L trees had higher values of ACO2 than 2L trees in early July (DOY 190), but these values were lower in 3L in August (DOY 235) (Figure 4D). In the case of gs, 3L trees had higher values than 2L trees only during the period between late June and early July (DOYs 172–190), remaining similar in both irrigation systems for the rest of the season (Figure 4E). The A/gs was only altered by the irrigation system at DOYs 172 and 235, being significantly higher in 2L trees (Figure 5D). With regard to 2019, differences between irrigation systems in leaf gas exchange parameters were mainly found after the rains of September (250 mm in DOYs 254–256). The ACO2 of 3L trees was lower than that of 2L at DOY 232, but it became significantly higher in 3L trees than in 2L trees from DOY 273 to 290 (prior to the first harvest) (Figure 4G). The gs and A/gs parameters had similar behaviour along the crop season between irrigation systems, and were significantly different only at DOY 290. At that time, gs was higher in 3L trees, and the greater stomatal opening translated into a significant reduction in A/gs with regard to 2L trees (Figure 4H and Figure 5F).

3.3. Leaf Mineral Nutrition

The application of both irrigation systems produced slight alterations in leaf mineral nutrition (Table 3). In 2018, only leaf Mg concentration was altered, being significantly lower in 3L trees (Table S1, Supplementary Material). With regard to 2019, leaf N and Fe concentrations were significantly higher in 3L trees (12% and 15%, respectively), with significantly lower values for leaf P and Mn concentrations (9% and 25%, respectively) in relation to 2L trees.

3.4. Yield

The application of both irrigation systems did not affect the total harvest, the number of total fruits, nor the average fruit weight in any of the seasons of the experiment (Table 4). Only in 2018 was the average weight of the fruit significantly higher (6%) in 3L trees (Table 4).
However, harvesting was carried out on two different dates (first and second harvest), and in this case the results were different. In the first harvest, the yield was separated into commercial fruits non-affected by endoxerosis (green fruits) and those affected by endoxerosis (yellow fruits that were destined for the industry) (Table 4). With regard to non-affected fruits, yield was similar in both irrigation systems in 2017, but a trend of increasing production was observed in 3L trees. In 2018, that trend was confirmed by a significant increase in yield in 3L trees (32% more, in comparison to 2L trees), caused by a greater number of collected fruits (26% higher, in comparison to 2L trees). Nevertheless, fruit weight was similar in both irrigation systems. Similar results were observed in 2019, when yield was significantly increased in 3L trees (29% above, in comparison to 2L trees), mainly due to a significantly greater number of green fruits collected (29% more, in comparison to 2L trees). The general effect that was observed (2017–2019) indicated the presence of a significant increase in production (28% more, in comparison to 2L trees) due to a greater number of harvested fruits (26% more, in comparison to 2L trees) in 3L trees. (Table 4). In relation to the affected fruits, in 2017 the application of the 3L irrigation system significantly reduced the yield of fruits affected by endoxerosis (32% less) with regard to 2L trees, with a significant reduction in the number of affected fruits (34% less, in relation to 2L trees). During 2018 and 2019, no differences were observed between irrigation systems, but the global effect (2017–2019) indicated a significant reduction of 20% in the number of affected fruits in 3L trees in the first harvest (Table 4). Moreover, this percentage was very similar to the number of fruits affected with regard to the total (Table 4). The total yield in the first harvest (affected plus non-affected fruits) was similar between irrigation systems in 2017. However, in 2018 and 2019, yield was significantly higher in 3L trees, with a 20% increase in comparison to 2L trees, mainly due to the greater weight of the fruit in 2018 and a greater number of harvested fruits in 2019 (Table 4). However, considering the general effect (2017–2019), there were no differences between irrigation systems (Table 4). In the second harvest, no significant differences were found in the yield during the experiment. Only in 2018 was the number of harvested fruits significantly lower in 3L trees (Table 4).

3.5. Fruit Quality

Regarding the quality parameters of fruits collected in the first harvest, there were no consistent differences between systems applied throughout the experimental period (Table 5). In 2017, peel thickness and titratable acidity were significantly increased (7% and 3%, respectively) in 3L trees (Table 5). Contrastingly, in 2018, the only alteration was found in fruit diameter, where 3L trees presented significantly higher values (2% more, in comparison to 2L trees) (Table 5). Finally, in 2019, only peel thickness was significantly increased (5% more, in comparison to 2L trees) in 3L trees (Table 5). In the second harvest, fruit quality was not altered by the irrigation systems applied during the different seasons. (Table 5).

3.6. Technical Water Productivity and Economic Water Productivity

The technical water productivity (TWP) did not present significant differences between the irrigation systems studied during the experimental period (Table 6). Economic water productivity (EWP) was similar in the different seasons; however, the average economic water productivity during the experimental period was significantly increased in 3L trees (14%) in comparison to 2L trees. (Table 6).

4. Discussion

Although early harvested ‘Fino 49′ lemon trees are considerably water demanding, especially during the fruit growth stages, the conventional layout of the emitters in lemon orchards is frequently based on the use of two drip lines per tree row with drippers of 4 L h−1, and this can occasionally limit the crop water status, delaying fruit growth by not being able to maintain wetting in an adequate volume of soil. This could be a negative aspect in the cultivation of this group of lemon varieties, which are associated with the search for a certain precocity in the first harvest, where lemon prices are usually higher [38]. In addition, we have to consider other factors such as soil texture, drip line spacing, emitter discharge rate, emitter spacing, irrigation regime and the extent of water application, which could favour a better water soil distribution profile [39], adapting them to the conditions of our farm and cultivation. The 3L irrigation system increased the number of drippers (three more emitters located in the centre of the tree row), but without adding a higher water discharge by tree, since the irrigation time was adjusted to ensure that the amount of water that was applied was similar to that of the conventional irrigation design (2L) (Table 1). This change in the irrigation system modified the soil water distribution, keeping the soil moisture volume within the superficial soil profile (0–50 cm) but reducing water losses by percolation due to a greater number of wetting points in 3L trees (Figure 2A–C). This fact was mainly due to the lower extent of irrigation events, which limited the advance of the wet front to deeper layers of the soil. These results followed the guidelines of [40], who recommend maintaining an adequate soil moisture content in the root zone without any excess to avoid the percolation of water and nutrients. In this sense, in citrus trees grown where soil is not tilled, 75% of the roots are usually located in the upper 15–45 cm [41] and, under this premise, the use of the 3L irrigation system allows the maintenance of adequate moisture content in that depth range. In addition, our results were in line with the recommendations of [42], who indicated that, for an identical volume of water applied, the use of a greater number of emitters can be translated into a reduction in losses due to deep percolation, because it modifies or changes the soil moisture distribution. In other studies, similar results have been obtained for soil with a sandy or stony loam soil texture [43,44], which indicates that better water distribution and/or more homogeneous water absorption by the roots were found for a greater number of drip lines (four drip lines per row), reducing percolation losses, whereas in a soil with a more clayey texture these differences are not found [44]. On the other hand, when comparing one and two drip lines per row of trees, with the irrigation time reduced to 50% to apply the same amount of water, no clear differences were observed in the distribution of water in the soil profile, regardless of its texture [45,46]. In our case, the dripper number was increased from six to nine drippers/tree, so the reduction in the irrigation time in 3L trees was only 33% with regard to irrigation time in 2L trees, which could have favoured a redistribution of water in the soil profile, showing a tendency to maintain similar soil moisture values in the root zone and to reduce losses due to percolation.
Changes in the soil water distribution of 3L trees induced alterations in the plant water status at certain times in the season. During periods of high evaporative demand in phase II of fruit growth (mainly during the period spanning from mid-July to August, approximately DOYs 182–227, VPD > 2.5 kPa), no clear and continuous significant changes were observed in plant (Figure 2G–I) and fruit water statuses. In this sense, the influence of environmental factors, especially on days with high ETo and VPD, limited leaf gas exchange. Under high evaporative demand periods, it is possible that the whole-tree transpiration exceeded the root capacity to uptake water from the soil, causing temporary water deficits and triggering stomatal closure to reduce transpiration, which can occur even in well-irrigated soil [47,48]. Previous research suggests that this limitation to water transport is common in citrus [9,49], and this response was similar in trees from both irrigation designs, which indicates that the environmental component has a greater influence than the effect of irrigation management during high-demand periods. In contrast, during the fruit maturity period (phase III), corresponding to the decrease in the evaporative demand (mainly during the period of time elapsing between mid-September and October, approximately DOYs 258–304, VPD < 2.5 kPa), 3L trees manifested an improved leaf gas exchange with regard to 2L trees, with no changes in plant water status (Figure 2 and Figure 4). This response is typically found in isohydric species, being very common in lemon trees [16], and especially accentuated when a vigorous rootstock such as Citrus macrophylla is used [50]. The increase in the number of points in the wetted soil volume by the addition of a drip line in 3L trees could have promoted an improvement in the development of the root system in that irrigation system, favouring the absorption of water [51] and producing an improvement in certain gas-exchange parameters such as gs and ACO2. In addition, during the fruit maturity process, the higher demand of water and photoassimilates by the fruit forces the tree to be less conservative in terms of water. This implies changes in chemical–hydraulic signalling between the root and the aerial part of the plant that would favour stomatal opening and, consequently, the gain of photoassimilates [52]. In this sense, the higher stomatal opening in 3L trees reduced leaf water use efficiency (Figure 5), inasmuch as it increased transpiration rate. However, it enabled the maintenance of higher photosynthesis rates in 3L trees (Figure 4), and consequently a better provision of water and photoassimilates to the fruit.
The visual symptoms of fruits affected by endoxerosis (premature and unnatural change in the colour of the fruit from green to yellow) began to be observable in the maturity period. In our study, affected fruits presented a different fruit water status than unaffected fruits (Figure 3), which suggests that a higher dehydration state exists in the former. In this sense, [21] indicated that under conditions of high ambient temperature and evapotranspiration, fruit can lose water in favour of the leaves, this effect being one of the causes of this disorder. However, in our study, during high-demand periods it was not possible to measure fruit water status, because no external symptoms of endoxerosis were observed in the fruit at that point; the establishment of a gradient (ΔΨ) between Ψfruit and Ψleaf should determine the direction of water interchange between both plant organs [53]. Inside the affected fruit, the result was a cellular collapse that caused the transformation of some substances, such as pentoses and pentosan, into gums [21]. This accumulation of sugars in the fruit could produce a decoupling with the plant water status [54] whose long-term effect would be the fall of the fruit to the ground. The 3L irrigation system reduced the percentage of fruits affected by endoxerosis with regard to total harvested fruit (Table 4). In addition, this alteration of the fruit was exacerbated in those seasons with hot and dry summers that last until September (Figure 2). However, according to the recommendations of [55], a better distribution of soil moisture, such as that achieved with the 3L irrigation system, could have allowed for an adequate moisture content in the soil, as well as a good root system that would alleviate this physiological alteration.
From a nutritional point of view, changes in the soil water distribution also translated into a different soil fertiliser distribution, but the effects of these alterations on fertiliser application were only reflected in the tree nutritional status in the third year (Table 3 and Table S1, Supplementary Material). The reason for this could be that the trees needed a period of adaptation to the new irrigation system. In our case, a potentially higher density of roots in the superficial soil could favour an increase in the efficiency of the absorption of nutrients, because their concentrations were higher in that area, as suggested by [56]. The higher leaf N and Fe concentrations found in 3L trees suggest that a more horizontal fertiliser distribution, as well as lower irrigation lengths of the events, can reduce possible losses of nitrates due to percolation, enhancing the efficiency of N and Fe application in lemon trees. Therefore, this could contribute to a longer presence of the fertiliser in the soil area for effective root uptake, especially during the season when N application is greater (mainly during phase II of fruit growth) [57], contributing to more sustainable fertilisation. In fact, [58] indicated that the uniformity of fertiliser application depends on that of the irrigation system application, in our case being better in the 3L irrigation system. Regarding the incidence of endoxerosis, a higher foliar concentration of N and Fe in 3L trees could help to reduce this physiological alteration, because N is the most important nutrient for citrus cultivation [59] and is essential to enhance the biological processes of the plant (i.e., normal cell division, growth, and respiration), whereas Fe catalyses the production of chlorophyll and is involved in some respiratory and photosynthetic enzyme systems [58]. In this sense, a better physiological response of the crop under the 3L irrigation system thanks to a better distributed fertilisation could contribute to a reduction in the percentage of fruits affected by endoxerosis (Table 4).
Differences found in the plant and nutrient status of the crop between irrigation systems did not alter vegetative growth. The only thing worth highlighting is the lower vegetative growth observed in both irrigation systems in 2017 and 2018 (Table S2, Supplementary Material), coinciding with the seasons with the highest production (Table 4). This effect could be related to conditions of high fruit load, with no positive vegetative growth response due to a greater dominance of the fruit over the vegetative organs [60]. In other study carried out in adult lemon trees under the same edaphoclimatic conditions, [18] also reported a non-significant effect in the canopy volume due to the installation of a second drip line when compared with a single drip line. In olive trees, [61] indicated that starting from trees with a similar canopy volume which were pruned in the same way, no differences were observed in vegetative growth due to an increase in wet soil volume by increasing the number of drippers per tree. In another study, [62] evaluated different agronomic designs (using a different number of drippers per tree, but conserving the same irrigation time and varying the irrigation frequency of each design) in apple trees, observing similar growth dynamics in the shoots. The lack of differences in the parameters of growth between irrigation systems can be attributed in part to the similarity of the hydric pattern that was finally developed in the different agronomic designs, as a consequence of the identical volume of water applied.
Changes produced in the distribution of soil moisture did not enhance the total production of lemon trees in 3L. A similar response has been observed in citrus such as mandarin [57] and lemon [18], where the harvesting of the crop was carried out in a single harvest, as well as in other crops, such as olive and apple, when full irrigation with 100% of the crop’s needs were applied [61,62] with different numbers of drippers per tree, but the same irrigation dose in surface drip irrigation. Nevertheless, in hazelnut trees irrigated with different percentages of wet soil volume, trees yielded more as the percentages of wet soil volume were increased [63]. On the other hand, in our experiment, harvesting was carried out on two different dates, a pattern that is typical in early lemon trees [38]. In the first harvest, only the fruits that reached the appropriate size (non-affected, green lemon) were collected. Separately, we had fruits with symptoms of endoxerosis (affected, yellow lemon) (Table 4). In 2018 and 2019, the production of non-affected fruits increased in the 3L irrigation system, showing a global effect (2017–2019) of around 28%, mainly due to a greater number of collected fruits (26% more) in comparison to 2L. These fruits had the greatest commercial and economic value. The arrangement of an additional drip line in 3L trees could have favoured root development, which would have granted a greater water uptake capacity to the plant after irrigation events or after a rainfall episode, especially during the periods of a higher root growth, which in the Northern Hemisphere occur from May to June, and particularly from August to September [64]. This could have favoured fruit growth in a positive way, enhancing the yield of 3L trees at the first harvest, as well as resulting in a reduction trend in the number of fruits affected by endoxerosis (Table 4).
Regarding the commercial quality of the fruits, no major significant alterations occurred in either of the harvests. It is worthy of note that, in the first harvest (only in non-affected, green fruits), when symptoms of fruits affected by endoxerosis were more evident, the peel thickness in fruits from 3L trees was increased (Table 5). This could be a negative quality factor; however, the percentage of juice was not altered by the greater peel thickness (Table 5). This effect could be explained by a higher efficiency in the absorption of water and nutrients, especially nitrogen [65], due to a better distribution in the 3L irrigation system. In the second harvest, and with the fruits degreening naturally on the tree as a result of the drop in temperatures, there were no alterations due to the application of different designs of irrigation systems (Table 5). These results are in line with those obtained in lemon by [18], who found no consistent alterations in the quality of the fruit during the experimental period.
The best agronomic response with the 3L irrigation system was positively reflected in the economic indicators. In adult trees, after harvesting, pruning takes second place amongst the most expensive tasks of citrus production in Spain [66], but in our case, an increase in the wetted surface due to the use of a 3L irrigation system did not imply higher pruning costs, because similar accumulated fresh pruning weights were obtained (Table S2, Supplementary Material). Differential costs were very similar between irrigation systems, mainly due to the fixed costs (depreciation of the irrigation head and irrigation network), which, being assets with a relatively long, useful life, have very close values in both irrigation systems. TWP was not improved in 3L trees, mainly because the total yield and applied water were similar in both irrigation systems (Table 6). TWP was only 5% higher in 3L than in 2L, but no significant differences were found between irrigation systems. On the other hand, with regard to EWP, 3L trees showed a significant increase of 14% in comparison to 2L trees (Table 6) due to the increase in yield over the first harvest and, therefore, over the average price of the product. EWP was higher in 3L trees due to two reasons: a higher proportion of the first harvest, and fewer fruits for the industry. However, of these two effects, the one with the larger economical relevance is the higher proportion of lemon in the first harvest, because the average price over the three years of the first harvest was 40.93% higher than that of the second harvest (0.43 and 0.31 EUR kg−1, respectively) (Table 2). Be that as it may, water productivity values resulting from these irrigation systems were high in relation to other citrus fruits both from south-eastern Spain [34,67] and other areas [35,68].

5. Conclusions

The use of an irrigation design with three lines of emitters (3L) creates a number of advantages from a physiological and an agronomic point of view when compared to the traditional irrigation design based on two lines of emitters (2L) in early lemon trees. In this sense, the 3L irrigation system could promote a better distribution of water in the soil profile, locating it in the area with the highest concentration of roots. This has allowed for an improvement of certain gas-exchange parameters, such as stomatal conductance, mainly when the evaporative demand was not very high in the 3L irrigation system. The improvement in the physiological response was reflected in two important agronomic aspects of the crop. On the one hand, the total number of fruits affected by the physiological disorder known as endoxerosis was reduced. On the other hand, the precocity of the harvest was increased, with a greater number of fruits harvested in the first harvest. From an economic point of view, the installation of a third drip line allows the economic water productivity to be increased, since fruits of the first harvest have a greater economic value, which could be quite interesting for the early lemon growers.

Supplementary Materials

The following supporting information can be downloaded at: https://0-www-mdpi-com.brum.beds.ac.uk/article/10.3390/agronomy13061519/s1, Table S1: Leaf nutrient concentrations of ‘Fino’ lemon for each irrigation system (two lines [2L] and three lines [3L]) during the experimental period (2017 and 2018); Table S2: Absolute growth rate of the trunk cross-sectional area (AGRTrunk, cm2 year−1) and fresh pruning weigh (kg tree−1) for each irrigation system (two lines [2L] and three lines [3L]) during the experimental period (2017 to 2019).

Author Contributions

Conceptualisation, J.G.P.-P. and J.M.R.; methodology, J.M.R., J.G.P.-P. and J.G.-G.; formal analysis, J.M.R. and J.G.P.-P.; investigation, J.M.R.; data curation, J.M.R.; writing—original draft preparation, J.M.R. and J.G.P.-P.; writing—review and editing, J.M.R., J.G.P.-P., J.G.-G., J.M.N. and P.B.; supervision, J.G.P.-P.; funding acquisition, J.M.R. All authors have read and agreed to the published version of the manuscript.

Funding

This research was funded by the FEDER 1420-13 and FEDER 1420-24 project (operating program of the Region of Murcia 2014-2020), co-financed at 80% by the European Regional Development Fund, and by the Subprogram for Hiring and Incorporation of Doctors INIA-CCAA (DR13-0170), as well as by the State Subprogram for Ramón y Cajal Incorporation (RYC-2015-17726), within the framework of the State Plan for Scientific and Technical Research and Innovation of the Ministry of Economy and Competitiveness.

Data Availability Statement

Not applicable.

Acknowledgments

The authors want to thank J.A. Palazón, F.M. Hernández, E.I. Morote and E.M. Arques for their help in both field and laboratory tasks, San Cayetano cooperative for the management and sizing of the fruit and Campo de Cartagena irrigation community for the availability of the experimental orchard.

Conflicts of Interest

The authors declare no conflict of interest. The funders had no role in the design of the study; in the collection, analyses or interpretation of data; in the writing of the manuscript; or in the decision to publish the results.

References

  1. FAOSTAT. Available online: https://www.fao.org/faostat/es/#home. (accessed on 23 March 2022).
  2. MAPA. Anuario de Estadística Agraria 2019. Ministerio de Agricultura, Pesca y Alimentación. Available online: https://www.mapa.gob.es/es/ (accessed on 23 March 2022).
  3. AILIMPO. Asociación Interprofesional de Limón y Pomelo. Available online: https://www.ailimpo.com/categoria_memorias/memorias/ (accessed on 23 March 2022).
  4. IPCC. Climate Change: Synthesis Report. Contribution of Working Groups I, II and III to the Fifth Assessment Report of the Intergovernmental Panel on Climate Change; Pachauri, R.K., Meyer, L.A., Eds.; IPCC: Geneva, Switzerland, 2014; p. 151. [Google Scholar]
  5. CEDEX. Evaluation of the Climate Change Impact on Water Resources and Droughts in Spain; Technical Report 42-415-0-001; Centre for Studies and Experimentation in Public Works: Madrid, Spain, 2017; p. 320. [Google Scholar]
  6. García-Tejero, I.F.; Durán-Zuazo, V.H.; Muriel-Fernández, J.L. Towards sustainable irrigated Mediterranean agriculture: Implications for water conservation in semi-arid environments. Water Int. 2014, 39, 635–648. [Google Scholar] [CrossRef]
  7. Syvertsen, J.P.; Lloyd, J.J. Citrus. In Handbook of Environmental Physiology of Fruit Crops; Volume II: Subtropical and Tropical Crops; Schaffer, B., Andersen, P.C., Eds.; CRC Press: Boca Raton, FL, USA, 1994; pp. 65–99. [Google Scholar]
  8. Gliński, J.; Horabik, J.; Lipiec, J. Encyclopedia of Agrophysics. Encyclopedia of Earth Sciences Series; Springer: Dordrecht, The Netherlands, 2011. [Google Scholar] [CrossRef]
  9. Pérez-Pérez, J.G.; Dodd, I.C.; Botía, P. Partial rootzone drying increases water-use efficiency of lemon ‘Fino 49’ trees independently of root-to-shoot ABA signalling. Funct. Plant Biol. 2012, 39, 366–378. [Google Scholar] [CrossRef]
  10. Espadafor, M.; Orgaz, F.; Testi, L.; Lorite, I.J.; García-Tejera, O.; Villalobos, F.J.; Fereres, E. Almond tree response to a change in wetted soil volume under drip irrigation. Agric. Water Manag. 2018, 202, 57–65. [Google Scholar] [CrossRef]
  11. Fereres, E.; Soriano, M.A. Deficit irrigation for reducing agricultural water use. J. Exp. Bot. 2006, 58, 147–159. [Google Scholar] [CrossRef]
  12. Agustí, M. Citricultura, 2nd ed.; Mundi-Prensa: Madrid, España, 2003; p. 422. [Google Scholar]
  13. Pereira, L.S.; De Juan, J.A.; Picornell, M.R.; Tarjuelo, J.M. El Riego y Sus Tecnologías; Centro Regional de Estudios del Agua, Universidad de Castilla La Mancha: Ciudad Real, Spain, 2010; p. 296. Available online: https://www.researchgate.net/publication/272171215_El_riego_y_sus_tecnologias (accessed on 23 March 2022).
  14. Soler-Fayos, G.; Soler-Aznar, J. Cítricos. Variedades y Técnicas de Cultivo, 1st ed.; Mundi-Prensa: Madrid, Spain, 2006; p. 242. [Google Scholar]
  15. Moya Talens, J.A. Manual Básico de Cultivo Localizado. Riego y Fertirrigación, 1st ed.; Mundi-Prensa: Madrid, Spain, 2017; p. 638. [Google Scholar]
  16. Robles, J.M.; Botía, P.; Pérez-Pérez, J.G. Subsurface drip irrigation affects trunk diameter fluctuations in lemon trees, in comparison with surface drip irrigation. Agric. Water Manag. 2016, 165, 11–21. [Google Scholar] [CrossRef]
  17. Robles, J.M.; Botía, P.; Pérez-Pérez, J.G. Sour orange rootstock increases water productivity in deficit irrigated ‘Verna’ lemon trees compared with Citrus macrophylla. Agric. Water Manag. 2017, 186, 98–107. [Google Scholar] [CrossRef]
  18. Parra, M.; Hortelano, D.; García-Sánchez, F.; Intrigliolo, D.S.; Rubio-Asensio, J.S. Effects of Drip Irrigation Design on a Lemon and a Young Persimmon Orchard in Semi-Arid Conditions. Water 2021, 13, 1795. [Google Scholar] [CrossRef]
  19. Sinclair, W.B. The Biochemistry and Physiology of the Lemon and Other Citrus Fruits; University of California. Division of Agriculture and Natural Resources: Riverside, CA, USA, 1984; p. 946. [Google Scholar]
  20. Van Dael, M.; Lebotsa, S.; Herremans, E.; Verboven, P.; Sijbers, J.; Opara, U.L.; Cronje, P.J.; Nicolaï, B.M. A segmentation and classification algorithm for online detection of internal disorders in citrus using X-ray radiographs. Postharvest Biol. Technol. 2015, 112, 205–214. [Google Scholar] [CrossRef]
  21. Agustí, M. Alteraciones Fisiológicas de Los Frutos Cítricos, 1st ed.; Centro de publicaciones del Ministerio de Agricultura, Pesca y Alimentación: Ciudad Real, Spain, 2004; p. 126. [Google Scholar]
  22. Doorenbos, J.; Pruitt, W.O. Crop Water Requirements. FAO Irrigation and Drainage Paper Number 24; FAO: Rome, Italy, 1977; p. 194. [Google Scholar]
  23. Allen, R.G.; Pereira, L.S.; Raes, D.; Smith, M. Crop Evapotranspiration. In Guidelines for Computing Crop Water Requirements; Irrigation and Drainage Paper 56; FAO: Rome, Italy, 1998. [Google Scholar]
  24. Fereres, E.; Pruitt, W.O.; Beutel, J.A.; Henderson, D.W.; Holzapfel, E.; Schulbach, H.; Uriu, K. Evapotranspiration and drip irrigation scheduling. In Drip Irrigation Management; University of California, Division of Agricultural Science: Davis, CA, USA, 1981; pp. 8–13. [Google Scholar]
  25. Brouwer, C.; Heibloem, M. Irrigation Water Management: Irrigation Water Needs—Training Manual No. 3; FAO: Rome, Italy, 1986. [Google Scholar]
  26. Boletín Oficial de la Región de Murcia (BORM) núm 106, 2002, Orden del 24 de abril de 2002. In Por la Que se Regulan las Normas Técnicas de Producción Integrada en el Cultivo de Cítricos; Suplemento núm 1 del BORM 9 de mayo de 2002; Consejería de Agricultura, Agua y Medio Ambiente: Murcia, Spain, 2002; pp. 188–207.
  27. McCutchan, H.; Shackel, K.A. Stem-water potential as a sensitive indicator of water stress in prune trees (Prunus domestica L. cv French). J. Am. Soc. Hortic. Sci. 1992, 117, 607–611. [Google Scholar] [CrossRef]
  28. Turner, N.C. Measurements of plant water status by pressure chamber technique. Irrig. Sci. 1988, 9, 289–308. [Google Scholar] [CrossRef]
  29. Von Caemmerer, S.; Farquhar, G.D. Some relationships between the biochemistry of photosynthesis and the gas exchange of leaves. Planta 1981, 153, 376–387. [Google Scholar] [CrossRef]
  30. Sinclair, T.R.; Allen, L.H. Carbon dioxide and water vapour exchange of leaves on field-grown citrus trees. J. Exp. Bot. 1982, 33, 1166–1175. [Google Scholar] [CrossRef]
  31. Syvertsen, J.P. Light acclimation in citrus leaves. II. CO2 assimilation and light, water and nitrogen use efficiency. J. Am. Soc. Hortic. Sci. 1984, 109, 812–817. [Google Scholar] [CrossRef]
  32. Ribeiro, R.; Machado, C. Some aspects of citrus ecophysiology in subtropical climates: Re-visiting photosynthesis under natural conditions. Braz. J. Plant Physiol. 2007, 19, 393–411. [Google Scholar] [CrossRef]
  33. CIRAD (Observatorio de Mercados). FruiTrop Magazine Focus Especial Limón; Cirad: Montpellier, Italy, 2013; p. 140. [Google Scholar]
  34. García García, J. Análisis del Sector del Limonero y Evaluación Económica de su Cultivo; Consejería de Agricultura y Agua: Murcia, Spain, 2014; p. 142. [Google Scholar]
  35. Tejero, I.G.; Zuazo, V.H.; Bocanegra, J.A.; Fernández, J.L. Improved water-use efficiency by deficit-irrigation programmes: Implications for saving water in citrus orchards. Sci. Hortic. 2011, 128, 274–282. [Google Scholar] [CrossRef]
  36. García García, J.; Contreras, F.; Usai, D.; Visani, C. Economic Assesment and Socio Economic Evaluation of Water Use Efficiency in Artichoke Cultivation. Open J. Account. 2013, 2, 45–52. [Google Scholar] [CrossRef]
  37. Fernández, J.E.; Alcón, F.; Diaz-Espejo, A.; Hernández-Santana, V.; Cuevas, M.V. Water use indicators and economic analysis for on-farm irrigation decision: A case study of a super high density olive tree orchard. Agric. Water Manag. 2020, 237, 106074. [Google Scholar] [CrossRef]
  38. Brotons, J.M.; Manera, F.J.; Conesa, A.; Porras, I. Study on maximising profits obtained by lemon-producers based on fruit harvesting time. ITEA-Infor. Téc. Econ. Agrar. 2015, 111, 384–401. [Google Scholar] [CrossRef]
  39. Bajpai, A. and Kaushal A. Soil moisture distribution under trickle irrigation: A review. Water Supply 2020, 20, 761–772. [Google Scholar] [CrossRef]
  40. Skagss, T.H.; Trout, T.J.; Rothfuss, Y. Drip irrigation water distribution patterns: Effects of emitter rate, pulsing and antecedent water. Soil Sci. Soc. Am. J. 2010, 74, 1886–1896. [Google Scholar] [CrossRef]
  41. Castle, W.S. Citrus root systems: Their structure, function, growth and relationship to tree performance. Proc. Int. Soc. Citric. 1987, 1, 315–324. [Google Scholar]
  42. Monge, M.A. Diseño Agronómico e Hidráulico de Riegos Agrícolas a Presión; Ministerio de Agricultura y Pesca, Alimentación y Medio Ambiente, España: Madrid, Spain, 2018; p. 633. [Google Scholar]
  43. Holzapfel, E.; Jara, J.; Coronata, A.M. Number of drip laterals and irrigation frequency on yield and exportable fruit size of highbush blueberry grown in a sandy soil. Agric. Water Manag. 2015, 148, 207–212. [Google Scholar] [CrossRef]
  44. Lecaros-Arellano, F.; Holzapfel, E.; Fereres, E.; Rivera, D.; Muñoz, N.; Jara, J. Effects of the number of drip laterals on yield and quality of apples grown in two soil types. Agric. Water Manag. 2021, 248, 106781. [Google Scholar] [CrossRef]
  45. Fernandes, R.D.M.; Egea, G.; Hernández-Santana, V.; Díaz-Espejo, A.; Fernández, J.E.; Pérez-Martín, A.; Cuevas, M.V. Response of vegetative and fruit growth to the soil volume wetted by irrigation in a super-high-density olive orchard. Agric. Water Manag. 2021, 258, 107197. [Google Scholar] [CrossRef]
  46. Conesa, M.R.; Conejero, W.; Vera, J.; Agulló, V.; García-Viguera, C.; Ruiz-Sánchez, M.C. Irrigation management practices in nectarine fruit quality at harvest and after cold storage. Agric. Water Manag. 2021, 243, 106519. [Google Scholar] [CrossRef]
  47. Syvertsen, J.P. Integration of water stress in fruit trees. Hortscience 1985, 20, 1039–1043. [Google Scholar] [CrossRef]
  48. Cohen, S.; Moreshet, S.; Le Guillou, L.; Simon, J.C.; Cohen, M. Response of citrus trees to modified radiation regime in semi-arid conditions. J. Exp. Bot. 1997, 48, 35–44. [Google Scholar] [CrossRef]
  49. Allen, L.H.; Vu, J.C.V. 2009. Carbon dioxide and high temperature effects on growth of young orange trees in a humid, subtropical environment. Agric. For. Meteorol. 2009, 149, 820–830. [Google Scholar] [CrossRef]
  50. Romero-Trigueros, C.; Gambín, J.M.B.; Nortes Tortosa, P.A.; Cabañero, J.J.A.; Nicolás Nicolás, E. Isohydricity of Two Different Citrus Species under Deficit Irrigation and Reclaimed Water Conditions. Plants. 2021, 10, 2121. [Google Scholar] [CrossRef]
  51. Martínez-Gimeno, M.A.; Bonet, L.; Provenzano, G.; Badal, E.; Intrigliolo, D.S.; Ballester, C. Assessment of yield and water productivity of clementine trees under surface and subsurface drip irrigation. Agric. Water Manag. 2018, 206, 209–216. [Google Scholar] [CrossRef]
  52. Flexas, J.; Medrano, H. Drought-inhibition of photosynthesis in C3 plants: Stomatal and non-stomatal limitations revisited. Ann. Bot. 2002, 89, 183–189. [Google Scholar] [CrossRef] [PubMed]
  53. Rodríguez, P.; Galindo Egea, A.; Collado-González, J.; Medina, S.; Corell, M.; Memmi, H.; Girón, I.F.; Centeno, A.; Martín-Palomo, M.J.; Cruz, Z.N.; et al. Fruit Response to Water-scarcity Scenarios: Water Relations and Biochemical Changes. In Water Scarcity and Sustainable Agriculture in Semiarid Environment: Tools, Strategies, and Challenges for Woody Crops, 1st ed.; Garcia Tejero, I.F., Duran Zuazo, V.H., Eds.; Elsevier: Amsterdam, The Netherlands, 2018; pp. 349–375. [Google Scholar] [CrossRef]
  54. Matthews, M.A.; Shackel, K.A. Growth and water transport in fleshy fruit. In Vascular Transport in Plants; Holbrook, N.M., Zwieniecki, M.A., Eds.; Elsevier: Boston, MA, USA, 2005; pp. 189–197. [Google Scholar] [CrossRef]
  55. Bartholomew, E. Endoxerosis or Internal Decline of Lemon Fruits. Calif. Agri. Exp. Stn. Bull. 1937, 605, 1–42. [Google Scholar]
  56. Cabeza, R.A.; Claassen, N. Crop root system: Extension, distribution and growth. Agro. Sur. 2017, 45, 31–45. [Google Scholar] [CrossRef]
  57. Martínez Alcántara, B. Estudio de la Absorción y Translocación del Nitrógeno en Cítricos en Función del Aporte Estacional del Abono Nitrogenado, Mediante la Técnica de Dilución Isotópica. Ph.D. Thesis, Universidad Politécnica de Valencia, Valencia, Spain, 2010; p. 276. [Google Scholar]
  58. Abbas, F.; Fares, A. Best Management Practices in Citrus Cultivation. Tree For. Sci. and Biotech. 2009, 3, 1–11. [Google Scholar]
  59. Embleton, T.W.; Jones, W.W. Nitrogen fertilizer management programs, nitrate pollution potential and orange productivity. In Nitrogen in Environment; Nielsen, D.R., MacDonald, T.G., Eds.; Academy Press: Cambridge, MA, USA, 1978; pp. 275–297. [Google Scholar]
  60. Grossman, Y.L.; Dejong, T.M. Peach: A simulation model of reproductive and vegetative growth in peach trees. Tree Physiol. 1994, 14, 329–345. [Google Scholar] [CrossRef] [PubMed]
  61. Gispert, J.R.; Ramírez de Cartagena, F.; Villar, J.M.; Girona, J. Wet soil volume and strategy effects on drip-irrigated olive trees (cv. ‘Arbequina’). Irrig. Sci. 2013, 31, 479–489. [Google Scholar] [CrossRef]
  62. Gispert, J.R.; Ramírez de Cartagena, F.; Villar, J.M.; Rufat, J.; Batlle, I. Effect of the number of drippers and irrigation frequency on production, fruit quality and water productivity in a high-density apple orchard. ITEA-Infor. Téc. Econ. Agrar. 2017, 113, 20–35. [Google Scholar] [CrossRef]
  63. Gispert, J.R.; Ramírez de Cartagena, F.; Villar, J.M.; Rovira, M. Effect of wet soil volume in microirrigation for hazelnut production (Corylus avellana L.). ITEA-Infor. Téc. Econ. Agrar. 2015, 111, 109–126. [Google Scholar] [CrossRef]
  64. Bevington, K.B.; Castle, W.S. Annual root growth pattern of young citrus trees in relation to shoot growth, soil temperature and soil water content. J. Am. Soc. Hortic. Sci. 1985, 110, 840–845. [Google Scholar] [CrossRef]
  65. Legaz, F.; Bañuls, J.; Primo-Millo, E. Influencia del abonado en la calidad del fruto. Levante Agrícola 2000, 350, 12–17. [Google Scholar]
  66. Martín-Gorriz, B.; Martínez-Barba, C.; Torregrosa, A. Lemon trees response to different long-term mechanical and manual pruning practices. Sci. Hortic. 2021, 275, 109700. [Google Scholar] [CrossRef]
  67. Colino, J.; Martínez-Paz, J.M. El agua en la agricultura del sureste español. In La Agricultura Mediterránea en el Siglo XXI; Instituto Cajamar: Almeria, Spain, 2002; pp. 199–221. [Google Scholar]
  68. Panigrahi, P.; Sharma, R.K.; Parihar, S.S.; Hasan, M.; Rana, D.S. Economic analysis of drip-irrigated kinnow mandarin orchard under deficit irrigation and partial root zone drying. Irrig. Drain. 2013, 62, 67–73. [Google Scholar] [CrossRef]
Figure 1. Layout drawings of the irrigation system for each treatment. (A,C) (Cross section of the applied treatments). (B,D) (Plan view of the applied treatments).
Agronomy 13 01519 g001
Figure 2. Seasonal evolution of rain and volumetric soil water content (θv) in the soil profile (0–50 cm) (AC), volumetric soil water content (θv) in the soil profile (60–100 cm) (DF), and midday stem water potential (Ψstem) with values of the air vapour pressure deficit VPD (GI) for each irrigation system (two lines [2L] and three lines [3L]) during the experimental period (2017 to 2019). Each point is the average of 8 measurements in θv and 12 measurements in Ψstem. Vertical bars indicate ± SE. * indicates p < 0.05.
Agronomy 13 01519 g002
Figure 3. Midday fruit water potential (Ψfruit) for each irrigation system (two lines [2L] and three lines [3L]) and endoxerosis fruit symptoms (non-affected and affected) prior to the first harvest in 2019 (DOY 290). Each bar is the average of 12 measurements. Vertical error bars indicate the standard error of the mean. ‘ns’, not significant; *** indicates p < 0.001.
Agronomy 13 01519 g003
Figure 4. Seasonal evolution of leaf CO2 assimilation rate (ACO2, µmol CO2 m−2s−1), stomatal conductance (gs, mol H2O m−2s−1) with values of the atmospheric VPD and transpiration rate (Eleaf, mmol H2O m−2s−1) for each irrigation system (two lines [2L] and three lines [3L]) during the 2017 (AC), 2018 (DF) and 2019 (GI) seasons. Each point is the average of 12 measurements. Vertical bars indicate ± SE. * indicates p < 0.05.
Agronomy 13 01519 g004
Figure 5. Seasonal evolution of instantaneous leaf water use efficiency (ACO2/Eleaf, µmol CO2 mmol−1 H2O) and intrinsic leaf water use efficiency (ACO2/gs, µmol CO2 mol−1 H2O) for each irrigation system (two lines [2L] and three lines [3L]) during the 2017 (A,B), 2018 (C,D) and 2019 (E,F) seasons. Each point is the average of 12 measurements. Vertical bars indicate ± SE. * indicates p < 0.05.
Agronomy 13 01519 g005
Table 1. Reference values of evapotranspiration (ETo), rainfall (P) and water applied for each irrigation system (two lines [2L] and three lines [3L]) during the experimental period (2017 to 2019).
SeasonETo (mm)P (mm)Irrigation System (mm)
2L3L
20171264165605609
20181246400590594
20191192512536545
Average 2017–20191234359577583
Table 2. Average prices by type of lemon (EUR kg−1) (first harvest, second harvest and industry) for the period 2017–2019.
Type of Fruit2017201820192017–2019
First harvest0.470.300.530.43
Second harvest0.360.230.340.31
Industry0.140.200.030.12
Annual average0.320.240.300.29
Table 3. Leaf nutrient concentrations of ‘Fino’ lemon for each irrigation system (two lines [2L] and three lines [3L]) in 2019.
Irrigation SystemN
(%)
P
(%)
K
(%)
Ca
(%)
Mg
(%)
Na
(%)
Cl
(%)
Fe
(ppm)
Cu
(ppm)
Mn
(ppm)
Zn
(ppm)
2019
2L2.74b0.11a0.623.620.370.080.18120b1828a30
3L3.06a0.10b0.553.840.340.080.18138a1921b30
ANOVA*****nsnsnsnsns**ns*ns
Values represent the average of twelve trees per irrigation system. For each column, values with different letters indicate significant differences with p ≤ 0.05, using the Duncan’s test. ‘ns’, not significant; * indicates p < 0.05; ** indicates p < 0.01; *** indicates p < 0.001.
Table 4. The influence of each irrigation system (two lines [2L] and three lines [3L]) on ‘Fino 49′ fruit yield of fruits affected and not affected by endoxerosis in both first and second harvests during the experimental period (2017 to 2019).
First HarvestSecond HarvestTOTAL
Non-Affected FruitsAffected FruitsTotal
Irrigation SystemYield
(kg tree−1)
Fruit Load
(n°. fruits tree−1)
Fruit Weigh
(g fruit−1)
Yield
(kg tree−1)
Fruit Load
(n°. fruits tree−1)
Fruit Weight
(g fruit−1)
Yield
(kg tree−1)
Fruit Load
(n°. fruits tree−1)
Fruit Weight
(g fruit−1)
Yield
(kg tree−1)
Fruit Load
(n°. fruits tree−1)
Fruit Weight
(g fruit−1)
Yield
(kg tree−1)
Fruit Load
(n°. fruits tree−1)
Fruit Weight
(g fruit−1)
Number of Fruits Affected with Regard to TOTAL
(%)
2017
2L67.7515134.644.2 a424 a104.5111.8939120.957.5541106.8169.31481115.427.5 a
3L83.5642129.729.9 b278 b106.4113.4920121.963.8581109.1177.21501117.818.1 b
ANOVAnsnsns**nsnsnsnsnsnsnsnsnsns**
2018
2L49.4 b367 b134.934.7289119.9 b84.1 b 655128.4 b47.3419 a113.1131.41075122.1b27.0
3L65.2 a462 a141.635.5277127.9 a100.6 a 739136.1 a37.4323 b115.2138.01062130.0a26.3
ANOVA**nsnsns**ns**ns*nsnsns**ns
2019
2L48.5 b355 b136.518.3143128.866.8 b498 b134.227.8239118.594.6737129.419.0
3L62.4 a457 a137.017.5129134.979.8 a586 a136.624.5205123.6104.3790132.917.3
ANOVA**nsnsnsns**nsnsnsnsnsnsnsns
2017–2019
2L165.6 b1237 b133.997.2856 b113.6 b262.72092125.6132.61199110.6395.33292120.125.8 a
3L211.1 a1561 a135.282.9684 a121.2 a293.82244130.9125.71109113.3419.63353125.120.4 b
ANOVA**nsns**nsnsnsnsnsnsnsnsns*
Values represent the average of twelve trees per irrigation system. For each column, values with different letters indicate significant differences at p ≤ 0.05, using Duncan’s test. ‘ns’ not significant; * indicates p < 0.05; ** indicates p < 0.01.
Table 5. Quality parameters from non-affected fruits: diameter (D.), external colour index (E.C.I.), peel thickness (P.Th.), juice, pulp and peel percentages, total soluble solids (TSS), titratable acidity (TA) and maturity index (M.I.) of each irrigation system (two lines [2L] and three lines [3L]) on ‘Fino 49′ during the experimental period (2017 to 2019).
Irrigation SystemFirst HarvestSecond Harvest
D.
(mm)
E.C.I.P.Th.
(mm)
Juice
(%)
Pulp
(%)
Peel
(%)
TSS
(°brix)
T.A.
(g L−1)
M.I.D.
(mm)
E.C.I.P.Th.
(mm)
Juice
(%)
Pulp
(%)
Peel
(%)
TSS
(°brix)
T.A.
(g L−1)
M.I.
2017
2L64.0−10.25.32 b31.03.563.68.3667.8 b1.2361.1−0.575.0632.63.760.68.0964.51.26
3L63.9−9.75.70 a29.43.664.68.3869.9 a 1.2062.0−0.925.1433.93.759.48.1565.51.24
ANOVAnsns*nsnsnsns*nsnsnsnsnsnsnsnsnsns
2018
2L65.9 b−9.076.5533.15.859.18.5366.11.2964.2−0.406.3230.84.764.07.9359.31.34
3L67.5 a−9.826.7433.55.758.98.5166.41.2863.9−0.546.2532.34.762.47.8861.61.28
ANOVA*nsnsnsnsnsnsnsnsnsnsnsnsnsnsnsnsns
2019
2L62.9−11.55.81 b28.73.866.78.3772.61.1563.0−0.285.5832.84.561.68.0765.51.23
3L63.3−11.46.08 a28.63.866.78.5072.21.1862.6−0.475.8231.84.462.58.1764.91.26
ANOVAnsns*nsnsnsnsnsnsnsnsnsnsnsnsnsnsns
Values represent the average of twelve trees per irrigation system. For each column, values with different letters indicate significant differences at p ≤ 0.05, using Duncan’s test. ‘ns’ not significant and * indicates p < 0.05.
Table 6. Technical water productivity (TWP) and economic water productivity (EWP) for each irrigation system (two lines [2L] and three lines [3L]) during the experimental period (2017 to 2019).
TWP (kg m−3)
Irrigation system201720182019Average (2017–2019)
2L11.79.37.39.5
3L12.19.78.010.0
ANOVAnsnsnsns
EWP (EUR m−3)
Irrigation system201720182019Average (2017–2019)
2L4.382.492.813.23 b
3L4.962.693.293.65 a
ANOVAnsnsns*
Values represent the average of twelve trees per irrigation system. For each column, values with different letters indicate significant differences at p ≤ 0.05, using Duncan’s test. ‘ns’: not significant and * indicates p < 0.05.
Disclaimer/Publisher’s Note: The statements, opinions and data contained in all publications are solely those of the individual author(s) and contributor(s) and not of MDPI and/or the editor(s). MDPI and/or the editor(s) disclaim responsibility for any injury to people or property resulting from any ideas, methods, instructions or products referred to in the content.

