Article

Genome-Wide Association Study for Fusarium Head Blight Resistance in Common Wheat from China

1
National Key Laboratory of Crop Genetic Improvement, Hubei Hongshan Laboratory, College of Plant Science & Technology, Huazhong Agricultural University, Wuhan 430070, China
2
National Key Laboratory of Wheat and Maize Crop Science, Agronomy College, Henan Agricultural University, Zhengzhou 450002, China
3
Zhejiang Academy of Agricultural Science, Hangzhou 310021, China
*
Authors to whom correspondence should be addressed.
These authors contributed equally to this work.
Submission received: 18 May 2023 / Revised: 21 June 2023 / Accepted: 21 June 2023 / Published: 26 June 2023
(This article belongs to the Special Issue Genetic Dissection and Improvement of Crop Traits)

Abstract

:
As a devastating wheat disease, Fusarium head blight (FHB) causes large losses in yield and quality. The purpose of this study was to detect the genetic loci for FHB resistance based on a genome-wide association study (GWAS) using two panels genotyped by the Wheat 660 K SNP array and Wheat 90 K SNP array. Phenotypic investigation results showed that 43.6–51.6% of the test varieties showed an infection type of more than 3, indicating that substantial improvement in the level of resistance was urgently required. GWAS detected 1264 SNPs associated with FHB response distributed on all wheat chromosomes. Fourteen QTL were stably detected in two environments. gFHB-1B (582.9~607.9 Mb on chromosome 1B) and gFHB-5A (577.9~596.5 Mb on 5A) were two novel resistance loci that were detected in two wheat panels. Haplotype analysis of both gFHB-1B and gFHB-5A indicated that varieties with gFHB-1B_R and gFHB-5A_R had consistently less FHB than varieties carrying a one or no resistance QTL. The application frequency of the FHB-resistant alleles gFHB-1B and gFHB-5A showed a gradually decreasing trend in FHB resistance breeding. This study identified new genetic loci for the control of FHB and provides useful information for marker-assisted selection in wheat FHB resistance.

1. Introduction

Fusarium head blight (FHB), mainly caused by Fusarium graminearum but also other Fusarium species, is an important fungal disease of wheat [1]. Diseased grain is shriveled, reddish in color, and may contain the mycotoxin deoxynivalenol (DON) and other trichothecene toxins. Kernels with excessive DON pose a severe threat to human and animal health [2]. The disease is widespread worldwide, and outbreaks of the disease cause wheat yield losses of more than 50%, especially in China, France, India, Russia, and the United States [3]. Breeding and planting disease-resistant varieties is the most cost-effective and sustainable measure against FHB loss [4]. It is important to identify FHB-resistant germplasm in order to reduce losses caused by this disease.
The Chinese variety Sumai 3 is the best source of FHB resistance so far [5]. FHB resistance QTL have been reported on all wheat chromosomes, and molecular markers have been developed for most of the mapped QTL [6,7,8]. Seven FHB resistance loci have been officially named. Fhb1 on 3B and Fhb2 on 6B were derived from Sumai 3 [9,10]; Fhb4 on 4B was detected in Wangshuibai [11]; Fhb5 on 5A was reportedly present in both Wangshuibai and Sumai 3 [12]; Fhb3 on 7A, Fhb6 on 1A, and Fhb7 on 7D were from wild relatives of wheat, namely, Leymus racemosus, Elymus tsukushiensis, and Thinopyrum ponticum, respectively [13,14,15].
Fhb1 was identified in numerous studies [6,9,16,17,18] and was fine-mapped to a 1.1 Mb region in chromosome 3B [19]. Although Fhb1 was identified as a pore-forming toxin-like (PFT) gene encoding a chimeric lectin [20], two other studies reported that TaHRC, encoding a putative histidine-rich calcium-binding protein, was the candidate gene [21,22]. Another cloned FHB resistance gene, Fhb7, encodes a glutathione S-transferase (GST) and confers broad resistance to Fusarium species by detoxifying trichothecenes through de-epoxidation [23]. Because of the low level of resistance conferred by an individual gene/QTL, it is therefore necessary to detect more FHB resistance genes/QTL that can be combined with those currently available in order to develop varieties with high levels of resistance.
Common wheat (2n = 42) is an allohexaploid (AABBDD) with a large genome (16 Gb), high sequence duplication between subgenomes, and an abundance of repetitive elements [24]. High-density wheat SNP arrays, such as the Wheat 90 K iSelect array [25], Wheat 660 K array [26], and 35 K Wheat Breeder’s array [27], have played an important role in mapping the genetic loci underlying complex traits in wheat by genome-wide association studies (GWASs). These traits include reaction black point [28] and Fusarium crown rot [29]; the yield components plant height, kernel weight, kernel length, and peduncle length [30]; the quality traits hardness index, grain protein content, wet gluten content, and flour color [31]; and various metabolites [32].
The objectives of the present study were to survey FHB-resistance-related loci in two wheat panels GWAS in order to (1) identify new FHB resistance loci and (2) identify superior haplotypes of two new resistance QTL, and (3) the polymorphism information of all genes within the interval was used to conduct GWASs of candidate genes and screen candidate genes.

2. Materials and Methods

2.1. Plant Materials

A total of 406 Chinese wheat varieties were collected to investigate FHB response and divided into two panels depending on their released time. Panel I included 243 common wheat cultivars or advanced lines from the Huang-Huai valley, and these varieties were released after 2014 [29]. Panel II contained 163 wheat varieties from every province in China, after cultivation and domestication in the Yellow and Huai Valley of China, and these varieties were released before 2014 [30,31]. Both panels were planted at Jianyang in Fujian province (27.30° N, 118.2° E) during 2016–2017 cropping season and at Hangzhou in Zhejiang (30.3° N, 120.2° E) in 2021–2022 cropping season. Plants were grown with 10 cm spacing in 2 m rows with 23 cm between rows. Each population was planted in a randomized complete block design with two replicates and managed according to local practices.

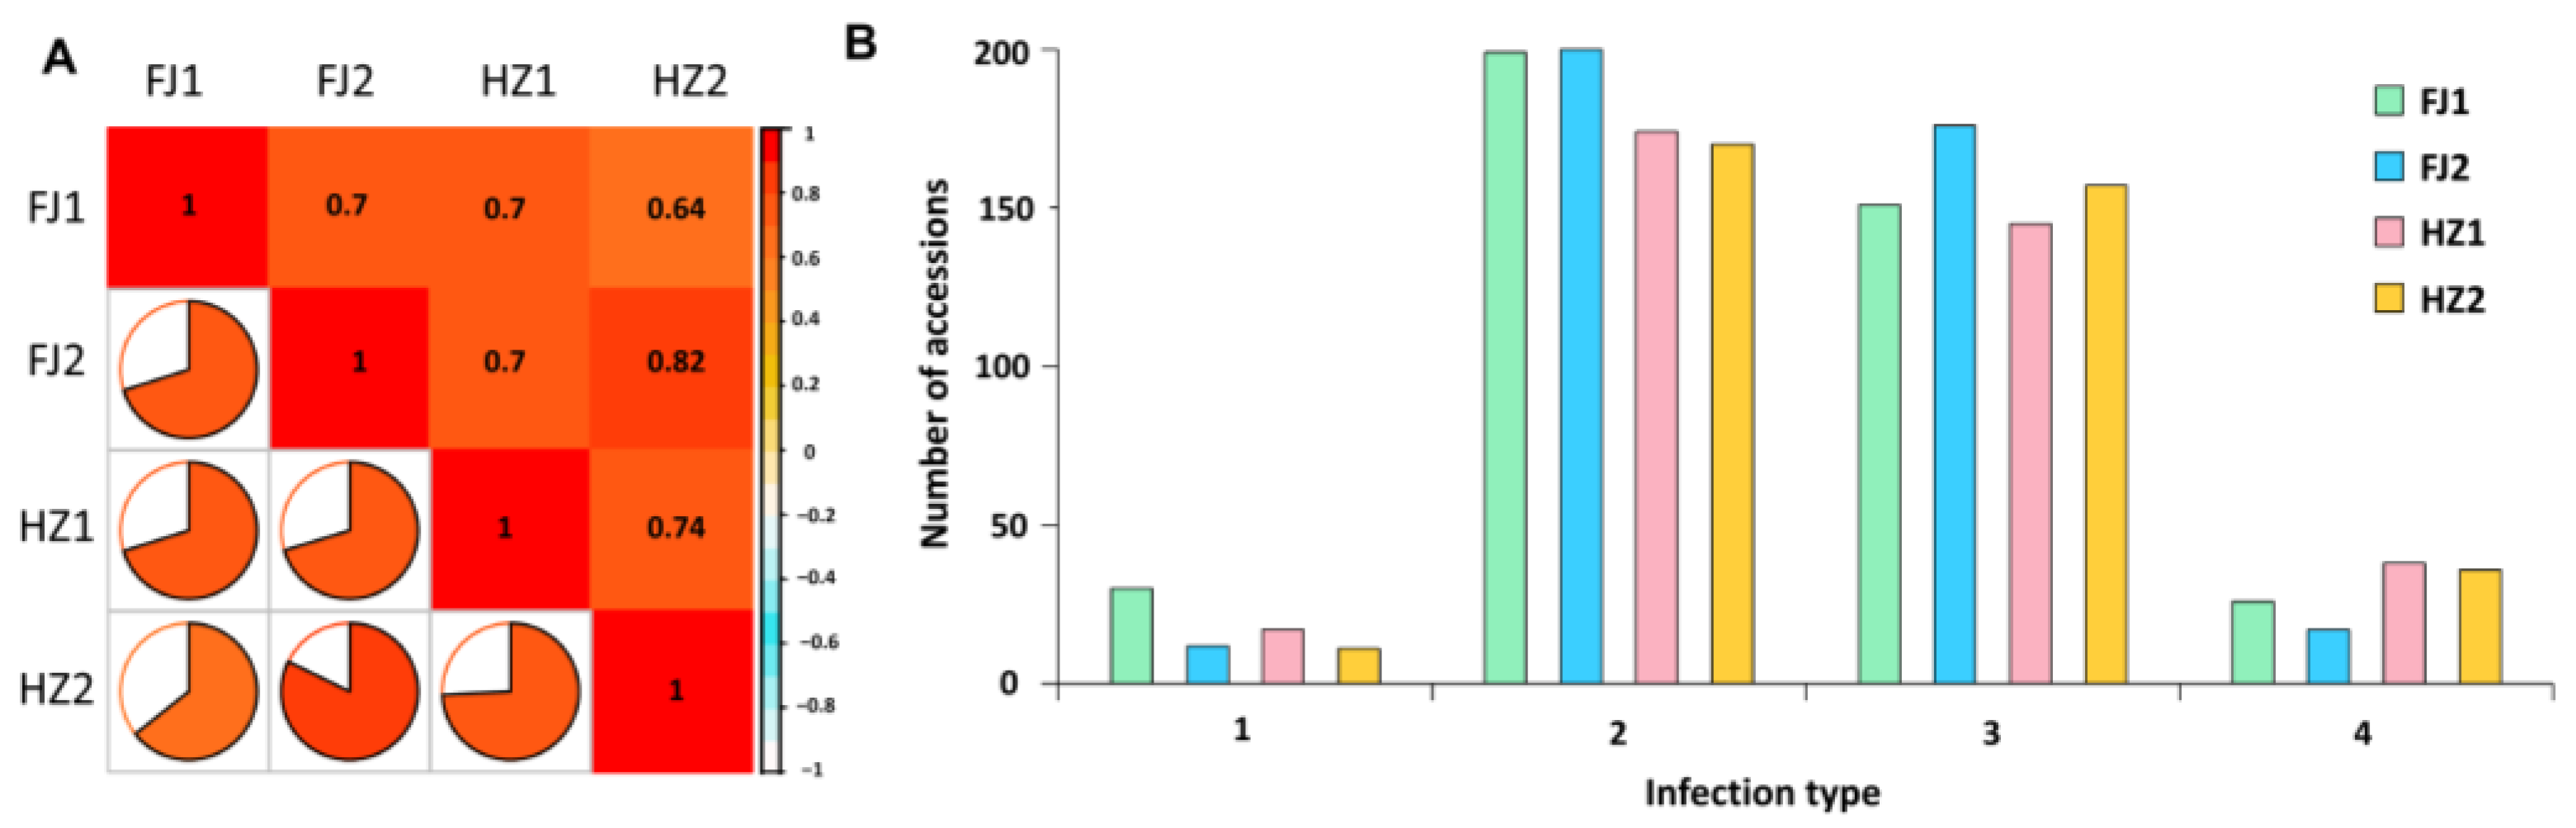
2.2. Index of FHB Response

The F. graminearum isolate FJX01 was used in this study. Spore suspensions were prepared using CMC medium and a diluted concentration of 105 spores mL−1. Then, the spore suspension was sprayed at the early flowering stage (10% of spikes at anthesis). After inoculation, the nursery was mist-irrigated for 4 days. Total spikelets and number of symptomatic spikelets per spike were scored 21 days after infection and an average rate of 5 symptomatic spikelets was calculated for each variety in each replicate prior to conversion to a 1 to 4 type II response scale [33,34], where the averaged symptomatic spikelets rates were
  • 1 = less than 0.25;
  • 2 = 0.25–less than 0.5;
  • 3 = 0.5–less than 0.75;
  • 4 = 0.75–1 or entire spike dead.
Broad-sense heritability was calculated using the lme4 package in R software based on the mixed linear model [35].

2.3. Genotyping and Filtering

Panel I was genotyped using the Wheat 660 K SNP array [26,29], and genotyping was performed by Beijing CapitalBio Technology Company. Panel II was genotyped using the Wheat 90 K SNP array and genotyping was performed by Beijing Compass Technology & Investment Co. Ltd. [25,30,31]. Quality control was performed for SNP markers with minor allele frequency (MAF) > 0.05 and missing data < 20%. This pre-processing was examined by PLINK software [36]. Totals of 395,782 SNPs in Panel I and 41,561 SNPs in Panel II were used for final GWAS after quality control.

2.4. Genome-Wide Association Study

The population structures of Panel I and Panel II were evaluated using STRUCTURE software 2.3.4 with unlinked markers (r2 = 0) [37], and population structures of Panel I and Panel II were shown in both reports by Sun et al. [30] and Yang et al. [29]. Panel I comprised ten subpopulations [29] and Panel II four subpopulations [30]. Principle component analysis (PCA) was performed by the GAPIT procedure using R software to assess the population structure [30]. GWAS of the present results was performed based on the mixed linear model (PCA+K) using GAPIT Version 3 package in R software [38]. The genome-wide significance threshold was determined by a uniform threshold of 1/n in Panel I and Panel II, where n was the effective number of independent SNPs calculated using Genetic type 1 Error Calculator (v0.2) [39]. However, this threshold filters out many real FHB resistance loci. Therefore, combined with the p-value of all SNPs in four replicates, a uniform suggestive genome-wide significance threshold (1.0 × 10⁻³ and 1.0 × 10⁻² for Panel I and Panel II) was given.

2.5. Haplotype Analysis

Linkage disequilibrium and haplotype analysis of all SNPs associated with FHB response were performed with Haploview 4.2 software [40]. The significance of differences among haplotypes was based on t-tests (p < 0.05). Based on the large linkage disequilibria characteristic of wheat, we considered that two significant SNPs separated by more than 20 Mb represented different resistance loci.

2.6. Candidate Gene Identification

Using the Chinese Spring reference genome sequence RefSeq v1.1 [24], we normalized the physical locations of FHB-resistance-related QTL based on the closely linked markers. Then, candidate gene identification associated with high-confidence FHB resistance loci and candidate gene functional annotation was conducted using the genome assembly of the reference genome [24], EnsemblPlants and WheatOmics website [41]. The polymorphism information of these genes in the population was analyzed by exon capture sequencing of the genes in the candidate interval, and these polymorphic markers were added to the original wheat SNP array to conduct the GWAS of the candidate genes, and the possible candidate genes related to FHB resistance were screened.

3. Results

3.1. Distribution of FHB Responses in the Variety Panels

The correlation coefficients of FHB response among all 406 varieties ranged from 0.64 to 0.82 over the four replications (Figure 1A), and the broad-sense heritability of FHB resistance was 74.1%. The FHB responses of most varieties were 2 or 3 (Figure 1B). An analysis of mean FHB response in the four replicates indicated that 43.6–51.6% of varieties were susceptible (IT ≥ 3). Only 3.0–7.4% of varieties were of the highly resistant infection type (IT ≤ 1).

3.2. Genome-Wide Association Study of Wheat FHB Resistance

Separate GWASs performed on the two panels detected 1264 SNPs significantly associated with FHB response across the four replications, with phenotypic variation explained (PVE) ranging from 5.0% to 20.1% (Figure 2A,B; Table S1). They were mainly distributed on chromosomes 1A (79), 2A (114), 2B (93), 3A (181), 3B (61), 5A (94), 6A (66), 6B (62), and 7B (139) (Table S1).
In Panel I, 638 SNPs were associated with FHB resistance with PVE of 5.0% to 11.8%, and these were mainly present in chromosomes 1A (44), 2A (101), 3A (119), 5A (43), 6A (52), and 7B (118) (Table S1). Using the physical position distribution of these SNPs, nine resistance loci were stably detected in at least two replicates in Panel I; they were, respectively, named gFHB-1A.1 (3.4~46.2 Mb on chromosome 1A, average PVE 9.4%), gFHB-1A.2 (527.2~534.3 Mb on 1A, average PVE 9.8%), gFHB-1A.3 (579.4~591.3 Mb on 1A, average PVE 6.3%), gFHB-1B (582.9~607.9 Mb on 1B, average PVE 8.6%), gFHB-3A.2 (539.7~570.8 Mb on 3A, average PVE 8.2%), gFHB-3B (3.3~14.3 Mb on 3B, average PVE 11.4%), gFHB-5A (577.9~596.5 Mb on 5A, average PVE 10.7%), gFHB-5D (524.8~565.7 Mb on 5D, average PVE 9.8%), and gFHB-7B (128.9~199.8 Mb on 7B, average PVE 9.4%) (Table 1).
In Panel II, 678 significant SNPs were associated with FHB resistance with PVE of 7.3% to 20.1%, and these SNPs were mainly distributed on wheat chromosomes 2B (91), 3A (76), 5A (69), and 6B (60) (Table S1). A total of 13 FHB resistance loci were detected in this panel (Table 1). Among them, eight FHB resistance loci (gFHB-1A.1, gFHB-1A.2, gFHB-1A.3, gFHB-1B, gFHB-3B, gFHB-5A, gFHB-5D, and gFHB-7B) were simultaneously detected in both Panel I and Panel II. gFHB-1B and gFHB-5A, as stable FHB resistance loci detected in both panels, were chosen as high-confidence FHB resistance loci for further analysis (Figure 3).

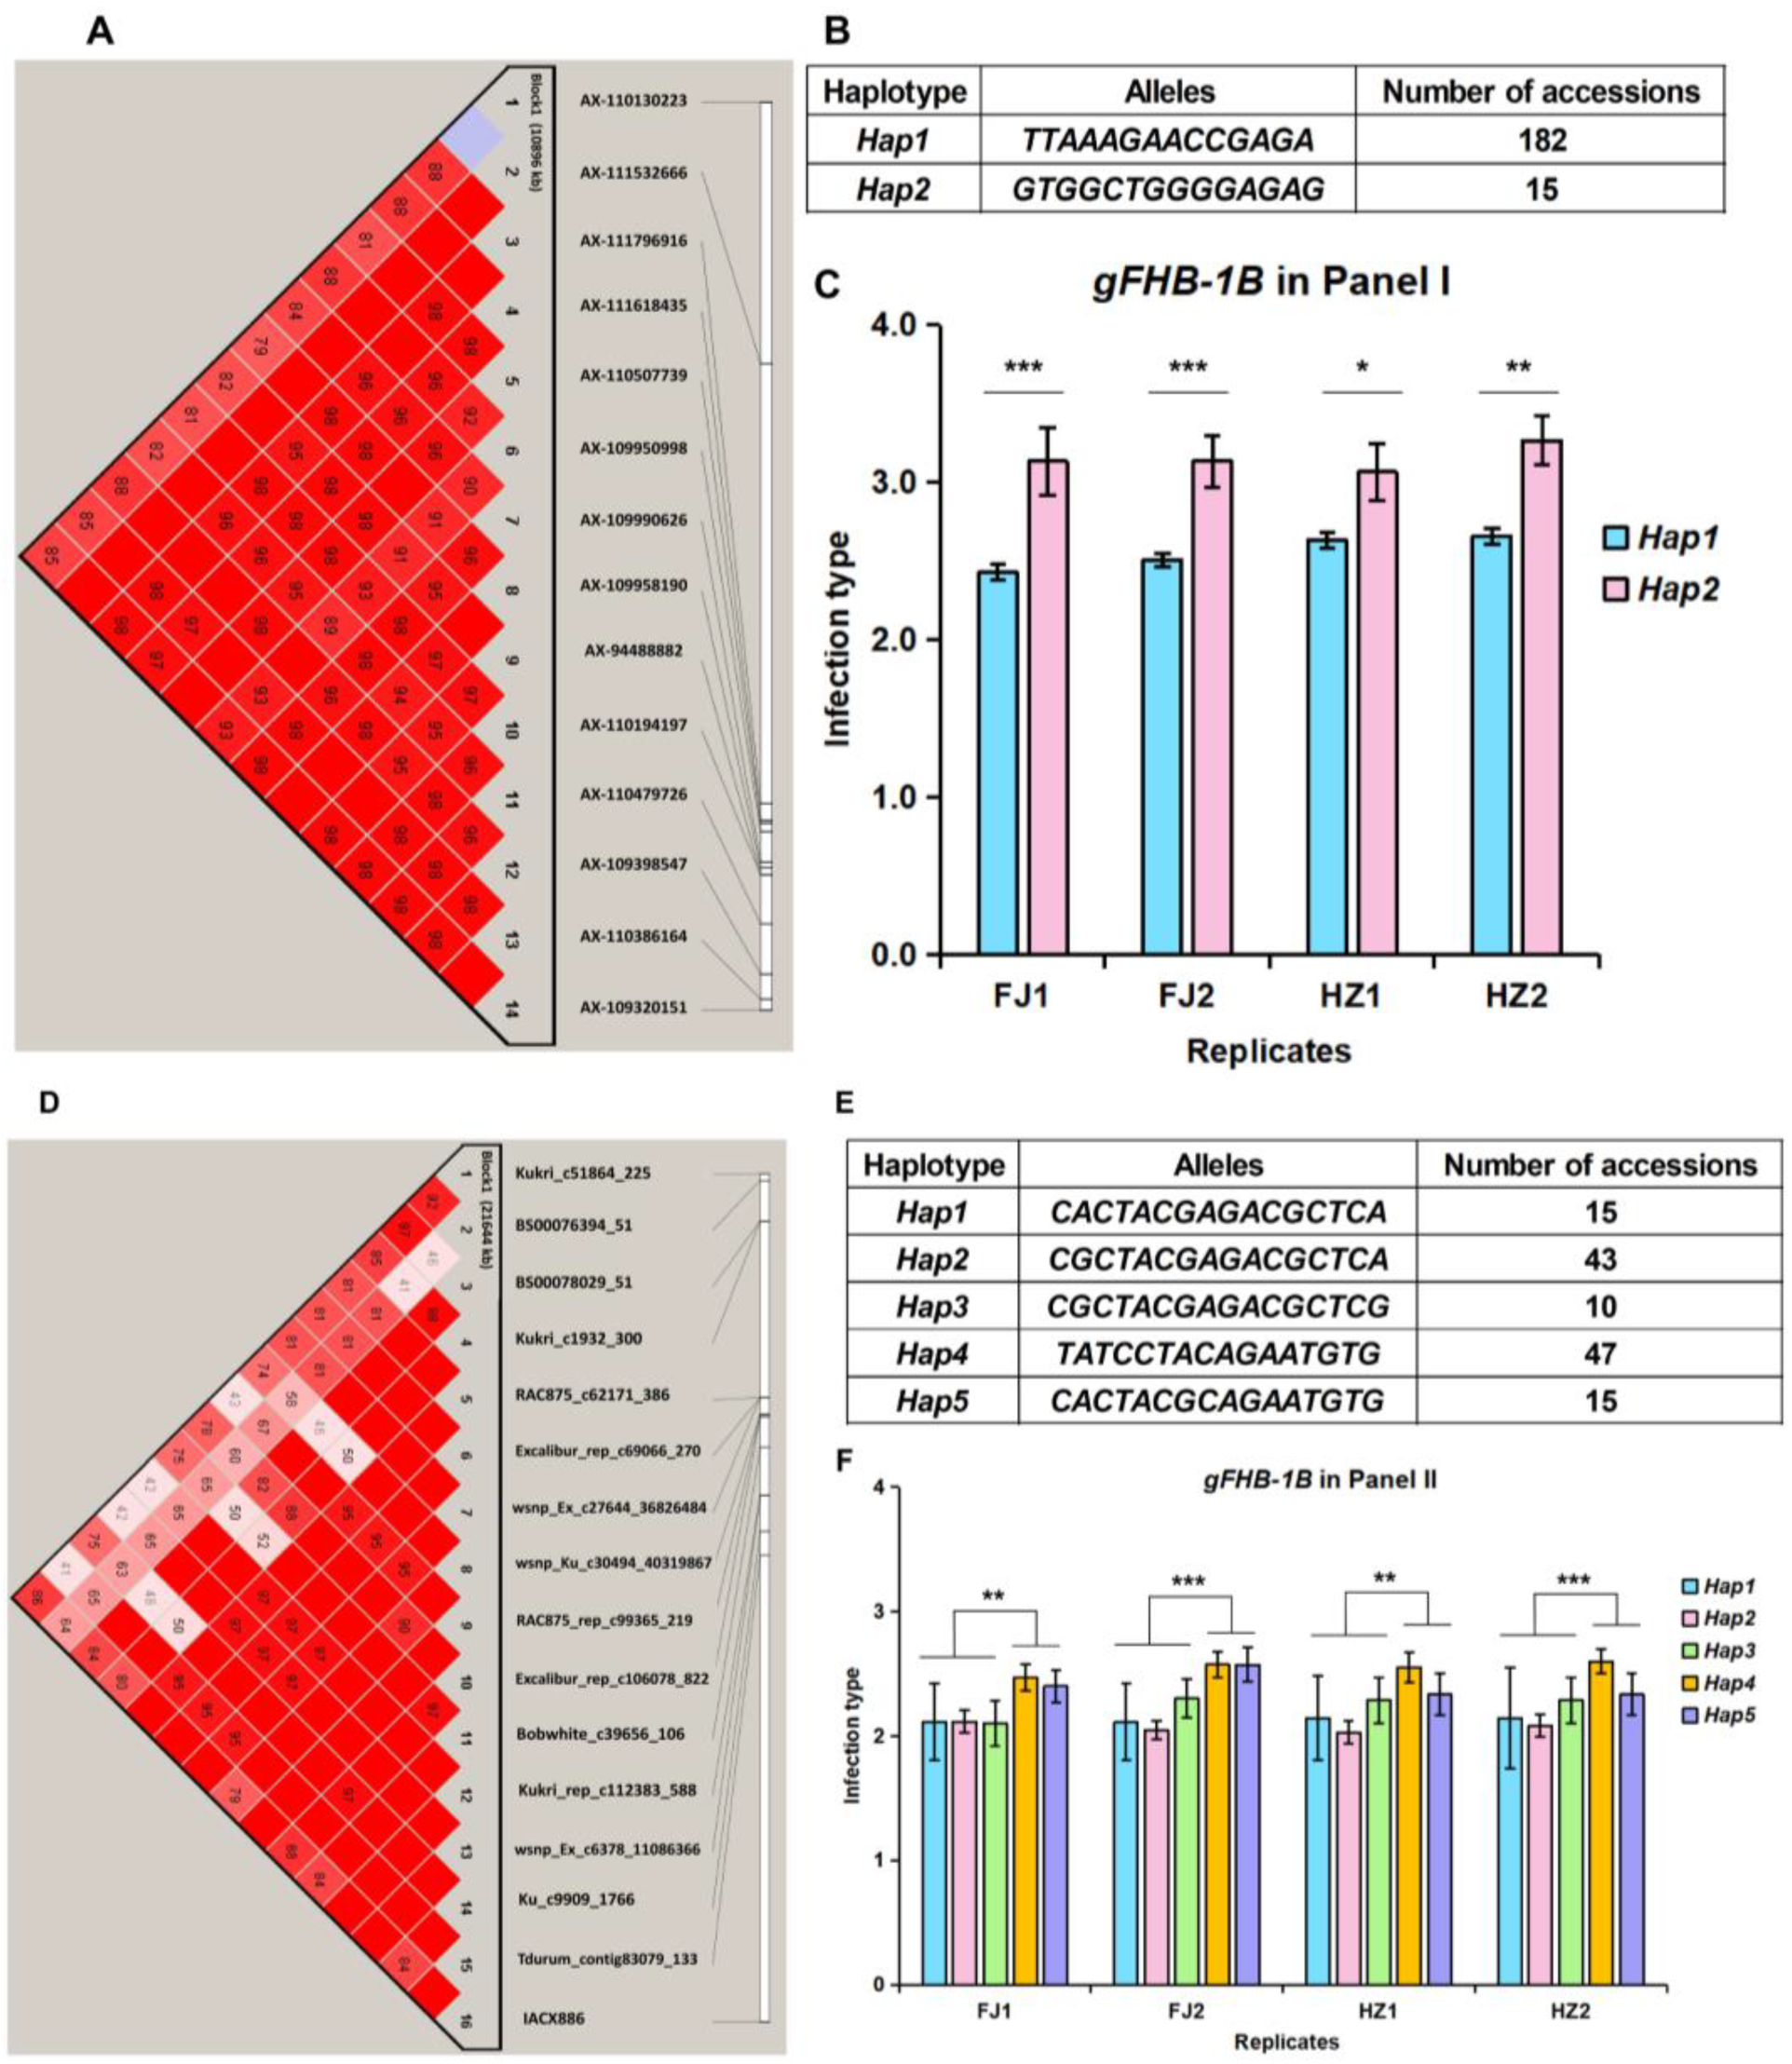
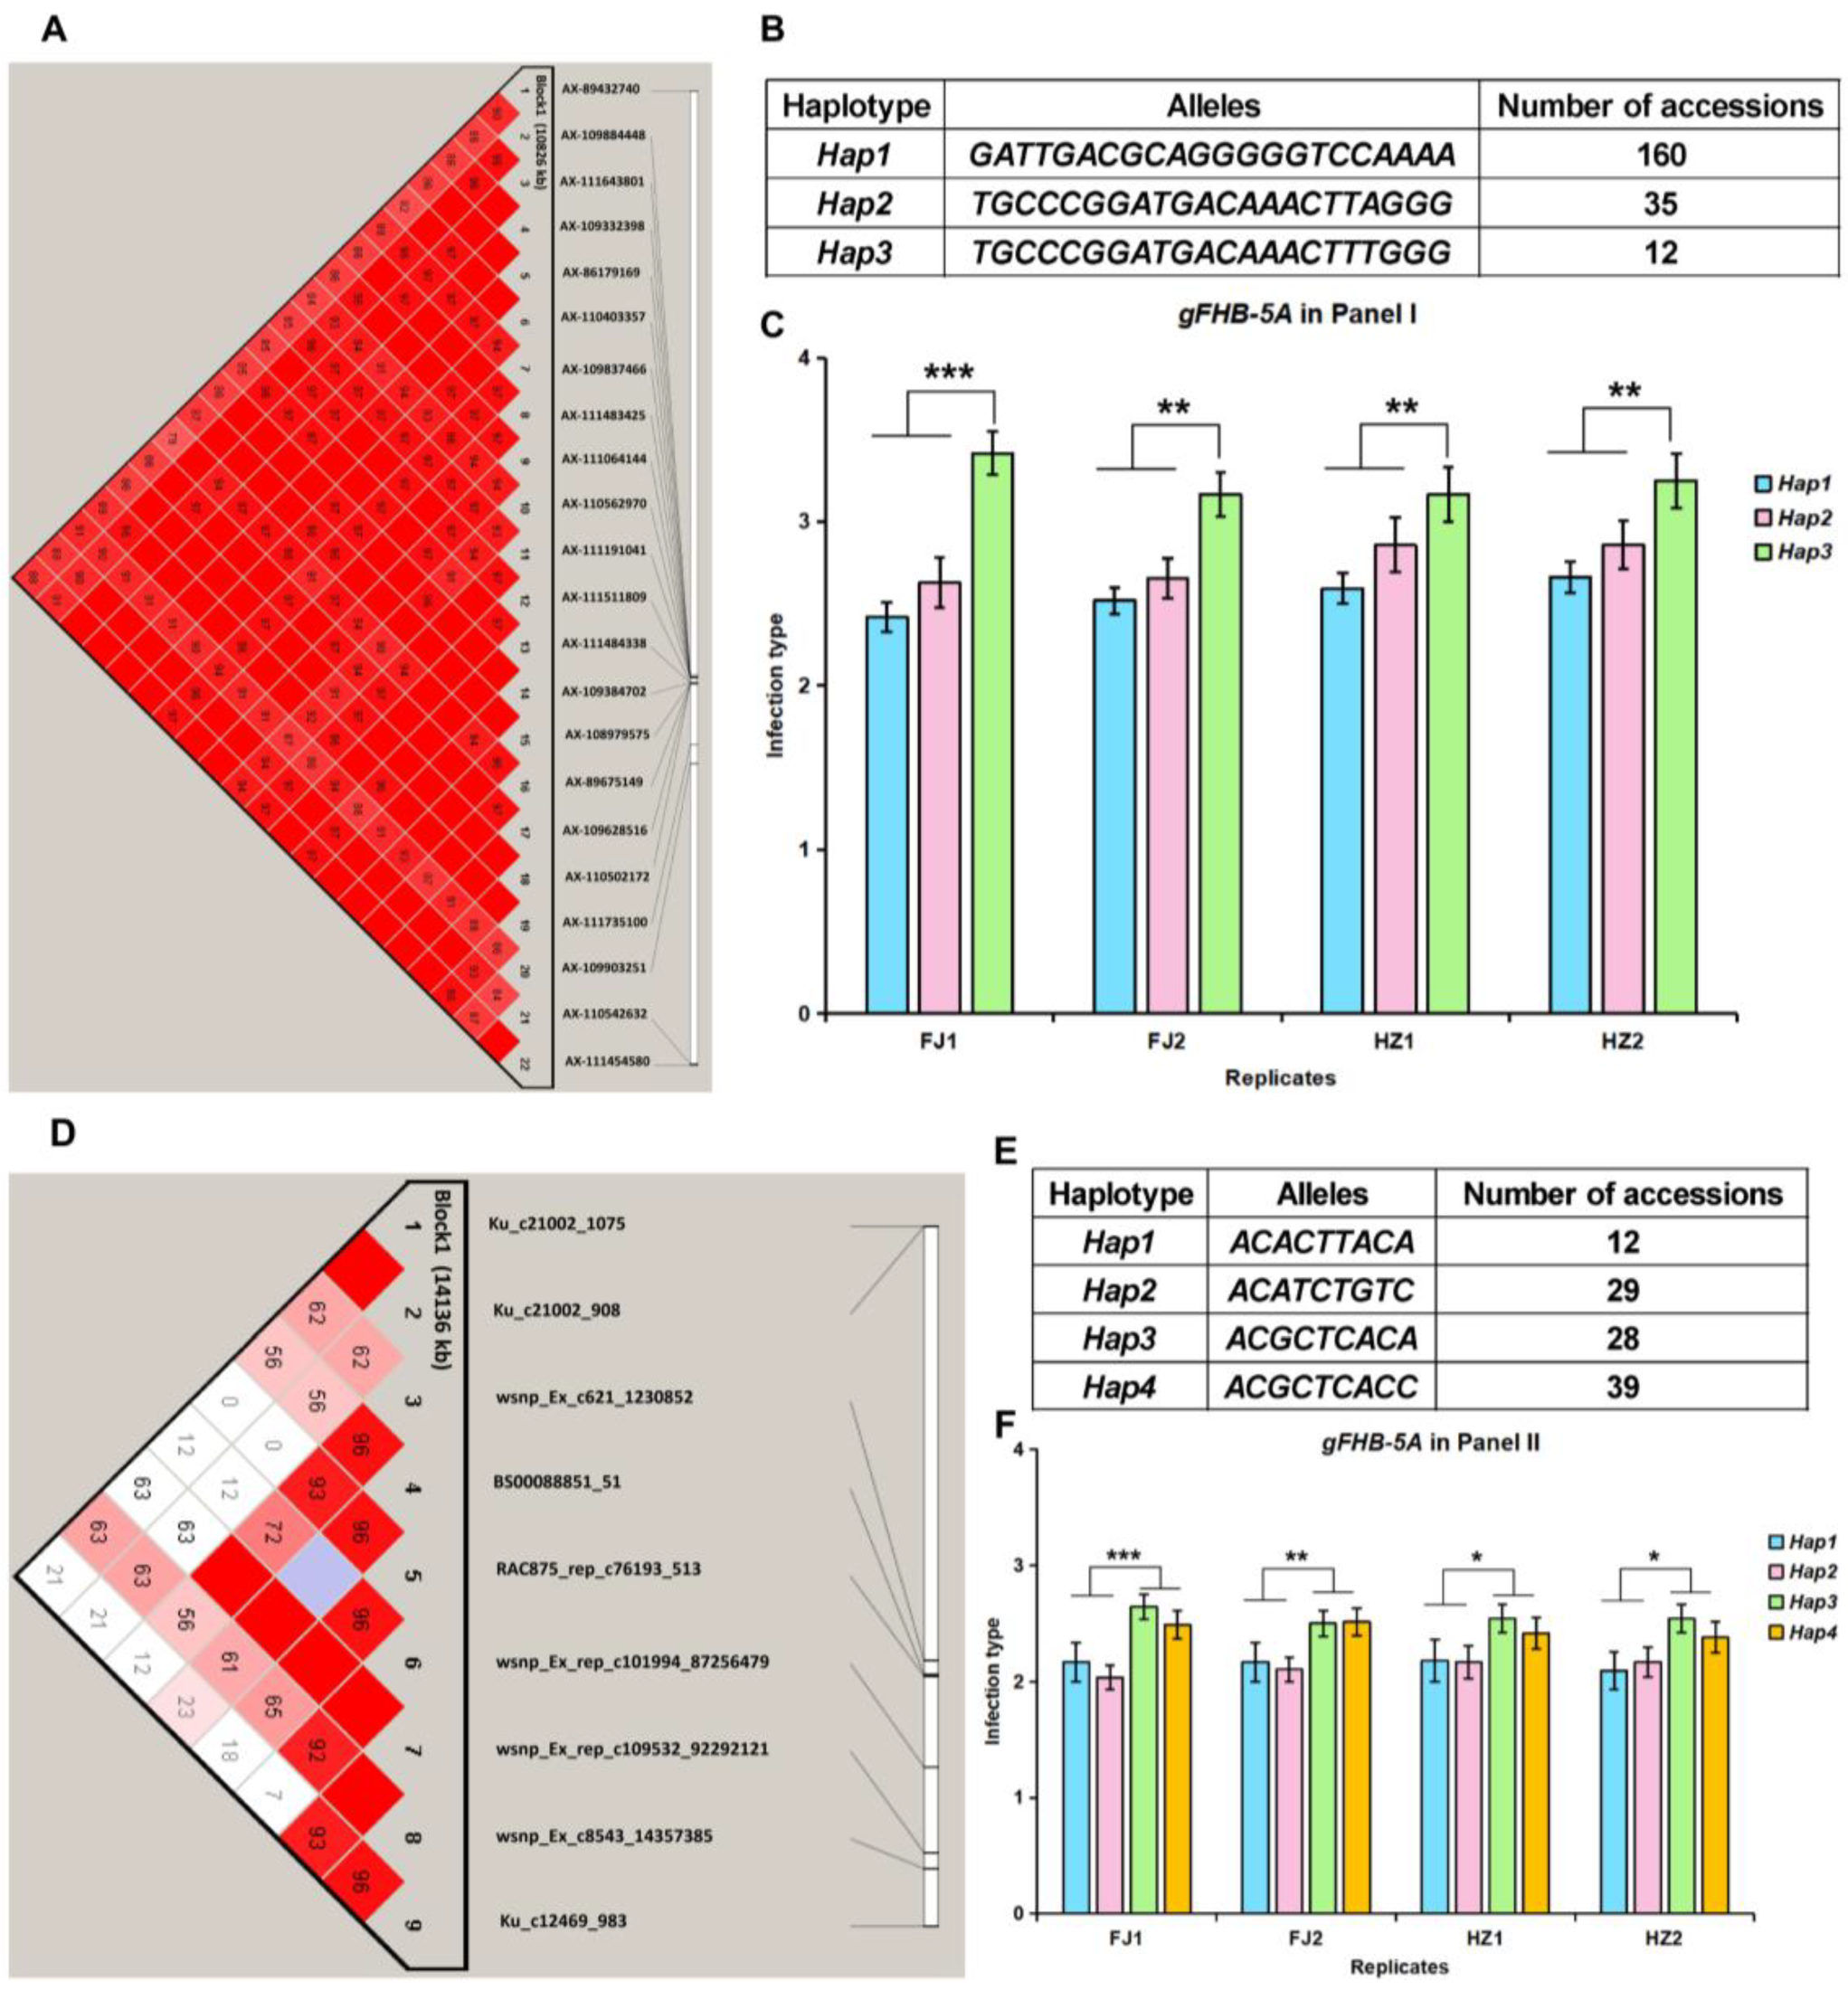
3.3. Haplotype Analysis of High-Confidence FHB Resistance Loci gFHB-1B and gFHB-5A

There were 14 significant SNPs for gFHB-1B in a 10.9 Mb block with high linkage disequilibrium (LD) in Panel I (Figure 4A). There were two frequent haplotypes for this block (Figure 4B). Varieties carrying Hap1 (IT 2.4–2.7) expressed significantly higher resistance than those carrying Hap2 (IT 3.1–3.3) across the four replications (Figure 4C). In Panel II, there were 12 significant SNPs for gFHB-1B located in a 21.6 Mb block with a high LD (Figure 4D). Five main haplotypes were detected for this block (Figure 4E). Varieties carrying Hap1/Hap2/Hap3 (2.1–2.2) showed significantly higher FHB resistance than those carrying Hap4/Hap5 (2.4–2.6) over the four replications (Figure 4F). Therefore, Hap1 in Panel I and Hap1/Hap2/Hap3 in Panel II were superior haplotypes (Hap_1B_R) for FHB resistance conferred by the gFHB-1B QTL.
There were 22 SNPs associated with gFHB-5A located in a 10.8 Mb block with high LD in Panel I (Figure 5A). There were three main haplotypes for this block (Figure 5B). Varieties carrying Hap1/Hap2 (IT 2.5–2.8) had significantly higher resistance than those carrying Hap3 (3.2–3.4) across the four replications (Figure 5C). For Panel II, there were nine significant SNPs located in a 14.1 Mb block (Figure 5D). Among varieties with the four most frequent haplotypes in this block (Figure 5E), those carrying Hap1/Hap2 (IT 2.1–2.2) showed higher resistance than the group carrying Hap3/Hap4 (2.5–2.6) (Figure 5F). Therefore, varieties with Hap1/Hap2 in Panel I and Hap1/Hap2 in Panel II were superior haplotypes (Hap_5A_R) at the gFHB-5A locus.
Varieties combining gFHB-1B_R and gFHB-5A_R had consistently less FHB than varieties carrying a one or no resistance QTL (Figure 6).

3.4. Prediction of Candidate Genes

By integrating haplotype results for all significant SNPs in both panels, the gFHB-1B candidate region was narrowed to a 7.6 Mb interval (597.0~604.6 Mb) containing 85 high-confidence annotated genes (https://plants.ensembl.org/Triticum_aestivum/Tools/Blast, accessed on 14 April 2023). We amplified and sequenced 85 candidate genes in 406 varieties. According to the sequencing results, polymorphism analysis was conducted, and the polymorphisms of these genes were added back to the original wheat SNP array for GWAS of the candidate genes. Then, only TraesCS1B02G374300_604562060 with p-values of 6.4 × 10⁻⁴ and 8.5 × 10⁻⁴ in the region of TraesCS1B02G374300 was detected to be significantly associated with FHB response in at least two replicates in Panel I (Table S2). As a consequence, TraesCS1B02G374300, encoding a MYB-related transcription factor, was considered as the candidate gene for gFHB-1B.
By integrating the haplotype analysis results from the two panels for all significant SNPs in the gFHB-5A QTL, the candidate region of this locus was narrowed to a 6.4 Mb interval (582.4~588.8 Mb) containing 80 high-confidence annotated genes. We amplified and sequenced 80 candidate genes in 406 varieties. According to the sequencing results, polymorphism analysis was conducted and the polymorphisms of these genes were added back to the original wheat SNP array for GWASs of the candidate genes. In Panel I, two polymorphic markers (TraesCS5A02G385600_583570621 and TraesCS5A02G385600_583570633) within TraesCS5A02G385600 were detected to be significantly associated with FHB response in at least two replicates (Table S2). In Panel II, five polymorphic markers (TraesCS5A02G386500_584060887, TraesCS5A02G386500_584060909, TraesCS5A02G386500_584060919, TraesCS5A02G387000_584507296, and TraesCS5A02G389800_585434071) within TraesCS5A02G386500, TraesCS5A02G387000, and TraesCS5A02G389800 were detected to be significantly associated with FHB response in at least two replicates (Table S2). As a consequence, TraesCS5A02G385600 encoding a late embryogenesis abundant D-like protein, TraesCS5A02G386500 encoding a myosin family protein, TraesCS5A02G387000 encoding a receptor-like kinase, and TraesCS5A02G389800 encoding a tetratricopeptide repeat protein were considered as the candidate genes for gFHB-5A.

3.5. Distribution of Resistance Alleles for gFHB-1B and gFHB-5A in the Huang-Huai Valley

Among Panel I varieties, which were developed after 2014, 80.3% and 74.9% carried alleles Hap_1B_R or Hap_5A_R, indicating that these genes were widely present in the Huang-Huai valley (Figure 7A). Based on the released years of varieties, Panel II varieties were divided into three periods based on time release, i.e., pre-1980, 1980–2000, and 2000–2014. The frequencies of Hap_1B_R during those periods were 63.6%, 54.9%, and 50.0%, respectively (Figure 7B), and the corresponding frequencies for Hap_5A_R were 50.0%, 39.0%, and 32.4%, a clear decline over time (Figure 7B). It is suggested that the application frequency of the FHB-resistant alleles gFHB-1B and gFHB-5A showed a gradually decreasing trend in FHB resistance breeding, and breeders should pay more attention to their application value in future FHB wheat breeding.

4. Discussion

FHB is a major threat for wheat yield and quality. Many researchers are working on the screening of FHB-resistant germplasm. Because FHB is easily affected by the external environment, the germplasm resources screened by researchers are finite [42]. Here, we used two panels totaling 406 wheat varieties to represent genetic diversity in Chinese germplasm resources in GWASs and genotyped them with the commonly used Wheat 660 K and 90 K SNP arrays. Among 14 FHB resistance QTL detected in this study, 9 were detected by the 660 K SNP array and 13 were detected by the 90 K SNP array. By normalizing the physical locations of the markers, eight FHB resistance loci were detected by both SNP arrays. It becomes apparent that when two chips are used simultaneously to map a trait, the reliability and stability of loci can be mutually verified. The significant SNPs detected by the 660 K array were more concentrated in distribution than those detected by the 90 K array, as evidenced by the SNP discovery in the region of gFHB-5A.
Hundreds of QTL for FHB resistance have been detected across all 21 wheat chromosomes [43]. Here, 14 FHB-resistance-related QTL were located by GWAS; among them, 8 loci were stably detected in two variety panels. By analyzing the genotype of FHB resistance loci carried by the varieties, we found that Yanmai 888, Jimai23, Changnong339-5-1, Mianyang 86-11, Beijing 841, Zhengmai9023, and Youmai4 carried at least four resistance alleles showing FHB resistance of infection type 1. This is of great value in breeding FHB-resistant varieties by gene polymerization of large dominant FHB resistant loci such as Fhb1-Fhb7 and novel small-effect FHB resistant loci.
To prove the novelty of the loci, we compared the physical distance of the FHB-resistance-related markers detected in this study with linked markers detected in previous studies. Notably, Fhb1, a major-effect QTL in the Asian variety Sumai 3, detected in many previous studies was reported to encode a putative histidine-rich calcium-binding protein, and a deletion spanning its start codon resulted in FHB resistance [20,21,22]. In the present study, the physical position of gFHB-3B (3.3~14.3 Mb) overlapped the regions of Qfhb.nmbu.3B.1 (7–9 Mb), high-confidence meta QTL-1 (hcmQTL-29: 3~8 Mb), and hcmQTL-30 (7~9 Mb). We speculated that gFHB-3B might be Fhb1 [43,44].
We detected three FHB resistance QTL on 1A. The physical position of gFHB-1A.1 (3.4~46.2 Mb) was in the same region as Qfhb.nmbu.1A.1 (3.1~13.3 on 1A) and high-confidence meta QTL-1 (hcmQTL-1: 28~38 Mb) previously reported by Nannuru et al. [44] and Zheng et al. [43]. Qfhb.nmbu.1A.2 (520~590 Mb) was reported by Nannuru et al. [44], whereas the physical interval of gFHB-1A.2 527.2~534.3 Mb and that of gFHB-1A.3 was 579.4~591.3 Mb in a similar location to hcmQTL-4 (577~584 Mb) [43]. This last gene was predicted to be TraesCS1A02G428400, annotated as a tryptophan synthase alpha chain. We speculate that gFHB-1A.1, gFHB-1A.2, and gFHB-1A.3 are the same as reported in previous studies, although candidate genes are currently unconfirmed.
Multiple FHB disease resistance QTL located on chromosome 1B were identified by previous studies, such as QFHB.vt-1B.1 (476.3~476.9 Mb), QFHB.vt-1B.2 (330.2~341.9 Mb), hcmQTL-5 (208~223 Mb), hcmQTL-6 (530~546 Mb), hcmQTL-7 (562~572 Mb), and hcmQTL-8 (637~642 Mb) [43,45] In addition, QFhb-1BL.1 (326.0 Mb) and QFhb-1BL.2 (327.0 Mb) were detected by GWAS using a panel of 236 elite soft red winter wheat (SRWW) lines (Ghimire et al., 2022). Petersen et al. [46] identified Qfhb.nc-1B.4 and mapped the QTL flanked by the markers IWB31692 (658.5 Mb) and IWB9040 (676.8 Mb). The gFHB-1B (582.9~607.9 Mb) identified in this study is located between the published hcmQTL-7 and hcmQTL-8, and whether these three loci indicate the same locus needs further research.
Additionally, gFHB-2B, gFHB-3A.2, gFHB-3D, gFHB-5D, gFHB-6B, gFHB-7A, and gFHB-7B could correspond to the previously reported hcmQTL-17 at 689~704 Mb on chromosome 2B [43,47], QFhb.hbass-3AL in Jingzhou 66 at 530.9~617.6 Mb [48], QFhs.fal-3DS from Arina at 6.75~7.09 Mb [43,49], gFHB-5A (577.9~596.5 Mb) located between hcmQTL-46 (464~472 Mb) and hcmQTL-47 (644~662 Mb) [43], Qfhs.ksu-5DL1 from Chokwang at 430.04~676.71 Mb [43,50], hcmQTL-62 from Sumai3 and durum variety DT707 at 147~154 Mb on 6B [16,43,51], hcmQTL-66 from RL4137 at 37~49 M on 7A [43,52], and hcmQTL-73 from Dream at 143~163 Mb on chromosome 7B [43,53]. Among the QTL reported on 3A, the closest location to gFHB-3A.1 (1.3~14.9 Mb) is hcmQTL-23 (15~21 Mb) [43], others were more distal [43].
Since no previously reported QTL overlapped gFHB-1B, gFHB-3A.1, or gFHB-5A, these resistance loci are probably novel. High-confidence FHB resistance loci gFHB-1B and gFHB-5A were subjected to further analysis. The GWAS analysis of candidate genes was performed again based on the polymorphic amplification of candidate genes, and five potential resistance candidate genes were predicted.
FHB disease resistance in wheat is a complex quantitative trait. Most varieties show variable levels of partial resistance. Marker-assisted selection to combine various QTL is the most economic and effective route to reduce yield losses. Here, 14 FHB resistance loci were detected and three of them are probably novel. Favorable haplotypes that should improve the level of FHB resistance were detected. Five potential resistance candidate genes were predicted for gFHB-1B and gFHB-5A, respectively, combined with a haplotype analysis of two panels and genome-wide association analysis of candidate genes. In conclusion, this study found some favorable alleles and new FHB QTL through the genome-wide association study of FHB resistance loci, which enhanced gene diversification and enriched the FHB resistance gene pool, which has important theoretical significance for resisting the possible FHB epidemic in future production. It also provides important marker information for marker-assisted selection breeding.

Supplementary Materials

The following supporting information can be downloaded at https://0-www-mdpi-com.brum.beds.ac.uk/article/10.3390/agronomy13071712/s1, Table S1: Details of 1264 SNPs associated with FHB response detected by the current genome-wide association studies (GWAS), Table S2: Details of SNPs associated with FHB response detected by genome-wide association study (GWAS) after adding the polymorphism of candidate genes.

Author Contributions

Conceptualization, W.H., C.L. and F.C.; funding acquisition, C.S. and C.L.; investigation, C.S., H.C., X.S., Y.S., Z.C. and L.M.; software, H.C., Z.L., J.L. and Y.R.; supervision, W.H., C.L. and F.C.; writing—original draft, C.S.; writing—review and editing, C.L. and F.C. All authors have read and agreed to the published version of the manuscript.

Funding

This work was funded by the National Natural Science Foundation (32101779), China Postdoctoral Science Foundation (2021M701359), Key Research and Development Program of Hubei Province (2022BBA0035), Hubei Hongshan Laboratory (2021hskf008 and 2022hspy010), and HZAU-AGIS Cooperation Fund (SZYJY2022035).

Data Availability Statement

Not applicable.

Conflicts of Interests

The authors declare no conflict of interests.

References

  1. McMullen, M.; Bergstrom, G.; De-Wolf, E.; Dill-Macky, R.; Hershman, D.; Shaner, G.; Van Sanford, D. A unified effort to fight an enemy of wheat and barley: Fusarium head blight. Plant Dis. 2012, 96, 1712–1728. [Google Scholar] [CrossRef] [PubMed] [Green Version]
  2. Cheng, S.H.; Zhang, Y.; Bie, T.D.; Gao, D.R. Damage of wheat Fusarium head blight epidemics and genetic improvement of wheat for scab resistance in China. Jiangsu J. Agric. Sci. 2012, 28, 938–942. [Google Scholar]
  3. Brown, N.A.; Urban, M.; van de Meene, A.M.; Hammond-Kosack, K.E. The infection biology of Fusarium graminearum: Defining the pathways of spikelet to spikelet colonisation in wheat ears. Fungal Biol. 2010, 114, 555–571. [Google Scholar] [CrossRef] [PubMed]
  4. Ghimire, B.; Mergoum, M.; Martinez-Espinoza, A.D.; Sapkota, S.; Pradhan, S.; Babar, M.A.; Bai, G.; Dong, Y.; Buck, J.W. Genetics of Fusarium head blight resistance in soft red winter wheat using a genome-wide association study. Plant Genome 2022, 15, e20222. [Google Scholar] [CrossRef] [PubMed]
  5. Zhu, Z.; Hao, Y.; Mergoum, M.; Bai, G.; Humphreys, G.; Cloutier, S.; Xia, X.; He, Z. Breeding wheat for resistance to Fusarium head blight in the Global North: China, USA, and Canada. Crop J. 2019, 7, 730–738. [Google Scholar] [CrossRef]
  6. Buerstmayr, H.; Lemmens, M.; Hartl, L.; Doldi, L.; Steiner, B.; Stierschneider, M.; Ruckenbauer, P. Molecular mapping of QTLs for Fusarium head blight resistance in spring wheat. I. Resistance to fungal spread (Type II resistance). Theor. Appl. Genet. 2002, 104, 84–91. [Google Scholar] [CrossRef]
  7. Buerstmayr, H.; Steiner, B.; Hartl, L.; Griesser, M.; Angerer, N.; Lengauer, D.; Miedaner, T.; Schneider, B.; Lemmens, M. Molecular mapping of QTLs for Fusarium head blight resistance in spring wheat. II. Resistance to fungal penetration and spread. Theor. Appl. Genet. 2003, 107, 503–508. [Google Scholar] [CrossRef]
  8. Steiner, B.; Buerstmayr, M.; Michel, S.; Schweiger, W.; Lemmens, M.; Buerstmayr, H. Breeding strategies and advances in line selection for Fusarium head blight resistance in wheat. Trop. Plant Pathol. 2017, 42, 165–174. [Google Scholar] [CrossRef] [Green Version]
  9. Cuthbert, P.A.; Somers, D.J.; Thomas, J.; Cloutier, S.; Brulé-Babel, A. Fine mapping Fhb1, a major gene controlling Fusarium head blight resistance in bread wheat (Triticum aestivum L.). Theor. Appl. Genet. 2006, 112, 1465–1702. [Google Scholar] [CrossRef]
  10. Cuthbert, P.A.; Somers, D.J.; Brûlé-Babel, A. Mapping of Fhb2 on chromosome 6BS: A gene controlling Fusarium head blight field resistance in bread wheat (Triticum aestivum L.). Theor. Appl. Genet. 2007, 114, 429–437. [Google Scholar] [CrossRef]
  11. Xue, S.; Li, G.; Jia, H.; Xu, F.; Lin, F.; Tang, M.; Wang, Y.; An, X.; Xu, H.; Zhang, L.; et al. Fine mapping Fhb4, a major QTL conditioning resistance to Fusarium infection in bread wheat (Triticum aestivum L.). Theor. Appl. Genet. 2010, 121, 147–156. [Google Scholar] [CrossRef]
  12. Xue, S.; Xu, F.; Tang, M.; Zhou, Y.; Li, G.; An, X.; Lin, F.; Xu, H.; Jia, H.; Zhang, L.; et al. Precise mapping Fhb5, a major QTL conditioning resistance to Fusarium infection in bread wheat (Triticum aestivum L.). Theor. Appl. Genet. 2011, 123, 1055–1063. [Google Scholar] [CrossRef]
  13. Cainong, J.C.; Bockus, W.W.; Feng, Y.; Chen, P.; Qi, L.; Sehgal, S.K.; Danilova, T.V.; Koo, D.H.; Friebe, B.; Gill, B.S. Chromosome engineering, mapping, and transferring of resistance to Fusarium head blight disease from Elymus tsukushiensis into wheat. Theor. Appl. Genet. 2015, 128, 1019–1027. [Google Scholar] [CrossRef]
  14. Guo, J.; Zhang, X.; Hou, Y.; Cai, J.; Shen, X.; Zhou, T.; Xu, H.; Ohm, H.W.; Wang, H.; Li, A.; et al. High-density mapping of the major FHB resistance gene Fhb7 derived from Thinopyrum ponticum and its pyramiding with Fhb1 by marker-assisted selection. Theor. Appl. Genet. 2015, 128, 2301–2316. [Google Scholar] [CrossRef]
  15. Qi, L.; Pumphrey, M.; Friebe, B.; Chen, P.; Gill, B. Molecular cytogenetic characterization of alien introgressions with gene Fhb3 for resistance to Fusarium head blight disease of wheat. Theor. Appl. Genet. 2008, 117, 1155–1166. [Google Scholar] [CrossRef]
  16. Anderson, J.A.; Stack, R.W.; Liu, S.; Waldron, B.L.; Fjeld, A.D.; Coyne, C.; Moreno-Sevilla, B.; Fetch, J.M.; Song, Q.J.; Cregan, P.B.; et al. DNA markers for Fusarium head blight resistance QTLs in two wheat populations. Theor. Appl. Genet. 2001, 102, 1164–1168. [Google Scholar] [CrossRef]
  17. Bai, G.; Kolb, F.L.; Shaner, G.; Domier, L.L. Amplified fragment length polymorphism markers linked to a major quantitative trait locus controlling scab resistance in wheat. Phytopathology 1999, 89, 343–348. [Google Scholar] [CrossRef] [Green Version]
  18. Lv, C.; Song, Y.; Gao, L.; Yao, Q.; Zhou, R.; Xu, R.; Jia, J. Integration of QTL detection and marker assisted selection for improving resistance to Fusarium head blight and important agronomic traits in wheat. Crop J. 2014, 2, 70–78. [Google Scholar] [CrossRef] [Green Version]
  19. Schweiger, W.; Steiner, B.; Vautrin, S.; Nussbaumer, T.; Siegwart, G.; Zamini, M.; Jungreithmeier, F.; Gratl, V.; Lemmens, M.; Mayer, K.F.; et al. Suppressed recombination and unique candidate genes in the divergent haplotype encoding Fhb1, a major Fusarium head blight resistance locus in wheat. Theor. Appl. Genet. 2016, 129, 1607–1623. [Google Scholar] [CrossRef] [Green Version]
  20. Rawat, N.; Pumphrey, M.O.; Liu, S.; Zhang, X.; Tiwari, V.K.; Ando, K.; Trick, H.N.; Bockus, W.W.; Akhunov, E.; Anderson, J.A.; et al. Wheat fhb1 encodes a chimeric lectin with agglutinin domains and a pore-forming toxin-like domain conferring resistance to Fusarium head blight. Nat. Genet. 2016, 48, 1576–1580. [Google Scholar] [CrossRef]
  21. Li, G.; Zhou, J.; Jia, H.; Gao, Z.; Fan, M.; Luo, Y.; Zhao, P.; Xue, S.; Li, N.; Yuan, Y.; et al. Mutation of a histidine-rich calcium-binding-protein gene in wheat confers resistance to Fusarium head blight. Nat. Genet. 2019, 51, 1106–1112. [Google Scholar] [CrossRef] [PubMed]
  22. Su, Z.; Bernardo, A.; Tian, B.; Chen, H.; Wang, S.; Ma, H.; Cai, S.; Liu, D.; Zhang, D.; Li, T.; et al. A deletion mutation in TaHRC confers Fhb1 resistance to Fusarium head blight in wheat. Nat. Genet. 2019, 51, 1099–1105. [Google Scholar] [CrossRef] [PubMed]
  23. Wang, H.; Sun, S.; Ge, W.; Zhao, L.; Hou, B.; Wang, K.; Lyu, Z.; Chen, L.; Xu, S.; Guo, J.; et al. Horizontal gene transfer of Fhb7 from fungus underlies Fusarium head blight resistance in wheat. Science 2020, 368, eaba5435. [Google Scholar] [CrossRef] [PubMed]
  24. International Wheat Genome Sequencing Consortium (IWGSC). Shifting the limits in wheat research and breeding using a fully annotated reference genome. Science 2018, 361, eaar7191. [Google Scholar] [CrossRef] [PubMed] [Green Version]
  25. Wang, S.; Wong, D.; Forrest, K.; Allen, A.; Chao, S.; Huang, B.E.; Maccaferri, M.; Salvi, S.; Milner, S.G.; Cattivelli, L.; et al. Characterization of polyploid wheat genomic diversity using the high-density 90,000 SNP array. Plant Biotechnol. J. 2014, 12, 787–796. [Google Scholar] [CrossRef] [Green Version]
  26. Zhou, S.; Zhang, J.; Che, Y.; Liu, W.; Lu, Y.; Yang, X.; Li, X.; Jia, J.; Liu, X.; Li, L. Construction of Agropyron Gaertn. genetic linkage maps using a wheat 660K SNP array reveals a homoeologous relationship with the wheat genome. Plant Biotechnol. J. 2018, 16, 818–827. [Google Scholar] [CrossRef] [Green Version]
  27. Allen, A.M.; Winfield, M.O.; Burridge, A.J.; Downie, R.C.; Benbow, H.R.; Barker, G.L.; Wilkinson, P.A.; Coghill, J.; Waterfall, C.; Davassi, A.; et al. Characterization of a wheat breeders array suitable for high-throughput SNP genotyping of global varieties of hexaploid bread wheat (Triticum aestivum). Plant Biotechnol. J. 2017, 15, 390–401. [Google Scholar] [CrossRef] [Green Version]
  28. Liu, J.; He, Z.; Rasheed, A.; Wen, W.; Yan, J.; Zhang, P.; Wan, Y.; Zhang, Y.; Xie, C.; Xia, X. Genome-wide association mapping of black point reaction in common wheat (Triticum aestivum L.). BMC Plant Biol. 2017, 17, 220. [Google Scholar] [CrossRef] [Green Version]
  29. Yang, X.; Pan, Y.; Singh, P.K.; He, X.; Ren, Y.; Zhao, L.; Zhang, N.; Cheng, S.; Chen, F. Investigation and genome-wide association study for Fusarium crown rot resistance in Chinese common wheat. BMC Plant Biol. 2019, 19, 153. [Google Scholar] [CrossRef] [Green Version]
  30. Sun, C.; Zhang, F.; Yan, X.; Zhang, X.; Dong, Z.; Cui, D.; Chen, F. Genome-wide association study for 13 agronomic traits reveals distribution of superior alleles in bread wheat from the Yellow and Huai Valley of China. Plant Biotechnol. J. 2017, 15, 953–969. [Google Scholar] [CrossRef] [Green Version]
  31. Chen, J.; Zhang, F.; Zhao, C.; Lv, G.; Sun, C.; Pan, Y.; Guo, X.; Chen, F. Genome-wide association study of six quality traits reveals the association of the TaRPP13L1 gene with flour colour in Chinese bread wheat. Plant Biotechnol. J. 2019, 17, 2106–2122. [Google Scholar] [CrossRef] [Green Version]
  32. Chen, J.; Hu, X.; Shi, T.; Yin, H.; Sun, D.; Hao, Y.; Xia, X.; Luo, J.; Fernie, A.R.; He, Z.; et al. Metabolite-based genome-wide association study enables dissection of the flavonoid decoration pathway of wheat kernels. Plant Biotechnol. J. 2020, 18, 1722–1735. [Google Scholar] [CrossRef]
  33. Li, T.; Luo, M.; Zhang, D.; Wu, D.; Li, L.; Bai, G. Effective marker alleles associated with type 2 resistance to Fusarium head blight infection in fields. Breed Sci. 2016, 66, 350–357. [Google Scholar] [CrossRef] [Green Version]
  34. Zhang, Y.; Li, A.; Zhu, S.; Li, L.; He, X.; Sun, Z.; Li, T. Basal rachis internode injection: A novel inoculation method to evaluate wheat resistance to Fusarium head blight. Phytopathology 2021, 111, 1670–1674. [Google Scholar] [CrossRef]
  35. Bates, D.; Mächler, M.; Bolker, B.; Walker, S. Fitting linear mixedeffects models using lme4. J. Stat. Software 2015, 67, 1–48. [Google Scholar] [CrossRef]
  36. Purcell, S.; Neale, B.; Todd-Brown, K.; Thomas, L.; Ferreira, M.A.; Bender, D.; Maller, J.; Sklar, P.; de Bakker, P.I.; Daly, M.J.; et al. Plink: A tool set for whole-genome association and population-based linkage analyses. Am. J. Hum. Genet. 2007, 81, 559–575. [Google Scholar] [CrossRef] [Green Version]
  37. Pritchard, J.K.; Stephens, M.; Donnelly, P. Inference of population structure using multilocus genotype data. Genetics 2000, 155, 945–959. [Google Scholar] [CrossRef]
  38. Wang, J.; Zhang, Z. GAPIT Version 3: Boosting power and accuracy for genomic association and prediction. Genom. Proteom. Bioinform. 2021, 19, 629–640. [Google Scholar] [CrossRef]
  39. Li, M.X.; Yeung, J.M.; Cherny, S.S.; Sham, P.C. Evaluating the effective numbers of independent tests and significant p-value thresholds in commercial genotyping arrays and public imputation reference datasets. Hum. Genet. 2012, 131, 747–756. [Google Scholar] [CrossRef] [Green Version]
  40. Barrett, J.C.; Fry, B.; Maller, J.; Daly, M.J. Haploview: Analysis and visualization of LD and haplotype maps. Bioinformatics 2005, 21, 263–265. [Google Scholar] [CrossRef] [Green Version]
  41. Ma, S.; Wang, M.; Wu, J.; Guo, W.; Chen, Y.; Li, G.; Wang, Y.; Shi, W.; Xia, G.; Fu, D.; et al. WheatOmics: A platform combining multiple omics data to accelerate functional genomics studies in wheat. Mol. Plant. 2021, 14, 1965–1968. [Google Scholar] [CrossRef] [PubMed]
  42. Cowger, C.; Smith, J.; Boos, D.; Bradley, C.A.; Ransom, J.; Bergstrom, G.C. Managing a destructive, episodic crop disease: A national survey of wheat and barley growers’ experience with Fusarium head blight. Plant Dis. 2020, 104, 634–648. [Google Scholar] [CrossRef] [PubMed]
  43. Zheng, T.; Hua, C.; Li, L.; Sun, Z.; Yuan, M.; Bai, G.; Humphreys, G.; Li, T. Integration of meta-QTL discovery with omics: Towards a molecular breeding platform for improving wheat resistance to Fusarium head blight. Crop J. 2021, 9, 739–749. [Google Scholar] [CrossRef]
  44. Nannuru, V.K.R.; Windju, S.S.; Belova, T.; Dieseth, J.A.; Alsheikh, M.; Dong, Y.; McCartney, C.A.; Henriques, M.A.; Buerstmayr, H.; Michel, S.; et al. Genetic architecture of Fusarium head blight disease resistance and associated traits in Nordic spring wheat. Theor. Appl. Genet. 2022, 135, 2247–2263. [Google Scholar] [CrossRef]
  45. Carpenter, N.R.; Wright, E.; Malla, S.; Singh, L.; Sanford, D.V.; Clark, A.; Harrison, S.; Murphy, J.P.; Costa, J.; Chao, S.; et al. Identification and validation of Fusarium head blight resistance QTL in the U.S. soft red winter wheat cultivar ‘Jamestown’. Crop Sci. 2020, 60, 2919–2930. [Google Scholar] [CrossRef]
  46. Petersen, S.; Lyerly, J.H.; McKendry, A.L.; Islam, M.S.; BrownGuedira, G.; Cowger, C.; Dong, Y.; Murphy, J.P. Validation of Fusarium head blight resistance QTL in US winter wheat. Crop Science. 2017, 57, 1–12. [Google Scholar] [CrossRef]
  47. Miedaner, T.; Risser, P.; Paillard, S.; Schnurbusch, T.; Keller, B.; Hartl, L.; Holzapfel, J.; Korzun, V.; Ebmeyer, E.; Friedrich Utz, H. Broad-spectrum resistance loci for three quantitatively inherited diseases in two winter wheat populations. Mol. Breed. 2012, 29, 731–742. [Google Scholar] [CrossRef]
  48. Xu, Q.; Xu, F.; Qin, D.; Li, M.; Fedak, G.; Cao, W.; Yang, L.; Dong, J. Molecular mapping of QTLs conferring Fusarium head blight resistance in Chinese wheat cultivar Jingzhou 66. Plants 2020, 9, 1021. [Google Scholar] [CrossRef]
  49. Paillard, S.; Schnurbusch, T.; Tiwari, R.; Messmer, M.; Winzeler, M.; Keller, B.; Schachermayr, G. QTL analysis of resistance to Fusarium head blight in Swiss winter wheat (Triticum aestivum L.). Theor. Appl. Genet. 2004, 109, 323–332. [Google Scholar] [CrossRef]
  50. Yang, J.; Bai, G.; Shaner, G.E. Novel quantitative trait loci (QTL) for Fusarium head blight resistance in wheat cultivar Chokwang. Theor. Appl. Genet. 2005, 111, 1571–1579. [Google Scholar] [CrossRef]
  51. Sari, E.; Berraies, S.; Knox, R.E.; Singh, A.K.; Ruan, Y.; Cuthbert, R.D.; Pozniak, C.J.; Henriquez, M.A.; Kumar, S.; Burt, A.J.; et al. High density genetic mapping of Fusarium head blight resistance QTL in tetraploid wheat. PLoS ONE 2018, 13, e0204362. [Google Scholar] [CrossRef] [Green Version]
  52. Srinivasachary; Gosman, N.; Steed, A.; Faure, S.; Nicholson, P. Mapping of QTL associated with Fusarium head blight in spring wheat RL4137. Czech J. Genet. Plant Breed. 2008, 44, 147–159. [Google Scholar] [CrossRef] [Green Version]
  53. Schmolke, M.; Zimmermann, G.; Buerstmayr, H.; Schweizer, G.; Miedaner, T.; Korzun, V.; Ebmeyer, E.; Hartl, L. Molecular mapping of Fusarium head blight resistance in the winter wheat population Dream/Lynx. Theor. Appl. Genet. 2005, 111, 747–756. [Google Scholar] [CrossRef]
Figure 1. Frequencies of varieties with different infection types for FHB resistance response: (A) Correlation analysis of FHB response across four replications. (B) Frequencies of varieties in infection type classes. Note, FJ1, FJ2, HZ1, and HZ2 represent the first replicate in Fujian, the second replicate in Fujian, the first replicate in Hangzhou, and the second replicate in Hangzhou, respectively. The same below.
Agronomy 13 01712 g001
Figure 2. Manhattan circle plots for Panel I based on the Wheat 660 K SNP array (A) and Panel II based on the Wheat 90 K SNP array (B) across chromosomes. Note: Different letters around outermost ring (like 1A, 1B, 1D etc.) represent wheat chromosomes.
Agronomy 13 01712 g002
Figure 3. Chromosomal locations of significant SNPs associated with five stable FHB resistance loci (gFHB-1B, gFHB-3A.1, gFHB-3A.2, gFHB-3D, and gFHB-5A). (AD) represent the physical position of all significant SNPs detected on chromosomes 1A, 3A, 3D and 5A by GWAS in Panel I and Panel II. Note: The red marker name indicates the marker from the wheat 660K SNP array; The blue marker name indicates the marker from the wheat 90K SNP array. The red locus name indicate the locus detected by panel I; the blue locus names indicate the locus detected by panel II; the pink locus names indicate the locus detected by Panel I and Panel II.
Agronomy 13 01712 g003
Figure 4. Haplotype analysis of significant SNPs in gFHB-1B: (A) LD heatmap of significant SNPs in the region of gFHB-1B in Panel I. (B) Two majority haplotypes in Panel I. (C) Mean infection types for haplotypes in Panel I. (D) LD heatmap of the significant SNPs in the region of gFHB-1B in Panel II. (E) Five major haplotypes of gFHB-1B detected in Panel II. (F) Mean infection types produced by Panel II varieties with different haplotypes. Data are means ± S.E., * p < 0.05, ** p < 0.01, *** p < 0.001.
Agronomy 13 01712 g004
Figure 5. Haplotype analysis of significant SNPs in gFHB-5A l: (A) LD heatmap of SNPs in the region of gFHB-5A in Panel I. (B) Three main haplotypes at gFHB-5A in Panel I. (C) Comparison of mean infection types for different haplotypes in Panel I. (D) LD heatmap of SNPs in the region of gFHB-5A in Panel II. (E) Four majority haplotypes of gFHB-5A in Panel II. (F) Analysis of mean infection types for haplotypes in Panel II. Data are means ± S.E., * p < 0.05, ** p < 0.01, *** p < 0.001.
Agronomy 13 01712 g005
Figure 6. Effects of combining gFHB-1B and gFHB-5A haplotypes. Data are means ± S.E., * p < 0.05, ** p < 0.01, *** p < 0.001, na p > 0.05, compared to gFHB-1B_R+gFHB-5A_R.
Agronomy 13 01712 g006
Figure 7. (A) Percentages of resistance alleles at the gFHB-1B and gFHB-5A QTL in Panel I. (B) Percentages of resistance alleles at the gFHB-1B and gFHB-5A QTL in Panel II varieties released pre-1980, 1980–2000, and 2000–2014.
Agronomy 13 01712 g007
Table 1. Fourteen FHB QTL detected by GWAS.
QTLMarker IntervalPhysical Position (Mb)Physical Distance (Mb)No. of Significant SNPsPVE (%)Average
PVE (%)
PanelsNo. Replications
gFHB-1A.1tplb0025b13_2054~Kukri_c4900_24353.4~46.243265.1~19.39.4I & II5
gFHB-1A.2RAC875_rep_c120644_74~BS00009104_51527.2~534.37.1157.2~15.99.8I & II4
gFHB-1A.3AX-110478077~AX-94942875579.4~591.311.9255.0~17.36.3I & II5
gFHB-1BKukri_c51864_225~AX-109320151582.9~607.925325.9~16.28.6I & II5
gFHB-2BTdurum_contig96648_102~BS00065136_51694.1~704.09.9277.3~18.212.5II4
gFHB-3A.1Tdurum_contig76679_307~IAAV11551.3~14.913.5578.1~19.713.8II4
gFHB-3A.2AX-110433978~AX-109645516539.7~570.831.11005.0~9.78.2I4
gFHB-3BKukri_c64588_274~AX-1104044033.3~14.311126.1~17.811.4I & II5
gFHB-3DExcalibur_c9485_707~Excalibur_c60530_1130.8~9.79217.9~19.714.3Panel II4
gFHB-5AAX-89432740~Ku_c12469_983577.9~596.518.6338.8~13.410.7I & II5
gFHB-5DAX-111388087~BobWhite_c31_2478524.8~565.741135.9~12.99.8I & II7
gFHB-6BBS00003897_51~Kukri_c38732_546132.1~151.119138.8~16.912.1II4
gFHB-7ABobWhite_c17904_259~Tdurum_contig30621_3288.3~68.059.8297.1~16.612.2II4
gFHB-7BAX-109345488~Tdurum_contig10980_1229128.9~199.870.91145.8~10.48.4I & II5
Note: No. represented Number; PVE represented phenotypic variation explained.
Disclaimer/Publisher’s Note: The statements, opinions and data contained in all publications are solely those of the individual author(s) and contributor(s) and not of MDPI and/or the editor(s). MDPI and/or the editor(s) disclaim responsibility for any injury to people or property resulting from any ideas, methods, instructions or products referred to in the content.

