Article

Genome-Wide Association Analysis Reveals the Gene Loci of Yield Traits under Drought Stress at the Rice Reproductive Stage

1
College of Agronomy, Anhui Agricultural University, Hefei 230000, China
2
Institute of Crop Sciences, Chinese Academy of Agricultural Sciences, Beijing 100081, China
3
National Nanfan Research Institute (Sanya), Chinese Academy of Agricultural Sciences, Sanya 572024, China
*
Authors to whom correspondence should be addressed.
These authors contributed equally to this work.
Submission received: 7 July 2023 / Revised: 3 August 2023 / Accepted: 7 August 2023 / Published: 10 August 2023
(This article belongs to the Special Issue Crop Biology and Breeding under Environmental Stress)

Abstract

:
Drought is an important factor limiting the growth and development of rice and thereby seriously affects rice yield. The problem may be effectively solved by dissecting the drought-resistance mechanism of rice, creating excellent drought-resistant germplasm, and mining new drought-resistant genes. In this study, 305 accessions (189 Xian, 104 Geng, 5 Aus, and 7 Basmati) were used to identify drought-related phenotypes such as grain yield per plant (GYP), grain number per panicle (GNP), panicle number per plant (PNP), and plant height (PH) under two-year drought stress. The 2017 GYP and 2018 GNP were Xian max, 2018 GYP, 2017 GNP, 2017 and 2018 PNP, and 2018 PH were Basmati max, and only the 2017 PH was Geng max. The population genetic diversity and population structure were analyzed by combining 404,388 single nucleotide polymorphism (SNP) markers distributed on 12 chromosomes. A total of 42 QTLs with significant correlations was identified, among which 10 were adjacent to the loci reported to be associated with drought resistance. Four candidate genes, LOC_Os03g48890, LOC_Os04g35114, LOC_Os11g45924, and LOC_Os06g38950, were identified by functional annotation and haplotype analysis. The R2 of qGYP3.1 was 11.53%, the R2 of qGNP4.2 was 12.09%, the R2 of qPNP11.1 was 10.01%, and the R2 of qPH6.1 was 13.06%. The results have an important theoretical significance and practical application value for the improvement of drought resistance in rice.

1. Introduction

Rice is an indispensable food for the world which contributes 30–50% of the daily caloric intake of humans [1]. Rice cultivation and yield are affected by a variety of abiotic stresses such as high temperature, salinity stress, and drought, among which drought is one of the main factors causing a decrease in rice yield [2,3]. In recent years, due to climate change, environmental pollution, and the increasing demand for water for various uses, water scarcity is becoming increasingly serious [4]. It is estimated that by 2050, more than half of the global arable land will not be productive as a result of drought [5,6]. Thus, it is urgent to breed rice cultivars that require less water with excellent drought resistance considering the great demand for water in rice production.
The stress resistance of plants refers to a series of responses made by the plants when faced with stresses. These responses are affected by both environmental and genetic factors [7,8]. According to the differences in mechanism, the drought resistance of rice can be divided into drought escape, drought tolerance, drought avoidance, and drought recovery [9]. Different rice varieties have different drought-resistance mechanisms. Generally, when subjected to drought stress, rice makes some responses mainly through one certain mechanism with the complement of a variety of other drought-resistance mechanisms so as to reduce the drought damage as much as possible [10]. The drought-escaping ability of rice refers to its ability to avoid a drought period and choose the period with abundant rainfall and high water content in the soil to complete its life cycle or related life activities [11,12]. The drought tolerance of rice refers to its ability to maintain growth and development when faced with drought stress. One mechanism is to increase the intracellular osmotic pressure and maintain turgor pressure through the accumulation of intracellular solutes. This biochemical process is called osmotic adaptation, which is strongly dependent on the level of drought stress. Under drought stress, rice accumulates proline (PRO) [13,14], soluble sugar (SS), sucrose, and other substances to increase the concentration of cell sap and promote water absorption, thereby enhancing its drought resistance. The other mechanism is to improve the ability of plants to remove harmful substances and improve antioxidant capacity in their body. Antioxidants play a pivotal role as an important reactive oxygen species (ROS) scavenger in plants and can improve the drought resistance of rice. The drought avoidance of rice refers to its ability to maintain water absorption and slow down the loss of water in cells under a water shortage, so as to adapt to the environment. The drought recovery of rice refers to its ability to return to normal development after drought stress.
Genome-wide association studies (GWASs) have been widely used for the discovery of new quantitative trait loci (QTLs) in plants [15,16,17,18]. The drought resistance of rice is controlled by multiple QTLs [19]. With the advance of research on plant physiology, the understanding of complex drought-resistance mechanisms and their relationship with different traits has been greatly improved [20]. The identification of phenotypically associated QTLs and candidate genes with molecular and genomic methods is essential for the development of drought-tolerance gene mining and molecular design breeding [21]. The identified QTLs are mainly targeted for marker-assisted breeding. Drought stress can seriously reduce rice grain weight, grain size, and spikelet fertility and increase sterile grains in the panicle, thereby causing serious yield loss [22,23,24,25]. Many studies have revealed the negative impacts of drought on rice grain yield.
qDTY12.1 is the first reported QTL with a greater impact on grain yield under drought stress. Vikram et al. identified qDTY1.1 in an F3-derived population obtained from the hybridization of drought-tolerant donor N22 with high-yielding super varieties Swarna, IR64, and MTU1010. qDTY1.1 has an important effect on rice yield under drought stress. The R2 in the N22/Swarna, N22/IR64, and N22/MTU1010 populations was 13.4%, 16.9%, and 12.6%, respectively [26,27]. The effect of this locus was likewise mentioned in other populations derived from the cross of CT9993-5-10-1-M/IR62266-42-6-2 and Apo/IR64. Dixit et al. used bulked segregant analysis (BSA) to map QTLs in a BC1F3 population derived from the cross of IR55419-04/2*TDK 1 and detected three QTLs related to grain yield under drought stress, including qDTY3.1, qDTY6.1, and qDTY6.2, among which qDTY3.1 and qDTY6.1 are complementary. Yadav et al. mapped the QTLs using two BC1F3 populations, Swarna*2/Dular and IR11N121*2/Aus196. As a result, a total of six qDTY QTLs was detected in the Swarna*2/Dular population, and the effects of three QTLs were consistent; a total of eight qDTY QTLs was detected in the IR11N121*2/Aus196 population, among which two QTLs had consistent effects, besides four stable, new QTLs (qDTY2.4, qDTY3.3, qDTY6.3, and qDTY11.2) with a PVE of 8.62~14.92% [28].
In this study, 305 accessions from the 3000 Rice Genome Project (3KRGP) were used to explore the performance and correlation of GYP, GNP, PNP, and PH traits under drought conditions. The four yield traits were preliminarily calculated by using the best linear unbiased predictive value (BLUP). In addition, the genetic diversity, population structure, and QTLs were estimated by GWAS analysis, and the most likely candidate genes in QTLs were predicted. Finally, four new candidate genes were identified by functional annotation and haplotype analysis, which provide important genetic resources for rice molecular breeding to improve yield under drought stress.

2. Materials and Methods

2.1. Plant Materials and Field Experiment

A total of 305 accessions (Table S1) was obtained from the 3000 Rice Genome Project (3KRGP) [29], including accessions from Argentina (1), Australia (3), Bangladesh (18), Bhutan (1), Bolivia (1), Brazil (7), Cambodia (2), China (62), Colombia (3), Côte d‘Ivoire (9), Cuba (1). Dominican Republic (1), Ecuador (2), Egypt (2), Gambia (1), Ghana (1), Greece (2), Guatemala (1), Guinea (1), Guinea-Bissau (1), India (40), Indonesia (5), Italy (4), Japan (4), Republic of Korea (3), Laos (15). Madagascar (9), Malaysia (2), Mali (2), Myanmar (6), Nepal (1), Nicaragua (1), Pakistan (2), Peru (2), Philippines (38), Russia (1), Senegal (6), Sri Lanka (6), Thailand (9), Turkey (1), United States (13), Unites States of Ame (1), Venezuela (2), Vietnam (9), and _no_info (2).
The 305 accessions were planted in the experimental station of Nanbin Farm, Sanya, Hainan (18.3° N, 109.3° E), Institute of Crop Science, Chinese Academy of Agricultural Sciences, between December 2016 and May 2017 and from December 2017 to May 2018, respectively. Each accession was planted in two rows with 10 plants per row and 20 × 25 cm spacing between the plants and rows, which was repeated twice. Drought stress occurred at the reproductive growth stage of rice, starting before the rice jointing stage and ending at rice harvest. During this period, no artificial irrigation was carried out. After ripening, the PH and PNP were measured. Five main panicles of each accession were collected and placed in a seed bag to measure the GNP. The remaining plants were harvested, threshed, weighed, and the GYP was calculated.

2.2. Statistical Analysis of Phenotypic Data

The phenotypic data collected under two years of drought stress treatments were statistically analyzed. Excel 2018 (Microsoft, Redmond, WA, USA), SPSS 2022 (IBM, Armonk, NY, USA), and Origin software 2022 (Northampton, MA, USA) were used to calculate the frequency distribution of traits. The correlation determination between yield traits and the drawings of box plots was carried out by using the software package ‘ggplot2‘ in R with the significance level p < 0.01. The best linear unbiased prediction (BLUP) value budget was performed on the phenotypic data of four yield traits within two years and was used for the GWAS.

2.3. Genotyping

The resequencing data of the 305 rice accessions have been published in NCBI and the variant locus information is available through the SNP-Seek database (https://snp-seek.irri.org/index.zul, accessed on 1 May 2023) [30,31]. We further screened the SNPs using PLINK (version 1.9, BGI Cognitive Genomics, Shenzhen, China, accessed on 3 May 2023) [32], MAF (0.05), and GENO (0.2), and obtained 404,388 SNPs with a minor allele frequency (MAF) > 5% and data loss rate (MDR) < 0.2 (Figure S2).

2.4. Population Genetic Analysis

The population structure matrix was constructed as a covariance matrix in a mixed linear model (MLM), and Admixture software [33] was used to analyze the population structure. Relationships were built in Linux using the ‘perl’ command for the subsequent association analysis. Principal component analysis (PCA) was performed using GCTA [34] software (v1.93.2, Yang Lab, Hangzhou, China) to assess the number of subgroups in the GWAS group, and the ‘ggplot’ package was used in R (R Foundation for Statistical Computing, Vienna, Austria) to plot the principal component diagram. PopLDdecay software was used to calculate the average LD decay distance of germplasm resources [35], and the R package ‘ggplot’ was used to plot the fitting curve with the physical distance as the coordinate and the allele frequency correlation square (r2) value as the ordinate to indicate LD decay. The genetic distance matrix was calculated using VCF2Dis (https://github.com/BGI-shenzhen/VCF2Dis, accessed on 20 May 2023). A neighbor-joining (NJ) tree was constructed and beautified using iTOL (https://itol.embl.de/, accessed on 21 May 2023).

2.5. Genome-Wide Association Study

In our study, we obtained 404,388 SNPs (MAF > 0.05) and four sets of phenotypic data. SNPs and phenotypic data were subjected to a GWAS using MLM [36] in TASSEL (version 5.2.40, Maize Genetics, Ithaca, NY, USA) [37] software. R was used to draw a map of Manhattan. We used Significant_P_Value in the GEC (Version 1.0) [38] method as the MLM threshold, and Significant_P_Value is the critical value of significance of the association as tested by the Bonferroni test, p = 2.55 × 10⁻⁷. In addition, a 200 kb distance was chosen as the recognition overlap marker trait-associated signal range [39]. The SNP with the lowest P-value was set as the lead SNP. At the same time, all SNPs within an LD region were treated as a QTL.

2.6. Identification of Candidate Genes and Haplotype Analysis

To identify candidate genes related to GNP, PNP, GYP, and PH, the Rice Genome Annotation Project (http://rice.plantbiology.msu.edu, accessed on 26 April 2023) was utilized to search for candidate genes in the defined QTL. The SNP data of candidate genes were extracted based on the genotypes of SNPs with MAF > 0.05. Haplotype species with a sample size of less than 10 were not counted. To mine candidate genes in the QTLs, we used R to perform the haplotype analysis of nonsynonymous SNPs in the coding region, and a Student’s t-test determined if this locus could cause changes in GNP, PNP, GYP, and PH. The visualization of results was performed using R.

3. Results

3.1. Phenotypic Variations and Correlations

As shown in Table 1, the GYP of the 305 accessions ranged from 2.58 g to 31.52 g, with an average of 15.60 g in 2017, among which the mean GYP of Xian was 17.43 g, which was significantly higher than that of other three subgroups. The GYP of the 305 accessions ranged from 3.32 g to 57.70 g, with an average of 17.81 g in 2018, among which the mean GYP of Geng and Xian was 14.92 g and 19.69 g, respectively. There was no significant difference in the mean GYP between Xian and Geng (Figure 1a,b). For GNP, the average of the 305 accessions was 118.06 in 2017 and 98.90 in 2018. Only in 2018 did the mean GNP show a significant difference between Xian and Geng (Figure 1c,d). The mean PNP of the 305 accessions was 9.85 in 2017 and 9.80 in 2018. The mean PNP was 10.73, 7.96, 10.94, and 13.41 for Xian, Geng, Aus, and Basmati in 2017, respectively, showing significant differences from each other. However, the mean PNP was only significantly different between Xian and Geng in 2018 (Figure 1d,e). The mean PH of the 305 accessions was 89.37 cm in 2017 and 81.07 cm in 2018 and was significantly different between Xian and Geng only in 2017 (Figure 1g,h).
The correlation analysis among different traits revealed that most traits are correlated with each other, particularly GYP, which had a correlation coefficient of +0.645 with GNP and +0.652 with PNP in 2018. In addition, all four traits were positively distributed within the two years (Table S2, Figure 1i,j and Figure S1).

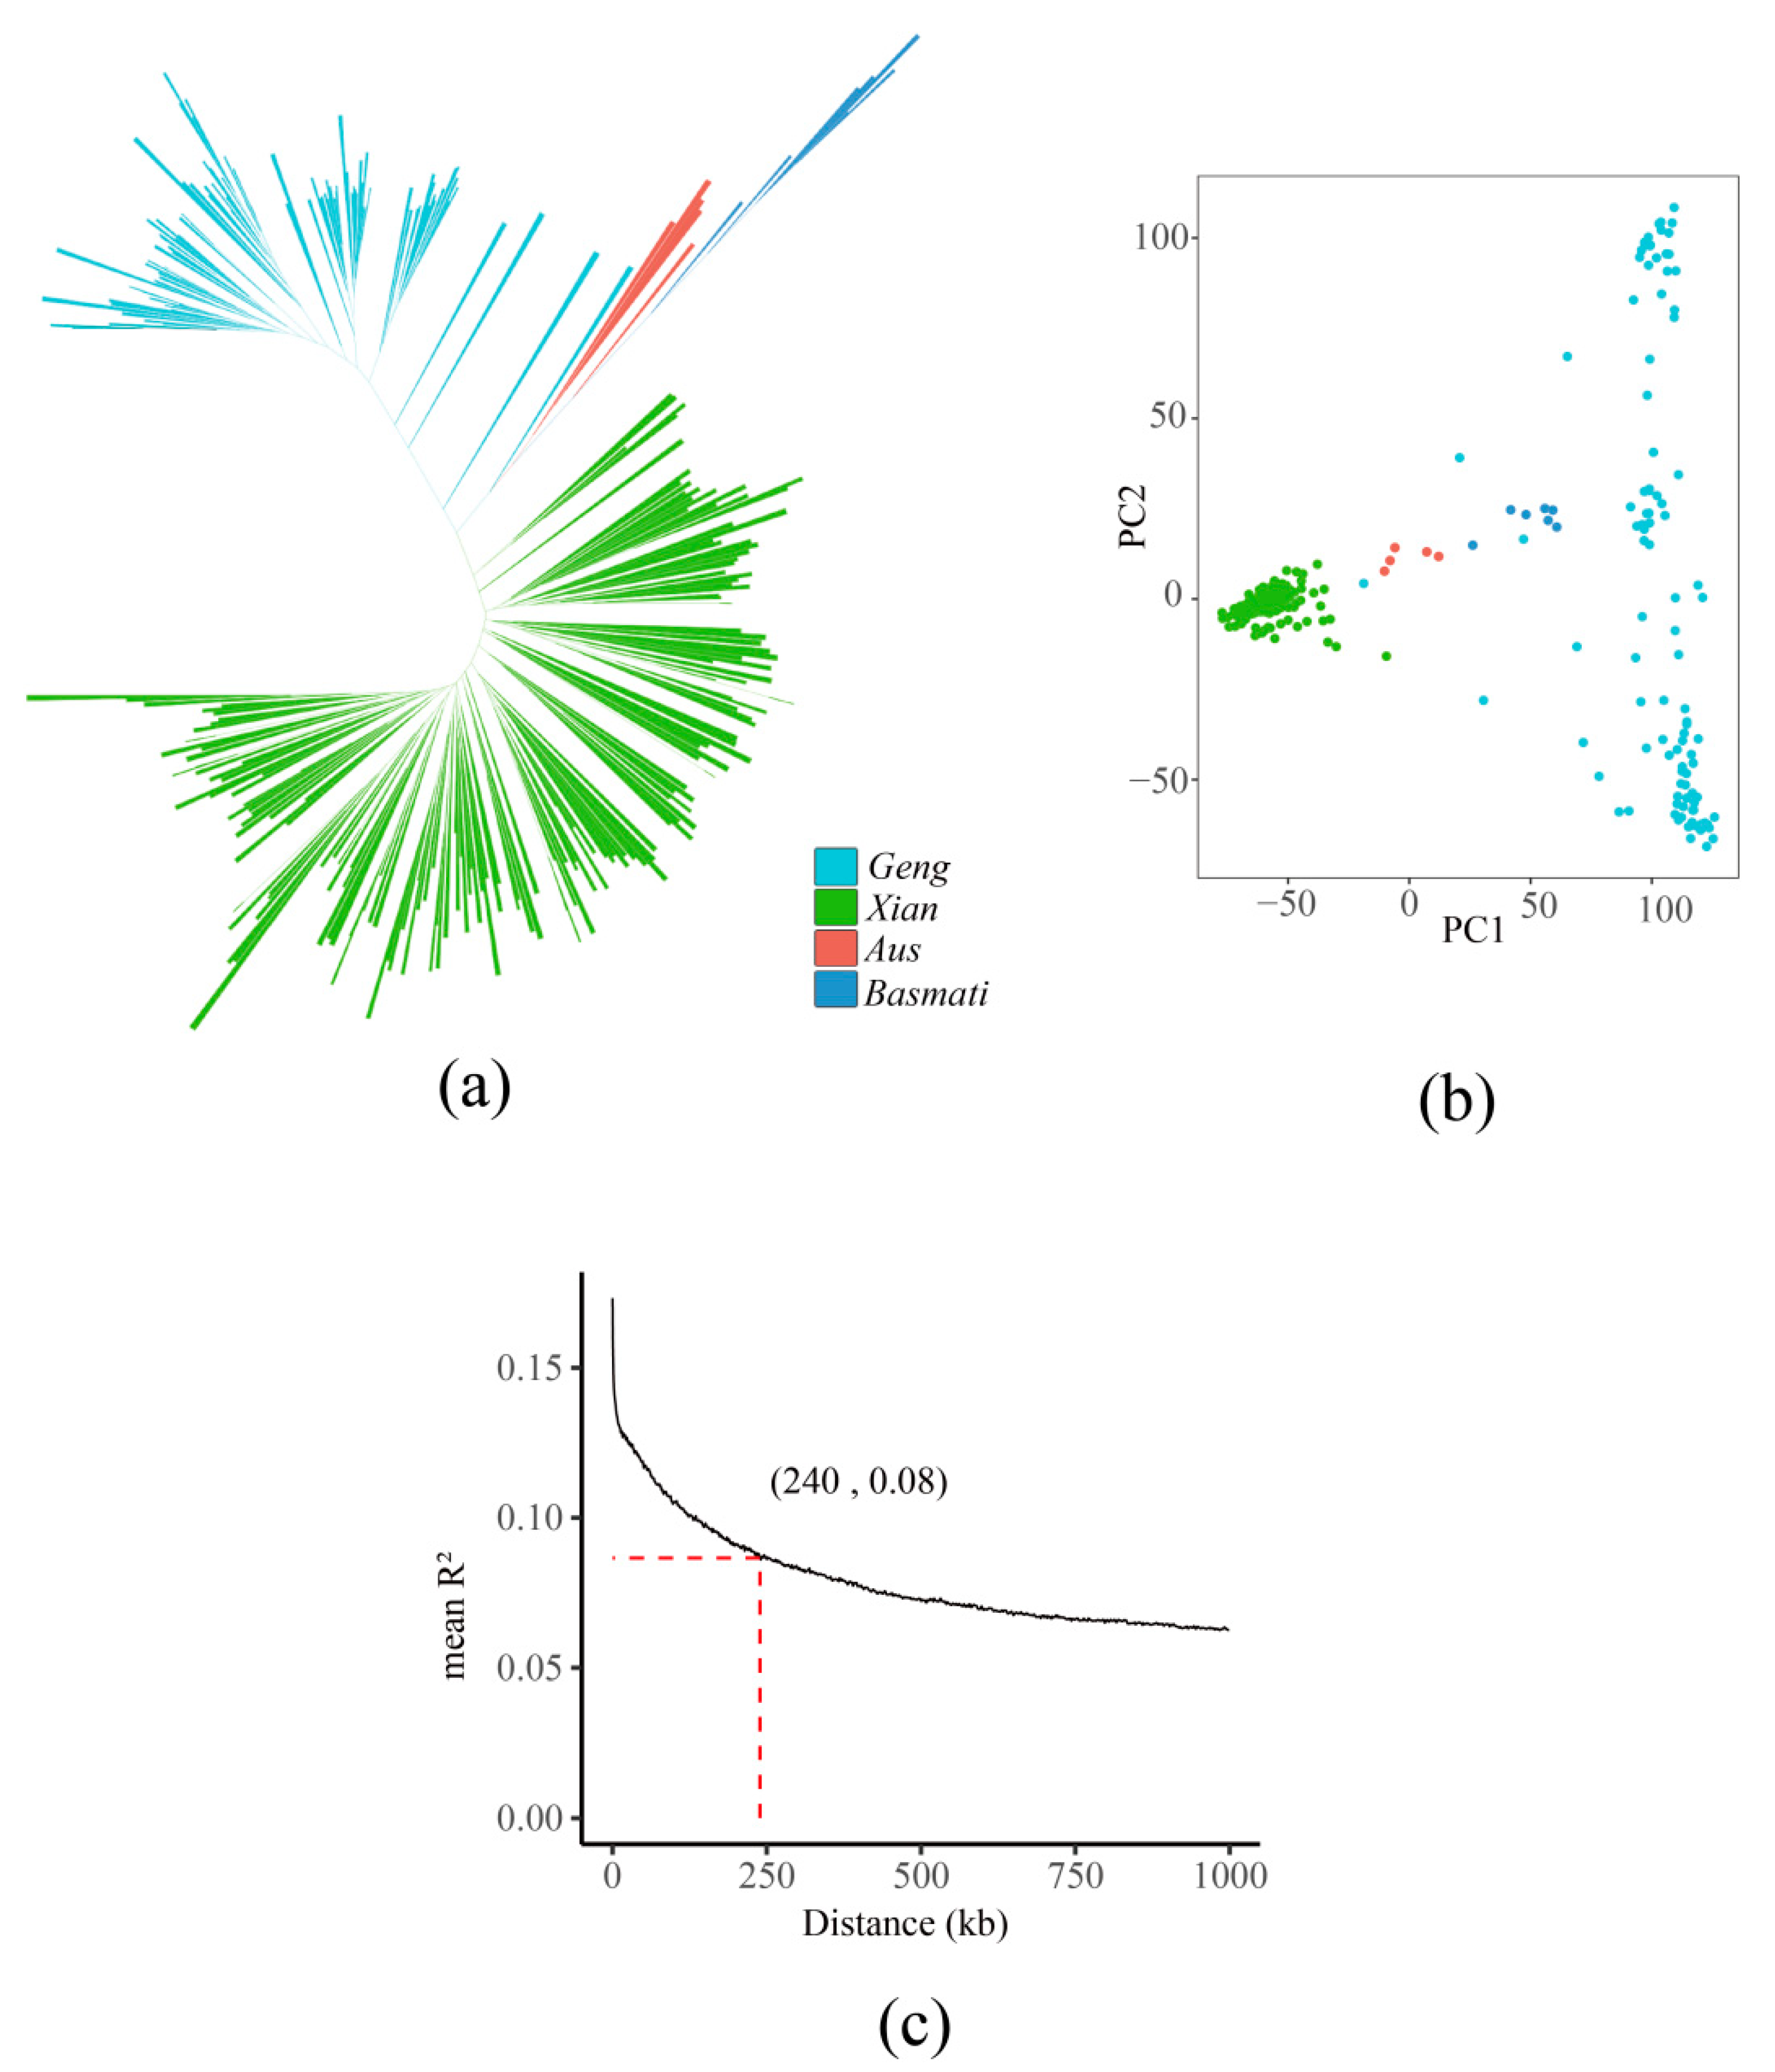
3.2. Phylogenetic and Population Structure Analysis

The genetic structure of the SNPs in the 305 accessions was analyzed by a phylogenetic tree and principal component analysis (PCA). The phylogenetic tree revealed that the 305 accessions fell into four genetic groups (Figure 2a). Similar results were obtained by the PCA, with PC1 and PC2 explaining the genetic variations between most accessions (Figure 1b). For PC1 and PC2, most accessions were also divided into four groups. Thus, the 305 rice accessions were divided into four populations, namely, Xian (189), Geng (104), Aus (5), and Basmati (7) (Table 1 and Table S1). The LD decay distance was the corresponding distance when the squared allele frequency correlation (r2) was reduced to half of the maximum value. Here, when r2 (0.08) reached half of the maximum value, the corresponding LD decay distance was about 240 kb (Figure 2c).

3.3. Genome-Wide Association Study of GYP, GNP, PNP, and PH

To identity the genomic regions associated with the measured phenotypes, a GWAS was carried out for the 305 accessions. In this study, an MLM was used to conduct the GWAS on the four drought tolerance traits (GYP, GNP, PNP, and PH), and we analyzed the data using the BLUP method in order to reduce the impact of the environment in different years. The SNP with the lowest p-value was set as the lead SNP, and combined with the LD decay distance, we defined a range less than 200 kb from the leader SNP as a QTL region. In all the QQ maps of drought tolerance phenotypes (Figure 3), p-values deviated significantly from the expected p-values only in the tail of the upper right corner of the image and showed a more uniform distribution in the rest of positions. Therefore, an MLM model is suitable for mapping phenotypic data under drought treatment. When fixing a threshold of 2.55 × 10⁻⁷ to declare an association, a total of 78 SNPs significantly associated with drought tolerance was identified in the 305 accessions, including 15, 33, 17, and 13 SNPs associated with GYP, GNP, PNP, and PH, respectively. Notably, all 78 significant SNPs were tagged to only 42 QTLs distributed on all 12 chromosomes (Tables S3 and S4). In general, six QTLs were significantly associated with GYP, including qGYP3.1 on chromosome 3, qGYP4.1 and qGYP4.2 on chromosome 4, qGYP9.1 on chromosome 9, qGYP10.1 on chromosome 10, and qGYP12.1 on chromosome 12, which accounted for 11.53%, 11.74%, 11.06%, 10.72%, 9.81%, and 10.74% of the phenotypic variation, respectively. A total of 20 QTLs was significantly correlated with GNP. Of these 20 QTLs, 3 were detected on chromosome 1 and chromosome 4, and 2 were detected on chromosomes 2, 3, 6, and 11, respectively, and the remaining 6 QTLs were detected on each of the remaining six chromosomes. These QTLs explained 9.65–13.19% of the total phenotypic variance. Nine QTLs were significantly correlated with PNP. Among them, two were detected on chromosome 8 and chromosome 11, respectively, and one was found on chromosomes 2, 4, 6, 7, and 9. These QTLs explained 9.23–12.04% of the total phenotypic variance. The seven QTLs associated with PH included qPH1.1 and qPH1.2 on chromosome 1, qPH2.1 on chromosome 2, qPH4.1 on chromosome 4, qPH5.1 and qPH5.2 on chromosome 5, and qPH6.1 chromosome 6, which accounted for 20.49%, 9.88%, 12.47%, 12.02%, 12.00%, 13.50%, and 13.06% of the phenotypic variance, respectively (Table 2).

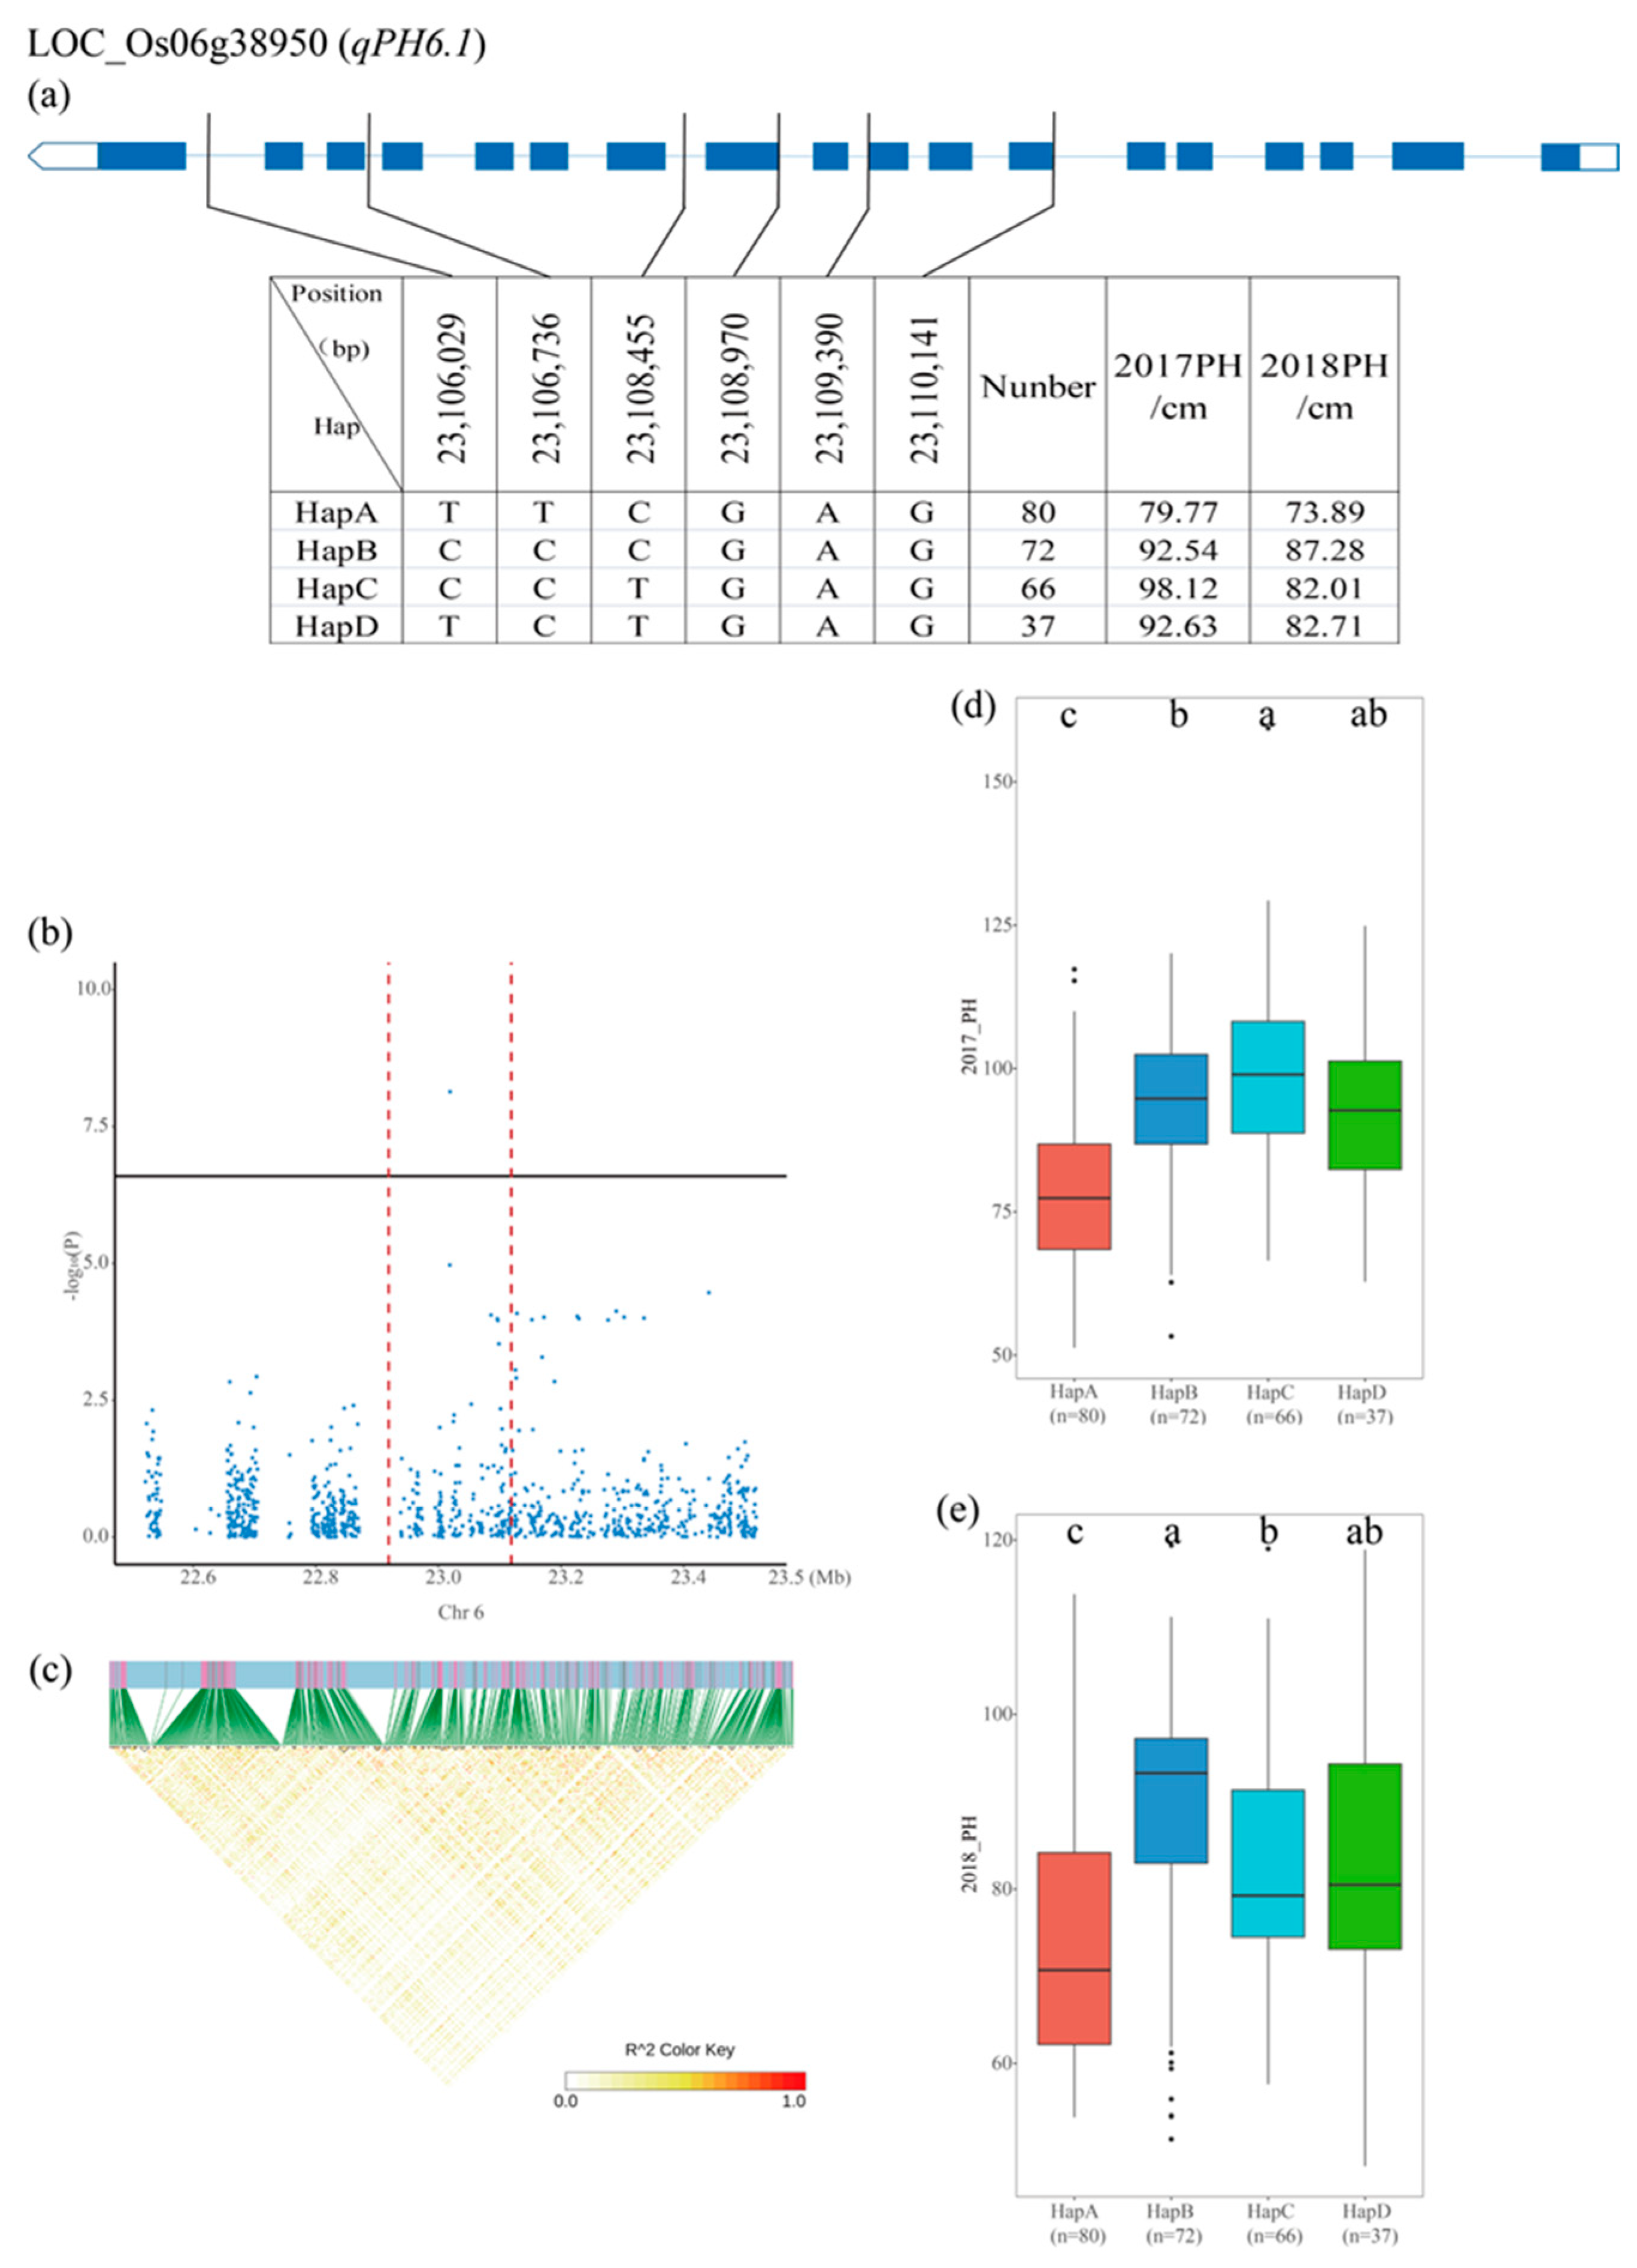
3.4. Candidate Gene Identification and Haplotype Analysis

To identify the candidate genes related to drought tolerance in rice, annotation of the genes was performed within the identified QTLs (100 kb up- and downstream of the most significant SNP of the QTL) based on the Rice Genome Annotation Project. Based on the annotation information, we determined whether the identified QTLs harbored known genes for drought tolerance. qGYP9.1 and qGNP9.1 contained OsbHLH120, which was annotated as a basic helix-loop-helix transcription factor involved in controlling the root width and root length of upland rice [40]. qPNP6.1 harbored OsMIOX, which encodes an myo-inositol oxygenase responsible for the reduction of oxidative damage [48]. qPH1.2 contained Asr2, which encodes an abscisic acid-stress-ripening-inducible protein involved in the clearance process of ROS [49,50].
Next, we predicted the possible candidate genes in the regions of QTLs. The qGYP3.1 QTL was mapped to chromosome 3 in a 200 kb (27.67–27.87 Mb) region with 254 SNPs in 19 genes. LOC_Os03g48890 was annotated as an LRR receptor kinase located 73 kb upstream from the most significant SNP in qGYP4.2 with three major haplotypes. The mean GYP of HapA, HapB, and HapC was 12.86, 17.35, and 16.23 in 2017, and 14.78, 19.85, and 19.37 in 2018, respectively. The haplotype analysis of the 305 accessions showed that the GYP of HapA was significantly lower than that of other haplotypes in the two years (Figure 4).
The qGNP4.2 QTL was mapped to chromosome 4 in a 200 kb (21.25–21.45 Mb) region with 1300 SNPs in 20 genes. LOC_Os04g35114 was annotated as a receptor-like kinase located 9 kb upstream from the most significant SNP in qGNP4.2 with three major haplotypes. The mean GNP of HapA, HapB, and HapC was 118.60, 110.70, and 125.94 in 2017 and 97.99, 88.32, and 105.66 in 2018, respectively. The haplotype analysis of all 305 accessions showed that the GNP of HapB was significantly lower than that of other haplotypes in the two years (Figure 5).
The qPNP11.2 QTL was mapped to chromosome 11 in a 200 kb (27.59–27.79 Mb) region with 622 SNPs in 12 genes. LOC_Os11g45924 was annotated as WRKY41 and located 98 kb downstream from the most significant SNP, which had five major haplotypes. The mean PNP of HapA, HapB, HapC, HapD, and HapE was 9.91, 9.68, 9.09, 11.32, and 7.90 in 2017 and 9.96, 9.66, 8.69, 11.18, and 7.99 in 2018, respectively. The haplotype analysis of all 305 accessions revealed that the PNP of HapD was significantly higher than that of all other haplotypes except for HapA in the two years. The PNP of HapA was significantly different from that of HapE in 2017 and from that of HapC in 2018 (Figure 6).
Subsequently, we focused on qPH6.1 mapped to a 22.91–23.11 Mb region on chromosome 6 with 215 SNPs of 12 genes for the association analysis. LOC_Os06g38950 was a possible candidate gene for PH in this candidate region. This gene encodes an ABC transporter and is located 94 kb from downstream the most significant SNP in qPH6.1, which had four major haplotypes. The mean PH of HapA, HapB, HapC, and HapD was 79.77, 92.54, 98.12, and 92.63 in 2017 and 73.89, 87.28, 82.01, and 82.71 in 2018, respectively. The haplotype analysis of the 305 accessions showed that the PH of HapA was significantly lower than that of other haplotypes in the two years. In addition, the PHs of HapB and HapC were significantly different from each other in the two years (Figure 7).

4. Discussion

Rice at the reproductive growth stage is particularly sensitive to drought stress, as evidenced by changes in plant morphology, physiological indicators, and ultimately yield. The drought-resistant genes in rice are regulated in complex and diverse ways [51]. Rice drought-resistance genes mainly include functional protein genes and regulatory protein genes. The coding products of functional protein genes play a direct protective role in rice drought resistance, and regulatory protein genes play an indirect protective role by participating in the signal transduction of endogenous hormones and the regulation of downstream gene expression.
Functional protein genes mainly include three categories, namely, genes encoding amino acids and betaine choline compounds, key genes for aquaporin (AQP) synthesis, and enzymes with detoxification functions. Sun et al. found that DROT1 encodes a COBRA family protein and regulates cell wall structure by increasing cellulose content, thereby improving drought resistance, and is directly inhibited by ERF3 and activated by ERF71 [52]. AQPs promote the transcellular movement of water, which can rapidly and reversibly change the permeability of water. Under drought stress, the key genes of AQP synthesis can maintain cell osmotic pressure and reduce the damage caused by stress by promoting water transmembrane transport and regulating cell water balance and cell fluid expansion. Chen et al. found a new E3 ligase, OsRINGzf1. On the one hand, this gene can mediate the degradation of AQPs in rice; on the other hand, it can ubiquitinate OsPIP2:1 to mediate its degradation to enhance the water-retention capacity of rice [53]. Enzymes with detoxification functions, such as superoxide dismutase, catalase, and peroxidase, can scavenge intracellular ROS and protect cells from oxidative stress. Li et al. identified OsSPL10 as a transcription factor regulating drought tolerance in rice. OsSPL10 resists drought by affecting the production of ROS and stomatal movement [54].
A gene encoding a regulatory protein initiates or inhibits the expression of genes in downstream pathways and resists stress through signal transduction. As a widely distributed gene family, receptor-like protein kinases (RLKs) are involved in plant growth, hormone response, signal transduction, and drought and other abiotic stress responses. Yang et al. cloned a drought-related gene OsBDG1 in rice, which belongs to the RLK family. The gene encodes a protein containing a leucine repeat sequence and a transmembrane structure at the N-terminus, which can be induced by osmotic stress and peroxide stress. The gene is located on the cell membrane and has a close genetic relationship with OsSIK1, LP2, and other proteins. MADS-box transcription factors aid plant adaptation processes to abiotic stresses. Li et al. found that the overexpression of MADS-box transcription factor OsMADS23 can significantly improve the drought tolerance of rice. In addition, OsMADS23 has been shown to be effective in generating ABA and proline by activating the transcription of target genes and interacting with and phosphorylating snrk2-type protein kinase SAPK9, thereby improving its stability and transcriptional activity [55]. NAC (NAM, ATAF, and CUC) transcription factors constitute a large family of more than 150 members in rice, several of which have been shown to play an important role in rice abiotic stress responses [56]. The MYB transcription factor family refers to a class of transcription factors containing the MYB domain, which exists in all eukaryotes. OsMYBR57 interacts with the homologous domain transcription factor OsHB22, which also plays an active role in drought signal transduction [57]. Gao et al. found that miR2105 and OsSAPK10 kinase jointly regulate OsbZIP86-mediated drought-induced ABA biosynthesis in rice. Under drought conditions, the ABA content of transgenic rice plants with a low expression of miR2105 or overexpression of OsbZIP86 is higher than that of wild-type rice, and the transgenic plants showed enhanced drought resistance, reduced water-loss rate, and a higher degree of stomatal closure in seedlings [58].
In this study, four candidate genes related to drought resistance were identified in the candidate regions of significant SNP markers. Among them, LOC_Os03g48890 in the qGYP3.1 region was annotated as an LRR receptor kinase. LRR receptor kinase is a kind of transmembrane receptor kinase in plants, playing an important role in plant growth, hormone signal transduction, and biotic and stress effects. The extracellular tandem arrangement of the LRR motif of the LRR receptor kinase provides an important condition for its acceptance of extracellular signals and plays a role in the signaling pathways of phytohormones such as brassinosteroids and abscisic acid (ABA) [59]. The stress hormone ABA plays a role in crops under drought stress [60,61]. LOC_Os04g35114 in the qGNP4.2 region was annotated as a receptor-like kinase. In previous studies, receptor-like kinases were found to play important roles in regulating vegetative growth, resistance against pathogens, reproduction, production of seeds and fruits, and the prevention of premature fruit drop [62,63]. In particular, receptor-like kinases play an important role in optimizing the response of plants to drought stress [64,65]. LOC_Os11g45924 in the qPNP11.2 region was annotated as WRKY41, which is a member of the WRKY gene family. The WRKY family members play an important role in regulating plant abiotic stress response or tolerance [66,67]. Previous studies have verified that GhWRKY41 is induced by various environmental stresses, and the overexpression of GhWRKY41 in tobacco leaves can enhance their tolerance to drought and salt. LOC_Os06g38950 in the qPH6.1 region was annotated as an ABC transporter and an ATP-binding protein. ABC transporter is one of the largest protein families in plants and is essential for plant development. ABC transporter plays a role in saving plants when plants are subjected to various abiotic stresses, especially drought stress [68]. Therefore, we speculate that LOC_Os06g38950 may play an important role in a drought environment.
In summary, we detected 15, 33, 17, and 13 SNPs associated with GYP, GNP, PNP, and PH, respectively. All genes in the QTL region were functionally annotated, and the candidate genes related to drought resistance were further screened by haplotype block structure analysis. As expected, through functional annotation and haplotype analysis, we effectively narrowed down candidate gene selection for target traits within a large LD region. Therefore, our research has laid a good foundation for subsequent gene function verification and molecular design breeding.

5. Conclusions

This study investigated the different yield traits of 305 accessions under drought stress and conducted genome-wide association analysis. The 42 detected QTLs contained 11 known drought-resistance genes, and four candidate genes were predicted by haplotype analysis (LOC_Os03g48890, LOC_Os04g35114, LOC_Os06g38950, and LOC_Os11g45924). Our study has unearthed the candidate genes associated with drought tolerance in rice, laying the foundation for subsequent molecular design breeding.

Supplementary Materials

The following supporting information can be downloaded at https://0-www-mdpi-com.brum.beds.ac.uk/article/10.3390/agronomy13082096/s1, Figure S1: Histogram of the phenotypic frequency distribution of yield traits in the 305 rice accessions; Table S1: Information of the 305 rice accessions; Figure S2: Distribution of single nucleotide polymorphisms (SNPs) and nucleotide diversity across the rice Nipponbare genome in the rice association panel; Table S2: Statistics of GYP, GNP, PNP, and PH in different rice populations; Table S3: Significant SNPs above the threshold line in the MLM; Table S4: List of significant QTL genes associated with yield traits under drought conditions.

Author Contributions

W.Z., Z.G., N.W. and Z.Z. conducted the experiments and collected the data; N.W., W.Z., Y.Q., D.B., X.W., J.L., X.Z. and Y.S. collated and statistically analyzed the data; N.W., Y.B. and Y.Q. constructed the graphics; N.W. and Y.S. wrote the paper; Y.S. and W.W. designed the experiment, provided intellectual guidance, and reviewed the paper. All authors have read and agreed to the published version of the manuscript.

Funding

This research was funded by the Scientific Research Plan Major Projects of Anhui Province (grant number 2022AH040126), the Nanfan Special Project, CAAS (YBXM04, YBXM2322, and YYLH2309), the Hainan Yazhou Bay Seed Lab Project (B23CJ0208), the Scientific Innovation 2030 Project (C.W, 2022ZD0401703), the Science and Technology Major Project of Anhui Province (grant number 2021d06050002), the Improved Varieties Joint Research (Rice) Project of Anhui Province (the 14th five-year plan), and the National Natural Science Foundation of China [grant numbers U21A20214, 31971927].

Institutional Review Board Statement

Not applicable.

Informed Consent Statement

Not applicable.

Data Availability Statement

Not applicable.

Conflicts of Interest

The authors declare no conflict of interest.

References

  1. Sun, X.; Xiong, H.; Jiang, C.; Zhang, D.; Yang, Z.; Huang, Y.; Zhu, W.; Ma, S.; Duan, J.; Wang, X.; et al. Natural variation of DROT1 confers drought adaptation in upland rice. Nat. Commun. 2022, 13, 4265. [Google Scholar] [CrossRef] [PubMed]
  2. Sheng-Chang, W.; Hai-Fu, T.U.; Dan, H.U.; Nai, W.U.; Xiang, C.; Li-Zhong, X. The exploitation of rice functional genes for abiotic stress. Chin. Bull. Life Sci. 2016, 28, 10. [Google Scholar]
  3. Teng, Z.; Chen, Y.; Meng, S.; Duan, M.; Zhang, J.; Ye, N. Environmental Stimuli: A Major Challenge during Grain Filling in Cereals. Int. J. Mol. Sci. 2023, 24, 2255. [Google Scholar] [CrossRef]
  4. Deng, X.; Singh, R.B.; Liu, J.; Güneralp, B. Physical and economic processes of water scarcity and water allocation for integrat-ed river basin management. Phys. Chem. Earth Parts A/B/C 2015, 79–82, 1. [Google Scholar]
  5. Wang, W.; Vinocur, B.; Altman, A. Plant responses to drought, salinity and extreme temperatures: Towards genetic engineering for stress tolerance. Planta 2003, 218, 1–14. [Google Scholar] [CrossRef]
  6. Swamy, B.M.; Kumar, A. Genomics-based precision breeding approaches to improve drought tolerance in rice. Biotechnol. Adv. 2013, 31, 1308–1318. [Google Scholar] [CrossRef] [PubMed]
  7. Levitt, J. Responses of Plants to Environmental Stress, Volume 1: Chilling, Freezing, and High Temperature Stresses, 2nd ed.; Academic Press: Cambridge, MA, USA, 1980; Volume 38, p. 5. [Google Scholar]
  8. Costa, M.-C.D.; Farrant, J.M. Plant Resistance to Abiotic Stresses. Plants 2019, 8, 553. [Google Scholar] [CrossRef] [Green Version]
  9. Liu, Y.-W.; Tian, H.-G.; Li, C.-G.; Chen, F.-Y.; Sun, Y.-X. Study on Drought Resistance of Rice. North Rice 2015, 45, 2. [Google Scholar]
  10. Yi, Y.; Wang, S.; Cheng, X.; Zhu, Q.; Li, Y.; Wang, F.; Zhang, M. Advances in Research on Drought Resistance in Rice. Agric. Biotechnol. 2022, 11, 26–33. [Google Scholar]
  11. Xu, M.; Jiang, X.; Zhou, G.; Chen, L. Relation between Rice (Oryza sativa L.) Drought resistance and Its Ability to Resist Water escaping, Proline and Sugar. Lifeence Res. 1998, 2, 113–117. [Google Scholar]
  12. Panda, D.; Mishra, S.S.; Behera, P.K. Drought Tolerance in Rice: Focus on Recent Mechanisms and Approaches. Rice Sci. 2021, 28, 119–132. [Google Scholar] [CrossRef]
  13. Mall, S.A.K. Biochemical Assimilates Accumulation and Remobilization at Reproduction Stage Drought Stress in Upland Rice (Oryza sativa L.). Environ. Ecol. 2017, 35, 2811–2818. [Google Scholar]
  14. Mohanty, S.K.; Sridhar, R. Physiology of rice tungro virus disease: Proline accumulation due to infection. Physiol. Plant. 1982, 56, 89–93. [Google Scholar] [CrossRef]
  15. Uga, Y.; Okuno, K.; Yano, M. Dro1, a major QTL involved in deep rooting of rice under upland field conditions. J. Exp. Bot. 2011, 62, 2485–2494. [Google Scholar] [CrossRef] [PubMed] [Green Version]
  16. Monir, M.M.; Jun, Z. Tools for quantitative trait locus mapping and genome-wide association study mapping: A review. J. Zhejiang Univ. Agric. Life Sci. 2014, 40, 379–386. [Google Scholar]
  17. Martin, N. Genetics of Cognitive Measures and Correlated Traits; School of Psychology, The University of Queensland: St Lucia, QLD, Australia, 2012. [Google Scholar]
  18. Kumari, M.; Muduli, L.; Meher, P.K.; Pradhan, S.K. Genome-Wide Association Study (GWAS) for Trait Analysis in Crops; Springer: New York, NY, USA, 2022; pp. 295–307. [Google Scholar] [CrossRef]
  19. Liu, Q.; Tang, Y.; Xiao, R.; Zhang, X.; Li, J. Progress on Molecular Research of Drought Resistance in Rice. Mol. Plant Breed. 2019, 17, 2841–2849. [Google Scholar]
  20. Bao-Feng, C.; Hong-Jian, L.I.; Meng-Ben, W.; Li-Min, L. Advance of Biomolecular Studies on Plant Drought Resistance Mecha-nisms. J. Shanxi Univ. (Nat. Sci. Ed.) 1999, 2, 400–405. [Google Scholar]
  21. Bernardo, R. Molecular Markers and Selection for Complex Traits in Plants: Learning from the Last 20 Years. Crop Sci. 2008, 48, 1649–1664. [Google Scholar] [CrossRef] [Green Version]
  22. Maisura; Chozin, M.A.; Lubis, I.; Junaedi, A.; Ehara, H. Some physiological character responses of rice under drought condi-tions in a paddy system. J. Int. Soc. Southeast Asian Agric. Sci. 2014, 20, 104–114. [Google Scholar]
  23. Luo, L.H.; Liu, G.H.; Xiao, Y.H.; Tang, W.B.; Chen, L.Y. Influences of High-Temperature Stress on the Fertility of Pollen, Spikelet and Grain-Weight in Rice. J. Hunan Agric. Univ. 2005, 31, 593. [Google Scholar]
  24. Pan, X.; Li, Y.; Zhang, H.; Liu, S.; Deng, H.; Li, X. Screening and Comparative Analysis of Drought Tolerance of Rice Varieties at the Reproductive Stage. Crop Sci. 2016, 57, 395–403. [Google Scholar] [CrossRef]
  25. Vivekanandan, P.Y. Association analysis in F1 and F2 generations of rice under reproductive stage drought stress. Electron. J. Plant Breed. 2010, 1, 890–898. [Google Scholar]
  26. Venuprasad, R.; Bool, M.E.; Quiatchon, L.; Cruz, M.T.S.; Amante, M.; Atlin, G.N. A large-effect QTL for rice grain yield under upland drought stress on chromosome 1. Mol. Breed. 2011, 30, 535–547. [Google Scholar] [CrossRef]
  27. Vikram, P.; Swamy, B.M.; Dixit, S.; Ahmed, H.U.; Cruz, M.T.S.; Singh, A.K.; Kumar, A. qDTY 1.1, a major QTL for rice grain yield under reproductive-stage drought stress with a consistent effect in multiple elite genetic backgrounds. BMC Genet. 2011, 12, 89. [Google Scholar] [CrossRef] [Green Version]
  28. Yadav, S.; Sandhu, N.; Singh, V.K.; Catolos, M.; Kumar, A. Genotyping-by-sequencing based QTL mapping for rice grain yield under reproductive stage drought stress tolerance. Sci. Rep. 2019, 9, 14326. [Google Scholar] [CrossRef] [Green Version]
  29. Yano, K.; Yamamoto, E.; Aya, K.; Takeuchi, H.; Lo, P.-C.; Hu, L.; Yamasaki, M.; Yoshida, S.; Kitano, H.; Hirano, K.; et al. Genome-wide association study using whole-genome sequencing rapidly identifies new genes influencing agronomic traits in rice. Nat. Genet. 2016, 48, 927–934. [Google Scholar] [CrossRef]
  30. Mansueto, L. SNP-Seek Database; International Rice Research Institute: Laguna, Philippines, 2015. [Google Scholar]
  31. Lin, Y.-L.; Wu, D.-H.; Wu, C.-C.; Huang, Y.-F. Explore the genetics of weedy traits using rice 3K database. Bot. Stud. 2021, 62, 2. [Google Scholar] [CrossRef]
  32. Qi, Y.; Wang, S.; Shen, C.; Zhang, S.; Chen, Y.; Xu, Y.; Liu, Y.; Wu, Y.; Jiang, D. OsARF12, a transcription activator on auxin response gene, regulates root elongation and affects iron accumulation in rice (Oryza sativa). New Phytol. 2011, 193, 109–120. [Google Scholar] [CrossRef]
  33. Alexander, D.H.; Novembre, J.; Lange, K. Fast model-based estimation of ancestry in unrelated individuals. Genome Res. 2009, 19, 1655–1664. [Google Scholar] [CrossRef] [Green Version]
  34. Bengough, A.G.; White, P.J. Preface. J. Exp. Bot. 2013, 64, 1179. [Google Scholar] [CrossRef] [Green Version]
  35. Zhang, C.; Dong, S.-S.; Xu, J.-Y.; He, W.-M.; Yang, T.-L. PopLDdecay: A fast and effective tool for linkage disequilibrium decay analysis based on variant call format files. Bioinformatics 2019, 35, 1786–1788. [Google Scholar] [CrossRef]
  36. Pantalião, G.F.; Narciso, M.; Guimarães, C.; Castro, A.; Colombari, J.M.; Breseghello, F.; Rodrigues, L.; Vianello, R.P.; Borba, T.O.; Brondani, C. Genome wide association study (GWAS) for grain yield in rice cultivated under water deficit. Genetica 2016, 144, 651–664. [Google Scholar] [CrossRef]
  37. Bradbury, P.J.; Zhang, Z.; Kroon, D.E.; Casstevens, T.M.; Ramdoss, Y.; Buckler, E.S. TASSEL: Software for association mapping of complex traits in diverse samples. Bioinformatics 2007, 23, 2633–2635. [Google Scholar] [CrossRef] [PubMed] [Green Version]
  38. Li, M.-X.; Yeung, J.M.Y.; Cherny, S.S.; Sham, P.C. Evaluating the effective numbers of independent tests and significant p-value thresholds in commercial genotyping arrays and public imputation reference datasets. Hum. Genet. 2011, 131, 747–756. [Google Scholar] [CrossRef] [Green Version]
  39. Wang, N.; Chen, H.; Qian, Y.; Liang, Z.; Zheng, G.; Xiang, J.; Feng, T.; Li, M.; Zeng, W.; Bao, Y.; et al. Genome-Wide Association Study of Rice Grain Shape and Chalkiness in a Worldwide Collection of Xian Accessions. Plants 2023, 12, 419. [Google Scholar] [CrossRef] [PubMed]
  40. Li, J.; Han, Y.; Liu, L.; Chen, Y.; Du, Y.; Zhang, J.; Sun, H.; Zhao, Q. qRT9, a quantitative trait locus controlling root thickness and root length in upland rice. J. Exp. Bot. 2015, 66, 2723–2732. [Google Scholar] [CrossRef] [Green Version]
  41. Yin, X.; Huang, L.; Wang, M.; Cui, Y.; Xia, X. OsDSR-1, a calmodulin-like gene, improves drought tolerance through scavenging of reactive oxygen species in rice (Oryza sativa L.). Mol. Breed. 2017, 37, 75. [Google Scholar] [CrossRef]
  42. Gao, W.; Li, M.; Yang, S.; Gao, C.; Su, Y.; Zeng, X.; Jiao, Z.; Xu, W.; Zhang, M.; Xia, K. miR2105 and the kinase OsSAPK10 co-regulate OsbZIP86 to mediate drought-induced ABA biosynthesis in rice. Plant Physiol. 2022, 189, 889–905. [Google Scholar] [CrossRef] [PubMed]
  43. Dong, N.Q.; Sun, Y.; Guo, T.; Shi, C.L.; Lin, H.X. UDP-glucosyltransferase regulates grain size and abiotic stress tolerance associated with metabolic flux redirection in rice. Nat. Commun. 2020, 11, 2629. [Google Scholar] [CrossRef]
  44. Huang, L.; Wang, Y.; Wang, W.; Zhao, X.; Qin, Q.; Sun, F.; Hu, F.; Zhao, Y.; Li, Z.; Fu, B.; et al. Characterization of Transcription Factor Gene OsDRAP1 Conferring Drought Tolerance in Rice. Front. Plant Sci. 2018, 9, 94. [Google Scholar] [CrossRef] [Green Version]
  45. Ji, Q.; Zhang, L.S.; Wang, Y.F.; Wang, J. Genome-wide analysis of basic leucine zipper transcription factor families in Arabidopsis thaliana, Oryza sativa and Populus trichocarpa. J. Shanghai Univ. 2009, 13, 174–182. [Google Scholar] [CrossRef]
  46. Ni, E.; Deng, L.; Chen, H.; Lin, J.; Ruan, J.; Liu, Z.; Zhuang, C.; Zhou, H. OsCER1 regulates humidity-sensitive genic male sterility through very-long-chain (VLC) alkane metabolism of tryphine in rice. Funct. Plant Biol. 2021, 48, 461. [Google Scholar] [CrossRef] [PubMed]
  47. Wang, S.; Han, S.; Zhou, X.; Zhao, C.; Guo, L.; Zhang, J.; Liu, F.; Huo, Q.; Zhao, W.; Guo, Z.; et al. Phosphorylation and ubiquitination of OsWRKY31 are integral to OsMKK10-2-mediated defense responses in rice. Plant Cell 2023, 35, 2391–2412. [Google Scholar] [CrossRef]
  48. Shi, F.; Dong, Y.; Wang, M.; Qiu, D. Transcriptomics analyses reveal that OsMIOX improves rice drought tolerance by regulating the expression of plant hormone and sugar related genes. Plant Biotechnol. Rep. 2020, 14, 339–349. [Google Scholar] [CrossRef]
  49. Arenhart, R.A.; De Lima, J.C.; Pedron, M.; Carvalho, F.E.L.; Da Silveira, J.A.G.; Rosa, S.B.; Caverzan, A.; Andrade, C.M.B.; Schünemann, M.; Margis, R.; et al. Involvement of ASR genes in aluminium tolerance mechanisms in rice. Plant Cell Environ. 2012, 36, 52–67. [Google Scholar] [CrossRef] [PubMed]
  50. Rossi, M.; Carrari, F.; Cabrera-Ponce, J.L.; Vázquez-Rovere, C.; Herrera-Estrella, L.; Gudesblat, G.; Iusem, N.D. Analysis of an abscisic acid (ABA)-responsive gene promoter belonging to the Asr gene family from tomato in homologous and heterologous systems. Mol. Gen. Genet. MGG 1998, 258, 1–8. [Google Scholar] [CrossRef]
  51. Kumar, A.; Thomas, J.; Basu, S.; Ramegowda, H.V.; Pereira, A. Genome-Wide Association Study for Water Use Efficiency and Drought Resistance Traits in Rice. In Proceedings of the Plants & Animal Genome XXV Conference, San Diego, CA, USA, 14–18 January 2017. [Google Scholar]
  52. Xiang, J.; Zhang, C.; Wang, N.; Liang, Z.; Zheng, Z.; Liang, L.; Yuan, H.; Shi, Y. Genome-Wide Association Study Reveals Candidate Genes for Root-Related Traits in Rice. Curr. Issues Mol. Biol. 2022, 44, 4386–4405. [Google Scholar] [CrossRef]
  53. Byrt, C.S.; Millar, A.H.; Munns, R. Staple crops equipped for alkaline soils. Nat. Biotechnol. 2023, 41, 911–912. [Google Scholar] [CrossRef]
  54. Li, Y.; Han, S.; Sun, X.; Khan, N.U.; Zhong, Q.; Zhang, Z.; Zhang, H.; Ming, F.; Li, Z.; Li, J. Variations in OsSPL10 confer drought tolerance by directly regulating OsNAC2 expression and ROS production in rice. J. Integr. Plant Biol. 2023, 65, 918–933. [Google Scholar] [CrossRef]
  55. Zhang, M.; Zhao, R.; Huang, K.; Wei, Z.; Guo, B.; Huang, S.; Li, Z.; Jiang, W.; Wu, T.; Du, X. OsWRKY76 positively regulates drought stress via OsbHLH148-mediated jasmonate signaling in rice. Front. Plant Sci. 2023, 14, 1168723. [Google Scholar] [CrossRef]
  56. Ooka, H.; Satoh, K.; Doi, K.; Nagata, T.; Otomo, Y.; Murakami, K.; Matsubara, K.; Osato, N.; Kawai, J.; Carninci, P.; et al. Comprehensive Analysis of NAC Family Genes in Oryza sativa and Arabidopsis thaliana. DNA Res. 2003, 10, 239–247. [Google Scholar] [CrossRef]
  57. Chen, Y.; Qi, H.; Yang, L.; Xu, L.; Wang, J.; Guo, J.; Zhang, L.; Tan, Y.; Pan, R.; Shu, Q.; et al. The OsbHLH002/OsICE1-OSH1 module orchestrates secondary cell wall formation in rice. Cell Rep. 2023, 42, 112702. [Google Scholar] [CrossRef]
  58. Zhang, C.; Li, M.; Rey, J.D.; Feng, T.; Lafitte, R.; Zheng, T.; Lv, Y.; Wu, F.; Fu, B.; Xu, J.; et al. Simultaneous improvement and genetic dissection of drought and submergence tolerances in rice (Oryza sativa L.) by selective introgression. Front. Plant Sci. 2023, 14, 1134450. [Google Scholar] [CrossRef]
  59. Man, J.; Gallagher, J.P.; Bartlett, M. Structural evolution drives diversification of the large LRR-RLK gene family. New Phytol. 2020, 226, 1492–1505. [Google Scholar] [CrossRef] [Green Version]
  60. Sreeman, S.M.; Vijayaraghavareddy, P.; Sreevathsa, R.; Rajendrareddy, S.; Arakesh, S.; Bharti, P.; Dharmappa, P.; Soolanayakanahally, R. Corrigendum: Introgression of Physiological Traits for a Comprehensive Improvement of Drought Adaptation in Crop Plants. Front. Chem. 2018, 6, 92. [Google Scholar] [CrossRef] [PubMed] [Green Version]
  61. Liu, X.; Gao, T.; Liu, C.; Mao, K.; Gong, X.; Li, C.; Ma, F. Fruit crops combating drought: Physiological responses and regulatory pathways. Plant Physiol. 2023, 192, 1768–1784. [Google Scholar] [CrossRef] [PubMed]
  62. Tax, F. Receptor-like Kinases in Plants: From Development to Defense; Springer: Berlin/Heidelberg, Germany, 2012. [Google Scholar]
  63. Nodine, M.D.; Bryan, A.C.; Racolta, A.; Jerosky, K.V.; Tax, F.E. A few standing for many: Embryo receptor-like kinases. Trends Plant Sci. 2011, 16, 211–217. [Google Scholar] [CrossRef]
  64. Chen, X.; Ding, Y.; Yang, Y.; Song, C.; Wang, B.; Yang, S.; Guo, Y.; Gong, Z. Protein kinases in plant responses to drought, salt, and cold stress. J. Integr. Plant Biol. 2021, 63, 53–78. [Google Scholar] [CrossRef] [PubMed]
  65. Marshall, A.; Aalen, R.B.; Audenaert, D.; Beeckman, T.; Broadley, M.R.; Butenko, M.A.; Caño-Delgado, A.I.; de Vries, S.; Dresselhaus, T.; Felix, G.; et al. Tackling Drought Stress: Receptor-like Kinases Present New Approaches. Plant Cell 2012, 24, 2262–2278. [Google Scholar] [CrossRef] [PubMed]
  66. Huang, Z.; Song, L.; Xiao, Y.; Zhong, X.; Wang, J.; Xu, W.; Jiang, C.-Z. Overexpression of Myrothamnus flabellifolia MfWRKY41 confers drought and salinity tolerance by enhancing root system and antioxidation ability in Arabidopsis. Front. Plant Sci. 2022, 13, 967352. [Google Scholar] [CrossRef]
  67. Chu, X.; Wang, C.; Chen, X.; Lu, W.; Li, H.; Wang, X.; Hao, L.; Guo, X. Correction: The Cotton WRKY Gene GhWRKY41 Positively Regulates Salt and Drought Stress Tolerance in Transgenic Nicotiana benthamiana. PLoS ONE 2016, 11, e0157026. [Google Scholar] [CrossRef]
  68. Do, T.H.T.; Martinoia, E.; Lee, Y. Functions of ABC transporters in plant growth and development. Curr. Opin. Plant Biol. 2018, 41, 32–38. [Google Scholar] [CrossRef] [PubMed]
Figure 1. Box plots of four rice drought-tolerance traits under stress and phenotypic correlations of the four traits in different environments: (a) 2017 grain yield per plant; (b) 2018 grain yield per plant; (c) 2017 grain number per panicle; (d) 2018 grain number per panicle; (e) 2017 panicle number per plant; (f) 2018 panicle number per plant; (g) 2017 plant height; (h) 2018 plant height (different letters above the boxplots indicate significant differences according to a Duncan’s multiple range post hoc test (p < 0.05)); (i) 2017 drought stress; and (j) 2018 drought stress. * and *** refer to significant correlations (p < 0.05 and p < 0.001).
Agronomy 13 02096 g001
Figure 2. Genetic structure analysis of the 305 accessions: (a) a phylogenetic tree with each branch representing a rice accession; (b) the principal component analysis on the 404,411 SNPs of the 305 accessions clearly distinguished Geng, Xian, Aus, and Basmati accessions (PC1 and PC2 refer to the first and second principal components, respectively; different scatters clustered together indicate less genetic differentiation); and (c) the LD decay analysis of the whole genome in the 305 accessions.
Agronomy 13 02096 g002
Figure 3. Genome-wide association plots of GYP, GNP, PNP, and PH in the 305 accessions plotted using the mixed linear model. Values of −log10(p) for the physical locations of the 12 chromosomes were revealed on Manhattan plots by genome-wide scanning. The red dashed line represents the significance threshold for genome-wide association analysis p = 2.55 × 10⁻⁷. Red arrows indicate QTLs (qGYP3.1(Chr3_27772039), qGNP4.2(Chr4_21350438), qPNP11.2(Chr11_27691415), and qPH6.1(Chr6_23018981)) detected by the MLM. The horizontal axis in the quantile–quantile (QQ) plot represents the expected value of the −log10 transformation, whereas the vertical axis represents the observed value of the −log10 transformation. (ad) Manhattan plots and QQ plots of GYP (a), GNP (b), PNP (c), and PH (d) in the MLM, respectively.
Agronomy 13 02096 g003aAgronomy 13 02096 g003b
Figure 4. Identification of candidate genes for GYP (Grain yield per plant). (a) Based on three SNPs in all evaluated rice accessions, three haplotypes of LOC_Os03g48890 were identified. The structure of this gene is mapped using blue boxes for exons and blue lines for introns and gene intervals. The genome information of the marked SNPs is indicated in the black line link table. Haplotype species with a sample size of less than 10 were not counted. (b) GYP based on single polymorphism and (c) the LD thermal map of the local Manhattan map, around the peak on chromosome 3. The red dashed line indicates the physical location of the QTL where the candidate gene is present. (d,e) Based on the GYP of the LOC_Os03g48890 haplotype under the drought conditions of 2017 and 2018. Differences between haplotypes were statistically analyzed using a Tukey’s test.
Agronomy 13 02096 g004
Figure 5. Identification of candidate genes for GNP (Grain number per panicle). (a) Based on seven SNPs in all evaluated rice accessions, three haplotypes of LOC_Os04g35114 were identified. The structure of this gene is mapped using blue boxes for exons and blue lines for introns and gene intervals. The genome information of the marked SNPs is indicated in the black line link table. Haplotype species with a sample size of less than 10 were not counted. (b) GNP based on single polymorphism and (c) the LD thermal map of the local Manhattan map, around the peak on chromosome 4. The red dashed line indicates the physical location of the QTL where the candidate gene is present. (d,e) Based on the GNP of the LOC_Os04g35114 haplotype under the drought conditions of 2017 and 2018. Differences between haplotypes were statistically analyzed using a Tukey’s test.
Agronomy 13 02096 g005
Figure 6. Identification of candidate genes for PNP (Panicle number per plant). (a) Based on 14 SNPs in all evaluated rice accessions, five haplotypes of LOC_Os11g45924 were identified. The structure of this gene is mapped using blue boxes for exons and blue lines for introns and gene intervals. The genome information of the marked SNPs is indicated in the black line link table. Haplotype species with a sample size of less than 10 were not counted. (b) PNP based on single polymorphism and (c) the LD thermal map of the local Manhattan map, around the peak on chromosome 11. The red dashed line indicates the physical location of the QTL where the candidate gene is present. (d,e) Based on the PNP of the LOC_Os11g45924 haplotype under the drought conditions of 2017 and 2018. Differences between haplotypes were statistically analyzed using a Tukey’s test.
Agronomy 13 02096 g006
Figure 7. Identification of candidate genes for PH (Plant height). (a) Based on six SNPs in all evaluated rice accessions, four haplotypes of LOC_Os06g38950 were identified. The structure of this gene is mapped using blue boxes for exons and blue lines for introns and gene intervals. The genome information of the marked SNPs is indicated in the black line link table. Haplotype species with a sample size of less than 10 were not counted. (b) PH based on single polymorphism and (c) the LD thermal map of the local Manhattan map, around the peak on chromosome 6. The red dashed line indicates the physical location of the QTL where the candidate gene is present. (d,e) Based on the PH of the LOC_Os06g38950 haplotype under the drought conditions of 2017 and 2018. Differences between haplotypes were statistically analyzed using a Tukey’s test.
Agronomy 13 02096 g007
Table 1. Statistics of GYP, GNP, PNP, and PH in the 305 accessions.
TraitYearMean ± SDMax.Mim.CV (%)H2 (%)
GYP (g)201715.60 ± 6.1231.522.5839.20%87.83%
201817.81 ± 8.8357.703.3249.55%
GNP2017118.06 ± 36.17258.2046.4030.64%86.58%
201898.90 ± 35.55243.2017.3035.95%
PNP20179.85 ± 3.0120.103.0030.57%91.52%
20189.80 ± 2.6821.803.8027.38%
PH (cm)201789.37 ± 16.53159.3551.3018.49%95.41%
201881.07 ± 15.64119.4048.2019.29%
Table 2. Forty-two regions with significant signals related to GYP, GNP, PNP, and PH in the genome-wide association study of the 305 accessions.
TraitQTLChrLead SNP (bp)p-ValueR2(%)Known Genes/QTLs
GYPqGYP3.1327,772,0391.18 × 10−711.53%
qGYP4.141,152,9138.14 × 10−911.74%
qGYP4.2417,125,7431.32 × 10−711.06%
qGYP9.1917,087,5681.55 × 10−710.72%OsbHLH120 [40]
qGYP10.1105,284,6831.35 × 10−79.81%OsDSR-1 [41]
qGYP12.1127,352,7661.54 × 10−710.74%OsbZIP86 [42]
GNPqGNP1.1116,207,0181.0885 × 10−711.32%
qGNP1.2122,754,3001.2248 × 10−79.84%
qGNP1.3133,438,4266.4749 × 10−811.54%
qGNP2.127,820,8321.9861 × 10−710.82%
qGNP2.2226,903,8131.1258 × 10−711.86%
qGNP3.1322,285,4911.2046 × 10−79.65%
qGNP3.2331,270,5362.0749 × 10−710.65%GSA1 [43]
qGNP4.1417,330,0901.1495 × 10−711.30%
qGNP4.2421,350,4384.6361 × 10−812.09%
qGNP4.3427,685,8241.5817 × 10−711.00%
qGNP5.1516,722,2839.5616 × 10−811.19%
qGNP6.1612,945,3731.1852 × 10−79.72%
qGNP6.2626,015,8983.1678 × 10−813.06%
qGNP7.1714,661,7237.5111 × 10−811.76%
qGNP8.1819,621,7311.1988 × 10−79.68%OsERF48 [44]
qGNP9.1917,087,5686.4013 × 10−913.19%OsbHLH120 [40]
qGNP10.1107,535,5781.571 × 10−711.65%
qGNP11.1112,559,1691.0094 × 10−710.71%OsZIP-2a [45]
qGNP11.2117,024,4232.2725 × 10−812.24%
qGNP12.1124,422,9191.211 × 10−79.88%
PNPqPNP2.1224,673,2191.71 × 10−811.24%OsGL1-4 [46]
qPNP4.1426,468,7352.42 × 10−79.23%OsRDCP1 [47]
qPNP6.1621,507,1748.22 × 10−812.72%OsMIOX [48]
qPNP7.1720,370,3951.17 × 10−812.93%
qPNP8.186,254,6651.83 × 10−811.13%
qPNP8.2818,098,6061.58 × 10−711.79%
qPNP9.196,714,4681.58 × 10−817.73%
qPNP11.11124,881,4808.02 × 10−810.01%
qPNP11.21127,691,4151.79 × 10−712.04%
PHqPH1.1138,561,9742.04E-1320.49%
qPH1.2142,302,9612.33 × 10−79.88%Asr2 [49]
qPH2.1217,805,1112.12 × 10−812.47%
qPH4.1412,049,7042.29 × 10−812.02%
qPH5.157,670,1821.84 × 10−812.00%
qPH5.2522,224,1782.12 × 10−813.50%
qPH6.1623,018,9817.29 × 10−913.06%
Disclaimer/Publisher’s Note: The statements, opinions and data contained in all publications are solely those of the individual author(s) and contributor(s) and not of MDPI and/or the editor(s). MDPI and/or the editor(s) disclaim responsibility for any injury to people or property resulting from any ideas, methods, instructions or products referred to in the content.

