Article

The Combined Analysis of the Transcriptome and Metabolome Revealed the Possible Mechanism of Flower Bud Formation in Amorphophallus bulbifer

Faculty of Life Science and Technology, Kunming University of Science and Technology, Kunming 650500, China
*
Author to whom correspondence should be addressed.
Submission received: 13 January 2024 / Revised: 1 March 2024 / Accepted: 1 March 2024 / Published: 2 March 2024

Abstract

:
The flowering of Amorphophallus bulbifer (A. bulbifer) plays an important role in its reproduction. The flowers and leaves of A. bulbifer cannot grow at the same time. However, the physiological and molecular mechanisms involved in flower bud and leaf bud formation are still unclear. In this study, the flower buds and leaf buds of A. bulbifer in the early stage of growth were used as research materials, transcriptome and metabolome analyses were carried out, and the soluble sugar and starch contents of A. bulbifer corms were determined. Transcriptome analysis revealed 5542 differentially expressed genes (DEGs) between flower buds and leaf buds, 3107 of which were upregulated and 2435 of which were downregulated. Enrichment analysis of the KEGG pathway showed that these differential genes were enriched mainly in the plant hormone signal transduction, DNA replication and fatty acid elongation pathways. A total of 5296 significant differentially abundant metabolites were screened out by nontargeted metabolomics analysis. The differentially abundant metabolites were functionally classified in the HMDB, and 118 were successfully matched, including 17 that were highly expressed in flower buds. The differentially abundant metabolites in the flower buds were mainly enriched in pathways such as amino acid metabolism, isoquinoline alkaloid biosynthesis and pyrimidine metabolism. Targeted metabolomics analysis revealed that the contents of ABA, ZT and iPA in flower buds were significantly greater than those in leaf buds, while the opposite trend was observed for IAA. The analysis of soluble sugar and starch contents showed that the starch and soluble sugar contents in flower buds were significantly greater than those in leaf buds. The results of this study showed that flower bud development in A. bulbifer was regulated by amino acids, starch, ABA, ZT, iPA, IAA and other hormones. These findings could lead to valuable genetic resources for further study of A. bulbifer flowering and provide a deeper understanding of the molecular basis of A. bulbifer flowering.

1. Introduction

Amorphophallus bulbifer (A. bulbifer) is a perennial herb of the Araceae family, with more than 170 species widely distributed in tropical and subtropical regions [1]. Xitai 9 is a type of A. bulbifer with high expansion coefficient and strong disease resistance, and is widely planted in the southwestern region of China. Konjac glucomannan (KGM), a processed good quality powder is abundant in A. bulbifer, constituting up to 75% of components in this plant [2]. KGM has good biocompatibility and is nontoxic and harmless and can be used in food, medicine and biological fields. In medicine, KGM can transform the skin environment from UVR-induced acute aging and damaged cell state to normal cell state by promoting cell growth. The hydrolysate GMH of KGM can prolong lifespan by regulating intestinal proliferation homeostasis [3,4]. With the increase in understanding of KGM and its derivatives, the benefits of KGM in humans have been gradually elucidated, and KGM has therefore received extensive attention from researchers [5,6]. A. bulbifer is resistant to soft rot, has multiple leaf relay growth habits and has a high yield. This plant variety is vigorously promoted in the konjac planting industry, and the seed demand is high. To date, the tissue culture technology of A. bulbifer is still in its infancy, so the planting materials of konjac have always been based on A. bulbifer corms, bulbils and seeds, and the asexual reproduction coefficient of tubers is low, which not only consumes a large amount of seed taro, but also usually leads to soft rot, white silk disease and other diseases [7]. The yield of bulbils is not high, and the reproduction coefficient is also low. Thus, it has been difficult to popularize these methods in a large area in a short time. Seed reproduction is currently the most effective planting method [8]. This method takes approximately 3 years for naturally planted A. bulbifer to blossom. To harvest a large number of A. bulbifer seeds, it is necessary to understand the physiological differences between flower bud differentiation and leaf bud differentiation to provide a scientific basis for agricultural measures to promote the flowering of A. bulbifer to obtain additional A. bulbifer seeds. However, the flowers and leaves of A. bulbifer grow at different stages, and the physiological and biochemical characteristics of flower buds and leaf bud differentiation are unclear.
Plants are extremely sensitive to changes in environmental factors during their growth, especially during the process of flowering. Temperature, light and nutrient elements play important roles in flower bud differentiation [9,10,11]. The effect of temperature on plants is manifested mainly by low temperature and high temperature. Flower bud differentiation in some plants requires low-temperature stimulation. The early differentiation of Fragaria ananassa Duch flower buds requires low temperature (17 °C) and short-day (10 h) conditions [12]. Dimocarpus longan and Litchi chinensis (L. chinensis) need a period of low-temperature treatment before flower bud differentiation [13]. Light can affect plant photoregulatory receptors (phytochromes, cryptochromes, and UV receptors) and thus regulate plant flowering [14,15,16]. The illumination time can also affect the flowering time of plants. Various long-day and short-day plants bloom during the right season due to sunshine [17,18]. Previous studies have found that suppressor of overexpression of constans 1 (SOC1) is a transcription factor encoding MADS-box, integrating multiple flowering signals from photoperiod-, temperature-, hormone-, and aging-related signals. SOC1 is regulated by two antagonistic flowering regulators, constans (CO) and flowering locus C (FLC), which act as flower activators and inhibitors, respectively. CO is a biological clock regulatory gene that encodes a transcription factor required for flowering. CO can convert light signals and biological clock signals into flowering signals, activate the expression of downstream genes (FT) and thus induce plant flowering [19,20].
Carbohydrates provide energy and carbon structural elements for plant growth and act as signaling molecules to promote plant development in many developmental processes [21]. Like deciduous tree species, evergreen fruit trees accumulate starch in the ovary during flower bud differentiation in spring during flower bud dormancy [22]. The quality of Lilium brownii var. cut flowers depends on the quality of the bulbs. During the process of vernalization and flower bud differentiation, the accumulation of a large amount of sugar in bulbs affects bulb development [23]. The growth of A. bulbifer is sensitive to light and temperature. When the temperature increases to more than 20 °C, A. bulbifer begin to germinate and grow, while a temperature greater than 35 °C affects A. bulbifer growth; flower buds differentiate under appropriate conditions, and the flowering period lasts only approximately 48 h [24].
Plant endogenous hormones transmit exogenous or endogenous signals to plants by establishing a complex signal network, thereby regulating plant growth and development. During the flowering and fruiting stages of normal and abnormal Castanea mollissima, it was found that the changes in endogenous hormones may correspond to different flowering and fruiting mechanisms [25]. Plant flower bud differentiation is the basis of plant reproductive process. The yield and quality of plant fruit are closely related to hormones. In Glycyrrhiza uralensis Fisch, it is speculated that high contents of indole acetic acid (IAA) and zeatin riboside (ZR) are beneficial to flower bud differentiation and seed filling, while low contents of abscisic acid (ABA) and ZR are beneficial to flower bud development and seed filling. In Prunus avium, the application of gibberellin 3 (GA3) can induce parthenogenetic fruit and increase fruit setting rate, but it will affect the endogenous hormones and quality in fruit. Transcriptome analysis of the spontaneous early ripening of a navel orange mutant and wild type revealed that a large number of differentially expressed genes (PP2C, SnRK, JAZ, ARF, PG and PE) were involved in plant hormone signal transduction and starch and sucrose metabolism, indicating the importance of these metabolic pathways in fruit ripening [26,27,28,29]. The transition from vegetative growth to reproductive growth is a major stage change in plants. Endogenous hormone levels play an important regulatory role in the process of plant flower bud differentiation [30]. ABA promotes flowering by inhibiting gibberellin biosynthesis, and indolepropionic acid (IPA) also delays flower senescence [31,32]. In Populus L., leaf morphology can be regulated by increasing the expression of IAA synthesis-related genes [33]. Treatment of Amorphophallus konjac (A. konjac) with the hormone IAA can promote leaf bud differentiation [34]. However, the regulatory effect of hormones on the development of flower buds in A. bulbifer has not been determined.
The continuous iterative update of transcriptomics and metabolomics techniques have gradually led to their application to nonmodel plants [35,36]. By analyzing and identifying the transcriptome data of A. bulbifer, differentially expressed genes were found and identified; thus, the genetic diversity and germplasm characteristics of A. bulbifer should be continuously explored, which will play an important role in the development of molecular biology research on A. bulbifer. Studying the differences in metabolites during different periods and at different stages in A. bulbifer can not only reveal the metabolic differences in A. bulbifer during the growth period of flower buds and leaf buds, but also provide insight for the combined analysis of the metabolic group and transcriptome data to determine the differences in the development of flower buds and leaf buds in A. bulbifer plants from molecular and physiological perspectives. This study provides a reference for shortening the flowering period of A. bulbifer and improving the seed yield of A. bulbifer.
In this study, the differences were explored by measuring the contents of starch and soluble sugar in the corms of flower buds and leaf buds as well as the contents of endogenous hormones and metabolites in flower buds and leaf buds. Through the combined analysis of transcriptome and metabolome data from flower buds and leaf buds of A. bulbifer and the study of metabolite differences and differential genes between flower buds and leaf buds at the early growth stage, the molecular mechanism of flower bud formation in A. bulbifer was further explored to improve the understanding of the effects of flower bud and leaf bud differentiation on A. bulbifer and the differences in differential genes and metabolites. These results may provide feasible measures for the breeding of A. bulbifer.

2. Materials and Methods

2.1. Plant Material Cultivation

Amorphophallus bulbifer ‘Xitai No. 9’ samples were obtained from the Yuanjiang A. bulbifer Planting Base in Yunnan. On 15 April 2021, A. bulbifer corms were planted in the greenhouse of the Faculty of Life Science and Technology of Kunming University of Science and Technology. The flower buds and leaf buds could be roughly distinguished on 4 June 2021, and the apical buds and the corms were removed, after which their characteristics were observed. Then, 6 flower buds and 6 leaf buds were selected for metabolome analysis, in which 3 flower buds and 3 leaf buds were chosen for transcriptome analysis. Approximately 0.1 g of the flower buds and leaf buds of A. bulbifer were taken, respectively, and frozen in liquid nitrogen and subsequently stored at −80 °C for subsequent transcriptome sequencing and metabolomic analyses. Three biological replicates were used for transcriptome sequencing, and six biological replicates were used for metabolome analysis. A. bulbifer corm slices were taken, dried at 60 °C and crushed for determination of the soluble sugar and starch contents of the A. bulbifer plants; these analyses were conducted with three biological replicates.

2.2. Transcriptome Analysis

2.2.1. RNA Extraction from Flower Buds and Leaf Buds of A. bulbifer

The total RNA of A. bulbifer flower buds and leaf buds was extracted with a polysaccharide polyphenol plant total RNA extraction kit of TIANGEN (RNAprep Pure Plant Plus Kit Catalog No: DP441). The purity and concentration of RNA were detected by a NanoDrop 2000 spectrophotometer (Thermo Fisher Scientific, Waltham, MA, USA), and the integrity of the RNA was detected by an Agilent 2100 spectrophotometer (Agilent, Santa Clara, CA, USA). Three biological replicates were used for each sample. When the RNA sample to be tested meets the requirements of transcriptome sequencing, the RNA sample is then used for library construction. Next-generation sequencing (NGS) was used to perform paired-end (PE) sequencing on these libraries via the Illumina HiSeq (Illumina NovaSeq 6000) sequencing platform.

2.2.2. Transcriptome Sequencing Analysis

The raw data of FATAQ were obtained by transforming the image file obtained by sequencing the sample on the computer. The original data were filtered by Cutadapt (1.16) to remove the sequence of the 3′ end band connector and remove the reads with an average mass fraction lower than Q20 to obtain clean reads. The clean reads were spliced with Trinity software (2.5.1) to obtain transcripts. The Trinity software is based on the DBG (De Bruijn Graph) splicing principle to splice high-quality sequences. After splicing, the transcript sequence file in FASTA format was obtained, and the longest transcript under each gene was extracted as the representative sequence Unigene of the gene. Finally, GO, KEGG, eggNOG, SwissProt and Pfam annotations and ORF prediction were performed on unigenes. Using the transcriptome expression quantitative software RSEM (1.2.15), the clean reads of each sample were aligned to the reference sequence with the transcript sequence as a reference. Then, the number of reads on each gene was counted for each sample, and the FPKM value of each gene was calculated. DESeq was used to analyze the difference of gene expression, and the condition of screening differentially expressed genes was the expression difference multiplied by |log2Fold Change| > 1, significant p-value < 0.05. After screening the differential genes, GO enrichment analysis was performed using topGO. The GO enrichment analysis results of the differentially expressed genes were classified according to the molecular function (MF), biological process (BP) and cell component (CC). KEGG pathway annotation was performed on differentially expressed genes using KOBAS 3.0 (http://kobas.cbi.pku.edu.cn/, accessed on 8 June 2021) software.

2.2.3. Quantitative RT–PCR (qRT–PCR) Analysis

The flower buds and leaf buds of A. bulbifer ‘Xitai 9’ were selected as experimental materials, and the total RNA of the apical buds were extracted by Trizol Reagent (Invitrogen, Waltham, MA, USA) method. According to the manufacturer’s instructions, 1μg of total RNA was reverse-transcribed into the first strand cDNA using a reverse transcription kit (PrimeScript RT reagengt Rit with gDNA Eraser) (Takara, Baori Medical Biotechnology (Beijing) Co., Ltd.), and the cDNA template was stored at −20 °C until use. The qPCR primers are presented in Supplementary Table S5. The fluorescence quantitative reagent was TransStart Top Green qPCR SuperMix (TransGen Biotech, Beijing TransGen Biotechnology Co., Ltd.). Fluorescence-based quantitative PCR was performed using CFX96TM real-time system (Bio-Rad Laboratories, Hercules, CA, USA), in which the qPCR protocol consisted of an initial thermal activation step of 95 °C for 30 s, followed by 40 cycles of 95 °C for 10 s and 60 °C for 30 s. Each process involves three biological replications, and each biological replication consists of three technical replications. The relative expression levels of the target genes were calculated using the 2−ΔΔCT method [37]. The data were normalized to the geometric mean of the reference control gene.

2.3. Determination of Sugar Content in A. bulbifer Corms

The apical buds of the A. bulbifer corms were removed, and the remaining corms were dried in an oven at 80 °C until constant weight was reached. The contents of total soluble sugar and starch in dried A. bulbifer corms were determined. The standard curve of glucose was generated by anthrone colorimetry [38]. The standard curve of starch was generated by iodine starch colorimetry [39].

2.4. Targeted Metabolic Analysis of A. bulbifer Flower Buds and Leaf Bud Hormone Content

2.4.1. Sample Extraction

A 0.1 mg sample was accurately weighed, and 1 mL of cold 50% ACN aqueous solution was added. The samples were ultrasonically treated at 4 °C for 3 min, extracted at 4 °C for 30 min, and centrifuged at 12,000× g rpm at 4 °C for 10 min. The supernatant was collected and passed through an RP-SPE column (CNWBOND LC-C18 SPE): 1 mL of 100% MeOH and 1 mL of deionized water were added, after which the mixture was balanced with 50% ACN aqueous solution (v/v). After loading the sample (supernatant obtained according to the above steps), the passing fractions were collected in a glass tube. The column was then rinsed with 1 mL of 30% ACN (v/v), and the fraction was collected in the same glass tube as the circulating fraction. The sample was evaporated to dryness in a nitrogen stream, dissolved in 200 µL of 30% ACN (v/v), and transferred to a sample vial with inserts [40]. The data acquisition instrument used mainly included an ultrahigh-performance liquid chromatography system (Vanquish, UPLC, Thermo, Waltham, MA, USA) and a high-resolution mass spectrometry system (Q Exactive, Thermo, Waltham, MA, USA) (https://www.thermofisher.com/, accessed on 8 June 2021).

2.4.2. Liquid-Phase Parameters

The chromatographic column used was a Waters HSS T3 column (50 × 2.1 mm, 1.8 μm), the mobile phase included mobile phase A (ultrapure water containing 0.1% acetic acid) and mobile phase B (acetonitrile containing 0.1% acetic acid); the flow rate was 0.3 mL/min, the column temperature was 40 °C, and the injection volume was 2 µL. The elution gradient was as follows: 0 min, 90:10 water/acetonitrile (v/v); 1 min, 90:10 water/acetonitrile; 7 min, 90:10 water/acetonitrile; 7.1 min, 10:90 water/acetonitrile; and 9 min, 10:90 water/acetonitrile [41]. Then, using different concentrations of standard substances, the concentration of the standard substance was used as the abscissa, and the peak area of the standard substance was used as the ordinate. The mathematical relationship between the target compound and its peak area (linear, quadratic equation, logarithm, etc.) was obtained, and the concentration was subsequently calculated according to the peak area of the corresponding compound in the unknown sample.

2.4.3. Mass Spectrometry Parameters

An electrospray ionization (ESI) source was used. The sheath gas was 40 arb, the auxiliary gas was 10 arb, the ion spray voltage was 3000 V, the temperature was 350 °C, and the ion transport tube temperature was 320 °C. The scanning mode was single-ion detection (SIM) mode. Salicylic acid, jasmonic acid, jasmonic acid-isoleucine, 3-indoleacetic acid, abscisic acid, gibberellin A1, gibberellic A3, gibberellin A4 and gibberellin A7 were determined in positive ion mode. Trans-zeatin, trans-zeatin-riboside, N6-(Δ2-isopentenyl) adenine, N6-(Δ2-isopentenyl) adenosine, brassinolide, 1-aminocyclopropanecarboxylic acid and methyl jasmonate were detected in positive ion mode. Mass spectrometry data were processed using the software TraceFinder (TraceFinder™ 5.1 SP1) [41].

2.5. Nontargeted Metabolic Analysis of A. bulbifer Flower Bud and Leaf Bud Metabolite Contents

2.5.1. Metabolite Extraction

A. bulbifer flower bud and leaf bud samples (200 mg) were accurately weighed in a 2 mL EP tube, prepared with 0.6 mL 2-chlorophenylalanine (4 ppm) methanol (−20 °C), and vortexed for 30 s. After fully grinding, sonicating for 15 min and centrifuging at 12,000× g rpm and 4 °C for 10 min, 300 μL of the supernatant was passed through a 0.22 μm membrane filter, and the filtrate was added to an autosampler vial. There were six biological replicates for each flower bud and leaf bud sample. The sample to be tested was mixed with 20 μL of QC sample to correct for deviations in the analysis of mixed samples and errors caused by the instrument itself [42]. The remaining samples were subjected to ultra-pressure liquid chromatography–mass spectrometry (UPLC–MS).

2.5.2. UPLC–MS Analysis

In this study, an ultrahigh-pressure liquid chromatograph (Thermo U3000, Thermo Fisher Scientific, Waltham, MA, USA) ACQUITY UPLC HSS T3 1.8 μm (2.1 × 150 mm) chromatographic column was used for analysis. The temperature of the automatic sampler was set to 8 °C, the flow rate was 0.25 mL/min, the column temperature was 40 °C and the injection volume was 2 μL. The mobile phase was 0.1% formic acid in water (C) −0.1% formic acid in acetonitrile (D) and 5 mM ammonium formate in water (A)-acetonitrile (B). Mass spectrometry analysis was performed on a Thermo QE-HF-X mass spectrometer (Thermo Fisher Scientific, Waltham, MA, USA) using electrospray ionization (ESI) in positive and negative ion modes [43,44].

2.5.3. Data Processing and Analysis

The original data were subsequently converted into mzXML format by Proteowizard software (v3.0.8789) [45], after which the XCMS program (R v3.3.2) was used for peak identification, peak filtering, peak alignment, retention time and peak area extraction. The data extracted from the XCMS were first subjected to metabolite structure identification and data preprocessing, after which the quality of the experimental data was evaluated and data analysis was performed. p value ≤ 0.05 and VIP ≥ 1 were used as screening criteria for differentially abundant metabolites [46]. Finally, the KEGG database and HMDB were used to annotate the identified metabolites and obtain metabolite information [47].

2.6. Combined Transcriptomic and Metabolomic Analysis

Based on the screening results of the differentially expressed genes and differentially abundant metabolites in the transcriptome, the results of the transcriptomic and metabolomic analyses were mapped on the KEGG map to further analyze the associations between genes and metabolites.

3. Results

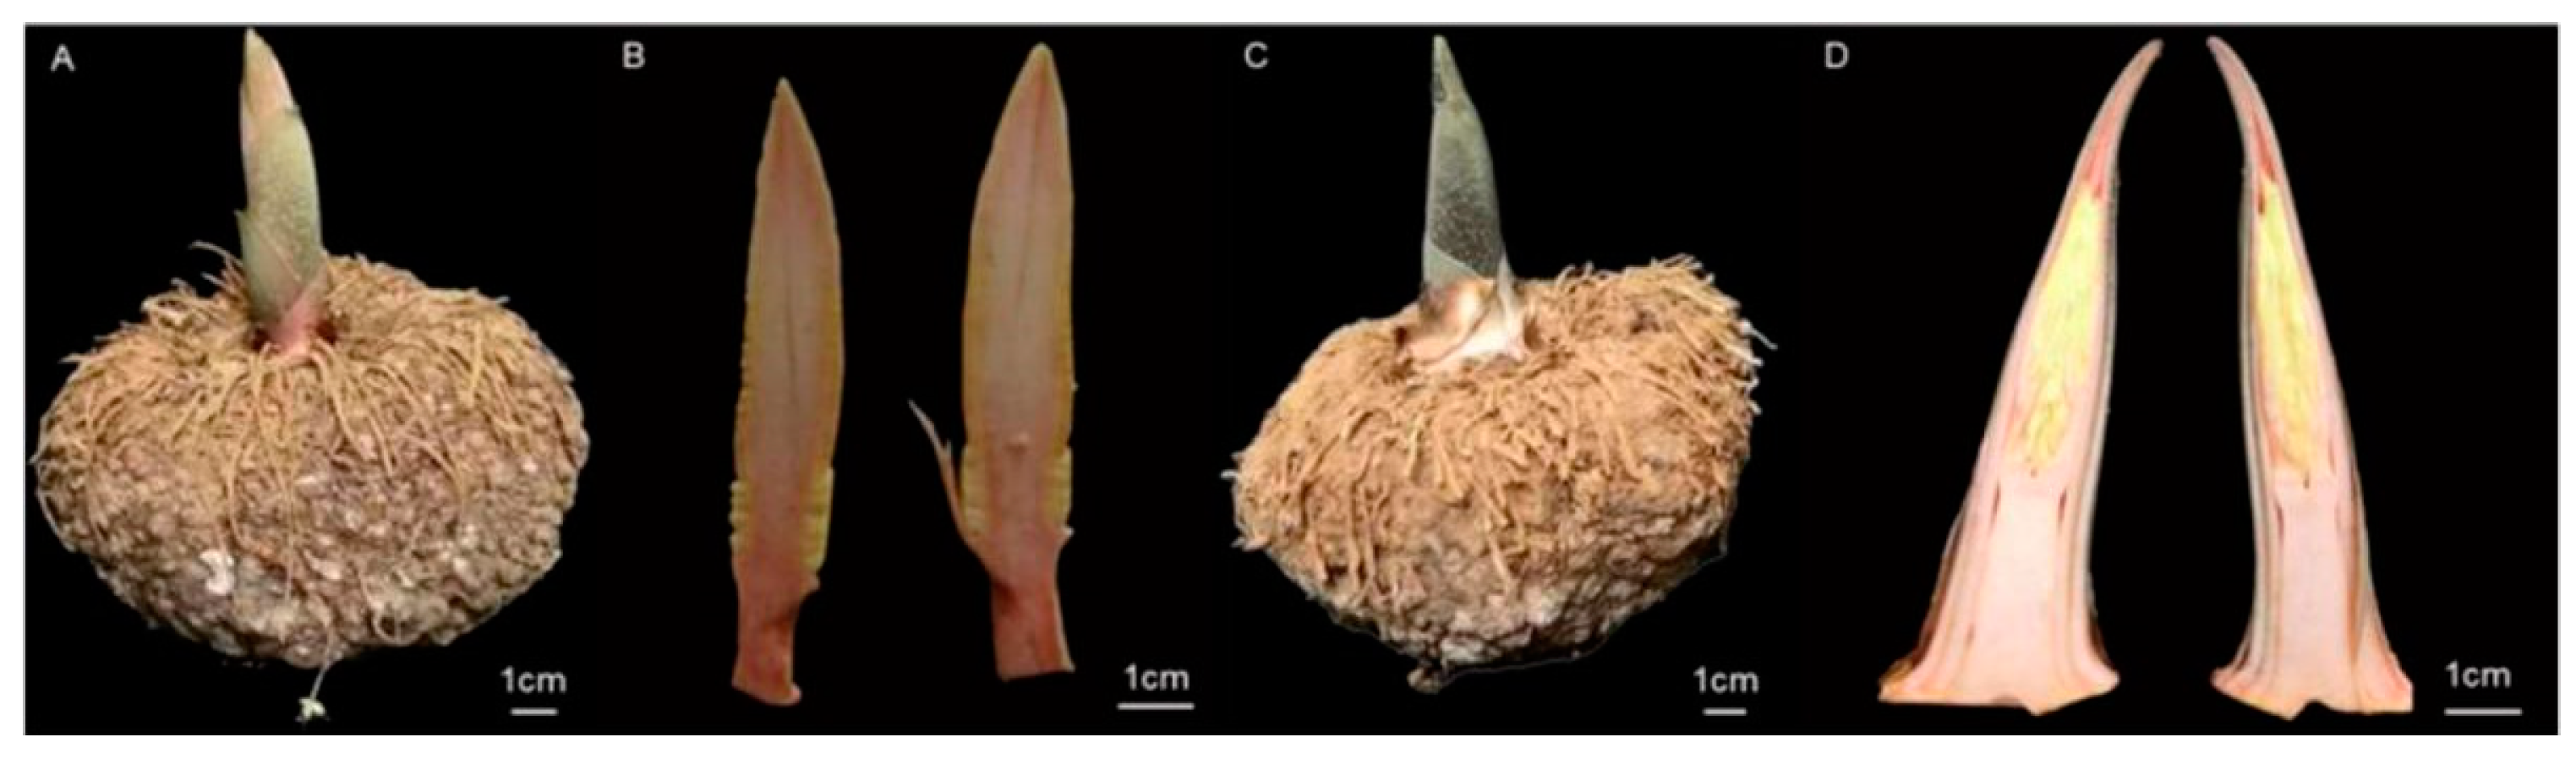
3.1. Morphological Observation of Flower Buds and Leaf Buds of A. bulbifer

The morphological observation of the flower buds and leaf buds of A. bulbifer is shown in Figure 1. Figure 1A shows flower buds, with the top of the bud being relatively full and round and appearing light yellow. Figure 1B shows the longitudinal profile of flower buds. Figure 1C shows a leaf bud corm, with the top of the bud being relatively pointed and light green. Figure 1D shows a longitudinal profile of the leaf bud. The main difference between flower buds and leaf buds in appearance is that the apexes of flower buds are round and light yellow, while the tops of leaf buds are sharp and light green.

3.2. Transcriptome Analysis

3.2.1. Transcriptome Sequencing Data Processing, Transcript Splicing and Functional Annotation

To understand the transcriptome changes that occur during the development of flower buds in A. bulbifer ‘Xitai 9’, high-throughput sequencing was performed on the early flower buds and leaf buds of A. bulbifer. After removing unqualified reads from the original data, 169,937 transcripts and 61,621 unigene sequences were ultimately obtained after assembly. In the NR, Swiss-Prot, GO, eggNOG, KEGG, and Pfam 6 databases, the total number of unigenes that could be matched was 2881, accounting for only 4.68% of all unigenes (Supplementary Table S1). Among them, the annotations to the NR database were the most common, reaching 23,143, accounting for 37.56%; the number of annotations to the GO database was the least common, with only 7511 annotations, accounting for only 12.19%.

3.2.2. Screening of Differentially Expressed Genes

According to the transcriptome data, 5542 differentially expressed genes (DEGs) were screened between flower buds (H) and leaf buds (Y) according to the change in H/Y (Figure 2). All genes are listed in Supplementary Table S2 and the principal component analysis based on all expressed genes is shown in Supplementary Figure S1. Among these genes, 3107 were upregulated and 2435 were downregulated in Y vs. H. Similarly, the number of upregulated DEGs in Y vs. H was greater than the number of downregulated DEGs, indicating that the gene expression changed significantly during flower bud differentiation in A. bulbifer ‘Xitai 9’.

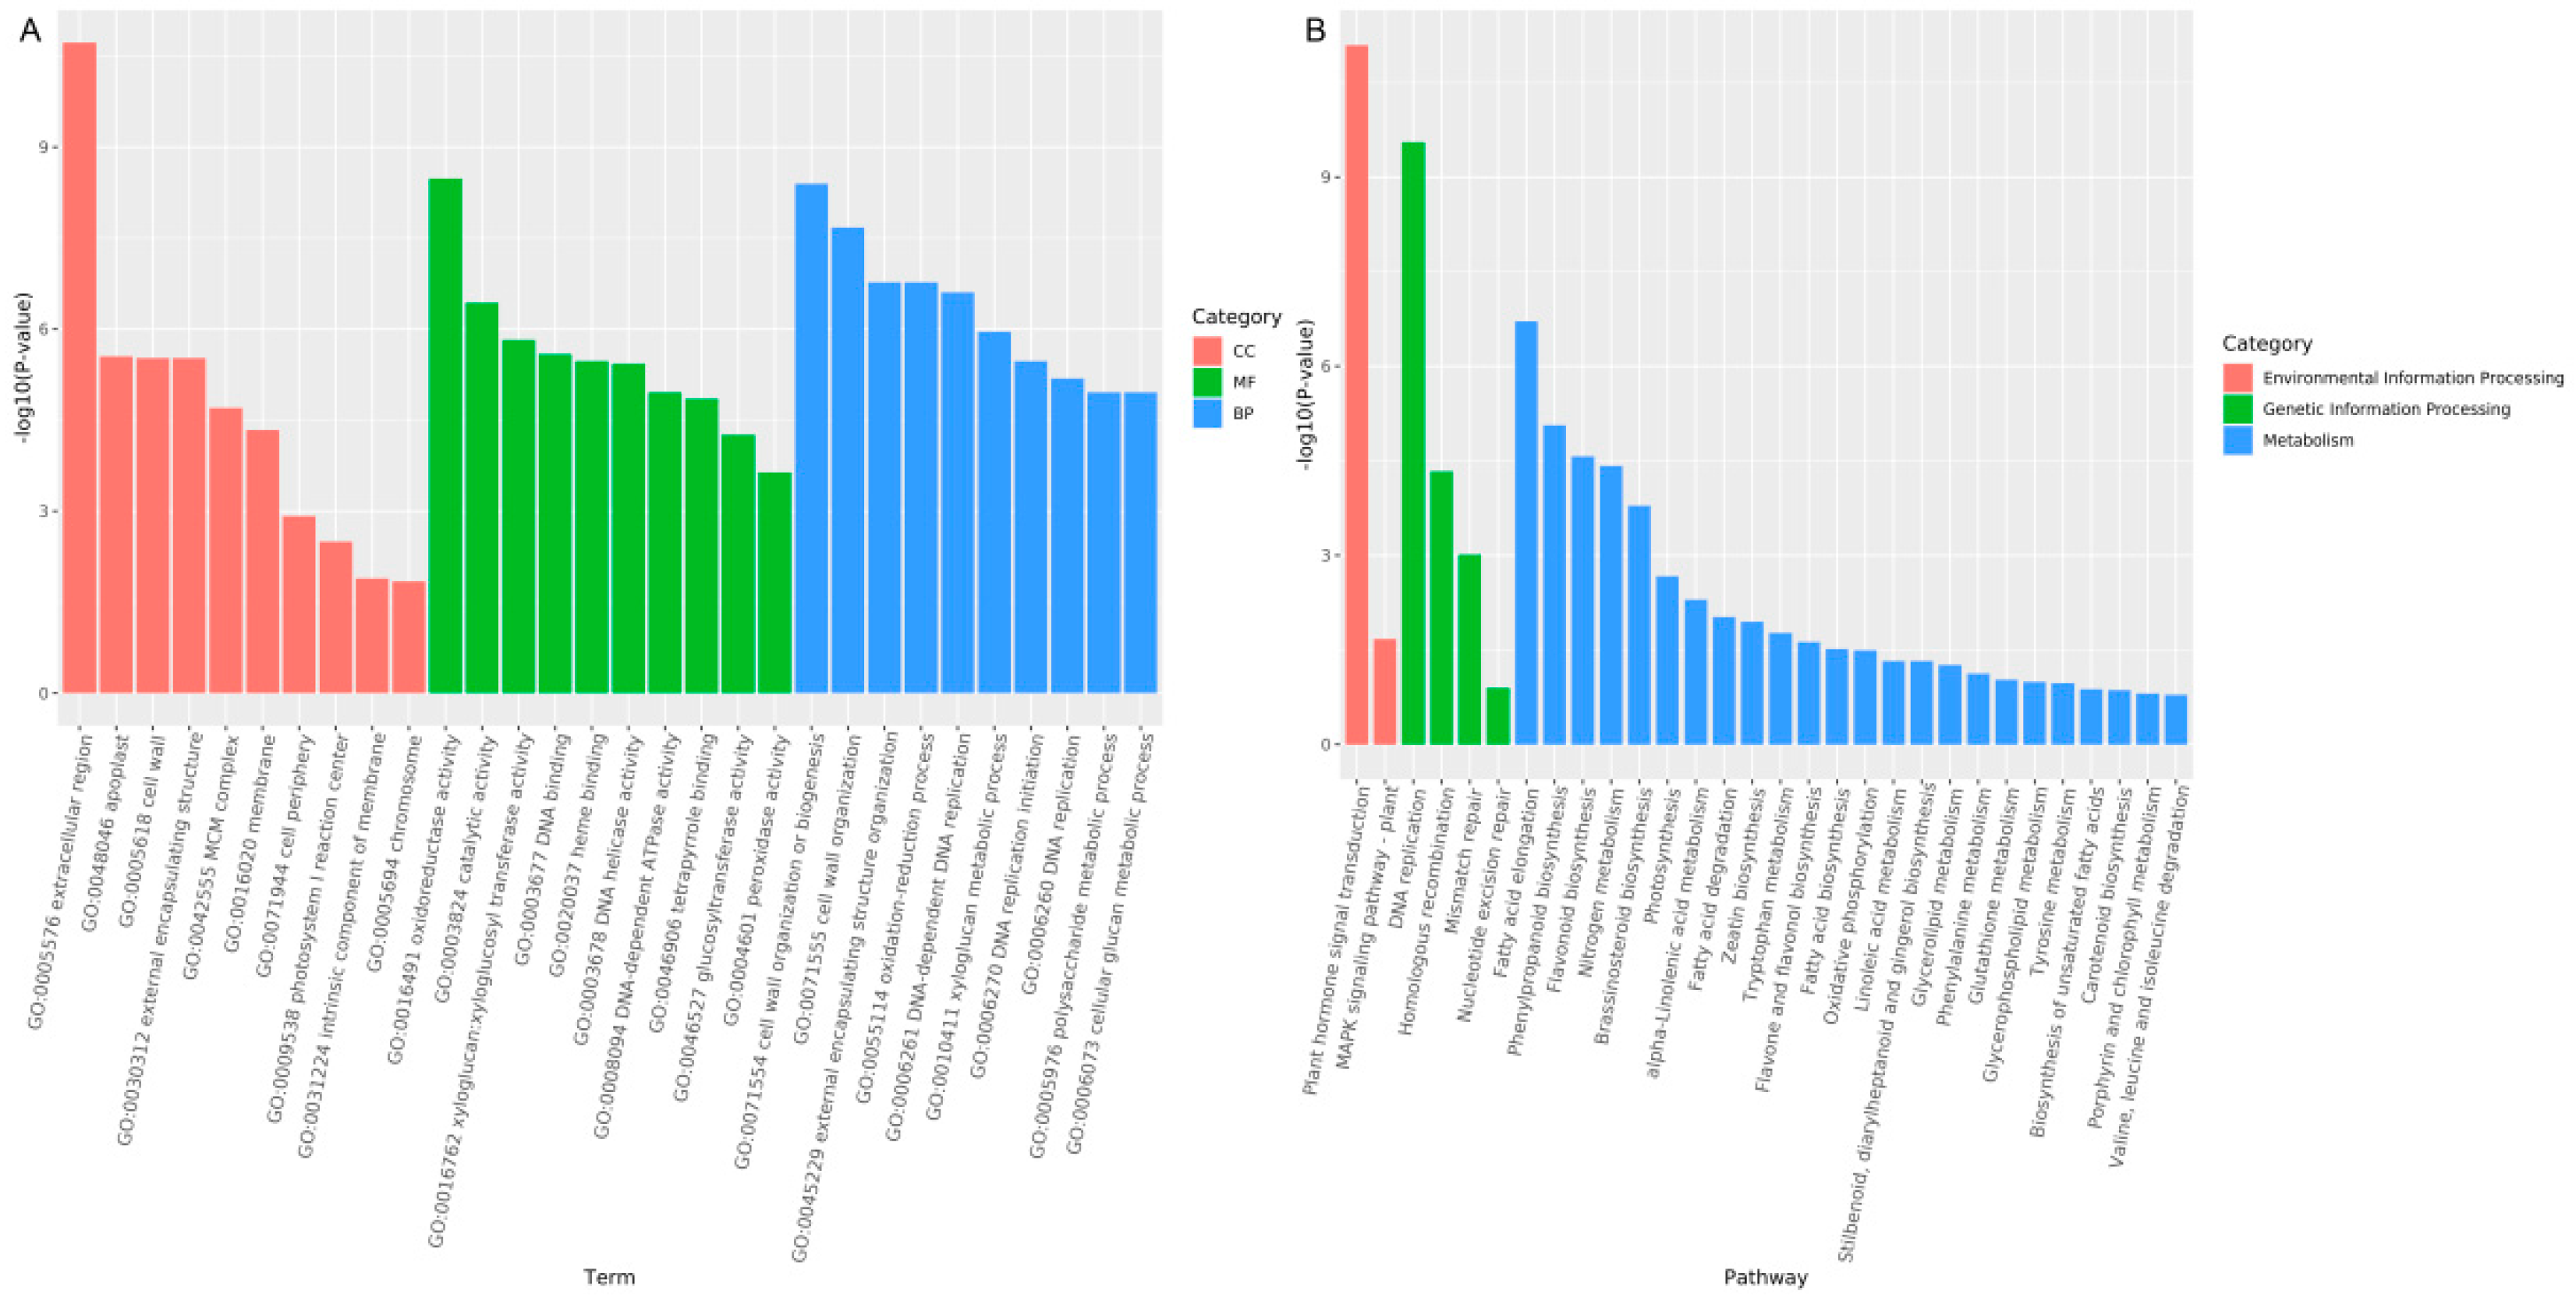
3.2.3. Functional Annotation and Classification of Differentially Expressed Genes

A gene ontology (GO) enrichment analysis of the differentially expressed genes revealed a total of 2349 GO annotations. GO classification was performed according to molecular function (MF), cellular component (CC) and biological process (BP) enrichment, with 656, 1436 and 257 genes, respectively. The top 10 GO term entries with the most significant enrichment in each GO category were selected for mapping (Figure 3A). According to the MF classification, the differentially expressed genes were mainly associated with key enzyme functions, such as oxidoreductase activity, catalytic activity and glycosyltransferase activity. According to the CC classification, the differentially expressed genes were mainly clustered in extracellular regions, apoplasts and cell walls. According to the BP classification, the differentially expressed genes were mainly associated with cell wall tissue or biogenesis, cell wall tissue, external encapsulation structure tissue, etc.
According to the results of the KEGG enrichment analysis of the differentially expressed genes, the top 20 pathways with the most significant enrichment were selected for mapping (Figure 3B). The results showed that, in the classification of environmental information processing, the two pathways of plant hormone signal transduction and the MAPK signaling pathway were the most significantly enriched. Among the genetic information processing pathways, DNA replication, homologous recombination, mismatch repair, nucleotide excision repair and other pathways were the most significantly enriched. According to the metabolic classification, fatty acid elongation, phenylpropanoid biosynthesis, flavonoid biosynthesis, nitrogen metabolism and other pathways were the most significantly enriched pathways. These pathways play important roles in the regulation of A. bulbifer flower bud differentiation.
The analysis of plant hormone signal transduction pathway showed that there were 70 differential genes. Statistical analysis of these differentially expressed genes revealed that 16 of the 43 upregulated genes had a differential expression level of more than 5 times (Table 1). Most of them are auxin-inducible proteins or hormone synthases. Those highly expressed genes indicate that plant hormones play a crucial role in the early development of flower buds in ‘Xitai 9’.

3.2.4. Validation of the Transcriptome Data

To verify the reliability of the transcriptome data, flowering and hormone-related signaling, seven genes were selected from the transcriptome data for quantitative PCR analysis (Figure 4). These seven genes included the transcription factor DcMYB3-2, the developmental protein SEPALLATA1, the ethylene-responsive transcription factor ERF054-like, the PISTILLATA-like MADS-box protein, the phototropic responsive-NPH3 family protein, the protein ELF4-LIKE 4, and the indole-3-acetic acid-amido synthetase GH3.6. The reference gene was EIF4A. The results showed that the expression levels of these seven genes were similar to the RNA sequencing results, indicating that the RNA-seq data correctly and reliably reflected the expression trends of related genes during flower bud development in A. bulbifer ‘Xitai 9’.

3.3. Determination of Total Soluble Sugar and Starch Content in A. bulbifer Corms

To understand the difference in sugar content between flower bud corms and leaf bud corms of A. bulbifer, the soluble sugar and starch contents were determined via anthrone colorimetry. The results showed that the soluble sugar contents in the flower bud and leaf bud corms were 2.37% and 1.56%, respectively, and the starch contents were 16.54% and 14.09%, respectively (Figure 5). The contents of soluble sugar and starch in the flower bud corms were significantly greater than those in the leaf bud corms, indicating that A. bulbifer flower bud differentiation may require an increased accumulation of soluble sugar and starch.

3.4. Metabolomic Analysis

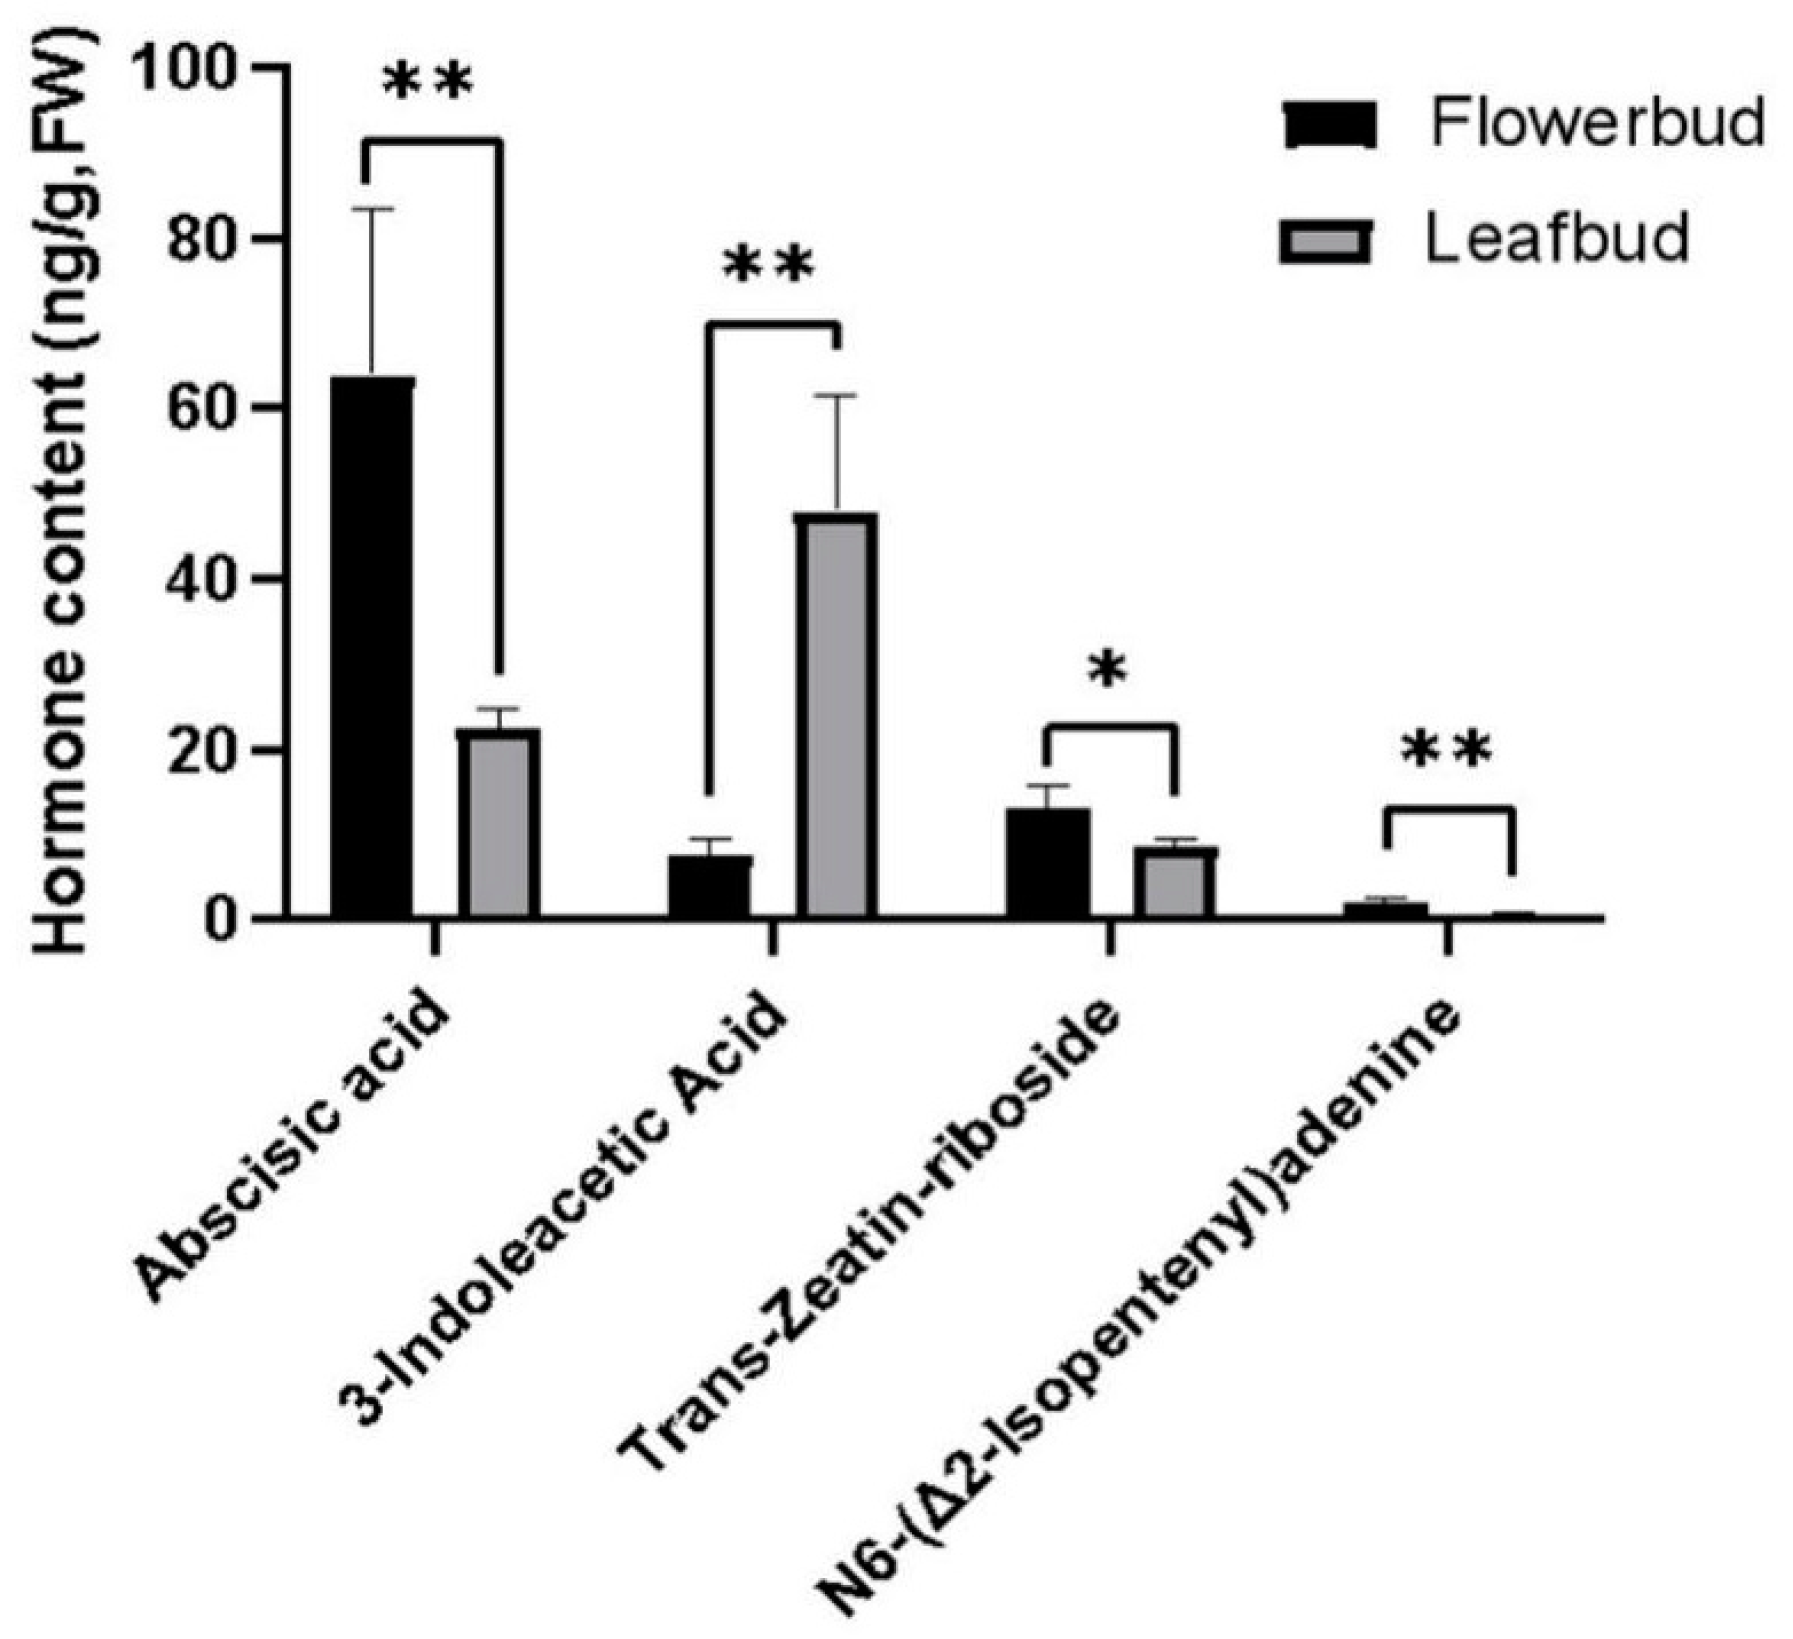
3.4.1. Targeted Metabolic Analysis of Endogenous Hormone Contents in Flower Buds and Leaf Buds of A. bulbifer with Corms

To determine whether endogenous hormones have an effect on flower bud differentiation and leaf bud differentiation in A. bulbifer, the hormone content was determined via UPLC–MS (Supplementary Table S3). The results showed that there were significant differences in ABA, IAA, ZT and IPA between the flower buds and leaf buds (Figure 6). The contents of ABA, ZT and IPA in flower buds were significantly greater than those in leaf buds, while the content of IAA in leaf buds was significantly greater than that in flower buds. Taken together, these findings indicated that ABA, ZT and IPA promoted flower bud differentiation, while IAA promoted leaf bud differentiation.

3.4.2. Nontargeted Analysis of the Metabolite Content in Flower Buds and Leaf Buds of A. bulbifer

To further understand the changes in metabolites in A. bulbifer flower buds and leaf buds during germination, the changes in metabolites in flower buds and leaf buds were determined via nontargeted metabolomics analysis. Principal component analysis (PCA) was performed, and the results showed that there was a significant separation between the H and Y samples (Figure 7a,b). Orthogonal-partial least squares discriminant analysis (OPLS-DA) was performed, and the OPLS-DA results revealed that the different treatments produced significantly different scores (Figure 7c,d). The distribution of the two groups of samples was relatively stable, and the principal component was clearly distinguished, which proved that there were significant differences in metabolites between the two groups.

3.4.3. Identification of Differentially Accumulated Metabolites

The OPLS-DA model was selected to obtain variable importance in projection (VIP) values to screen for differentially abundant metabolites, and 5296 metabolites with significant differences were found. Functional and taxonomic annotations of differentially abundant metabolites were performed in the Human Metabolome Database (HMDB). A total of 118 differentially abundant metabolites were identified in flower buds and leaf buds (Supplementary Table S4). Further cluster analysis of the differentially abundant metabolites revealed 17 differentially abundant metabolites in the flower buds (Table 2). The log2(fold change-H/Y) values of 2-heptanone, cervulin and 3-methyl-2-oxopentanoic acid in flower buds were 18.89, 18.14 and 17.48, respectively. It is speculated that these substances are involved in promoting flower bud differentiation in A. bulbifer. High levels of L-4-hydroxyglutamic acid hemialdehyde, γ-glutamyl-β-aminopropionitrile, 1-pyrroline-5-carboxylic acid, pyrrolidine carboxylic acid, ketorolac, phenylethylamine and other differentially abundant metabolites were involved in the metabolic process of amino acids, indicating that abundant amino acids played an important role in the flower bud differentiation of A. bulbifer ‘Xitai 9’. 1-Benzyl-1,2,3,4-tetrahydroisoquinoline is involved in the synthesis of isoquinoline alkaloids, and capsidiol is involved in the biosynthesis of sesquiterpenes and triterpenes. These substances can resist bacteria and play a role in the prevention and treatment of diseases. (R)-5,6-Dihydrothymidine is involved in pyrimidine metabolism and nucleic acid synthesis. These substances play regulatory roles in flower bud differentiation.

3.5. Correlation Analysis between Differentially Expressed Genes and Differentially Accumulated Metabolites

The differentially abundant metabolites and differential genes between the flower buds and leaf buds of A. bulbifer were mapped to the KEGG pathway, and the differentially abundant metabolites and pathways that could be mapped to the KEGG pathway were identified (Table 3). The combined analysis of metabolomics and transcriptomics showed that the differentially abundant metabolites in flower buds were enriched mainly in KEGG pathways related to amino acid metabolism (Ko00330, Ko00480, Ko00460, Ko00360), isoquinoline alkaloid biosynthesis (Ko00950) and pyrimidine metabolism (Ko00240). These pathway products are involved in the regulation of flower bud development in A. bulbifer.

4. Discussion

A. bulbifer is rich in glucomannan and has great development value. Previous research has focused mainly on A. bulbifer cultivation, variety selection, disease control and the biological characteristics of glucomannan, with little research on the growth and development of A. bulbifer. However, the physiological and molecular mechanism of A. bulbifer flower bud development are unclear. In this study, transcriptome and metabolome sequencing analyses of flower buds and leaf buds in the early growth stage of A. bulbifer were carried out. The results showed that the high content of soluble sugar and starch in the corms of A. bulbifer; the high contents of ABA, ZT and IPA hormones; and the abundance of amino acids in the apical buds of the corms were all beneficial for the development of flower buds of A. bulbifer. The physiological and molecular mechanism of flower bud development in A. bulbifer was preliminarily revealed.
Plant flowering time is one of the most important developmental factors in the plant life cycle. These autonomous developmental signals include the assessment of the carbon status of the whole plant [48]. The contents of soluble sugar and starch in the corms of A. bulbifer were determined, and the contents of soluble sugar and starch in the corms of flower buds and leaf buds were significantly different (Figure 5), indicating that these sugar contents affect flower bud differentiation and flowering in A. bulbifer. Starch, as a stored carbohydrate, can provide substrates and energy for material conversion [49]. Amylase increases the soluble sugar content in corms by hydrolyzing starch and provides material and energy for the growth of apical buds. Hormones can also affect the growth and development of plants through interactions with hormones [50,51]. Therefore, starch and soluble sugar play an extremely important role in the development of plants. When the apical buds of A. bulbifer bulbs differentiate into flower buds, the corms need to store more starch and soluble sugar.
Seeds are an important reproductive mode of plants. Plant flowering involves the internal environment and many external factors, including endogenous hormones, nutrients, light and other factors [52]. Endogenous hormones in plants are key factors in regulating plant growth. In this study, the results of targeted metabolism of endogenous hormones in flower buds and leaf buds in the early stage of A. bulbifer development revealed significant differences in ABA, IPA, ZT and IAA concentrations between flower buds and leaf buds (Figure 6). Previous studies have shown that a high ABA concentration induces flower bud differentiation in plants [53,54,55]. ABA can promote flower bud differentiation in fruit trees [56,57]. Ito et al. reported that bending branches increased the content of abscisic acid and promote flower bud differentiation in pear trees [58]. Goldschmidt reported that the ABA content in Citrus sinensis increased continuously from before squaring to before and after full bloom and suggested that this increase was beneficial for the morphological differentiation of flower buds and flower opening [59]. Cytokinin (CTK), a derivative of adenine, is a hormone that controls plant growth and development [60,61]. N6-(Δ2-prenyl)-adenosine (IPA) has been identified as one of the most important physiological signals during flowering. In A. thaliana, the activity of IPA in the root exudates of flower-induced plants increased, and the increase in the levels of these cytokinins was related to the early regulation of floral transition [62]. Adding IPA to A. thaliana can effectively induce early bolting and flower bud formation [63]. IPA can promote flower bud differentiation in fruit trees. During the flower bud differentiation period, the level of cytokinin gradually increased in the flower buds of Malus pumila, L. chinensis, C. reticulata and other fruit trees and often reached the highest level in the early stage of morphological differentiation. ZR is the main form of CTK transported in the xylem and can promote flower bud differentiation in fruit trees [64]. During the long period of physiological differentiation in Canarium album, the content of ZR was shown to be high [65]. Ai et al. reported that a high concentration of ZT was beneficial for flower bud differentiation in Schisandra chinensis. It is generally believed that the auxin IAA is an inhibitor of flower bud differentiation [66]. The determination of exogenous and endogenous auxin concentrations by Kinet showed that a low concentration of IAA was necessary for flower bud differentiation, while a high concentration of IAA inhibited flower bud differentiation [67]. The IAA transport inhibitors ethephon (CEPA), o-aminocarbonylbenzoic acid (NPA) and triiodobenzoic acid (TIBA) can reduce the shoot tips and fruit output of IAA and promote flower bud differentiation, which indirectly proves that high levels of IAA are involved in inhibiting flower bud differentiation [68]. When Malus pumila was sprayed with IAA, the proportion of short branches decreased, the flowering rate decreased, the contents of endogenous IAA and GA in buds increased significantly, the contents of ABA and ZT decreased significantly, the expression of AFL1 was downregulated, and the expression of MdTFL1 was upregulated [69]. A high IAA content in A. bulbifer promoted the occurrence of leaf buds [34]. These results were similar to our findings. The high concentrations of ABA, ZT and IPA and low concentration of IAA in the buds of A. bulbifer ‘Xitai 9’ may be the main factors inducing the development of flower buds, which preliminarily explains the response mechanism of various hormones in the early development of flower buds of A. bulbifer ‘Xitai 9’.
Transcriptome sequencing analysis revealed that plant hormone signal transduction and plant MAPK signaling pathways were the most significantly enriched pathways in the environmental information processing category. The analysis of plant hormone signal transduction found that auxin and indole acetic acid-inducible proteins, hormone synthases, hormone regulatory proteins, and transcription factors have high expression levels (Table 1). The high expression of these genes plays an important role in plant growth and flower bud formation [70,71]. The MAPKKK-MAPKK-MAPK cascade family is involved in intracellular signal transduction, and its protein kinase plays a vital role in the plant stress response and hormone signal transduction [72]. The kinase AtMPK3/6 is required for anther development and zygote asymmetry in A. thaliana [73,74]. In Oryza sativa, OsMKKK10-OsMKK4-OsMPK6 can affect the brassinosteroid (BR) response and the expression of BR-related genes, thereby affecting rice inflorescence [75,76]. Therefore, the MAPK signaling pathway identified in the present study may regulate flower bud formation in A. bulbifer. According to the metabolic classification, genes associated with fatty acid elongation, phenylpropanoid biosynthesis, flavonoid biosynthesis, nitrogen metabolism and other pathways were significantly enriched. The phenylpropanoid biosynthesis and flavonoid biosynthesis pathways are related to flavonoid biosynthesis. Flavonoids are secondary metabolically active substances that promote plant flowering. These pathways play important roles in plant growth [77,78,79,80,81]. The high expression of related genes enriched in these pathways promoted the differentiation of apical buds into flower buds in A. bulbifer ‘Xitai 9’.
Nontargeted metabolomics analysis of metabolites in flower buds and leaf buds revealed 17 differentially abundant metabolites in flower buds (Table 3). Among these differentially abundant metabolites, L-4-hydroxyglutamic acid hemialdehyde, 1-pyrroline-5-carboxylic acid, γ-glutamyl-β-aminopropionitrile, pyrrolidine carboxylic acid and phenylethylamine are intermediates in the amino acid metabolic pathway and participate in amino acid metabolism, which is beneficial for increasing the amino acid content of A. bulbifer. A high concentration of amino acids is conducive to the development of A. bulbifer flower buds. Wei Lijun et al. studied the reproductive growth of cassava plants from vegetative growth to flower bud differentiation and reported that the accumulation of Gly, Gln, Met, Tyr, Ser, Thr, Asn, Val and ILE in cassava stems promoted Manihot esculenta flower bud differentiation [42]. Liu and Zhang showed that the content and total amount of 17 amino acids in fruit trees were greater than those in fruitless trees of Citrus reticulata (C. reticulata). The flower bud differentiation of citrus plants depends on the synthesis and accumulation of a certain number of amino acids [82]. The log2(fold change-H/Y) values of 2-heptanone, cervulin and 3-methyl-2-oxopentanoic acid in flower buds were 18.89, 18.14 and 17.48, respectively. It is speculated that these substances may be involved in promoting the morphogenesis of A. bulbifer flower buds, but the underlying mechanism needs further study.
Through the joint analysis of metabolomics and transcriptomics, the differentially abundant metabolites and differential genes between flower buds and leaf buds of A. bulbifer were mapped to the KEGG pathways listed in Table 3. The main differentially abundant metabolites in the flower buds were L-4-hydroxyglutamic acid hemialdehyde, 1-pyrroline-5-carboxylic acid, pyrrolidine carboxylic acid, phenylethylamine, γ-glutamyl-β-aminopropionitrile, 1-benzyl-1,2,3,4-tetrahydroisoquinoline and (R)-5,6-dihydrothymidine. The degree of accumulation of these substances is related to the expression of key enzyme-encoding genes in the pathway. L-4-Hydroxyglutamic acid hemialdehyde and 1-pyrroline-5-carboxylic acid were enriched in the arginine and proline metabolic pathways and upregulated more than five times compared with the highly expressed enzyme-encoding genes, including acetaldehyde dehydrogenase, S-adenosylmethionine decarboxylase and polyamine oxidase genes. Acetaldehyde dehydrogenase mainly catalyzes the oxidation of acetaldehyde to acetic acid and subsequently produces acetyl-CoA. Acetyl-CoA can be converted into other amino acids, ATP and other energy-supplying substances to provide energy for plants. It can also synthesize fatty acids, cholesterol, ketones and other substances for flower bud development. S-Adenosylmethionine decarboxylase is involved in the synthesis and metabolism of polyamines, affecting the content of polyamines in plants to regulate their growth, development, flowering and fruiting. Polyamine oxidase (PAO) oxidizes polyamines such as spermine, putrescine and spermidine into amines and corresponding ketones to regulate plant growth and development [83]. Pyrrolidine carboxylic acid was enriched in the glutathione metabolic pathway and upregulated by 5-fold the expression of genes, including ascorbate peroxidase (APX) and glutathione S-transferase genes (GSTs). APX catalyzes the redox reaction between ascorbic acid and hydrogen peroxide in plants, converts harmful hydrogen peroxide into water and oxygen, removes intracellular hydrogen peroxide and maintains the redox balance in plant cells [84]. GSTs can bind and catalyze the reaction between a series of compounds and glutathione (GSH) and convert them into more stable metabolites, thereby promoting the metabolism and clearance of toxic substances, which play important roles in plant growth and development and resistance to stress [85]. Phenethylamine was enriched in the phenylalanine metabolic pathway, and the phenylalanine ammonia lyase (PAL) gene had the highest expression level. It can convert phenylalanine into α-aminoacetic acid (Ala) and other nonessential amino acids into a metabolizable form. In addition, the enzyme can also convert other amino acids to Ala. The phenylpropanoid metabolic pathway is also an important pathway for the biosynthesis of flavonoids and phenols in plant secondary substances, and PAL is one of the key enzymes in this pathway. The activity of PAL has an important effect on the synthesis and accumulation of plant secondary substances [86]. γ-Glutamyl β-aminopropionitrile is enriched in the cyanoamino acid metabolic pathway and is highly expressed by β-glucosidase. This enzyme catalyzes the cleavage of glycosidic bonds in the substrate, generates glucose and the corresponding pairing groups, and participates in the process of carbohydrate metabolism in plants [87]. 1-Benzyl-1,2,3,4-tetrahydroisoquinoline is enriched in the pyrimidine metabolic pathway. In this pathway, the cytokinin riboside 5′-monophosphate ribose hydrolases LOG1 and LOG3 are highly expressed in flower buds and can convert phosphoribosyl nucleosides into precursors of cytokinins, thus participating in the synthesis of cytokinins and affecting plant growth and development [88]. (R)-5,6-dihydrothymine is enriched in the biosynthetic pathway of isoquinoline alkaloids. In this pathway, polyphenol oxidase, which catalyzes the oxidation of polyphenols and converts polyphenols into phenols, aldehydes, ketones and other compounds, is highly expressed. Moreover, the concentration of reactive oxygen species is reduced, thereby protecting plant cells from oxidative damage caused by stress [89]. Therefore, our results suggest that these pathway products are involved in the regulation of flower bud development in A. bulbifer.

5. Conclusions

Through the targeted determination of hormones in flower buds and leaf buds of A. bulbifer and the analysis of soluble sugar and starch contents in the corms of A. bulbifer, we found that high contents of ABA, IZT and IPA and the low content of IAA promoted the development of flower buds of A. bulbifer, and corms of A. bulbifer with high soluble sugar and starch contents were conducive to the differentiation of A. bulbifer flower buds. The combined analysis of the metabolome and transcriptome of flower buds and leaf buds of A. bulbifer showed that arginine and proline metabolism, cyanoamino acid metabolism, glutathione metabolism, phenylalanine metabolism, isoquinoline alkaloid biosynthesis, pyrimidine metabolism and other pathways played important regulatory roles in the development of flower buds and leaf buds. Our results provide basic data and a theoretical basis for the further study of the mechanism of flower bud formation in A. bulbifer and lay a foundation for the study of flowering breeding in A. bulbifer.

Supplementary Materials

The following supporting information can be downloaded at: https://0-www-mdpi-com.brum.beds.ac.uk/article/10.3390/agronomy14030519/s1, Supplementary Table S1. Summary of the Unigene database annotation results; Supplementary Table S2. Y vs. H. DESeq; Supplementary Table S3. Contents of endogenous hormone in flower bud and leaf bud; Supplementary Table S4. Statistics of 118 differentially abundant metabolites; Supplementary Table S5. qPCR primers for 7 flowering-related DEGs and the reference gene EIF4A; Supplementary Table S6. Plant hormone standards; Supplementary Figure S1. Principal component analysis based on all expressed genes.

Author Contributions

K.L. designed the experiments. W.L., C.Q., X.Z., P.X. and H.X. performed the experiments, analyzed the data and participated in the material preparation. W.L. and K.L. wrote the paper. All authors have read and agreed to the published version of the manuscript.

Funding

This work was supported by the National Natural Science Foundation of China (31960071).

Data Availability Statement

The data are available upon request from the corresponding author, Kunzhi Li.

Conflicts of Interest

The authors declare no conflicts of interest.

References

  1. Jie, P. A Study on Chinese Amorphophallus Resources. Resour. Sci. 2001, 23, 87–89. [Google Scholar]
  2. Liu, P.Y. Konjac; China Agricultural Press: Beijing, China, 2004; p. 348. [Google Scholar]
  3. Choi, K.H.; Kim, S.T.; Bin, B.H.; Park, P.J. Effect of Konjac Glucomannan (KGM) on the Reconstitution of the Dermal Environment against UVB-Induced Condition. Nutrients 2020, 12, 2779. [Google Scholar] [CrossRef]
  4. Si, Y.; Liu, X.; Ye, K.; Bonfini, A.; Hu, X.Y.; Buchon, N.; Gu, Z. Glucomannan Hydrolysate Promotes Gut Proliferative Homeostasis and Extends Life Span in Drosophila melanogaster. J. Gerontol. Ser. A Biol. Sci. Med. Sci. 2019, 74, 1549–1556. [Google Scholar] [CrossRef] [PubMed]
  5. Du, Q.; Liu, J.; Ding, Y. Recent progress in biological activities and health benefits of konjac glucomannan and its derivatives. Bioact. Carbohydr. Diet. Fibre 2021, 26, 100270. [Google Scholar] [CrossRef]
  6. Zhao, C.; Harijati, N.; Liu, E.; Jin, S.; Diao, Y.; Hu, Z. First report on DNA content of three species of Amorphophallus. J. Genet. 2020, 99, 36. [Google Scholar] [CrossRef] [PubMed]
  7. Zhao, J.; Zhang, D.; Zhao, J.P.; Srzednicki, G.; Borompichaichartkul, C.; Kanlayanarat, S. Morphological and growth characteristics of Amorphophallus muelleri blume A commercially important konjac species. Acta Hortic. 2010, 875, 501–508. [Google Scholar] [CrossRef]
  8. Gao, H.; Zhao, Y.; Huang, L.H.; Huang, Y.; Chen, J.J.; Zhou, H.Y.; Zhang, X.W. Comparative analysis of buds transcriptome and identification of two florigen gene AkFTs in Amorphophallus konjac. Sci. Rep. 2022, 12, 6782. [Google Scholar] [CrossRef] [PubMed]
  9. Susila, H.; Nasim, Z.; Ahn, J.H. Ambient Temperature-Responsive Mechanisms Coordinate Regulation of Flowering Time. Int. J. Mol. Sci. 2018, 19, 3196. [Google Scholar] [CrossRef] [PubMed]
  10. Alvarez, M.A.; Li, C.; Lin, H.; Joe, A.; Padilla, M.; Woods, D.P.; Dubcovsky, J. EARLY FLOWERING 3 interactions with PHYTOCHROME B and PHOTOPERIOD1 are critical for the photoperiodic regulation of wheat heading time. PLoS Genet. 2023, 19, e1010655. [Google Scholar] [CrossRef]
  11. Gai, Z.; Zhang, M.; Zhang, P.; Zhang, J.; Liu, J.; Cai, L.; Yang, X.; Zhang, N.; Yan, Z.; Liu, L.; et al. 2-Oxoglutarate contributes to the effect of foliar nitrogen on enhancing drought tolerance during flowering and grain yield of soybean. Sci. Rep. 2023, 13, 7274. [Google Scholar] [CrossRef]
  12. Yu, H.; Ma, H.; Fang, X.; Lai, W.; Yu, S. Review on Mechanism of Strawberry Flower Bud Differentiation and Application of Regulation Techniques. Acta Agric. Jiangxi 2011, 23, 58–61. [Google Scholar]
  13. Lu, X.Y.; Li, J.J.; Chen, H.B.; Hu, J.Q.; Liu, P.X.; Zhou, B.Y. RNA-seq analysis of apical meristem reveals integrative regulatory network of ROS and chilling potentially related to flowering in Litchi chinensis. Sci. Rep. 2017, 7, 10183. [Google Scholar] [CrossRef]
  14. Wang, Q.; Zuo, Z.; Wang, X.; Liu, Q.; Gu, L.; Oka, Y.; Lin, C. Beyond the photocycle-how cryptochromes regulate photoresponses in plants? Curr. Opin. Plant Biol. 2018, 45 Pt A, 120–126. [Google Scholar] [CrossRef]
  15. Gao, D.; Ji, X.; Yuan, Q.; Pei, W.; Zhang, X.; Li, F.; Han, Q.; Zhang, S. Effects of total daily light integral from blue and broad-band red LEDs on flowering of saffron (Crocus sativus L.). Sci. Rep. 2023, 13, 7175. [Google Scholar] [CrossRef]
  16. Li, J.; Li, G.; Wang, H.; Wang Deng, X. Phytochrome signaling mechanisms. Arab. Book 2011, 9, e0148. [Google Scholar] [CrossRef]
  17. Woods, D.P.; Li, W.; Sibout, R.; Shao, M.; Laudencia-Chingcuanco, D.; Vogel, J.P.; Dubcovsky, J.; Amasino, R.M. PHYTOCHROME C regulation of photoperiodic flowering via PHOTOPERIOD1 is mediated by EARLY FLOWERING 3 in Brachypodium distachyon. PLoS Genet. 2023, 19, e1010706. [Google Scholar] [CrossRef]
  18. Lin, C. Photoreceptors and Regulation of Flowering Time1. Plant Physiol. 2000, 123, 39–50. [Google Scholar] [CrossRef]
  19. Lee, J.; Lee, I. Regulation and function of SOC1, a flowering pathway integrator. J. Exp. Bot. 2010, 61, 2247–2254. [Google Scholar] [CrossRef] [PubMed]
  20. Deng, W.; Ying, H.; Helliwell, C.A.; Taylor, J.M.; Peacock, W.J.; Dennis, E.S. FLOWERING LOCUS C (FLC) regulates development pathways throughout the life cycle of Arabidopsis. Proc. Natl. Acad. Sci. USA 2011, 108, 6680–6685. [Google Scholar] [CrossRef] [PubMed]
  21. Lastdrager, J.; Hanson, J.; Smeekens, S. Sugar signals and the control of plant growth and development. J. Exp. Bot. 2014, 65, 799–807. [Google Scholar] [CrossRef] [PubMed]
  22. Mesejo, C.; Martinez-Fuentes, A.; Reig, C.; Agusti, M. The flower to fruit transition in Citrus is partially sustained by autonomous carbohydrate synthesis in the ovary. Plant Sci. 2019, 285, 224–229. [Google Scholar] [CrossRef]
  23. Gu, J.H.; Zeng, Z.; Wang, Y.R.; Lyu, Y.M. Transcriptome Analysis of Carbohydrate Metabolism Genes and Molecular Regulation of Sucrose Transport Gene LoSUT on the Flowering Process of Developing Oriental Hybrid Lily ‘Sorbonne’ Bulb. Int. J. Mol. Sci. 2020, 21, 3092. [Google Scholar] [CrossRef]
  24. Yue, Z.; Wang, Y.; Zhang, N.; Zhang, B.; Niu, Y. Expression of the Amorphophallus albus heat stress transcription factor AaHsfA1 enhances tolerance to environmental stresses in Arabidopsis. Ind. Crops Prod. 2021, 174, 114231. [Google Scholar] [CrossRef]
  25. Liu, T.; Hu, Y.Q.; Li, X.X. Comparison of dynamic changes in endogenous hormones and sugars between abnormal and normal Castanea mollissima. Prog. Nat. Sci.-Mater. Int. 2008, 18, 685–690. [Google Scholar] [CrossRef]
  26. Yan, B.B.; Hou, J.L.; Cui, J.; He, C.; Li, W.B.; Chen, X.Y.; Li, M.; Wang, W.Q. The Effects of Endogenous Hormones on the Flowering and Fruiting of Glycyrrhiza uralensis. Plants 2019, 8, 519. [Google Scholar] [CrossRef] [PubMed]
  27. Chen, C.; Chen, H.; Chen, Y.; Yang, W.; Li, M.; Sun, B.; Song, H.; Tang, W.; Zhang, Y.; Gong, R. Joint metabolome and transcriptome analysis of the effects of exogenous GA (3) on endogenous hormones in sweet cherry and mining of potential regulatory genes. Front. Plant Sci. 2022, 13, 1041068. [Google Scholar] [CrossRef] [PubMed]
  28. Mi, L.; Ma, D.; Lv, S.; Xu, S.; Zhong, B.; Peng, T.; Liu, D.; Liu, Y. Comparative Transcriptome and sRNAome Analyses Reveal the Regulatory Mechanisms of Fruit Ripening in a Spontaneous Early-Ripening Navel Orange Mutant and Its Wild Type. Genes 2022, 13, 1706. [Google Scholar] [CrossRef] [PubMed]
  29. Ma, D.; Liu, B.; Ge, L.; Weng, Y.; Cao, X.; Liu, F.; Mao, P.; Ma, X. Identification and characterization of regulatory pathways involved in early flowering in the new leaves of alfalfa (Medicago sativa L.) by transcriptome analysis. BMC Plant Biol. 2021, 21, 8. [Google Scholar] [CrossRef] [PubMed]
  30. Wang, J.X.; Luo, T.; Zhang, H.; Shao, J.Z.; Peng, J.Y.; Sun, J.S. Variation of Endogenous Hormones during Flower and Leaf Buds Development in ‘Tianhong 2’ Apple. Hortscience 2020, 55, 1794–1798. [Google Scholar] [CrossRef]
  31. Liang, Y.; Bai, J.; Xie, Z.; Lian, Z.; Guo, J.; Zhao, F.; Liang, Y.; Huo, H.; Gong, H. Tomato sucrose transporter SlSUT4 participates in flowering regulation by modulating gibberellin biosynthesis. Plant Physiol. 2023, 192, 1080–1098. [Google Scholar] [CrossRef]
  32. Wu, L.; Ma, N.; Jia, Y.; Zhang, Y.; Feng, M.; Jiang, C.Z.; Ma, C.; Gao, J. An Ethylene-Induced Regulatory Module Delays Flower Senescence by Regulating Cytokinin Content. Plant Physiol. 2016, 173, 853–862. [Google Scholar] [CrossRef]
  33. Wu, Z.; Jiang, Z.; Li, Z.; Jiao, P.; Zhai, J.; Liu, S.; Han, X.; Zhang, S.; Sun, J.; Gai, Z.; et al. Multi-omics analysis reveals spatiotemporal regulation and function of heteromorphic leaves in Populus. Plant Physiol. 2023, 192, 188–204. [Google Scholar] [CrossRef]
  34. Tan, C.; Li, S.; Qian, C.; Wang, H. Regulatory effects of polysaccharides and hormones on multi-leaf formation of Amorphophallus bulbifer. J. Northwest A F Univ. 2022, 50, 69–79. [Google Scholar]
  35. Xiao, M.; Zhang, Y.; Chen, X.; Lee, E.J.; Barber, C.J.S.; Chakrabarty, R.; Desgagné Penix, I.; Haslam, T.M.; Kim, Y.B.; Liu, E.; et al. Transcriptome analysis based on next-generation sequencing of non-model plants producing specialized metabolites of biotechnological interest. J. Biotechnol. 2013, 166, 122–134. [Google Scholar] [CrossRef]
  36. Yang, Q.; Zhang, A.H.; Miao, J.H.; Sun, H.; Han, Y.; Yan, G.L.; Wu, F.F.; Wang, X.J. Metabolomics biotechnology, applications, and future trends: A systematic review. RSC Adv. 2019, 9, 37245–37257. [Google Scholar] [CrossRef]
  37. Livak, K.J.; Schmittgen, T.D. Analysis of relative gene expression data using real-time quantitative PCR andthe 2−ΔΔCT method. Methods 2001, 25, 402–408. [Google Scholar] [CrossRef] [PubMed]
  38. Yemm, E.W.; Willis, A.J. The estimation of carbohydrates in plant extracts by anthrone. Biochem. J. 1954, 57, 508–514. [Google Scholar] [CrossRef] [PubMed]
  39. Mcgrance, S.J.; Cornell, H.J.; Rix, C.J. A Simple and Rapid Colorimetric Method for the Determination of Amylose in Starch Products. Starch-Stärke 1998, 50, 158–163. [Google Scholar] [CrossRef]
  40. Šimura, J.; Antoniadi, I.; Široká, J.; Tarkowská, D.E.; Strnad, M.; Ljung, K.; Novák, O. Plant Hormonomics: Multiple Phytohormone Profiling by Targeted Metabolomics. Plant Physiol. 2018, 177, 476–489. [Google Scholar] [CrossRef] [PubMed]
  41. Glauser, G.; Grund, B.; Gassner, A.-L.; Menin, L.; Henry, H.; Bromirski, M.; Schütz, F.; Mcmullen, J.; Rochat, B. Validation of the Mass-Extraction-Window for Quantitative Methods Using Liquid Chromatography High Resolution Mass Spectrometry. Anal. Chem. 2016, 88, 3264–3271. [Google Scholar] [CrossRef]
  42. Vasilev, N.; Boccard, J.; Lang, G.; Grömping, U.; Fischer, R.; Goepfert, S.; Rudaz, S.; Schillberg, S. Structured plant metabolomics for the simultaneous exploration of multiple factors. Sci. Rep. 2016, 6, 37390. [Google Scholar] [CrossRef]
  43. Hesham, O.; Othman, E.; Refaat, J.; Yehia, S.; Pimentel-Elardo, S.; Nodwell, J.; Schirmeister, T.; Tawfike, A.; Abdelmohsen, U. Metabolomics analysis and biological investigation of three Malvaceae plants. Phytochem. Anal. 2020, 31, 204–214. [Google Scholar]
  44. Monnerat, G.; Seara, F.A.C.; Evaristo, J.A.M.; Carneiro, G.; Evaristo, G.P.C.; Domont, G.; Nascimento, J.H.M.; Mill, J.G.; Nogueira, F.C.S.; Campos De Carvalho, A.C. Aging-related compensated hypogonadism: Role of metabolomic analysis in physiopathological and therapeutic evaluation. J. Steroid Biochem. Mol. Biol. 2018, 183, 39–50. [Google Scholar] [CrossRef] [PubMed]
  45. Smith, C.A.; Want, E.J.; O’maille, G.; Abagyan, R.; Siuzdak, G. XCMS: Processing mass spectrometry data for metabolite profiling using nonlinear peak alignment, matching, and identification. Anal. Chem. 2006, 78, 779–787. [Google Scholar] [CrossRef]
  46. Trygg, J.; Wold, S. Orthogonal Projections to Latent Structures (O-PLS). J. Chemom. 2002, 16, 119–128. [Google Scholar] [CrossRef]
  47. Kanehisa, M.; Goto, S. KEGG: Kyoto encyclopedia of genes and genomes. Nucleic Acids Res. 2000, 28, 27–30. [Google Scholar] [CrossRef]
  48. Coneva, V.; Zhu, T.; Colasanti, J. Expression differences between normal and indeterminate1 maize suggest downstream targets of ID1, a floral transition regulator in maize. J. Exp. Bot. 2007, 58, 3679–3693. [Google Scholar] [CrossRef]
  49. Goyal, A. Osmoregulation in Dunaliella, Part II: Photosynthesis and starch contribute carbon for glycerol synthesis during a salt stress in Dunaliella tertiolecta. Plant Physiol. Biochem. 2007, 45, 705–710. [Google Scholar] [CrossRef] [PubMed]
  50. Nagao, M.; Minami, A.; Arakawa, K.; Fujikawa, S.; Takezawa, D. Rapid degradation of starch in chloroplasts and concomitant accumulation of soluble sugars associated with ABA-induced freezing tolerance in the moss Physcomitrella patens. J. Plant Physiol. 2005, 162, 169–180. [Google Scholar] [CrossRef] [PubMed]
  51. Sami, F.; Yusuf, M.; Faizan, M.; Faraz, A.; Hayat, S. Role of sugars under abiotic stress. Plant Physiol. Biochem. 2016, 109, 54–61. [Google Scholar] [CrossRef]
  52. Lu, B.; Chen, L.; Hao, J.; Zhang, Y.; Huang, J. Comparative transcription profiles reveal that carbohydrates and hormone signalling pathways mediate flower induction in Juglans sigillata after girdling. Ind. Crop. Prod. 2020, 153, 112556. [Google Scholar] [CrossRef]
  53. Wei, L.; Yu, B.; Song, E. Responses of Endogenous Hormones and Amino Acids to Flower Bud Differentiation of Cassava. Southwest China J. Agric. Sci. 2021, 34, 1400–1406. [Google Scholar]
  54. Su, H.; Xu, K.; Liu, W. Changes of endogenous homones during the process of flower bud differentiation of Welsh onion. Acta Hortic. Sin. 2007, 34, 671–676. [Google Scholar]
  55. Liu, Z.; Zeng, L.; Du, X.; Peng, Y.; Tao, Y.; Li, Y.; Qin, J. Flower Bud Differentiation and Endogenous Hormone Changes of RosaAngela’. Bull. Bot. Res. 2021, 41, 37–43. [Google Scholar]
  56. Skogerbo, G. Effects of root pruning and trunk girdling on xylem cytokinin content of apple (Malus x domestica Borkh.). Norweigain J. Agric. Sci. 1992, 6, 499–527. [Google Scholar]
  57. Kojima, K.; Yamada, Y.; Yamamoto, M. Effects of Abscisic Acid Injection on Sugar and Organic Acid Contents of Citrus Fruit. J. Jpn. Soc. Hortic. Sci. 1995, 64, 17–21. [Google Scholar] [CrossRef]
  58. Ito, A.; Yaegaki, H.; Hayama, H.; Kusaba, S.-N.-S.; Yamaguchi, I.; Yoshioka, H.J.H. Bending Shoots Stimulates Flowering and Influences Hormone Levels in Lateral Buds of Japanese Pear. HortScience 1999, 34, 1224–1228. [Google Scholar] [CrossRef]
  59. Goldschmidt, E.E. Endogenous abscisic acid and 2-trans-abscisic acid in alternate bearing ‘Wilking’ mandarin trees. Plant Growth Regul. 1984, 2, 9–13. [Google Scholar] [CrossRef]
  60. Kieber, J.J.; Schaller, G.E. Cytokinin signaling in plant development. Development 2018, 145, dev149344. [Google Scholar] [CrossRef]
  61. Jameson, P.E.; Dhandapani, P.; Novak, O.; Song, J. Cytokinins and Expression of SWEET, SUT, CWINV and AAP Genes Increase as Pea Seeds Germinate. Int. J. Mol. Sci. 2016, 17, 2013. [Google Scholar] [CrossRef]
  62. Corbesier, L.; Prinsen, E.; Jacqmard, A.; Lejeune, P.; Van Onckelen, H.; Périlleux, C.; Bernier, G. Cytokinin levels in leaves, leaf exudate and shoot apical meristem of Arabidopsis thaliana during floral transition. J. Exp. Bot. 2003, 54, 2511–2517. [Google Scholar] [CrossRef]
  63. He, Y.W.; Loh, C.S. Induction of early bolting in Arabidopsis thaliana by triacontanol, cerium and lanthanum is correlated with increased endogenous concentration of isopentenyl adenosine (iPAdos). J. Exp. Bot. 2002, 53, 505–512. [Google Scholar] [CrossRef]
  64. Song, Y.; Dou, L.; Zhang, H. Changes of endogenous hormones during flower bud formation of different blueberry varieties. Fruit Trees South. China 2014, 43, 106–108+114. [Google Scholar]
  65. Du, J.; Li, P.; Gu, Y. Study on the changes of endogenous hormones and carbohydrate content during flower bud differentiation of olive. West. For. Sci. 2018, 47, 122–126. [Google Scholar]
  66. Ai, J.; Wang, Y.P.; Li, C.Y.; Guo, X.W.; Li, A.M. The changes of three endogenous hormones during flower bud differentiation of Schisandga chinensis. China J. Chin. Mater. Medica 2006, 31, 24–26. [Google Scholar]
  67. Kinet, J.M. Environmental, Chemical, and Genetic Control of Flowering. Hortic. Rev. 2010, 15, 279–334. [Google Scholar]
  68. Grochowska, M.J.; Hodun, M. The dwarfing effect of a single application of growth inhibitors to the root-stem connection “the collar tissue” of five species of fruit trees. J. Hortic. Sci. 1997, 72, 83–91. [Google Scholar] [CrossRef]
  69. Li, Y.; Xing, L.; Zhang, D.; Shen, Y.; Zhang, S.; Han, M. Mechanism of Spraying IAA Inhibiting Flower Bud Inoculation of Fuji Young Trees. Acta Agric. Boreali-Occi-Dent. Sin. 2015, 24, 84–89. [Google Scholar]
  70. Gomes, G.L.B.; Scortecci, K.C. Auxin and its role in plant development: Structure, signalling, regulation and response mechanisms. Plant Biol. 2021, 23, 894–904. [Google Scholar] [CrossRef] [PubMed]
  71. Waadt, R.; Seller, C.A.; Hsu, P.K.; Takahashi, Y.; Munemasa, S.; Schroeder, J.I. Plant hormone regulation of abiotic stress responses. Nat. Rev. Mol. Cell Biol. 2022, 23, 516. [Google Scholar] [CrossRef]
  72. Wen, Z.; Li, M.; Meng, J.; Miao, R.; Liu, X.; Fan, D.; Lv, W.; Cheng, T.; Zhang, Q.; Sun, L. Genome-Wide Identification of the MAPK and MAPKK Gene Families in Response to Cold Stress in Prunus mume. Int. J. Mol. Sci. 2023, 24, 8829. [Google Scholar] [CrossRef]
  73. Zhao, F.; Zheng, Y.F.; Zeng, T.; Sun, R.; Yang, J.Y.; Li, Y.; Ren, D.T.; Ma, H.; Xu, Z.H.; Bai, S.N. Phosphorylation of SPOROCYTELESS/NOZZLE by the MPK3/6 Kinase Is Required for Anther Development. Plant Physiol. 2017, 173, 2265–2277. [Google Scholar] [CrossRef] [PubMed]
  74. Han, X.; Li, S.; Zhang, M.; Yang, L.; Liu, Y.; Xu, J.; Zhang, S. Regulation of GDSL Lipase Gene Expression by the MPK3/MPK6 Cascade and Its Downstream WRKY Transcription Factors in Arabidopsis Immunity. Mol. Plant-Microbe Interact. MPMI 2019, 32, 673–684. [Google Scholar] [CrossRef] [PubMed]
  75. Duan, P.G.; Rao, Y.C.; Zeng, D.L.; Yang, Y.L.; Xu, R.; Zhang, B.L.; Dong, G.J.; Qian, Q.; Li, Y.H. SMALL GRAIN 1, which encodes a mitogen-activated protein kinase kinase 4, influences grain size in rice. Plant J. 2014, 77, 547–557. [Google Scholar] [CrossRef] [PubMed]
  76. Xu, R.; Duan, P.; Yu, H.; Zhou, Z.; Zhang, B.; Wang, R.; Li, J.; Zhang, G.; Zhuang, S.; Lyu, J.; et al. Control of Grain Size and Weight by the OsMKKK10-OsMKK4-OsMAPK6 Signaling Pathway in Rice. Mol. Plant 2018, 11, 860–873. [Google Scholar] [CrossRef]
  77. Pei, L.; Gao, Y.; Feng, L.; Zhang, Z.; Liu, N.; Yang, B.; Zhao, N. Phenolic Acids and Flavonoids Play Important Roles in Flower Bud Differentiation in Mikania micrantha: Transcriptomics and Metabolomics. Int. J. Mol. Sci. 2023, 24, 16550. [Google Scholar] [CrossRef]
  78. Liu, W.; Feng, Y.; Yu, S.; Fan, Z.; Li, X.; Li, J.; Yin, H. The Flavonoid Biosynthesis Network in Plants. Int. J. Mol. Sci. 2021, 22, 12824. [Google Scholar] [CrossRef] [PubMed]
  79. Li, S.; Tian, Y.; Wu, K.; Ye, Y.; Yu, J.; Zhang, J.; Liu, Q.; Hu, M.; Li, H.; Tong, Y.; et al. Modulating plant growth–metabolism coordination for sustainable agriculture. Nature 2018, 560, 595–600. [Google Scholar] [CrossRef]
  80. He, M.; Qin, C.X.; Wang, X.; Ding, N.Z. Plant Unsaturated Fatty Acids: Biosynthesis and Regulation. Front. Plant Sci. 2020, 11, 390. [Google Scholar] [CrossRef]
  81. Vogt, T. Phenylpropanoid biosynthesis. Mol. Plant 2010, 3, 2–20. [Google Scholar] [CrossRef]
  82. Liu, J.; Zhang, S. Changes of nucleic acid content in fruit and unfruitful trees during citrus flower bud differentiation. J. Southwest Univ. 2008, 6, 56–59. [Google Scholar]
  83. Yu, Z.; Jia, D.; Liu, T. Polyamine Oxidases Play Various Roles in Plant Development and Abiotic Stress Tolerance. Plants 2019, 8, 184. [Google Scholar] [CrossRef] [PubMed]
  84. Tyagi, S.; Shumayla; Verma, P.C.; Singh, K.; Upadhyay, S.K. Molecular characterization of ascorbate peroxidase (APX) and APX-related (APX-R) genes in Triticum aestivum L. Genomics 2020, 112, 4208–4223. [Google Scholar] [CrossRef] [PubMed]
  85. Vaish, S.; Gupta, D.; Mehrotra, R.; Mehrotra, S.; Basantani, M.K. Glutathione S-transferase: A versatile protein family. 3 Biotech 2020, 10, 321. [Google Scholar] [CrossRef] [PubMed]
  86. Gho, Y.S.; Kim, S.-J.; Jung, K.H. Phenylalanine ammonia-lyase family is closely associated with response to phosphate deficiency in rice. Genes Genom. 2020, 42, 67–76. [Google Scholar] [CrossRef] [PubMed]
  87. Yuyama, I.; Ishikawa, M.; Nozawa, M.; Yoshida, M.A.; Ikeo, K. Transcriptomic changes with increasing algal symbiont reveal the detailed process underlying establishment of coral-algal symbiosis. Sci. Rep. 2018, 8, 16802. [Google Scholar] [CrossRef] [PubMed]
  88. Seo, H.; Kim, S.; Sagong, H.Y.; Son, H.F.; Jin, K.S.; Kim, I.K.; Kim, K.J. Structural basis for cytokinin production by LOG from Corynebacterium glutamicum. Sci. Rep. 2016, 6, 31390. [Google Scholar] [CrossRef]
  89. Zhang, S. Recent Advances of Polyphenol Oxidases in Plants. Molecules 2023, 28, 2158. [Google Scholar] [CrossRef]
Figure 1. A. bulbifer ‘Xitai 9’ flower bud corms and leaf bud corms. (A) Flower bud corms; (B) flower bud longitudinal section; (C) leaf bud corms; (D) leaf bud longitudinal section.
Agronomy 14 00519 g001
Figure 2. Volcano map of flower bud and leaf bud gene expression. Red dots and blue dots represent upregulated and downregulated genes, respectively, and gray dots represent nondifferentially e-pressed genes.
Agronomy 14 00519 g002
Figure 3. GO and KEGG enrichment analyses of flower buds and leaf buds. (A) GO enrichment analysis of flower buds and leaf buds. The top 10 GO term entries with the most significant enrichment in each GO category. (B) KEGG enrichment analysis of flower buds and leaf buds; the first 20 pathways with the smallest p values are associated with KEGG classification.
Agronomy 14 00519 g003
Figure 4. Comparison between the results of the qRT–PCR and RNA-seq analyses of selected DEGs. The color scale indicates log2-transformed fold changes in gene expression levels. Blue to red indicates a gradual increase in the upregulation value. On the right side are the names of gene products, on the left side are the names of gene ID in transcriptomics.
Agronomy 14 00519 g004
Figure 5. The contents of soluble sugar and starch in flower bud corms and leaf bud corms are presented as the average values of three replicates ± SEs. The data are from three biological replicates, and the error bars represent the standard error. ** indicates p ≤ 0.01.
Agronomy 14 00519 g005
Figure 6. Hormones exhibiting significant differences between flower buds and leaf buds. * p ≤ 0.05; ** p ≤ 0.01.
Agronomy 14 00519 g006
Figure 7. PCA score plot (a,b) and OPLS-DA score plot (c,d). (a,c) are positive ion modes; (b,d) are negative ion modes.
Agronomy 14 00519 g007
Table 1. Genes upregulated 5-fold or more in plant hormone signaling pathways.
Gene IDGene NamesFoldchange (Y-vs.-H)
TRINITY_DN8398_c0_g1nonexpressor of pathogenesis-related protein 1-like 5 proteins24.93
TRINITY_DN650_c1_g1indole-3-acetic acid-induced protein ARG7-like7.54
TRINITY_DN4000_c1_g1auxin-responsive protein IAA30-like5.01
TRINITY_DN1329_c1_g1indole-3-acetic acid-amido synthetase GH3.6-like6.91
TRINITY_DN72594_c0_g1BRI1 kinase inhibitor 1-like30.17
TRINITY_DN3428_c0_g1protein TIFY 6B-like6.20
TRINITY_DN7228_c0_g1transcription factor TGA2-like isoform X215.13
TRINITY_DN7013_c1_g1protein TIFY 922.51
TRINITY_DN10361_c0_g1Pathogenesis-related protein 156.05
TRINITY_DN5341_c0_g1Transcription factor HBP-1b(c1)38.52
TRINITY_DN7106_c2_g1auxin-induced protein 6B-like43.38
TRINITY_DN34019_c0_g1Transcription factor MYC26.79
TRINITY_DN5260_c1_g1auxin-induced protein 15A-like98.23
TRINITY_DN17023_c2_g1hypothetical protein ZOSMA_82G007408.18
TRINITY_DN9064_c0_g1regulatory protein NPR510.40
TRINITY_DN3222_c2_g1hypothetical protein OsI_2476021.02
Table 2. The content of 17 differentially abundant metabolites in flower buds was significantly greater than that in leaf buds in the metabolic group.
DAMMean_HMean_YFold Change_H/Ylog2(FC_H/Y)p Value
L-4-Hydroxyglutamate semialdehyde14,854,137.11737381.28.553.100.03
N, N-Dimethylaniline5,953,932,280.7118,333,143.350.325.650.01
2-Heptanone478,865,629.4988.8484,260.018.890.01
1-Pyrroline-5-carboxylic acid80,591,608.646,463,691.71.730.790.01
1-Benzyl-1,2,3,4-tetrahydroisoquinoline68,788,352.0988.86,9564.016.090.00
2-Methylbenzoic acid949,974,505.857,384,295.416.564.050.01
gamma-Glutamyl-beta-aminopropiononitrile5,588,130.7988.85,651.112.460.00
Pyrrolidonecarboxylic acid30,079,215.73,836,016.57.842.970.02
Ketoleucine26,500,401.0988.826,799.014.710.00
(R)-5,6-Dihydrothymine279,791,870.5114,946,419.62.431.280.01
Fenfluramine10,258,146.55,721,365.41.790.840.01
Sulfamethazine22,024,321.912,887,857.91.710.770.01
Porphobilinogen156,535,147.6115,434,618.31.360.440.01
Gyromitrin284,576,546.4988.8287,790.018.140.00
3-Methyl-2-oxovaleric acid180,493,405.8988.8182,530.017.480.00
Phenylethylamine81,993,597.7988.882,918.016.340.00
Capsidiol120,373,230.9105,812,770.21.140.190.02
Note: DAM: differentially accumulated metabolite; mean: mean; fold change: ploidy change; log2(FC): log2 value of ploidy change; p value: statistical p value.
Table 3. Differentially abundant metabolites and differential genes in flower buds can be mapped to the KEGG pathway together.
BiomarkerPathwayPathway IDUp NumberDown NumberTotal Numberp-ValueKEGG IDVIPlog2(FC-H/Y)p-Value
L-4-Hydroxyglutamate semialdehyde Arginine and proline metabolismko003303 355 0.874 C059381.138 3.096 0.031
1-Pyrroline-5-carboxylic acidArginine and proline metabolismko003303 543 0.507 C043221.734 0.795 0.010
γ-Glutamyl-β-aminopropiononitrileCyanoamino acid metabolismko004602 543 0.507 C061141.088 12.464 0.003
Pyrrolidonecarboxylic acidGlutathione metabolismko0048014 590 0.094 C018791.115 2.971 0.025
PhenylethylaminePhenylalanine metabolismko003609 350 0.076 C053321.392 16.339 0.003
1-Benzyl-1,2,3,4-tetrahydroisoquinolineIsoquinoline alkaloid biosynthesisko009503 120 0.375 C05201 1.478 16.086 0.003
(R)-5,6-DihydrothyminePyrimidine metabolismko002404 971 0.300 C210281.679 1.283 0.005
Disclaimer/Publisher’s Note: The statements, opinions and data contained in all publications are solely those of the individual author(s) and contributor(s) and not of MDPI and/or the editor(s). MDPI and/or the editor(s) disclaim responsibility for any injury to people or property resulting from any ideas, methods, instructions or products referred to in the content.

