
Influence of Nutrient Solutions in an NGS® Soilless System on the Yield, Quality and Shelf Life of Fresh-Cut Commercial Mint at Different Harvest Times

 , ,
, ,  ,
, 
Abstract
:1. Introduction
2. Materials and Methods
2.1. Plant Material and Growing Conditions
2.2. Raw Material Analysis
2.3. Weight Loss
2.4. Fresh-Cut Processing
2.5. Headspace Analysis
2.6. Leaf Colour
2.7. Tissue Ion and Salt Content
2.8. Browning Potential and Soluble o-Quinone Content
2.9. Microbial Analysis
2.10. Experimental Design and Statistical Analysis
3. Results
3.1. Quantitative Characteristics
3.2. Qualitative Characteristics
3.2.1. Colour Parameters
3.2.2. Weight Loss
3.2.3. Respiration Rate and Headspace Analysis
3.2.4. Mineral Ion Determinations
3.2.5. Browning Potential (BP) and Soluble o-Quinone (So-Q) Content
3.2.6. Microbial Evaluation
4. Discussion
5. Conclusions
Supplementary Materials
Author Contributions
Funding
Data Availability Statement
Acknowledgments
Conflicts of Interest
References
- Hosseini, S.J.; Tahmasebi-Sarvestani, Z.; Mokhtassi-Bidgoli, A.; Keshavarz, H.; Kazemi, S.; Khalvandi, M.; Pirdashti, H.; Hashemi-Petroudi, S.H.; Nicola, S. Functional quality, antioxidant capacity and essential oil percentage in different mint species affected by salinity stress. Chem. Biodivers. 2023, 20, e202200247. [Google Scholar] [CrossRef]
- Hosseini, S.J.; Tahmasebi-Sarvestani, Z.; Pirdashti, H.; Modarres-Sanavy, S.A.M.; Mokhtassi-Bidgoli, A.; Hazrati, S.; Nicola, S. Investigation of yield, phytochemical composition, and photosynthetic pigments in different mint ecotypes under salinity stress. Food Sci. Nutr. 2021, 9, 2620–2643. [Google Scholar] [CrossRef]
- Tucker, A.O.; Naczi, R.F.C. Mentha: An overview of its classification and relationships. In Mint: The Genus Mentha; CRC Press: Boca Raton, FL, USA, 2006; pp. 1–39. [Google Scholar] [CrossRef]
- Djenane, D.; Aïder, M.; Yangüela, J.; Idir, L.; Gómez, D.; Roncalés, P. Antioxidant and antibacterial effects of Lavandula and Mentha essential oils in minced beef inoculated with E. coli O157:H7 and S. aureus during storage at abuse refrigeration temperature. Meat Sci. 2012, 92, 667–674. [Google Scholar] [CrossRef]
- Fazal, H.; Akram, M.; Ahmad, N.; Qaisar, M.; Kanwal, F.; Rehman, G.; Ullah, I. Nutritionally rich biochemical profile in essential oil of various Mentha species and their antimicrobial activities. Protoplasma 2022, 267, 557–570. [Google Scholar] [CrossRef]
- Nair, K.P. Japanese mint. In Herbal and Acidulant Tree Spices; Springer: Cham, Switzerland, 2022; pp. 75–89. [Google Scholar]
- Tibaldi, G.; Fontana, E.; Nicola, S. Postharvest management affects spearmint and calamint essential oils. J. Sci. Food Agric. 2013, 93, 580–586. [Google Scholar] [CrossRef]
- Pignata, G.; Casale, M.; Nicola, S. Water and Nutrient Supply in Horticultural Crops Grown in Soilless Culture: Resource Efficiency in Dynamic and Intensive Systems; Springer: Cham, Switzerland, 2017; pp. 183–219. [Google Scholar] [CrossRef]
- Nicola, S.; Pignata, G.; Casale, M.; Hazrati, S.; Ertani, A. Setting up a lab-scale pilot plant to study the new growing system (NGS®) for leafy vegetable and culinary herb growth. Horticulturae 2021, 7, 90. [Google Scholar] [CrossRef]
- Zhan, L.; Bulgari, R.; Pignata, G.; Casale, M.; Nicola, S. The mixing ratio and filling-amount affect the tissue browning and antioxidant properties of fresh-cut baby leaf lettuce (Lactuca sativa L.) and rocket (Eruca sativa Mill.) grown in floating growing systems. Foods 2022, 11, 3515. [Google Scholar] [CrossRef]
- Luna, M.C.; Martínez-Sánchez, A.; Selma, M.V.; Tudela, J.A.; Baixauli, C.; Gil, M.I. Influence of nutrient solutions in an open-field soilless system on the quality characteristics and shelf life of fresh-cut red and green lettuces (Lactuca sativa L.) in different seasons. J. Sci. Food Agric. 2013, 93, 415–421. [Google Scholar] [CrossRef]
- Yang, T.; Kim, H.J. Characterizing nutrient composition and concentration in tomato-, basil-, and lettuce-based aquaponic and hydroponic systems. Water 2020, 12, 1259. [Google Scholar] [CrossRef]
- Fontana, E.; Nicola, S. Traditional and soilless culture systems to produce corn salad (Valerianella olitoria L.) and rocket (Eruca sativa Mill.) with low nitrate content. J. Food Agric. Environ. 2009, 7, 405–410. [Google Scholar]
- Azizoglu, U.; Yilmaz, N.; Simsek, O.; Ibal, J.C.; Tagele, S.B.; Shin, J.H. The fate of plant growth-promoting rhizobacteria in soilless agriculture: Future perspectives. 3Biotech 2021, 11, 382. [Google Scholar] [CrossRef]
- Iglesias, M.J.; López, J.G.; Collados Luján, J.F.; Ortiz, F.L.; Pereznieto, H.B.; Toresano, F.; Camacho, F. Effect of genetic and phenotypic factors on the composition of commercial marmande type tomatoes studied through HRMAS NMR spectroscopy. Food Chem. 2014, 142, 382. [Google Scholar] [CrossRef]
- Walters, K.J. Quantifying the Effects of Hydroponic Systems, Nutrient Solution, and Air Temperature on Growth and Development of Basil (Ocimum L.) Species. Master’s Thesis, Iowa State University, Ames, IO, USA, 2015. [Google Scholar] [CrossRef]
- Nicola, S.; Pignata, G.; Tibaldi, G. The floating growing system can assure a low microbial contamination of baby leaf vegetables at harvest. Acta Hortic. 2018, 1209, 57–63. [Google Scholar] [CrossRef]
- Pignata, G.; Niñirola, D.; Casale, M.; Lo Turco, P.E.; Egea-Gilabert, C.; Fernández, J.A.; Nicola, S. Inherent quality and safety of watercress grown in a floating system using Bacillus subtilis. Hortic. J. 2016, 85, 148–153. [Google Scholar] [CrossRef]
- Brown, B.; Hart, J.M.; Wescott, M.P.; Christensen, N.W.C. The critical role of nutrient management in mint production. Better Crops 2003, 87, 9–11. [Google Scholar]
- Skálová, H.; Moravcová, L.; Dixon, A.F.G.; Kindlmann, P.; Pyšek, P. Effect of temperature and nutrients on the growth and development of seedlings of an invasive plant. AoB Plants 2015, 7, plv044. [Google Scholar] [CrossRef]
- Loera-Muro, A.; Troyo-Diéguez, E.; Murillo-Amador, B.; Barraza, A.; Caamal-Chan, G.; Lucero-Vega, G.; Nieto-Garibay, A. Effects of vermicompost leachate versus inorganic fertilizer on morphology and microbial traits in the early development growth stage in mint (Mentha spicata L.) and rosemary (Rosmarinus officinalis L.) plants under closed hydroponic system. Horticulturae 2021, 7, 100. [Google Scholar] [CrossRef]
- Hoque, M.M.; Ajwa, H.; Othman, M.; Smith, R.; Cahn, M. Yield and postharvest quality of lettuce in response to nitrogen, phosphorus, and potassium fertilizers. HortScience 2010, 45, 1539–1544. [Google Scholar] [CrossRef]
- Hassan, S.M.; El-Bebany, A.F.; Salem, M.Z.; Komeil, D.A. Productivity and post-harvest fungal resistance of hot pepper as affected by potassium silicate, clove extract foliar spray and nitrogen application. Plants 2021, 10, 662. [Google Scholar] [CrossRef]
- Poulsen, N.; Johansen, A.S.; Sørensen, J.N. Influence of growth conditions on the value of crisphead lettuce—4. Quality changes during storage. Plant Foods Hum. Nutr. 1995, 47, 157–162. [Google Scholar] [CrossRef]
- Adel Mahmoodabad, H.; Hokmalipoor, S.; Shaban, M.; Ashrafi Parchin, R. Effect of foliar spray of urea and soil application of vermicompost on essential oil and chlorophyll content of green Mint (Mentha spicata L.). Int. J. Adv. Biol. Biomed. Res. 2014, 2, 2104–2108. [Google Scholar]
- Parrey, Z.A.; Shah, S.H.; Fayaz, M.; Casini, R.; Elansary, H.O.; Mohammad, F. Nitrogen supplementation modulates morphological, biochemical, yield and quality attributes of peppermint. Plants 2023, 12, 809. [Google Scholar] [CrossRef]
- Hasanuzzaman, M.; Bhuyan, M.H.M.B.; Nahar, K.; Hossain, M.S.; Al Mahmud, J.; Hossen, M.S.; Masud, A.A.; Moumita, C.; Fujita, M. Potassium: A vital regulator of plant responses and tolerance to abiotic stresses. Agronomy 2018, 8, 31. [Google Scholar] [CrossRef]
- Ryu, D.H.; Cho, J.Y.; Yang, S.H.; Kim, H.Y. Effects of harvest timing on phytochemical composition in Lamiaceae plants under an environment-controlled system. Antioxidants 2023, 12, 1909. [Google Scholar] [CrossRef]
- Marcum, D.B.; Hanson, B.R. Effect of irrigation and harvest timing on peppermint oil yield in California. Agric. Water Manag. 2006, 82, 118–128. [Google Scholar] [CrossRef]
- Machiani, M.A.; Javanmard, A.; Morshedloo, M.R.; Maggi, F. Evaluation of yield, essential oil content and compositions of peppermint (Mentha piperita L.) intercropped with faba bean (Vicia faba L.). J. Clean. Prod. 2018, 171, 529–537. [Google Scholar] [CrossRef]
- Luetic, S.; Knezovic, Z.; Jurcic, K.; Majic, Z.; Tripkovic, K.; Sutlovic, D. Leafy vegetable nitrite and nitrate content: Potential health effects. Foods 2023, 12, 1655. [Google Scholar] [CrossRef]
- Bian, Z.; Wang, Y.; Zhang, X.; Li, T.; Grundy, S.; Yang, Q.; Cheng, R. A review of environment effects on nitrate accumulation in leafy vegetables grown in controlled environments. Foods 2020, 9, 732. [Google Scholar] [CrossRef]
- Nicola, S.; Hoeberechts, J.; Fontana, E. Comparison between traditional and soilless culture systems to produce rocket (Eruca sativa) with low nitrate content. Acta Hortic. 2005, 697, 549–555. [Google Scholar] [CrossRef]
- Nicola, S.; Pignata, G.; Casale, M.; Lo Turco, P.E.; Gaino, W. Overview of a lab-scale pilot plant for studying baby leaf vegetables grown in soilless culture. Hortic. J. 2016, 85, 97–104. [Google Scholar] [CrossRef]
- Couture, R.; Cantwell, M.I.; Ke, D.; Saltveit, M.E. Physiological attributes related to quality attributes and storage life of minimally processed lettuce. HortScience 1993, 28, 723–725. [Google Scholar] [CrossRef]
- Loaiza-Velarde, J.G.; Saltveit, M.E. Heat shocks applied either before or after wounding reduce browning of lettuce leaf tissue. J. Am. Soc. Hortic. Sci. 2001, 126, 227–234. [Google Scholar] [CrossRef]
- Fageria, N.K. Nitrogen Management in Crop Production; CRC Press: Boca Raton, FL, USA, 2014. [Google Scholar]
- Mangal, V.; Lal, M.K.; Tiwari, R.K.; Altaf, M.A.; Sood, S.; Kumar, D.; Aftab, T. Molecular insights into the role of reactive oxygen, nitrogen and sulphur species in conferring salinity stress tolerance in plants. J. Plant Growth Regul. 2003, 42, 554–574. [Google Scholar] [CrossRef]
- Baek, J.P.; Park, K.W.; Craker, L.E.; Kang, H.M. Changes in growth and quality of three mint cultivars at different harvesting periods. Hortic. Environ. Biotechnol. 2016, 57, 207–212. [Google Scholar] [CrossRef]
- Bindraban, P.S.; Dimkpa, C.; Nagarajan, L.; Roy, A.; Rabbinge, R. Revisiting fertilisers and fertilisation strategies for improved nutrient uptake by plants. Biol. Fertil. Soils 2015, 51, 897–911. [Google Scholar] [CrossRef]
- Hosseini, S.J.; Tahmasebi-Sarvestani, Z.; Pirdashti, H.; Modarres-Sanavy, S.A.M.; Mokhtassi-Bidgoli, A.; Hazrati, S.; Nicola, S. Assessment of salinity indices to identify mint ecotypes using intelligent and regression models. Int. J. Hortic. Sci. Technol. 2020, 7, 119–137. [Google Scholar] [CrossRef]
- Savvas, D.; Adamidis, K. Automated management of nutrient solutions based on target electrical conductivity, pH, and nutrient concentration ratios. J. Plant Nutr. 1999, 22, 1415–1432. [Google Scholar] [CrossRef]
- Zeljković, S.Ć.; Aucique-Perez, C.E.; Štefelová, N.; De Diego, N. Optimizing growing conditions for hydroponic farming of selected medicinal and aromatic plants. Food Chem. 2022, 375, 131845. [Google Scholar] [CrossRef]
- Roosta, H.R. Effects of foliar spray of K on mint, radish, parsley and coriander plants in aquaponic system. J. Plant Nutr. 2014, 37, 2236–2254. [Google Scholar] [CrossRef]
- Kalve, S.; Sizani, B.L.; Markakis, M.N.; Helsmoortel, C.; Vandeweyer, G.; Laukens, K.; Sommen, M.; Naulaerts, S.; Vissenberg, K.; Prinsen, E.; et al. Osmotic stress inhibits leaf growth of Arabidopsis thaliana by enhancing ARF-mediated auxin responses. New Phytol. 2020, 226, 1766–1780. [Google Scholar] [CrossRef]
- Atieno, J.; Li, Y.; Langridge, P.; Dowling, K.; Brien, C.; Berger, B.; Varshney, R.K.; Sutton, T. Exploring genetic variation for salinity tolerance in chickpea using image-based phenotyping. Sci. Rep. 2017, 7, 1300. [Google Scholar] [CrossRef] [PubMed]
- Miceli, A.; Moncada, A.; Vetrano, F.; D’Anna, F. First results on yield and quality response of Basil (Ocimum basilicum L.) grown in a floating system. Acta Hortic. 2003, 609, 377–381. [Google Scholar] [CrossRef]
- Petropoulos, S.A.; El-Nakhel, C.; Graziani, G.; Kyriacou, M.C.; Rouphael, Y. The effects of nutrient solution feeding regime on yield, mineral profile, and phytochemical composition of spinach microgreens. Horticulturae 2021, 7, 162. [Google Scholar] [CrossRef]
- Hutsol, T.; Priss, O.; Kiurcheva, L.; Serdiuk, M.; Panasiewicz, K.; Jakubus, M.; Kukharets, M. Mint plants (Mentha) as a promising source of biologically active substances to combat hidden hunger. Sustainability 2023, 15, 11648. [Google Scholar] [CrossRef]
- Rizzo, V.; Muratore, G. Effects of packaging on shelf life of fresh celery. J. Food Eng. 2009, 90, 124–128. [Google Scholar] [CrossRef]
- Brindisi, L.J.; Simon, J.E. Preharvest and postharvest techniques that optimize the shelf life of fresh basil (Ocimum basilicum L.): A review. Front. Plant Sci. 2023, 14, 1237577. [Google Scholar] [CrossRef]
- Scuderi, D.; Giuffrida, F.; Noto, G. Effects of nutrient solution EC on yield, quality and shelf-life of lettuce grown in floating system. Acta Hortic. 2009, 807, 221–226. [Google Scholar] [CrossRef]
- Giménez, A.; Fernández, J.A.; Pascual, J.A.; Ros, M.; Saez-Tovar, J.; Martinez-Sabater, E.; Gruda, N.S.; Egea-Gilabert, C. Promising composts as growing media for the production of baby leaf lettuce in a floating system. Agronomy 2020, 10, 1540. [Google Scholar] [CrossRef]
- Moorby, H.; Nye, P.H.; White, R.E. The effect of phosphate nutrition of young rape plants on nitrate reductase activity and xylem exudation, and their relation to H ion efflux from the roots. Plant Soil 1988, 105, 257–263. [Google Scholar] [CrossRef]
- Xu, X.; Du, X.; Wang, F.; Sha, J.; Chen, Q.; Tian, G.; Zhu, Z.; Ge, S.; Jiang, Y. Effects of potassium levels on plant growth, accumulation and distribution of carbon, and nitrate metabolism in apple dwarf rootstock seedlings. Front. Plant Sci. 2020, 11, 904. [Google Scholar] [CrossRef]
- Fallovo, C.; Rouphael, Y.; Rea, E.; Battistelli, A.; Colla, G. Nutrient solution concentration and growing season affect yield and quality of Lactuca sativa L. var. acephala in floating raft culture. J. Sci. Food Agric. 2009, 89, 1682–1689. [Google Scholar] [CrossRef]
- Vanegas, D.E.; Contreras, A.; Bustamante, A.I.; Tapia, M.L.; Lizana, L.A.; Escalona, V.H. Effect of nitrogen concentration in the nutritional solution and harvest time on nitrate content in baby leaf Swiss chard crop in a hydroponic system. Acta Hortic. 2016, 1141, 191–198. [Google Scholar] [CrossRef]
- Hachiya, T.; Sakakibara, H. Interactions between nitrate and ammonium in their uptake, allocation, assimilation, and signaling in plants. J. Exp. Bot. 2017, 68, 2501–2512. [Google Scholar] [CrossRef]
- Rasmusson, A.G.; Escobar, M.A.; Hao, M.; Podgórska, A.; Szal, B. Mitochondrial NAD(P)H oxidation pathways and nitrate/ammonium redox balancing in plants. Mitochondrion 2020, 53, 158–165. [Google Scholar] [CrossRef]
- Wang, W.; Hu, B.; Li, A.; Chu, C. NRT1.1s in plants: Functions beyond nitrate transport. J. Exp. Bot. 2020, 71, 4373–4379. [Google Scholar] [CrossRef]
- Atkin, O.K.; Cummins, W.R. The effect of root temperature on the induction of nitrate reductase activities and nitrogen uptake rates in arctic plant species. Plant Soil 1994, 159, 187–197. [Google Scholar] [CrossRef]
- Liu, Z.; Yan, H.; Wang, K.; Kuang, T.; Zhang, J.; Gui, L.; An, X.; Chang, W. Crystal structure of spinach major light-harvesting complex at 2.72 A resolution. Nature 2004, 428, 287–292. [Google Scholar] [CrossRef]
- Conesa, E.; Fernandez, J.A.; Ninirola, D.; Egea-Gilabert, C. Nutrient solution aeration and growing cycles affect quality and yield of fresh-cut baby leaf red lettuce. Agric. Food Sci. 2015, 24, 313–322. [Google Scholar] [CrossRef]
- Zhao, H.; Li, X.; Jiang, Y. Response of nitrogen losses to excessive nitrogen fertilizer application in intensive greenhouse vegetable production. Sustainability 2019, 11, 1513. [Google Scholar] [CrossRef]
- Colla, G.; Kim, H.J.; Kyriacou, M.C.; Rouphael, Y. Nitrate in fruits and vegetables. Sci. Hortic. 2018, 237, 221–238. [Google Scholar] [CrossRef]
- IS Mahlangu, R.; Maboko, M.M.; Mudau, F.N.; Amoo, S.O. Nitrogen levels, plant density and postharvest storage duration affect phytochemical and antioxidant properties of field-grown basil and rocket crops. Int. J. Veg. Sci. 2021, 27, 515–525. [Google Scholar] [CrossRef]
- Giacalone, G.; Chiabrando, V. Effect of different treatments with calcium salts on sensory quality of fresh-cut apple. J. Food Nutr. Res. 2013, 52, 79–86. [Google Scholar]
- Larbi, A.; Kchaou, H.; Gaaliche, B.; Gargouri, K.; Boulal, H.; Morales, F. Supplementary potassium and calcium improves salt tolerance in olive plants. Sci. Hortic. 2020, 260, 108912. [Google Scholar] [CrossRef]
- Olivos, A.; Johnson, S.; Xiaoqiong, Q.; Crisosto, H.C. Fruit phosphorous and nitrogen deficiencies affect “grand pearl” nectarine flesh browning. HortScience 2012, 47, 391–394. [Google Scholar] [CrossRef]
- Thor, K. Calcium—nutrient and messenger. Front. Plant Sci. 2019, 10, 440. [Google Scholar] [CrossRef]
- Abbott, J.A.; Buta, J.G. Effect of antibrowning treatment on color and firmness of fresh-cut pears. J. Food Qual. 2002, 25, 333–341. [Google Scholar] [CrossRef]
- Selma, M.V.; Luna, M.C.; Martínez-Sánchez, A.; Tudela, J.A.; Beltrán, D.; Baixauli, C.; Gil, M.I. Sensory quality, bioactive constituents and microbiological quality of green and red fresh-cut lettuces (Lactuca sativa L.) are influenced by soil and soilless agricultural production systems. Postharvest Biol. Technol. 2012, 63, 16–24. [Google Scholar] [CrossRef]


| N6P2K6 | N12P2K6 | N6P4K12 | N12P4K12 | |
|---|---|---|---|---|
| N | 6.0 | 12.0 | 6.0 | 12.0 |
| P | 2.0 | 2.0 | 4.0 | 4.0 |
| K | 6.0 | 6.0 | 12.0 | 12.0 |
| Ca | 2.5 | 2.5 | 2.5 | 2.5 |
| Mg | 2.0 | 2.0 | 2.0 | 2.0 |
| HNS | Harvest Time | LFW (g/plant) | Yield (g m−2) | LDG (g/plant/d) |
|---|---|---|---|---|
| N6P2K6 | I harvest | 17.9 ± 1.3 cd | 719.4 ± 52.9 cd | 0.43 ± 0.03 c–e |
| II harvest, regrowth | 29.9 ± 2.6 a | 1199.5 ± 105.7 a | 0.72 ± 0.07 a | |
| III harvest, regrowth | 21.9 ± 3.5 b | 877.6 ± 138.3 b | 0.67 ± 0.09 a | |
| N12P2K6 | I harvest | 19.2 ± 0.9 bc | 766.7 ± 36.4 bc | 0.45 ± 0.02 cd |
| II harvest, regrowth | 30.1 ± 2.0 a | 1201.8 ± 80.2 a | 0.72 ± 0.05 a | |
| III harvest, regrowth | 18.2 ± 2.1 cd | 729.4 ± 85.1 cd | 0.56 ± 0.06 b | |
| N6P4K12 | I harvest | 13.6 ± 1.2 ef | 544.7 ± 46.4 ef | 0.32 ± 0.03 f |
| II harvest, regrowth | 20.3 ± 1.9 bc | 812.9 ± 79.2 bc | 0.49 ± 0.05 bc | |
| III harvest, regrowth | 15.1 ± 1.7 de | 605.9 ± 66.2 de | 0.46 ± 0.04 c | |
| N12P4K12 | I harvest | 14.3 ± 0.5 ef | 571.5 ± 20.0 ef | 0.34 ± 0.01 ef |
| II harvest, regrowth | 20.1 ± 1.7 bc | 802.8 ± 66.9 bc | 0.49 ± 0.03 bc | |
| III harvest, regrowth | 11.8 ± 1.6 f | 470.2 ± 65.8 f | 0.36 ± 0.05 d–f |
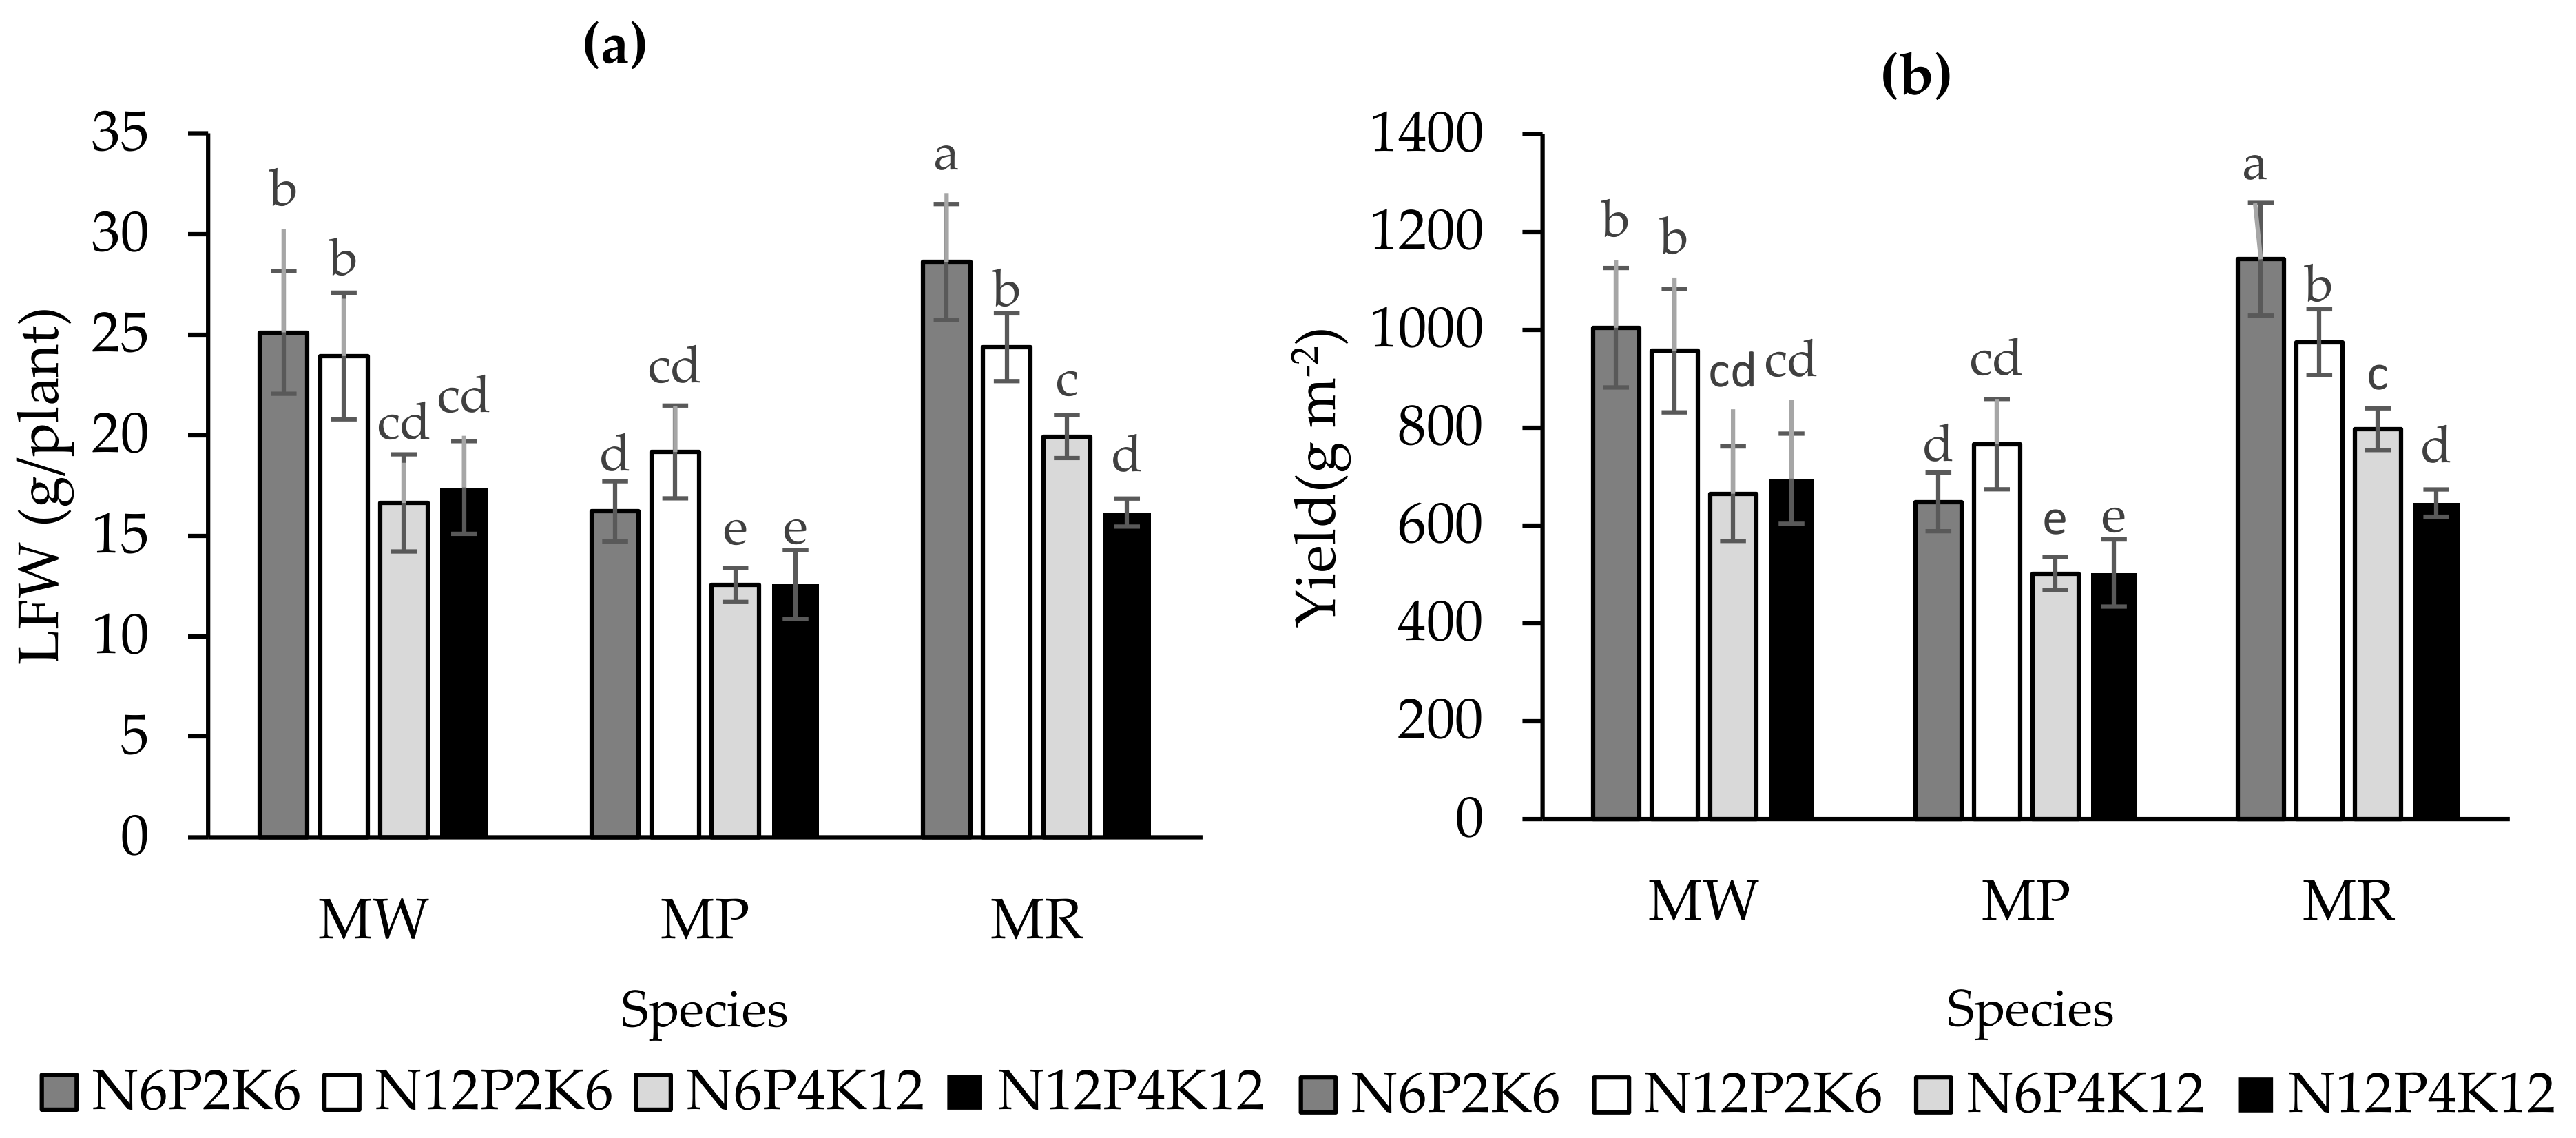
| Species | Harvest Time | DM (%) | LFW (g/plant) | Yield (g m−2) | LDG (g/plant/d) |
|---|---|---|---|---|---|
| MW | I harvest | 18.2 ± 0.3 c | 14.1 ± 0.9 e | 562.1 ± 37.6 e | 0.38 ± 0.0 de |
| II harvest, regrowth | 16.0 ± 0.4 de | 30.8 ± 1.6 a | 1233.9 ± 63.9 a | 0.67 ± 0.04 ab | |
| III harvest, regrowth | 19.7 ± 0.3 b | 17.4 ± 1.6 d | 695.5 ± 65.3 d | 0.58 ± 0.05 c | |
| MP | I harvest | 17.2 ± 0.3 cd | 16.6 ± 0.9 de | 662.4 ± 37.1 de | 0.34 ± 0.02 e |
| II harvest, regrowth | 17.2 ± 0.3 cd | 18.4 ± 1.4 d | 734.8 ± 57.4 d | 0.44 ± 0.03 d | |
| III harvest, regrowth | 22.7 ± 0.6 a | 10.4 ± 1.5 f | 417.1 ± 58.4 f | 0.35 ± 0.05 e | |
| MR | I harvest | 17.8 ± 0.3 cd | 18.2 ± 1.1 d | 727.2 ± 45.1 d | 0.43 ± 0.03 d |
| II harvest, regrowth | 16.1 ± 0.3 e | 26.1 ± 2.1 b | 1044.1 ± 84.2 b | 0.71 ± 0.06 a | |
| III harvest, regrowth | 19.3 ± 0.4 b | 22.5 ± 2.1 c | 899.8 ± 83.5 c | 0.61 ± 0.06 bc |
| HNS | Species | Harvest Time | |||||
|---|---|---|---|---|---|---|---|
| I Harvest | II Harvest, Regrowth | III Harvest, Regrowth | |||||
| L* | b* | L* | b* | L* | b* | ||
| N6P2K6 | MW | 43.7 ± 0.3 a–c | 27.0 ± 0.1 a | 39.5 ± 0.9 cd | 19.8 ± 0.8 cd | 44.8 ± 0.4 a | 23.4 ± 1.1 a |
| MP | 42.8 ± 0.8 b–d | 21.5 ± 0.9 cd | 38.3 ± 0.7 de | 14.2 ± 0.7 fg | 42.9 ± 0.9 bc | 20.1 ± 1.1 b | |
| MR | 44.1 ± 0.4 ab | 24.6 ± 0.5 b | 43.9 ± 0.8 a | 23.6 ± 1.6 a | 44.6 ± 0.8 ab | 22.6 ± 0.5 a | |
| N12P2K6 | MW | 39.7 ± 0.1 e | 19.2 ± 1.0 e | 38.7 ± 0.4 de | 15.8 ± 0.3 ef | 37.8 ± 0.3 g | 13.5 ± 0.3 e |
| MP | 38.9 ± 0.3 ef | 15.1 ± 0.4 f | 37.5 ± 0.2 e | 12.3 ± 0.3 g | 39.2 ± 1.1 fg | 13.9 ± 1.1 de | |
| MR | 39.9 ± 0.1 e | 17.7 ± 0.1 e | 40.9 ± 0.4 bc | 18.8 ± 1.3 cd | 40.9 ± 0.2 de | 16.5 ± 0.1 c | |
| N6P4K12 | MW | 42.7 ± 0.3 cd | 25.3 ± 0.6 ab | 41.4 ± 0.1 b | 21.0 ± 0.1 bc | 41.6 ± 0.5 cd | 18.9 ± 0.2 b |
| MP | 43.6 ± 0.2 a–c | 22.9 ± 0.2 c | 38.1 ± 0.5 de | 13.3 ± 0.6 fg | 40.7 ± 0.6 def | 16.6 ± 1.0 c | |
| MR | 44.3 ± 0.3 a | 24.6 ± 0.5 b | 44.3 ± 0.5 a | 23.6 ± 1.4 ab | 43.4 ± 0.4 ab | 19.8 ± 0.5 b | |
| N12P4K12 | MW | 38.3 ± 0.3 f | 18.9 ± 0.6 e | 39.3 ± 0.7 cd | 17.7 ± 0.7 de | 39.2 ± 0.4 efg | 16.0 ± 0.3 c |
| MP | 39.9 ± 0.2 e | 17.6 ± 0.4 e | 38.1 ± 0.2 de | 12.4 ± 0.5 g | 39.5 ± 0.4 ef | 15.5 ± 0.6 cd | |
| MR | 41.6 ± 0.1 d | 21.1 ± 0.7 d | 40.9 ± 0.5 bc | 18.6 ± 0.8 cd | 40.7 ± 0.2 def | 16.2 ± 0.1 c | |
| I Harvest | II Harvest, Regrowth | III Harvest, Regrowth | ||||||||
|---|---|---|---|---|---|---|---|---|---|---|
| Species | Storage (Days at 4 °C) | NO3− mg kg−1 | CaCO3 mg g−1 | PO43− mg g−1 | NO3− mg kg−1 | CaCO3 mg g−1 | PO43− mg g−1 | NO3− mg kg−1 | CaCO3 mg g−1 | PO43− mg g−1 |
| MV | 0 | 251.5 ± 67.5 b | 0.14 ± 0.02 c | 0.40 ± 0.034 c | 743.3 ± 161.3 c | 0.36 ± 0.02 ab | 0.52 ± 0.05 ab | 1145.5 ± 205.9 b | 0.49 ± 0.05 b | 0.50 ± 0.05 b |
| 9 | 129.7 ± 33.6 b | 1.08 ± 0.15 a | 0.27 ± 0.04 d | 735.0 ± 168.8 c | 0.27 ± 0.02 b | 0.57 ± 0.02 a | 1077.3 ± 152.7 b | 0.45 ± 0.06 b | 0.64 ± 0.10 b | |
| MP | 0 | 503.6 ± 137.7 a | 0.37 ± 0.05 c | 0.67 ± 0.05 b | 1120.8 ± 146.3 b | 0.32 ± 0.04 b | 0.45 ± 0.01 bc | 2024.3 ± 435.1 a | 1.92 ± 0.23 a | 1.12 ± 0.14 a |
| 9 | 626.3 ± 88.0 a | 0.64 ± 0.06 b | 0.87 ± 0.08 a | 1504.3 ± 110.6 a | 0.43 ± 0.02 a | 0.44 ± 0.04 cd | - | - | - | |
| MR | 0 | 135.8 ± 40.9 b | 0.61 ± 0.06 b | 0.39 ± 0.03 c | 578.3 ± 89.9 c | 0.45 ± 0.07 a | 0.42 ± 0.03 de | 1137.0 ± 173.6 b | 0.50 ± 0.07 b | 0.62 ± 0.06 b |
| 9 | 144.2 ± 35.1 b | 0.44 ± 0.07 bc | 0.47 ± 0.06 c | 649.2 ± 93.7 c | 0.30 ± 0.04 b | 0.36 ± 0.04 e | 1354.3 ± 204.3 b | 0.51 ± 0.07 b | 0.57 ± 0.08 b | |
| HNS | ||||||||||
| N6P2K6 | 0 | 106.7 ± 29.2 c | 0.53 ± 0.07 bc | 0.45 ± 0.06 cd | 391.1 ± 49.0 e | 0.38 ± 0.05 bc | 0.39 ± 0.04 cb | 814.4 ± 109.9 de | 1.10 ± 0.24 bc | 0.66 ± 0.16 bc |
| 9 | 303.8 ± 125.2 b | 0.59 ± 0.08 b | 0.46 ± 0.12 bcd | 548.7 ± 147.5 de | 0.31 ± 0.04 cd | 0.35 ± 0.05 c | 756.0 ± 58.1 e | 0.67 ± 0.10 cd | 0.37 ± 0.04 c | |
| N12P2K6 | 0 | 663.9 ± 163.9 a | 0.57 ± 0.05 b | 0.36 ± 0.03 de | 1343.3 ± 146.1 a | 0.50 ± 0.08 a | 0.41 ± 0.04 ab | 2227.3 ± 261.4 a | 1.02 ± 0.24 a | 0.69 ± 0.09 ab |
| 9 | 497.8 ± 93.8 a | 0.91 ± 0.18 a | 0.31 ± 0.07 e | 1477.8 ± 134.7 a | 0.45 ± 0.04 ab | 0.46 ± 0.03 cb | 1479.3 ± 304.4 a | 0.55 ± 0.07 ab | 0.35 ± 0.10 bc | |
| N6P4K12 | 0 | 102.9 ± 38.0 c | 0.40 ± 0.07 bc | 0.58 ± 0.07 bc | 537.8 ± 120.0 e | 0.30 ± 0.02 cd | 0.38 ± 0.05 cb | 641.4 ± 125.5 e | 0.39 ± 0.06 cd | 0.58 ± 0.08 bc |
| 9 | 102.0 ± 4.0 c | 0.53 ± 0.07 bc | 0.76 ± 0.11 a | 764.4 ± 193.6 cd | 0.30 ± 0.04 cd | 0.52 ± 0.05 a | 943.3 ± 263.1 dc | 0.32 ± 0.05 cd | 0.95 ± 0.11 a | |
| N12P4K12 | 0 | 314.3± 57.9 b | 0.34 ± 0.03 c | 0.51 ± 0.07 bc | 984.4 ± 136.8 bc | 0.38 ± 0.04 cd | 0.51 ± 0.05 a | 1385.0 ± 89.6 bc | 0.33 ± 0.03 d | 0.74 ± 0.09 a |
| 9 | 296.0 ± 95.0 b | 0.83 ± 0.19 a | 0.59 ± 0.09 b | 1060.4 ± 162.9 b | 0.27 ± 0.02 d | 0.48 ± 0.05 ab | 1610.2 ± 126.2 b | 0.44 ± 0.09 cd | 0.60 ± 0.07 ab | |
| Harvest time | 298.5 ± 38.1 b | 0.59 ± 0.04 b | 0.50 ± 0.03 ab | 888.5 ± 64.7 a | 0.35 ± 0.02 c | 0.44 ± 0.02 b | 1272.5 ± 99.2 a | 0.64 ± 0.07 b | 0.64 ± 0.04 b | |
| I Harvest | II Harvest, Regrowth | III Harvest, Regrowth | |||||
|---|---|---|---|---|---|---|---|
| Species | Storage (Days at 4 °C) |
BP (A340 LFW) | So-Q (A437 LFW) |
BP (A340 LFW) | So-Q (A437 LFW) |
BP (A340 LFW) | So-Q (A437 LFW) |
| MV | 0 | 29.3 ± 3.4 a | 1.8 ± 0.16 ab | 16.3 ± 2.5 b | 2.5 ± 0.2 b | 27.2 ± 4.5 a | 2.9 ± 0.2 a |
| 9 | 23.9 ± 5.3 ab | 1.7 ± 0.25 b | 9.2 ± 0.6 c | 2.1 ± 0.1 bc | 28.9 ± 4.4 a | 2.8 ± 0.1 a | |
| MP | 0 | 33.8 ± 3.1 a | 2.2 ± 0.17 a | 16.6 ± 1.6 b | 1.9 ± 0.2 c | 26.0 ± 3.4 a | 3.1 ± 0.5 a |
| 9 | 24.4 ± 2.6 ab | 2.3 ± 0.22 a | 21.2 ± 2.0 a | 1.4 ± 0.1 d | |||
| MR | 0 | 16.6 ± 1.3 bc | 1.1 ± 0.15 b | 10.8 ± 0.8 c | 3.2 ± 0.2 a | 9.8 ± 1.2 b | 2.1 ± 0.3 b |
| 9 | 12.3 ± 1.7 c | 1.6 ± 0.15 b | 8.3 ± 0.5 c | 2.4 ± 0.2 bc | 26.2 ± 4.4 a | 2.8 ± 0.3 a | |
| HNS | |||||||
| N6P2K6 | 0 | 31.2 ± 4.6 a | 2.3 ± 0.23 a | 19.1 ± 3.0 a | 2.9 ± 0.3 a | 22.0 ± 5.6 b | 2.1 ± 0.2 b |
| 9 | 28.6 ± 6.8 ab | 1.9 ± 0.21 ab | 13.0 ± 2.2 ab | 1.7 ± 0.2 c | 38.9 ± 6.2 a | 3.4 ± 0.2 a | |
| N12P2K6 | 0 | 16.4 ± 1.7 c | 1.5 ± 0.22 b | 10.7 ± 1.0 b | 2.6 ± 0.3 ab | 17.1 ± 2.8 b | 2.7 ± 0.4 ab |
| 9 | 15.1 ± 2.5 c | 2.0 ± 0.28 ab | 10.6 ± 2.5 b | 1.8 ± 0.2 c | 22.8 ± 5.7 b | 2.7 ± 0.4 ab | |
| N6P4K12 | 0 | 32.1 ± 3.8 a | 1.7 ± 0.15 ab | 16.2 ± 1.9 ab | 2.2 ± 0.3 bc | 28.6 ± 7.3 ab | 3.2 ± 0.3 a |
| 9 | 18.6 ± 3.9 bc | 1.8 ± 0.29 ab | 14.7 ± 3.0 ab | 2.0 ± 0.2 bc | 26.4 ± 9.1 ab | 2.5 ± 0.3 ab | |
| N12P4K12 | 0 | 26.8 ± 3.4 abc | 1.8 ± 0.20 ab | 12.1 ± 1.2 b | 2.4 ± 0.3 abc | 12.6 ± 1.8 b | 2.6 ± 0.2 ab |
| 9 | 18.3 ± 5.3 bc | 1.7 ± 0.29 ab | 13.4 ± 2.2 ab | 2.2 ± 0.3 abc | 22.3 ± 2.2 b | 2.7 ± 0.2 ab | |
| Harvest time | 23.4 ± 1.6 a | 1.8 ± 0.08 c | 13.7 ± 0.8 b | 2.2 ± 0.1 b | 23.3 ± 2.0 a | 2.7 ± 0.1 a | |
| I Harvest | II Harvest, Regrowth | III Harvest, Regrowth | ||||||||
|---|---|---|---|---|---|---|---|---|---|---|
| HNS | Species | TBC | MC | TYC | TBC | MC | TYC | TBC | MC | TYC |
| MV | N6P2K6 | 1360.7 ± 46.7 c | 481 ± 53.1 cd | 19.3 ± 0.6 c | 1581 ± 70.6 b | 513.3 ± 81.9 abcd | 6 ± 1.1 bc | 860.3 ± 40.9 ab | 412 ± 115.9 a | 4.6 ± 1.8 d |
| N12P2K6 | 1418 ± 68.1 c | 474 ± 57.8 d | 24 ± 3.1 c | 425 ± 8.3 b | 733.3 ± 70.5 ab | 4 ± 0.6 c | 249.3 ± 71.5 cd | 227.3 ± 34.7 a | 0.0 ± d | |
| N6P4K12 | 1123.7 ± 28.4 c | 580.3 ± 60.1 bcd | 44.7 ± 6.7 | 697 ± 31.2 b | 693.3 ± 70.5 ab | 12 ± 2.3 bc | 142.7 ± 24.8 d | 238.7 ± 67.5 a | 0.0 ± d | |
| N12P4K12 | 843 ± 63.4 c | 482 ± 56.6 cd | 31.3 ± 1.7 c | 530 ± 88.1 b | 746.7 ± 89.7 ab | 8 ± 2 bc | 262.7 ± 19.1 cd | 248.3 ± 19.2 | 6 ± 1.1 d | |
| MP | N6P2K6 | 1706 ± 13.1 c | 1413.3 ± 420.5 a | 346.7 ± 17.6 a | 221 ± 65.6 b | 384 ± 66.2 bcd | 20 ± 3.1 bc | |||
| N12P2K6 | 316 ± 38.1 c | 1133.3 ± 209.5 ab | 240 ± 23.0 ab | 196 ± 29.9 b | 100 ± 22.5 d | 18.7 ± 1.1 bc | ||||
| N6P4K12 | 518 ± 62.4 c | 1120 ± 105.8 abc | 253.3 ± 40.5 ab | 245 ± 44.3 b | 176 ± 29.0 cd | 112.7 ± 5.3 abc | ||||
| N12P4K12 | 123 ± 24.9 c | 1666.7 ± 357.9 a | 160 ± 26.4 bc | 279 ± 58.1 b | 127 ± 14.6 d | 177.3 ± 12.3 ab | ||||
| MR | N6P2K6 | 5816.7 ± 214.3 ab | 420 ± 23.1 d | 43.3 ± 8.8 c | 8460 ± 1075.6 a | 800 ± 190.5 ab | 2 ± 1.1 c | 891 ± 66.4 b | 303 ± 8.9 a | |
| N12P2K6 | 4243 ± 427.2 b | 336 ± 72.7 d | 15.3 ± 2.4 c | 5223 ± 756.7 ab | 673.3 ± 33.3 abc | 261.3 ± 2 a | 581.7 ± 63.3 cbd | 319.3 ± 93.3 a | ||
| N6P4K12 | 4770 ± 840.1 ab | 439.3 ± 100.9 d | 16.7 ± 4.1 c | 4290 ± 342.1 ab | 388.3 ± 81.8 bcd | 0.00 ± 00 c | 1270.7 ± 115.5 a | 214.7 ± 31.5 a | ||
| N12P4K12 | 6867 ± 124.7 a | 362.7 ± 81.4 d | 78.6 ± 10.7 c | 2560 ± 296.9 ab | 940 ± 161.6 a | 24 ± 2.30 bc | 639.3 ± 44.9 ab | 1120.7 ± 21.9 a | 110 ± 8.1 b | |
| MV | 1235.6 ± 77.5 b | 1235.6 ± 77.5 b | 504.3 ± 27.6 b | 29.8 ± 3.3 b | 808 ± 138.1 b | 671.7 ± 41.8 a | 7.5 ± 1.1 a | 378.8 ± 87.1 b | 281.6 ± 37.3 a | |
| MP | 281.8 ± 49.3 b | 281.8 ± 49.3 b | 1333.3 ± 144.8 a | 250 ± 23.3 a | 235 ± 23.8 b | 196.8 ± 37.4 b | 82.2 ± 20.4 a | |||
| MR | 5424.2 ± 367.9 a | 5424.2 ± 367.9 a | 389.5 ± 34.5 b | 38.5 ± 8.4 b | 5133 ± 711.5 a | 700.4 ± 84.4 a | 71.8 ± 29.2 a | 845.7 ± 88.2 a | 489.5 ± 112.6 a | |
| N6P2K6 | 2449 ± 861.7 a | 2449 ± 861.7 a | 771.4 ± 22.0 a | 136.4 ± 59.9 a | 3421 ± 1312.6 a | 565.8 ± 91.7 a | 9.3 ± 2.9 a | 875.7 ± 35.5 a | 357.7 ± 57.1 a | |
| N12P2K6 | 2014 ± 596.6 a | 2014 ± 595.6 a | 647.8 ± 139.7 a | 93.1 ± 37.4 a | 1948 ± 848.2 a | 502.2 ± 103.6 a | 94.7 ± 36.5 a | 415.5 ± 85.7 a | 273.3 ± 49.0 a | |
| N6P4K12 | 2182 ± 707.1 a | 2182 ± 707.1 a | 713.2 ± 113.3 a | 104.9 ± 39.2 a | 1744 ± 647.6 a | 419.2 ± 81.7 a | 41.6 ± 19.3 a | 706.7 ± 257.7 a | 226.7 ± 33.7 a | |
| N12P4K12 | 2611 ± 1069.8 a | 2611 ± 1069.8 a | 837.1 ± 233.9 a | 90 ± 20.5 a | 1123 ± 368.1 a | 604.7 ± 130.3 a | 69.9 ± 27.3 a | 451 ± 87 a | 684.5 ± 195.5 a | |
Disclaimer/Publisher’s Note: The statements, opinions and data contained in all publications are solely those of the individual author(s) and contributor(s) and not of MDPI and/or the editor(s). MDPI and/or the editor(s) disclaim responsibility for any injury to people or property resulting from any ideas, methods, instructions or products referred to in the content. |
© 2024 by the authors. Licensee MDPI, Basel, Switzerland. This article is an open access article distributed under the terms and conditions of the Creative Commons Attribution (CC BY) license (https://creativecommons.org/licenses/by/4.0/).
Share and Cite
Hazrati, S.; Pignata, G.; Casale, M.; Hosseini, S.J.; Nicola, S. Influence of Nutrient Solutions in an NGS® Soilless System on the Yield, Quality and Shelf Life of Fresh-Cut Commercial Mint at Different Harvest Times. Agronomy 2024, 14, 610. https://0-doi-org.brum.beds.ac.uk/10.3390/agronomy14030610
Hazrati S, Pignata G, Casale M, Hosseini SJ, Nicola S. Influence of Nutrient Solutions in an NGS® Soilless System on the Yield, Quality and Shelf Life of Fresh-Cut Commercial Mint at Different Harvest Times. Agronomy. 2024; 14(3):610. https://0-doi-org.brum.beds.ac.uk/10.3390/agronomy14030610
Chicago/Turabian StyleHazrati, Saeid, Giuseppe Pignata, Manuela Casale, Seyyed Jaber Hosseini, and Silvana Nicola. 2024. "Influence of Nutrient Solutions in an NGS® Soilless System on the Yield, Quality and Shelf Life of Fresh-Cut Commercial Mint at Different Harvest Times" Agronomy 14, no. 3: 610. https://0-doi-org.brum.beds.ac.uk/10.3390/agronomy14030610