Article

Remote Sensing Extraction of Crown Planar Area and Plant Number of Papayas Using UAV Images with Very High Spatial Resolution

1
School of Natural Resources and Surveying, Nanning Normal University, Nanning 530100, China
2
Key Laboratory of Remote Sensing for Subtropical Agriculture, School of Geographical Sciences and Planning, Nanning Normal University, Nanning 530100, China
3
State Key Laboratory of Efficient Utilization of Arid and Semi-Arid Arable Land in Northern China, Institute of Agricultural Resources and Regional Planning, Chinese Academy of Agricultural Sciences, Beijing 100081, China
4
College of Forestry, Guangxi University, Nanning 530004, China
5
Guangxi Zhuang Autonomous Region Institute of Natural Resources Remote Sensing, Nanning 530023, China
*
Author to whom correspondence should be addressed.
Submission received: 23 February 2024 / Revised: 11 March 2024 / Accepted: 15 March 2024 / Published: 21 March 2024
(This article belongs to the Special Issue In-Field Detection and Monitoring Technology in Precision Agriculture)

Abstract

:
The efficient management of commercial orchards strongly requires accurate information on plant growing status for the implementation of necessary farming activities such as irrigation, fertilization, and pest control. Crown planar area and plant number are two very important parameters directly relating to fruit growth conditions and the final productivity of an orchard. In this study, in order to propose a novel and effective method to extract the crown planar area and number of mature and young papayas based on visible light images obtained from a DJ Phantom 4 RTK, we compared different vegetation indices (NGRDI, RGBVI, and VDVI), filter types (high- and low-pass filters), and filter convolution kernel sizes (3–51 pixels). Then, Otsu’s method was used to segment the crown planar area of the papayas, and the mean–standard deviation threshold (MSDT) method was used to identify the number of plants. Finally, the extraction accuracy of the crown planar area and number of mature and young papayas was validated. The results show that VDVI had the highest capability to separate the papayas from other ground objects. The best filter convolution kernel size was 23 pixels for the low-pass filter extraction of crown planar areas in mature and young plants. As to the plant number identification, segmentation could be set to the threshold with the highest F-score, i.e., the deviation coefficient n = 0 for single young papaya plants, n = 1 for single mature ones, and n = 1.4 for crown-connecting mature ones. Verification indicated that the average accuracy of crown planar area extraction was 93.71% for both young and mature papaya orchards and 95.54% for extracting the number of papaya plants. This set of methods can provide a reference for information extraction regarding papaya and other fruit trees with a similar crown morphology.

1. Introduction

Papaya (Carica papaya L.) is an evergreen softwood fruit tree widely cultivated in tropical and subtropical regions as an important fruit, with the characteristics of being both medicinal and edible [1]. In addition to being a favorite fruit with a high vitamin content, the tree is found to have potential in other applications such as papain, a protease extracted from papaya, which has extensive use in food, brewing, medicine, and numerous other industries [2,3]. It is necessary to carry out precise management of the papaya orchard and timely and accurately grasp the growth characteristics of the papaya plants in order to fertilize, irrigate, and prevent diseases and pests. These management practices can increase the yield and quality of papaya, ensure that it meets market demand, and maximize its nutritional value and medicinal effects [4,5]. Due to many reasons, such as small household farming and lack of farming machines, the precise management of orchards in Guangxi has not yet been fully popularized [6]. This situation has encouraged the development of various studies investigating methods to increase orchard management levels. As a type of near-ground remote sensing platform, drones can quickly obtain high-resolution images of large orchards. Through processing and analyzing digital images, comprehensive and multi-angle monitoring of fruit tree growth can be achieved, providing a scientific basis for the precise management of orchards [7].
The crown is an important component of fruit trees and serves as a vital indicator of their growth and health. The processes of photosynthesis, transpiration, and nutrient absorption are closely related to crown planar size and structure. Accurate information on fruit tree crown planar size and number of trees is a prerequisite for the precise management of orchards [8]. The traditional way to obtain orchard crown information was through manual field measurements, this method was usually high-cost, low-efficiency, and involved great uncertainty [9]. Therefore, it is crucial to explore a more cost-effective and efficient method to obtain accurate tree crown information in this context [10,11].
In recent years, unmanned aerial vehicle (UAV) remote sensing has gained many applications in orchard monitoring [12,13]. For the extraction of the crown planar area and tree number, some scholars use the method of combining drone images with deep learning or machine learning. Neupane et al. [14] utilized deep learning and visible light images from UAVs for precise monitoring and counting of banana trees. Shi et al. [15] applied the Mask R-CNN instance segmentation algorithm to segment the crown of apple and peach orchards to extract the crown width and crown area information. Wu et al. [16] and Ye et al. [17] adopted an approach to combine UAVs with a deep learning algorithm to extract the crown information of apple trees and olive trees, respectively. Chen et al. [18] and Zhang et al. [19] used the deep learning algorithms YOLOv4 and CURI-YOLOv7 to detect individual citrus trees from UAV remote sensing imagery, respectively. However, these algorithms rely heavily on computer performance.
Other studies have demonstrated the applicability of combining multi-source data with image enhancement techniques [20,21,22,23,24,25,26,27,28]. Spectral and texture information in the images were used by Tu et al. [20] for accurate estimation of the height, range, and projected plant coverage status of the avocado crown. Dong et al. [21] and Altieri et al. [22] developed a method to combine UAV images with vegetation index to extract information on crown areas in orchards (apple and pear) and Corylus avellane, respectively. Shu et al. [23] and Chen et al. [24] used the crown height model (CHM) and watershed segmentation algorithm to detect and extract individual tree crowns of fruit trees. Sergio et al. [25] calculated the crown volume based on measuring vegetation planar area and ground shadows. Panagiotidis et al. [26] proposed a crown height model generated from point cloud data combined with a backflow region segmentation algorithm to detect and segment individual trees. Colaço et al. [27] developed a method to estimate crown volume and height based on a mobile terrestrial laser scanner suited for large commercial orange groves. Caruso et al. [28] detected the differences in olive tree crown growth under different irrigation systems using visible light images and thermal images from UAVs.
However, there are few monitoring studies specifically targeting papaya at present. For example, Jiang et al. [29] conducted a study on papaya planting areas in Xuwen County, Zhanjiang, Guangdong, using a method based on GPU-accelerated scale-space filtering to detect the number of papaya plants, achieving high accuracy in a short period of time. However, this method only detected the number of papaya plants, used a single parameter, and had high computer hardware requirements.
Guangxi Zhuang Autonomous Region (GXZAR) in south China is one of three major papaya-farming concentration regions in China. Papaya farming has become an important cash agriculture industry in GXZAR in recent decades, along with the continuous expansion of papaya orchards in terms of both number and acreage. Numerous papaya orchards with farming acreages ranging from several hectares to a hundred hectares are operating in GXZAR, such as in Heng County, Long’an County, Xixiangtang District, and Wuming District in Nanning. These large-scale papaya orchards urgently require an efficient approach to monitor their papaya orchards for precise management using UAVs. In this study, we explored the applicability of UAV remote sensing with a DJ Phantom 4 RTK drone to obtain images for the extraction of crown planar area and plant number data of papaya in Wuming District. The purpose of this study is to explore how to exclude interference from weeds, soil, mulch, and other backgrounds and to quickly and accurately extract the crown planar area and plant number of papayas. The investigated practices are beneficial for evaluating the growth status and growth rate of papaya; helping farmers and researchers understand the growth of papaya plants at different growth stages; optimizing planting density, pruning management, and harvest scheduling; achieving scientific planting management, thereby predicting papaya yield; and providing a basis for farmers to develop production plans and market marketing [30]. An efficient method was developed for accurately extracting the information on the crown planar area and plant number of mature and young papayas. This approach provides a basis for the accurate measurement of papaya planting acreage, growth monitoring, and yield estimation and serves as a reference for the application of drones in precision orchard management.

2. Materials and Methods

2.1. Study Area

This study was conducted at the Chengxiang Town Papaya Farming Base in Wuming District of Nanning Municipality, GXZAR, in southern China (Figure 1a). In low hills with small altitude differences, papaya plants were grown. The soil type at the papaya farming base was typical krasnozem, with red soil weathered from karst rock layers. The climate of the region is a typical subtropical monsoon pattern, with abundant sunlight and rainfall in the hot summer that is very suitable for papaya. The annual precipitation in the area is in the range of 1100–1700 mm, of which over 60% occurs in the summer months from June to August, leaving the spring and autumn seasons prone to drought. The annual average air temperature is 21.7 °C. The hottest month is July, with an average temperature of 28.6 °C. The coldest month is January, with an average temperature of 12.8 °C. Therefore, the climate of the region is very suitable for papaya cropping.
The base currently has a papaya orchard with a farming acreage of 80 ha. An operational model of the base + cooperative + farmers has been adopted at the base, in which a cooperative of villages and the region’s farmers provide land, labor, and the required infrastructure for the farming activity while the base takes care of the business operation and returns the shares to the villages and farmers.
In addition to papaya plants, a small number of weeds were also found in the orchard. Therefore, the background of the orchard also included some soil and mulch (Figure 1b). Thus, the key of this study is to enhance the capability of separating the vegetation from soil and mulch, minimizing the impact of weeds, improving the accuracy of extracting papaya crown planar area, reducing the influence of neighboring plants, and improving the accuracy of extracting papaya number. The study region consists of two distinct papaya plants: mature and young. Mature papaya refers to trees with a mature crown, meaning the overall growth status and form of the tree have fully developed, characterized by dense branches, lush leaves, vigorous growth, and orderly branch branching. Young papaya leaves are light green, small in size, soft in texture, and sometimes irregular in growth, making them relatively fragile. Papayas are planted in rows in a regular pattern, with a spacing of about 2 m between rows and 2 m between plants if there are no missing or dead plants. Through field survey and visual interpretation, two 30 m × 30 m standard plots were set up in the mature papaya orchard (M1 and M2) and young papaya orchard (Y1 and Y2), respectively (Figure 1c,d). The M1 and Y1 were selected as the experiment for the extraction, while the M2 and Y2 were selected to verify the extraction (Table 1).

2.2. Technical Route

Figure 2 shows the technical procedures to extract information on the papaya crown planar area and the plant number. The procedures were composed of the following steps:
(1)
Acquire the UAV image and field survey data. First, the UAV flight tasks for photos of the papaya orchard will be conducted and RGB images from the obtained photos will be generated. Then, investigate the growth status of papaya in the orchard. The details of this step are presented in Section 2.3.
(2)
Analyze the spectral characteristics of different objects in the RBG image to determine whether vegetation indices could be used to separate papayas from other objects. The details of this step are presented in Section 2.4.
(3)
Calculate the relevant vegetation indices and compare the differences of these vegetation indices in terms of separating papaya, weed, soil, and mulch film in the orchard. The details of this step are presented in Section 2.5.
(4)
Compare the low-pass filter and the high-pass filter for enhancement of the UAV image. The details of this step are presented in Section 2.6.
(5)
Perform image segmentation to extract information on tree crown and tree number. The details of this step are presented in Section 2.7.
(6)
Evaluate the accuracy of the information extraction. The details of this step are presented in Section 2.8.

2.3. Image Data Acquisition and Preprocessing

A UAV flight campaign was launched to use the DJI Phantom 4 RTK (DJI Innovations Co., Ltd., Shenzhen, China) to take photos of the selected papaya farming fields at the Chengxiang Town Papaya Farming Base. A high-quality camera in the visible spectrum range was mounted on the UAV platform to take photos of the ground surface. The campaign was carried out on December 15 during the period of 14:00–15:00 under clear sky conditions. The technical specifications of the UAV camera and the details of the UAV flight campaigns are presented in Table 2.
The flight was carried out in an S-form trajectory for continuous imaging. In order to obtain an efficient mosaic image from the UAV photos, we set the flight path with an 80% forward overlapping and a 70% side overlapping between the adjacent flight lines. The viewing angle for imaging was set at 90°. The coordinate system was set at CGCS2000 with a central longitude of 108°. The flight height of the UAV was set at 55 m relative to the ground. Based on the drone’s battery capacity, we conducted several flights, each lasting 25 min. In total, 636 UAV photos were obtained for the flight campaign. When taking the photos, the UAV also simultaneously recorded the position information of the flight, including the coordinates, altitude, and viewing angle of the image. The program Agisoft Metashape Professional 1.8.5 was used to process the aerial photography data. Flying at a lower altitude produces a large number of photos but also results in clearer images. By aligning photos and generating dense point clouds, a digital orthorectified image with a very high spatial resolution of 1.5 cm was produced.

2.4. Data Feature Analysis

The obtained UAV image was a true color image composed of the red (R), green (G), and blue (B) bands [31]. In order to distinguish the papaya trees from the background objects in the orchard, we conducted a spectral analysis of the obtained image. First, we set the range of pixel values in the image to be 0–255. Then, we sampled different objects in the M1 and Y1 and used R, G, and B bands to construct pixel value profiles to determine whether vegetation indices could be used to separate papaya plants from other objects in the orchard.

2.5. Vegetation Indices for the Feature Analysis

NDVI is a classic vegetation index, but its calculation requires the near-infrared band, which increases the cost of data acquisition. The Normalized Green–Red Difference Index (NGRDI) and the Red–Green–Blue Vegetation Index (RGBVI) have been proven to be effective for estimating ground biomass [32,33], while the Visible-band Difference Vegetation Index (VDVI) has been shown to have high accuracy in vegetation extraction [34]. These three indices are all based on the characteristics of vegetation reflecting green light, absorbing red and blue light. They are constructed with reference to the normalized structure of NDVI, providing good accuracy in vegetation extraction [35,36].
In order to obtain a comparable pixel value for the feature analysis, normalization to the three visible bands of the UAV image was carried out using the following equations:
r = R R + G + B
g = G R + G + B
b = B R + G + B
where R, G, and B represent the pixel values of the red, green, and blue bands, respectively, in the UAV image, and r, g, and b, are the normalized pixel values. After normalization, the selected three vegetation indices were computed as follows:
NGRDI = g r g + r
RGBVI = g 2 b   r g 2 + b   r
VDVI = 2 g r b 2 g + r + b
To perform the feature analysis, 30 samples of papaya, 10 samples of weeds, 20 samples of soil, and 20 samples of mulch in the orchard were taken from the M1 and Y1 plots. The following two parameters were used for statistical analysis to reveal the feature characteristics of the samples: coefficient of variation (CV) and coefficient of relative difference (CRD). Differences within the same land cover class were measured as CV, and those between different land cover classes were as CRD:
CV =   | Σ ( x i x ¯ ) 2 n x ¯ | × 100 %
CRD =   | x ¯ i x ¯ g x ¯ g | × 100 %
where x i is the pixel value of class i of land object samples; x ¯ is the pixel mean value of this category of samples; n is the number of pixel samples in this category; x ¯ i is the pixel mean value of a certain land object sample; and x ¯ g is the pixel mean value of the target land object, i.e., the papaya sample. Suitable vegetation indices and filters were selected to make CV smaller and CRD greater. The indices or filters with small CV and large CRD were selected for further analysis.

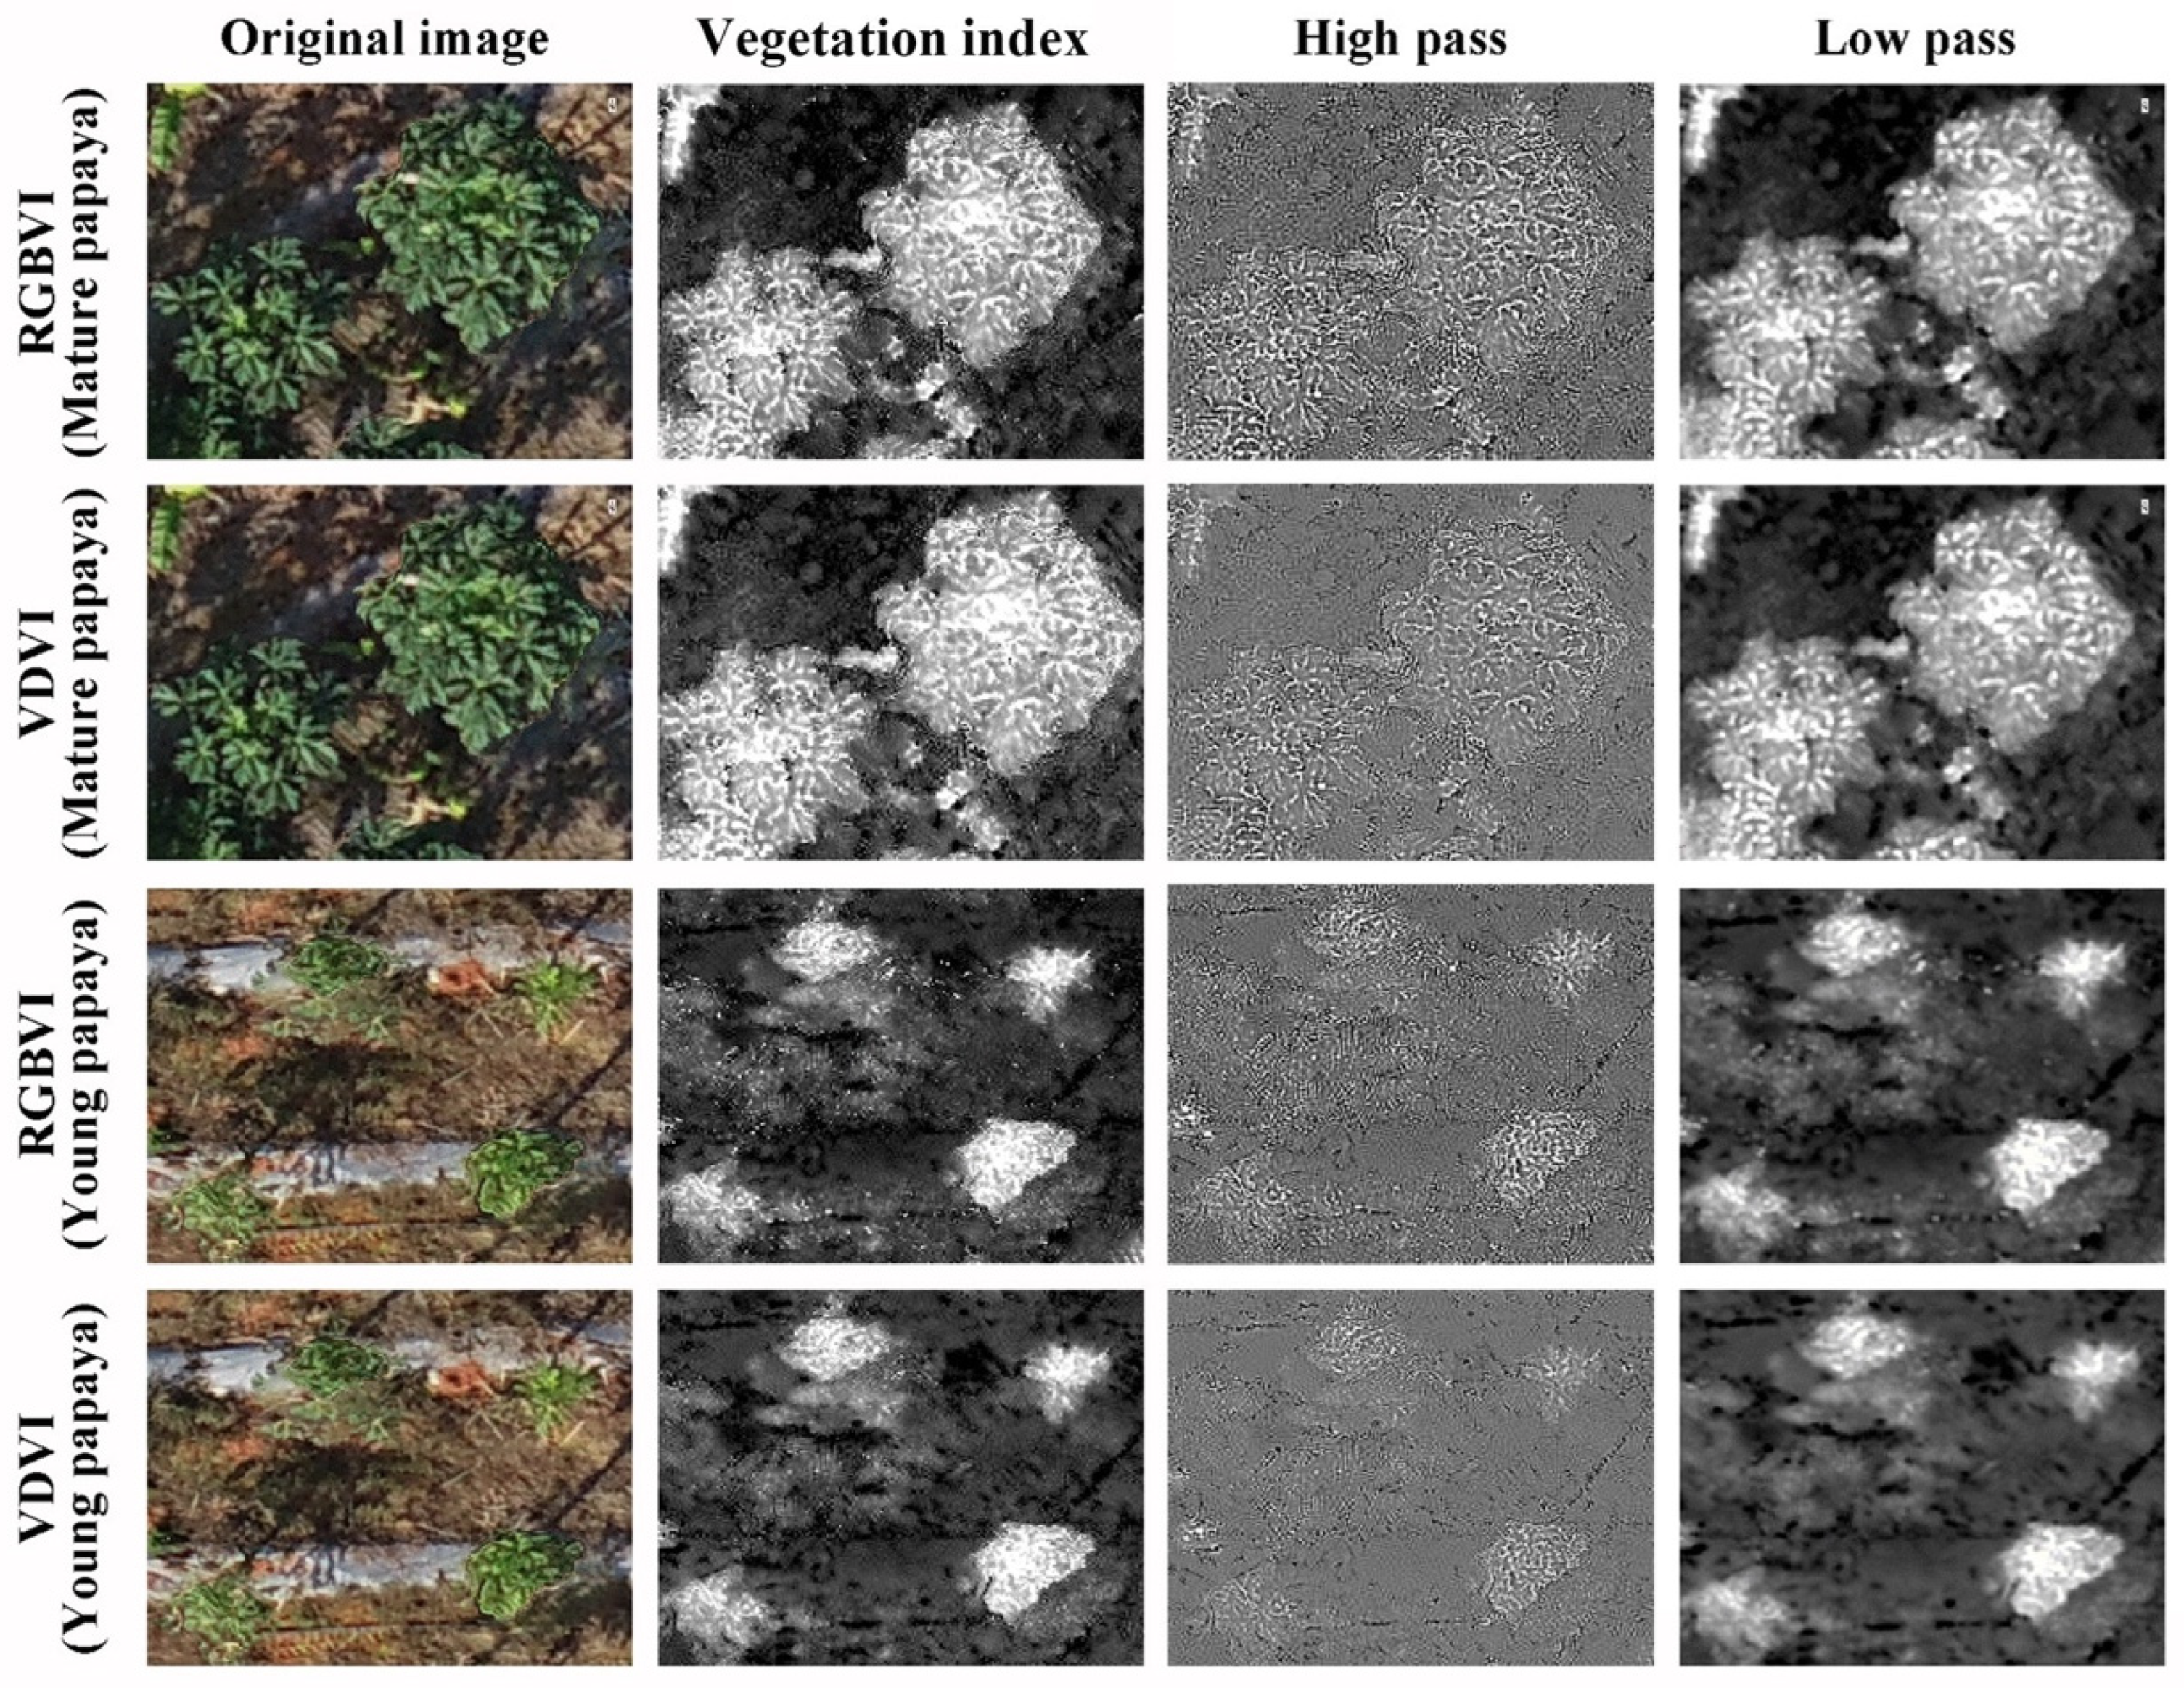
2.6. Frequency Enhancement

In order to improve the accuracy and completeness of crown planar area extraction, it was necessary to highlight the crown boundary of papayas while weakening the background objects and noise. The high-pass filter can enhance edge information, while the low-pass filter can make the image softer and smoother to eliminate some noise in the image. Therefore, low-pass filter and high-pass filter methods were compared in this study. A convolution kernel of 3 pixels was used to process the images, aiming to compare the images before and after processing and to select the most suitable filter to weaken the noise in the crown and soil areas of the image.
Low-pass filter was achieved by applying the ENVI IDL “SMOOTH” function. The default size of the convolution kernel was 3 × 3. An ideal low-pass filter allowed all frequencies within a circle centered at the origin with a radius of D0 to pass without attenuation while “cutting off” all frequencies outside of this circle. The transfer function for this low-pass filter was as follows:
H ( u , v ) = 1 ,   D ( u , v ) D 0 0 ,   D ( u , v ) > D 0   ( D 0 0 )
D ( u , v ) = [ ( u P / 2 ) 2 + ( v Q / 2 ) 2 ] 1 / 2
where D0 is a positive number, and D(u, v) is the distance between the frequency midpoint (u, v) and the center of the frequency rectangle. The filter function H(u, v) is a discrete function of P × Q and is also a binary function. When D ≤ D0, low-frequency information passes through without loss, and high-frequency information is completely filtered out. As a result, the image obtained using the Fourier transform would be a smooth image with blurred edges.
In order to highlight the edge contours of the target objects, a high-pass filter was used to allow high-frequency components to pass through and weaken low-frequency components, achieving the purpose of image sharpening. This was accomplished by applying a convolution kernel with a high center value (usually surrounded by negative weight values). The default high-pass filter in ENVI 5.5 used a 3 × 3 convolution kernel with a center value of “8” and surrounding pixel values of “−1”. The dimension of the high-pass filter convolution kernel must be odd. The ideal transfer function of a high-pass filter was as follows:
H ( u , v ) = 0 ,   D ( u , v ) D 0 1 ,   D ( u , v ) > D 0
H ( u , v ) = u 2 + v 2
where D0 is the cutoff frequency. This filter is opposite to the low-pass filter. All high-frequency components with D > D0 passed through, and all low-frequency components with D ≤ D0 were removed, but there was a jitter phenomenon in the edges of the processed images.
Convolution kernel size is an important parameter that affects the filtering effect. After obtaining the appropriate filtering effect, we performed the following procedures to determine the suitable convolution kernel size for mature and young forests of papaya: we started with a kernel size of 3 pixels and a stride of 4 pixels; then we gradually increased to 51 pixels; finally, a total of 13 convolution kernels were applied to the target image using the selected filter. The suitable convolution kernel size was selected based on the accuracy of crown planar area extraction.

2.7. Image Segmentation

Image segmentation was performed to divide the image pixels into several classes by setting different feature thresholds. The process was conducted as follows: Let the original image be denoted as f(x, y). According to certain rules, feature value T was found in f(x, y) to perform image segmentation. Any point (x, y) in f(x, y) that satisfied f(x, y) > T was called an object point, otherwise it was called a background point. Thus, the segmented image g(x, y) was defined as follows:
g ( x , y ) = 1 ,   f ( x , y ) > T 0 ,   f ( x , y ) T
when T is a constant applicable to the entire image, the processing of this formula is called the global threshold.

2.7.1. Otsu’s Method

Otsu’s method [37], also known as the maximum between-class variance method, was applicable to image binarization. The basic idea of the method was to select the optimal threshold that resulted in the best separation between the two classes obtained through segmentation using the threshold. The best criterion for between-class separation was to maximize the statistical difference between classes or to minimize the within-class variance. The image could be divided into background and foreground based on its grayscale characteristics. A larger between-class variance indicated a greater difference between the two parts that made up the image. The difference between the two parts would be decreased when a portion of the foreground was misclassified as background or a portion of the background as foreground. Therefore, to maximize the between-class variance in segmentation, it is recommended to minimize the misclassification probability, which could be provided as follows:
W 0 = N 0 / MN
W 1 = N 1 / MN
N 1 + N 0 = MN
W 0 + W 1 = 1
μ = W 0 μ 0 + W 1 μ 1
σ = W 0 ( μ 0 μ ) 2 + W 1 ( μ 1 μ ) 2
where W0 is the proportion of target pixels in the image; W1 is the proportion of background pixels in the image; µ0 is the average grayscale of the target object pixels; µ1 is the average grayscale of the background pixels; µ is the total average gray level of the image; the MN represented size of the image; N0 is the number of pixels with gray level large than T; N1 is the number of pixels with gray level less than T; and σ is the inter-class variance.

2.7.2. Mean–Standard Deviation Threshold Method

If a random variable X followed a normal distribution with a mean of μ and a variance of σ2, denoted as X (μ, σ2), its probability density function was determined by the mean μ, which determined its location, and the standard deviation σ, which determined the amplitude of the distribution. According to the characteristics of the normal distribution, the proportion of the area within a certain range under the probability density curve reflected the probability of the variable falling within that range. The portion of areas (probability) within the range of (μ − σ, μ + σ), (μ − 2σ, μ + 2σ), and (μ − 3σ, μ + 3σ) on the x-axis were 68.26%, 95.45%, and 99.73%, respectively.
Papaya tree crowns have the feature of the center part being the highest compared with the surrounding parts. Thus, the apex of a single tree belongs to the new growth area and receives more light energy. From the understanding that the new parts of the crown account for a certain proportion of the crown planar area, we developed a new method for extracting the number of papaya plants based on drone images. Specifically, by reclassifying the pixels of the tree crown planar area based on the mean and standard deviation, we extracted the new growth parts of the tree crown as a reference to extract the number of papaya plants, using the following equation:
T = x ¯ + n σ ( n [ 0 , 3 ] )
where T is the segmentation threshold, x ¯ is the mean pixel value within the study area, σ is the standard deviation of pixel values within the study area, and n is the coefficient. Since the apex of a single tree receives more light energy, spectral reflectance in the center pixels is the highest, implying that n in Equation (20) is not negative. Therefore, the method could be named the mean–standard deviation threshold (MSDT) method for the counting tree number.
In the orchard, with most papaya plants in the mature stage, the crown planar size of the mature papaya plants was usually very large, and many of them might be mutually connected with each other in the obtained UAV image. According to our statistical analysis, the average crown planar area of single mature papaya plants is about 2 m2 in M1. Using 2 m2 as the threshold, the crown patches were divided into two parts, with patches smaller than 2 m2 defined as single trees and patches larger than 2 m2 defined as crown-connecting trees. Combining visual interpretation, the crown pixel histogram of single trees, double, triple, and quadruple crown-connecting trees were separately counted. We used the MSDT method to extract the top layer of the crown to obtain the number of papayas. In the edge area of the plot, there were some incomplete trees with incomplete crown planar areas. Since the principle of papaya number extraction was based on the high-brightness pixels at the center of the crown, it could not be fully extracted for the incomplete trees. Therefore, the incomplete crowns were excluded from the papaya tree identification.

2.8. Accuracy Evaluation

By comparing the results of visual interpretation, the extracted results of the MSDT method could be classified into the following three situations: true positive (TP), where the predicted value of the papaya crowns was consistent with the true value; false positive (FP), where the actual subject was the background, but it was incorrectly predicted as a tree crown; and false negative (FN), where the tree crown in the actual scene was not correctly identified. The following metrics were used to evaluate the accuracy of the crown planar area and MSDT method [38,39]:
P = TP TP + FP
R = TP TP + FN
F = 2 × R × P R + P
where P represents the precision of the method, R denotes the recalling rate of the method, and F is the F-score of the method. TP, FP, and FN are the crown planar area or tree numbers belonging to TP, FP, and FN in the resulting image. It could be seen that the higher the precision, recalling rate, and F-score, the closer the predicted values were to the true ones, implying that the result was better.

3. Results

3.1. Data Feature

Figure 3 shows the RGB profiles of different objects in the orchard. The RGB curves of mature and young papayas were morphologically similar to each other, with B values ranging from 20 to 160. The R and G values of young papayas were higher than those of mature papayas. For mature papaya, G values ranged from 70 to 200 and R from 30 to 165. For young papaya, G values were between 100 and 220 and R between 65 and 215. Whether it was mature or young papayas, their G values were significantly higher than R and B, which allowed us to use vegetation indices to extract both mature and young papayas at the same time. For weeds, the R and G values were close to each other and obviously overlapped within the range from 130 to 180, which was overlapping with the G values of papayas, indicating that weeds were a potential interference factor for papaya extraction. R values of the soil in the orchard ranged from 120 to 205, G from 80 to 155, and B from 40 to 120. These results suggest that the RGB values had good separation. The highest B value was found in the mulch film, ranging from 160 to 180, which is obviously higher than the B values of mature and young papayas, thus allowing for complete separation from the papayas. Therefore, it was possible to distinguish papayas from soil and mulch film by constructing visible light indices.

3.2. Comparison of Vegetation Indices

Figure 4 compares the difference in various vegetation indices between mature and young papayas. As seen in the NGRDI images, papaya canopies appear in bright white, shadows of the papayas appear in light gray, mulch and irrigation pipes appear in light gray color, and soil backgrounds appear in dark gray. It was not easy to separate the papaya canopies from the mulch and heavy shadows (such as in Y2 appearing grayish white) and irrigation pipes (such as in M2 and Y1). For the RGBVI and VDVI indices, canopies appeared bright white, soil dark gray, and irrigation pipes and shadows dark gray. The images of the two indices indicated that the canopies could be effectively separated from soil, mulch, shadows, and other backgrounds (Figure 4).
Table 3 compares the variation in the three vegetation indices over different ground objects in the orchard. VDVI had a very high capability to separate the papayas from soil and mulch, with CRD > 100% (Table 3). RGBVI also had a very good separation of papayas from soil with CRD = 98.5% and from mulch with CRD = 99.1%. NGRDI has the strongest separation of papayas from the soil with CRD = 213.3%, but the poorest separation of mulch with CRD = 77.0%. Therefore, VDVI and RGBVI were selected for subsequent analysis. In addition, the values of CRD between papayas and weeds were small for all three indices, implying that weeds still remained the main interfering factor in papaya information extraction.

3.3. Image Filtering Enhancement

Figure 5 shows the results of applying the high-pass and low-pass filter enhancements to VDVI and RGBVI images of typical papaya crowns. The default convolution kernel of 3 pixels was used in the enhancements. For mature papayas, high-pass filter enhanced the noise in the background, making the background and tree crown tones very close. Although the boundary of the tree crown planar area was enhanced, the leaf texture inside the crown was also enhanced, making the extraction of the crown planar area fragmented. For young papayas, due to their small crown size and unclear leaf texture, some trees’ crowns were difficult to distinguish after high-pass filter. Values of CV for papayas and weeds significantly increased (Table 4). This also indicates that high-pass filter increased the differences within the same class of objects, which was not conducive to the extraction of target objects. Low-pass filter had a smoothing effect on both the crown and the background. It reduced the noise in the soil and weakened the influence of some weeds. Whether mature or young papaya crowns, they maintained their original bright white color, while the background remained dark in tone, making it possible to identify the complete crown planar area well. The CV for papayas and weeds significantly decreased (Table 4). Therefore, low-pass filter was selected for further analysis.

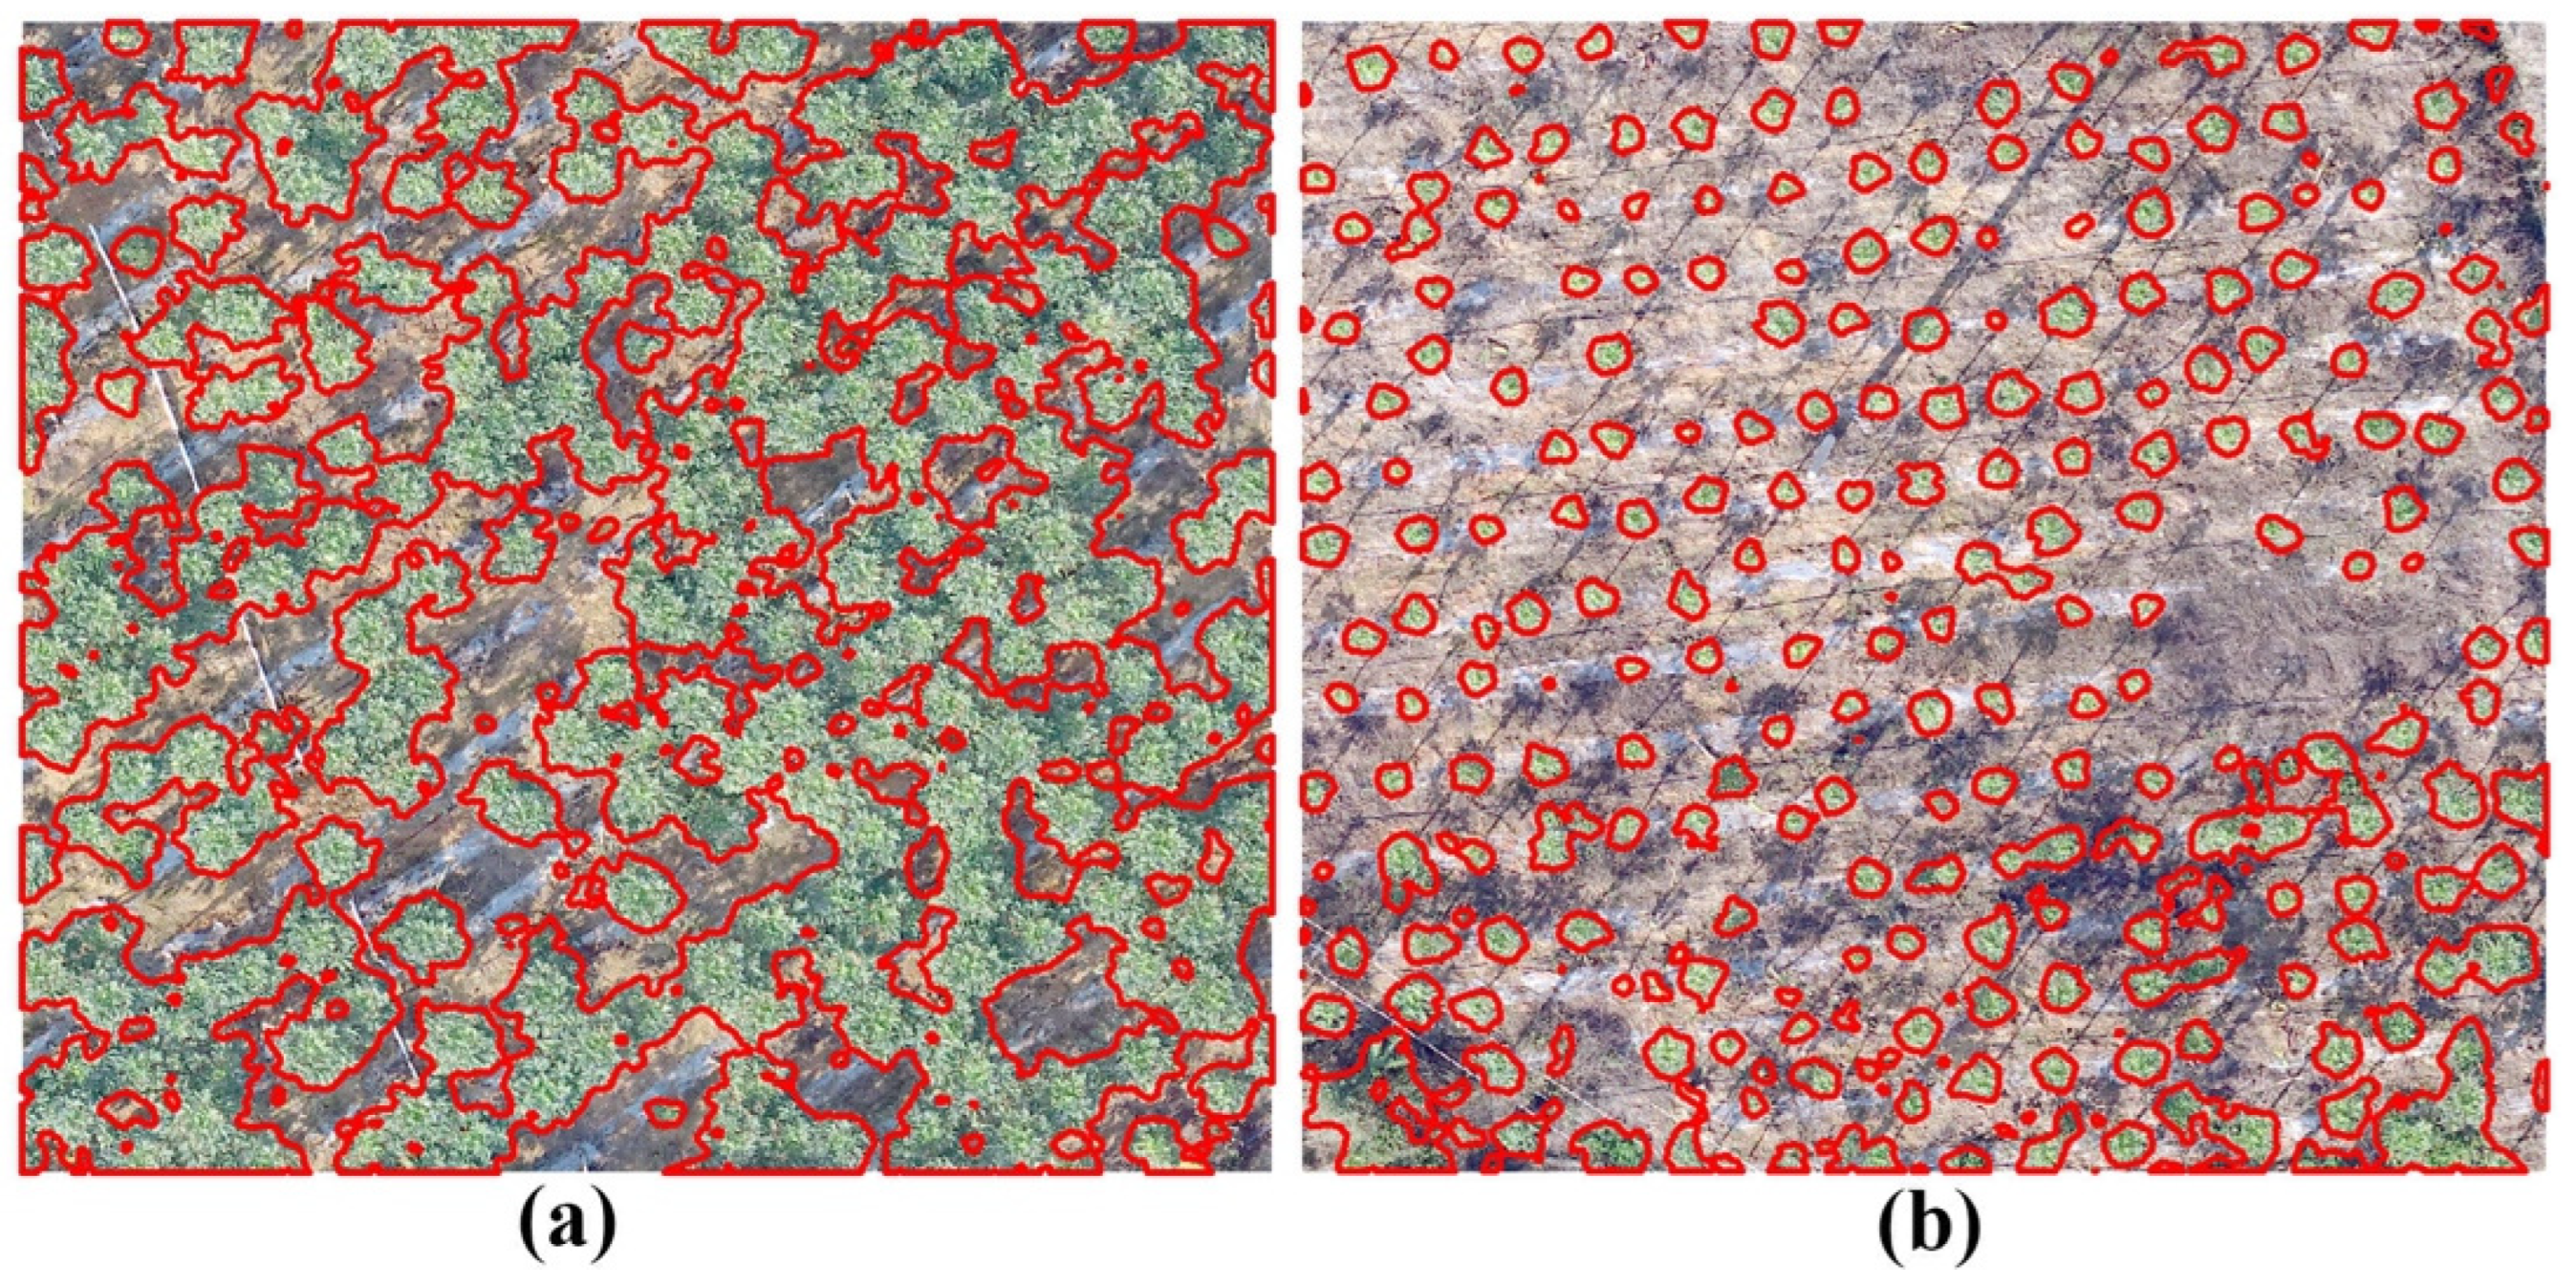
3.4. Crown Extraction

The crown planar area in this paper refers to the area of the crown projected on the horizontal plane. Figure 6 shows the change in crown planar area extraction accuracy with the pixels in the convolution kernel for low-pass filter. When the kernel size increased to 23 pixels, the three accuracy indices of area extraction reached their highest values. P has a higher value for RGBVI and VDVI in M1 than in Y1, with P = 97.6% for VDVI and 91.1% for RGBVI. Figure 6a shows that, in Y1, P for VDVI was 84.5% at the kernel size of 23 pixels, which was significantly higher than for RGBVI (73.43%). It was found that the F-scores for VDVI in M1 were all above 90%, while it was only 92.13% for RGBVI, which was lower than VDVI (96.85%) at 23 pixels. In the Y1 plot, VDVI had an F-score of 90.28% at the kernel size of 23 pixels, which was significantly higher than that for RGBVI (83.60%) (Figure 6c). R-values for both RGBVI and VDVI were higher in Y1 than in M1 when the kernel size reached 23 pixels. However, VDVI had a significantly higher R-value than RGBVI in mature plot (Figure 6b). Therefore, it could be concluded that a convolution kernel size of 23 pixels provided the best accuracy for the crown planar area extraction of papaya in the orchard. A comparison between the two indices indicated that VDVI had relatively higher accuracy and stronger applicability than RGBVI for the extraction. Therefore, we used the VDVI for the extraction, which produced the area extraction for the M1 and Y1 plots shown in Figure 7.

3.5. Papaya Number Extraction

Based on the obtained crown planar area of papaya, we found that some plants have independent crowns, including some mature single plants and young single plants. Some adjacent plants showed crown overlap; these plants were mostly lush mature papaya trees, including two, three, four, or even more crowns overlapping (Figure 7a). The occurrence of connected plants made it impossible to directly determine the number of plants based solely on the number of patches in the planar area. We also found that the crown planar area of young trees mistakenly extracted a small part of the weeds (Figure 7b), which also interfered with the identification of the plant number. Therefore, the extracted crown planar area of papaya was divided into three types: single young, single mature, and crown-connecting mature papayas. Figure 8 shows the pixel histograms of different types of papaya crowns. It could be seen that both mature and young papayas were within the normal distribution or slightly skewed normal distribution in terms of single and crown-connecting types. Therefore, the MSDT method was applied to extract the number of papaya plants in the orchard. For single young papayas, the best extraction results were obtained with the parameter n = 0. It could be seen that the cases of missed extraction increased with the parameter n. Therefore, we could narrow the range of parameter n for single young papayas to be within [0, 1], with a step size of 0.2. For the single mature papayas, the extraction was good for n = 0–2. As for crown-connecting mature papayas, when n = 0, it was difficult to completely separate triple-connecting crowns from quadruple-connecting crowns. When n = 3, there were more cases of missed extraction for the connecting crowns. When n = 1 and n = 2, the extraction results were inconsistent (Figure 8). Since connecting crowns were more common in mature papaya orchards, the range of “n” for single and crown-connecting mature papayas was further narrowed down to be within [1, 2], with a step size of 0.2.
Figure 9 compares the accuracy of papaya tree number extraction with the MSDT method for different n values. It was found that for M1, single papayas had the highest F at n = 1, which was 94.96% (Figure 9a). For crown-connecting patches, the highest F was at n = 1.4, which was 96.09% (Figure 9b). For Y1, with the “n” increase, P remained relatively stable, but R decreased sharply. When n = 0, F was the highest, at 92.23% (Figure 9c). Y1 had only three crown-connecting patches, and when “n” was taken as [1, 2], the accuracy indices P, R, and F all reached 100%.
Figure 10 shows the results of papaya tree number extraction for M1 and Y1. For M1, “n” was taken as 1 for single papayas and 1.4 for crown-connecting patches, resulting in classifications of true positive (TP) for 199 papayas, false positive (FP) for 8 papayas, and false negative (FN) for 10 papayas (Figure 10a). The P was 96.14%, the R was 95.22%, and the F was 95.67%. For Y1, “n” was taken as 0 for single papayas and 1.4 for crown-connecting patches, resulting in classifications of true positive (TP) for 193 papayas, false positive (FP) for 13 papayas, and false negative (FN) for 10 papayas (among which 8 papayas had a crown planar area smaller than 0.2 m2) (Figure 10b). The P was 93.69%, the R was 95.07%, and the F was 94.38%.

3.6. Accuracy of the Extraction

Figure 11 shows the verification of papaya crown planar area extraction in the orchard. The accuracy of crown planar area extraction was verified using the M2 and Y2 plots as the validation areas. For M2, we obtained an accuracy of P = 98.01%, R = 96.23%, and F = 97.11%. For Y2, the accuracy was P = 85.34%, R = 96.62%, and F = 90.63%. Since the F values for both validation areas were above 90%, the area extraction result in the two papaya plots had a very high accuracy. Thus, the method of extracting the papaya crown planar area in the M2 and Y2 plots provided the extraction results shown in Figure 12.
Figure 13 shows the accuracy of the verification of papaya number extraction in the M2 and the Y2. For M2, we obtained an accuracy of P = 94.67%, R = 98.72%, and F = 96.65%. For Y2, the accuracy was P = 94.04%, R = 96.93%, and F = 95.46%. Figure 14 shows the results of papaya number extraction for the two standard plots: M2 and Y2. The very high F-scores (>95%) for the two mature papaya plots and 94% for the two young papaya plots demonstrated the feasibility and universality of the developed method for papaya tree number extraction.

4. Discussion

4.1. Vegetation Index

The selection of vegetation indices is a key step in extracting crown planar area. Before selecting vegetation indices, we analyzed the RGB profile curves of mature and young papayas and backgrounds and found that the RGB spectral shapes of mature and young papayas were similar. This suggests that when exploring plant characteristics from RGB spectra, we can combine mature and young papayas into one category, and can use the same vegetation index to extract both mature and young papayas. At the same time, this also shows that using only RGB information cannot distinguish the growth period of papaya. We need more parameters, such as the size of the crown, the height of the tree, and the three-dimensional shape of the crown, to identify the growth period [25,26,27,28].
The construction of NGRDI, RGBVI, and VDVI indices, respectively, used G, G2, and 2×G values. Vegetation indices constructed using different multiples of G values to explore potential differences in the spectra of target and background features. It was found that NGRDI had the best separation effect between the papaya and soil. The NGRDI normalized the values of green (G) and red (R), while the difference between G and R of soil was much greater than that between mature and young papayas, resulting in a higher separation between soil and papayas for this index. However, this index had lower contrast between vegetation shadows, mulch, irrigation pipes, and vegetation. Combining this with Table 2, it could be seen that this index caused some misclassification due to the presence of strip-like features. The RGBVI and VDVI showed similar extraction effects for papayas based on index images and CV. At the same time, the differences between papayas and weeds were small for all three indices, making weeds the main interference factor in papaya extraction. Due to the ecological farming practices in the orchard, weeds were inevitable. Mature papayas in the orchard had larger crowns and fewer exposed weeds, while young papayas were quite the opposite. Therefore, weeds had a greater influence on the extraction of information on young papaya orchards.
In the results of crown planar area extraction, we found that no matter which values the convolution kernel was set to in the range of 3–51, whether it was mature or young papaya trees, the extraction accuracy of the crown planar area using VDVI was significantly higher than using RGBVI. Therefore, the index we ultimately chose was VDVI, which was consistent with the conclusion of Wang et al. [34] that the VDVI method had higher accuracy in vegetation extraction.

4.2. Convolution Kernel Size

The size of the low-pass filter convolution kernel was the key threshold for accurately extracting the crown planar area of papaya. After conducting multiple experiments, it was found that the smaller the low-pass filter convolution kernel, the more severe the fragmentation of the extracted papaya crowns. As the convolution kernel size increased, the extraction of the papaya crowns tended to be more complete, and the accuracy of the crown extraction was also improved. When the convolution kernel size was 23 pixels, the RGBVI and VDVI had the highest accuracy in extracting the papaya crown planar area in the mature and young papaya plot, and VDVI had significantly higher accuracy than RGBVI. When the convolution kernel continued to increase, the extraction accuracy decreased because the excessively large convolution kernel caused excessive smoothing, resulting in a large area being missed in the extraction. Therefore, the VDVI was selected as the best index, and 23 pixels were identified as the optimal convolution kernel for the extraction. Different types of vegetation may have different optimal kernel sizes due to variations in leaf size and texture [40].
The accuracy of extracting crown planar area was lower in the young papaya plot than in the mature papaya plot. One reason for this result is that the crowns of young papayas were smaller, and the leaves were sparse; this resulted in less significant edge features of the crowns and more exposed weeds, which caused the number of FN to be larger. Moreover, some vigorously growing weeds had similar morphology and color to papayas, making it impossible to smooth these features out with low-pass filter. These factors together resulted in a relatively lower accuracy of extracting the crown planar area of young papaya plants in comparison with the mature trees.

4.3. MSDT Method

The grayscale histogram of digital images is equivalent to a discretized probability density curve, where the average value of pixels represents the overall brightness and tone characteristics of the image, and the standard deviation of pixels reveals the texture features and spatial structure information of the image. Some scholars have used the average value and standard deviation for the construction of global and local thresholds [41]. In the medical field, scholars used fitting normal distribution curves to construct thresholds for the segmentation and extraction of lung field images [42]. In visible light images, the center pixel value of the papaya tree crown was higher than the surrounding area, indicating that the apex of a single tree belonged to a new growth area and received more light, resulting in a higher spectral reflectance.
Based on the obtained crown planar area of the papaya, this study assumed that the top layer of the papaya crown accounted for a certain proportion of the crown planar area. According to the principles of probability density curves, the MSDT method was developed for the extraction of papaya tree numbers. The MSDT method was adjusted by changing the n value to adapt to different types of tree crowns with varying proportions of new growth areas in the crown planar area. Our repetitive experiments indicated that the highest accuracy of extracting the number of single young, single mature, and crown-connecting mature papayas was obtained when the coefficient values were n = 0, n = 1, and n = 1.4, respectively. The different n values for single young and single mature papayas were mainly due to the lower pixel value of the single young crowns than that of the single mature ones. The occurrence of crown-connecting papayas was mainly in the mature trees, and the pixel values and morphology of the crowns of mature papayas were similar. Therefore, the coefficient n = 1.4 could be used for both crown-connecting papayas in the mature plots and the young ones.
The accuracy of extracting the papaya number in mature trees was above 95%, while the accuracy in young trees was 94%, probably due to some young papayas being missed in the extraction. These missed young papayas had crown planar area of ≤0.2 m2, implying that identification of papaya number might be difficult for those with small crowns. In the orchard site of this study, 8 out of 10 false negatives (FNs) had a crown planar area less than 0.2 m2 in the Y1 and 6 out of 7 in the Y2. If we excluded the papayas with small crowns (<0.2 m2), the F-score would be 96.26% for the Y1 and 96.72% for Y2, respectively. It can be seen that this method is very effective for the extraction of the number of papayas with a crown planar area greater than 0.2 m2. This study also found that when the crown of young papayas was small, and there were many weeds, it could lead to some false extraction of weeds in papaya crown planar area extraction. However, the false extraction of weeds could be reduced when the proposed MSDT method was used. In addition, by adjusting the n value, this method can also be considered for application to other fruit trees with similar canopy characteristics.

4.4. Applicability of the Developed Method

The method developed in this study to extract the crown planar area and plant number of papayas is conducted with the following procedures.
(1)
Calculate the VDVI of the target area.
(2)
Enhance the target features of the papayas and smooth the soil and scattered weeds using the low-pass filter with a convolution kernel size of 23 pixels.
(3)
Use Otsu’s method to obtain the threshold that maximized the inter-class variance for image segmentation to extract the papaya crowns.
(4)
Use a threshold of an average crown planar area of 2 m2 for single mature papayas to classify the crown patches into single and crown-connecting papayas.
(5)
Use the MSDT method (n = 0 for single young trees, n = 1 for single mature trees, and n = 1.4 for crown-connecting mature papayas) to count the number of papaya plants.
For papaya, Jiang. et al. [29] used the scale-space filtering (SSF) algorithm for plant detection, achieving a detection result with an F-score of 94% regardless of the size of the crown. However, this method requires high hardware requirements. The MSDT method used in this study achieved an average F-score of 95.54% for plant detection, which is higher than Jiang et al.’s results and does not rely on high-end computer hardware. It also does not rely on sample selection like machine learning or deep learning and provides high-precision crown planar area estimation (with an average F-score of 93.71%). The developed method can be applied with relatively low economic and time costs and provides a basis for the statistical analysis of papaya planting area and yield estimation.

4.5. Outlook

The method proposed in this study achieved high accuracy in extracting crown planar area and number of papaya trees, but there were still some limitations. The method had a low recognition rate for young papayas with a crown planar area of less than 0.2 m2. Moreover, during the extraction of the crown planar area, some vigorously growing weeds with similar colors to papaya were not completely removed, resulting in a certain amount of false positive detections in the number of trees extracted. Furthermore, the method did not involve single tree segmentation of the crown, making it impossible to obtain the crown planar area of individual trees, which affected the assessment of the growth status of individual papaya trees.
In response to the limitations mentioned above, future research should continue to expand and deepen. In order to manage orchards precisely, we should obtain more comprehensive parameters of the papaya crown [43]. This can be achieved by fusing multiple data sources, for example, combining crown planar area with ground shadows to calculate crown volume [44]. By integrating airborne or handheld LiDAR point cloud data [45], a three-dimensional crown model can be established, allowing for single tree segmentation and calculation of individual tree crown volume to more accurately identify the morphology of the crown and improve the recognition accuracy of small tree crowns [46,47]. By combining multispectral and thermal infrared images, more comprehensive growth parameters can be obtained for evaluating the quality traits of vegetation [48]. To correct the false extraction and missed extraction results in drone images, morphological methods [49] should be further considered to accurately extract on the basis of the shape of papaya crowns. For weeds and targets with similar spectral characteristics that are easily falsely extracted, the morphology–spectrum joint feature should be used to eliminate interference from similar spectra [50]. In addition, morphology in Guangxi was generally a mountainous and hilly area with complex terrain, and the accuracy of papaya crown information extraction might be affected by the background objects and the rough terrain. The effects of different background objects and terrains should be considered in future studies on the extraction of papaya information.

5. Conclusions

This study developed an applicable approach to extract the crown planar area and number of trees in a papaya orchard in GXZAR, southern China. The UAV DJI Phantom 4 RTK was used to obtain RGB images of the papaya orchards. The RGB profile curves of the target objects were analyzed. Based on calculating the VDVI, a low-pass filter with a 23-pixel convolution kernel was applied, combined with Otsu’s method, to extract the crown planar area of the papaya. Furthermore, the MSDT method was developed in this study for image segmentation to extract the number of papaya plants. The accuracy, applicability, limitations, and outlook of the proposed methods for crown planar area extraction and number identification of papaya were also discussed.
Verification demonstrated that the proposed approach had very high accuracy. The F-score indicated that the average accuracy was 93.71% for papaya crown planar area extraction in both young and mature papaya orchards and 95.54% for extracting the number of papaya plants. This is important for the timely understanding of the growth status and yield estimation of papaya. Since UAVs could be used to obtain images of the ground with extremely high spatial resolution at a very low cost, the approach developed in this study might also be applicable to other orchard types for information extraction regarding plant growing status, which is required for efficient orchard management.

Author Contributions

Conceptualization, S.L., Q.H. and L.D.; Methodology, S.L., H.M. and F.C.; Software, H.M. and G.H.; Investigation, H.M.; Writing—original draft, S.L. and Q.H.; Writing—review & editing, Q.H. and Z.Q. All authors have read and agreed to the published version of the manuscript.

Funding

This research was funded by the National Natural Science Foundation of China (Grant No.: 41771406), the Key Laboratory of China-ASEAN Satellite Remote Sensing Applications, Ministry of Natural Resources of the People’s Republic of China (Grant No.: GDMY202310), and the Scientific Research and Technological Development Plan Project in Wuming District, Nanning City (Grant No.: 20220107).

Data Availability Statement

The data presented in this study are available on request from the corresponding author.

Conflicts of Interest

The authors declare no conflicts of interest.

References

  1. Qin, Q. Research progress on application value and development of papaya. Food Ind. 2017, 38, 234–237. [Google Scholar]
  2. Tsoulias, N.; Paraforos, D.S.; Fountas, S.; Zude-Sasse, M. Estimating canopy parameters based on the stem position in apple trees using a 2D Lidar. Agronomy 2019, 9, 740. [Google Scholar] [CrossRef]
  3. Modica, G.; Messina, G.; Luca, G.D.; Fiozzo, V.; Praticò, S. Monitoring the vegetation vigor in heterogeneous citrus and olive orchards. A multiscale object-based approach to extract trees’ crowns from UAV multispectral imagery. Comput. Electron. Agric. 2020, 175, 105500. [Google Scholar] [CrossRef]
  4. Chen, R.; Zhang, C.; Xu, B.; Zhu, T.; Zhao, F.; Han, S.; Yang, G.; Yang, H. Predicting individual apple tree yield using UAV multi-source remote sensing data and ensemble learning. Comput. Electron. Agric. 2022, 201, 107275. [Google Scholar] [CrossRef]
  5. Sola-Guirado, R.R.; Castillo-Ruiz, F.J.; Jimenez-Jimenez, F.; Blanco-Roldan, G.L.; Castro-Garcia, S.; Gil-Ribes, J.A. Olive actual on year yield forecast tool based on the tree canopy geometry using UAS imagery. Sensors 2017, 17, 1743. [Google Scholar] [CrossRef] [PubMed]
  6. Huang, Q.; Feng, J.; Gao, M.; Lai, S.; Han, G.; Qin, Z.; Fan, J.; Huang, Y. Precise estimation of sugarcane yield at field scale with allometric variables retrieved from UAV Phantom 4 RTK images. Agronomy 2024, 14, 476. [Google Scholar] [CrossRef]
  7. Alexopoulos, A.; Koutras, K.; Ali, S.B.; Puccio, S.; Carella, A.; Ottaviano, R.; Kalogeras, A. Complementary use of ground-based proximal sensing and airborne/spaceborne remote sensing techniques in precision agriculture: A Systematic Review. Agronomy 2023, 13, 1942. [Google Scholar] [CrossRef]
  8. Narvaez, F.Y.; Reina, G.; Torres-Torriti, M.; Kantor, G.; Cheein, F.A. A survey of ranging and imaging techniques for precision agriculture phenotyping. IEEE-ASME T. Mech. 2017, 22, 2428–2439. [Google Scholar] [CrossRef]
  9. Santoro, F.; Tarantino, E.; Figorito, B.; Gualano, S.; D’Onghia, A.M. A tree counting algorithm for precision agriculture tasks. Int. J. Digit. Earth 2013, 6, 94–102. [Google Scholar] [CrossRef]
  10. Xu, W.; Yang, F.; Ma, G.; Wu, J.; Wu, J.; Lan, Y. Multiscale inversion of Leaf Area Index in citrus tree by merging UAV LiDAR with multispectral remote sensing data. Agronomy 2023, 13, 2747. [Google Scholar] [CrossRef]
  11. Wang, Y.; Feng, C.; Ma, Y.; Chen, X.; Lu, B.; Song, Y.; Zhang, Z.; Zhang, R. Estimation of Nitrogen concentration in walnut canopies in southern Xinjiang based on UAV multispectral images. Agronomy 2023, 13, 1604. [Google Scholar] [CrossRef]
  12. Hobart, M.; Pflanz, M.; Weltzien, C.; Schirrmann, M. Growth height determination of tree walls for precise monitoring in apple fruit production using UAV photogrammetry. Remote Sens. 2020, 12, 1656. [Google Scholar] [CrossRef]
  13. Osco, L.P.; Arruda, M.D.S.D.; Marcato Junior, J.; da Silva, N.B.; Ramos, A.P.M.; Moryia, A.S.; Imai, N.N.; Pereira, D.R.; Creste, J.E.; Matsubara, E.; et al. A convolutional neural network approach for counting and geolocating citrus-trees in UAV multispectral imagery. ISPRS J. Photogramm. 2020, 160, 97–106. [Google Scholar] [CrossRef]
  14. Neupane, B.; Horanont, T.; Hung, N.D. Deep Learning based banana plant detection and counting using high-resolution red-green-blue (rgb) images collected from Unmanned Aerial Vehicle (UAV). PLoS ONE 2019, 14, e0223906. [Google Scholar] [CrossRef] [PubMed]
  15. Shi, Y.; Shen, L.; Chen, S.; He, R.; Wen, Z.; Liu, Y.; Mi, Z.; Su, B. Research on the extraction method of fruit tree canopy information based on low-altitude remote sensing. China Agric. Inform. 2022, 34, 1–10. [Google Scholar]
  16. Wu, J.; Yang, G.; Yang, H.; Zhu, Y.; Zhao, C. Extracting apple tree crown information from remote imagery using Deep Learning. Comput. Electron. Agric. 2020, 174, 105504. [Google Scholar] [CrossRef]
  17. Ye, Z.; Wei, J.; Lin, Y.; Guo, Q.; Zhang, J.; Zhang, H.; Deng, H.; Yang, K. Extraction of olive crown based on UAV visible images and the U2-Net Deep Learning model. Remote Sens. 2022, 14, 1523. [Google Scholar] [CrossRef]
  18. Chen, Y.; Zhang, X.; Chen, X. Identification of navel orange trees based on deep learning algorithm YOLOv4. Sci. Surv. Mapp. 2022, 47, 135–144. [Google Scholar]
  19. Zhang, Y.; Fang, X.; Guo, J.; Wang, L.; Tian, H.; Yan, K.; Lan, Y. CURI-YOLOv7: A light weight YOLOv7 tiny target detector for citrus trees from UAV remote sensing imagery based on embedded device. Remote Sens. 2023, 15, 4647. [Google Scholar] [CrossRef]
  20. Tu, Y.H.; Johansen, K.; Phinn, S.; Robson, A. Measuring canopy sructure and condition using multi-spectral UAS imagery in a horticultural environment. Remote Sens. 2019, 11, 269. [Google Scholar] [CrossRef]
  21. Xinyu, D.; Zhichao, Z.; Ruiyang, Y.; Qingjiu, T.; Xicun, Z. Extraction of Information about individual trees from high-spatial-resolution UAV-acquired Images ofan orchard. Remote Sens. 2020, 12, 133. [Google Scholar]
  22. Altieri, G.; Maffia, A.; Pastore, V.; Amato, M.; Celano, G. Use of high-resolution multispectral UAVs to calculate projected ground area in Corylus avellana L. tree orchard. Sensors 2022, 22, 7103. [Google Scholar] [CrossRef]
  23. Shu, M.; Li, S.; Wei, J.; Che, Y.; Li, B.; Ma, Y. Extraction of citrus crown parameters using UAV platform. Trans. CSAE 2021, 37, 68–76. [Google Scholar]
  24. Chen, R.; Li, C.; Yang, G.; Yang, H.; Xu, B.; Yang, X.; Zhu, Y.; Lei, L.; Zhang, C.; Dong, Z. Extraction of crown information from individual fruit tree by UAV LiDAR. Trans. CSAE 2020, 36, 50–59. [Google Scholar]
  25. Vélez, S.; Vacas, R.; Martín, H.; Ruano-Rosa, D.; Álvarez, S. A Novel Technique Using Planar Area and Ground Shadows Calculated from UAV RGB Imagery to Estimate Pistachio Tree (Pistacia vera L.) Canopy Volume. Remote Sens. 2022, 14, 6006. [Google Scholar] [CrossRef]
  26. Panagiotidis, D.; Abdollahnejad, A.; Surový, P.; Chiteculo, V. Determining tree height and crown diameter from high-resolution UAV imagery. Int. J. Remote Sens. 2016, 38, 2392–2410. [Google Scholar] [CrossRef]
  27. Colaço, A.F.; Trevisan, R.G.; Molin, J.P.; Rosell-Polo, J.R.; Escolà, A. A method to obtain orange crop geometry information using a mobile terrestrial laser scanner and 3D modeling. Remote Sens. 2017, 9, 763. [Google Scholar] [CrossRef]
  28. Caruso, G.; Palai, G.; Tozzini, L.; Gucci, R. Using visible and thermal images by an Unmanned Aerial Vehicle to monitor the plant water status, canopy growth and yield of olive trees (cvs. Frantoio and Leccino) under different irrigation regimes. Agronomy 2022, 12, 1904. [Google Scholar] [CrossRef]
  29. Jiang, H.; Chen, S.; Li, D.; Wang, C.; Yang, J. Papaya tree detection with UAV images using a GPU-Accelerated Scale-Space Filtering method. Remote Sen. 2017, 9, 721. [Google Scholar] [CrossRef]
  30. Zhang, C.; Joao, V.; Lammert, K.; Guo, L.; Wang, W. Orchard management with small unmanned aerial vehicles: A survey of sensing and analysis approaches. Precis. Agric. 2021, 22, 2007–2052. [Google Scholar] [CrossRef]
  31. Zhu, M.; Zhou, Z.F.; Zhao, X.; Huang, D.H.; Jiang, Y. Identification and extraction method of pitaya individual plant in karst plateau canyon area based on UAV remote sensing. Trop. Geogr. 2019, 39, 502–511. [Google Scholar]
  32. Hunt, E.R.; Cavigelli, M.; Daughtry, C.S.T.; Mcmurtrey, J.E.; Walthall, C.L. Evaluation of digital photography from model aircraft for remote sensing of crop biomass and nitrogen status. Precis. Agric. 2005, 6, 359–378. [Google Scholar] [CrossRef]
  33. Bendig, J.; Yu, K.; Aasen, H.; Bolten, A.; Bennertz, S.; Broscheit, J.; Gnyp, M.L.; Bareth, G. Combining UAV-based plant height from crop surface models, visible, and near infrared vegetation indices for biomass monitoring in barley. Int. J. Appl. Earth. Obs. 2015, 39, 79–87. [Google Scholar] [CrossRef]
  34. Wang, X.; Wang, M.; Wang, S.; Wu, Y. Extraction of vegetation information from visible unmanned aerial vehicle images. Trans. Chin. Soc. Agric. Eng. 2015, 31, 152–159. [Google Scholar]
  35. Meng, D.; Zhao, J.; Lan, Y.; Yan, C.; Yang, D.; Wen, Y. SPAD inversion model of corn canopy based on UAV visible light image. Trans. Chin. Soc. Agric. Mach. 2020, 51, 366–374. [Google Scholar]
  36. Li, S.; Yuan, F.; Ata-Ui-Karim, S.T.; Zheng, H.; Cao, Q. Combining color indices and textures of UAV-based digital imagery for rice LAI estimation. Remote Sens. 2019, 11, 1763. [Google Scholar] [CrossRef]
  37. Wang, Y.; Zhou, Z.; Huang, D.; Zhang, T.; Zhang, W. Identifying and counting tobacco plants in fragmented terrains based on Unmanned Aerial Vehicle images in Beipanjiang, China. Sustainability 2022, 14, 8151. [Google Scholar] [CrossRef]
  38. Goutte, C.; Gaussier, E. A Probabilistic Interpretation of Precision, Recall and F-Score, with Implication for Evaluation. In Lecture Notes in Computer Science; Springer: Berlin/Heidelberg, Germany, 2005; p. 952. [Google Scholar]
  39. Sokolova, M.; Japkowicz, N.; Szpakowicz, S. Beyond accuracy, F-score and ROC: A family of discriminant measures for performance evaluation. In Lecture Notes in Computer Science; Springer: Berlin/Heidelberg, Germany, 2006; pp. 1015–1021. [Google Scholar]
  40. Zhao, G.; Sun, M.; Song, X.; Hao, Z.; Li, M.; Wu, H.; Liu, J.; Yu, K. A Comparative Study of Casuarina equisetifolia Number Extraction Methods Based on UAV Visible Light Remote Sensing Data. J. Southwest For. Univ. (Nat. Sci.) 2023, 43, 127–135. [Google Scholar]
  41. Rafael, C.G.; Richard, E.W. Frequency domain filtering. In Digital Image Processing, 3rd ed.; Ruan, Q.; Ruan, Y., Translators; Electronic Industry Press: Beijing, China, 2012; pp. 476–492. [Google Scholar]
  42. Li, Z.; Chen, Y.; Zhao, Y.; Zhu, L.; Lv, S.; Lu, J. Lung image segmentation and 3D reconstruction based on fitting normal distribution curve. Comput. Eng. Des. 2017, 38, 1277–1281. [Google Scholar]
  43. Yurtseven, M.; Akgul, S.; Coban, S.G. Determination and Accuracy Analysis of Individual Tree Crown Parameters Using UAV Based Imagery and OBIA Techniques. Measurement 2019, 145, 651–664. [Google Scholar] [CrossRef]
  44. Vélez, S.; Vacas, R.; Martín, H.; Ruano-Rosa, D.; Álvarez, S. High-resolution UAV RGB imagery dataset for precision agriculture and 3D photogrammetric reconstruction captured over a pistachio orchard (Pistacia vera L.) in Spain. Data 2022, 7, 157. [Google Scholar] [CrossRef]
  45. Hadas, E.; Jozkow, G.; Walicka, A.; Borkowski, A. Apple orchard inventory with a Lidar equipped Unmanned Aerial System. Int. J. Appl. Earth Obs. 2019, 82, 101911. [Google Scholar] [CrossRef]
  46. Domen, M.; Borut, Z. An efficient approach to 3D single tree-crown delineation in LiDAR data. ISPRS. J. Photogramm. 2015, 108, 219–233. [Google Scholar]
  47. Zhu, Z.; Christoph, K.; Nils, N. Assessing tree crown volume—A review. Forestry: An International Journal of Forest Research. Forestry 2021, 94, 18–35. [Google Scholar] [CrossRef]
  48. Martínez-Peña, R.; Vélez, S.; Vacas, R.; Martín, H.; Álvarez, S. Remote Sensing for Sustainable Pistachio Cultivation and Improved Quality Traits Evaluation through Thermal and Non-Thermal UAV Vegetation Indices. Appl. Sci. 2023, 13, 7716. [Google Scholar] [CrossRef]
  49. Ponce, J.M.; Aquino, A.; Tejada, D.; Alhadithi, B.M.; Andújar, J.M. A methodology for the automated delineation of crop tree crowns from UAV-based aerial imagery by means of morphological image analysis. Agronomy 2022, 12, 43. [Google Scholar] [CrossRef]
  50. Wang, K.; Zhou, J.; Zhang, W.; Zhang, B. Mobile Lidar scanning system combined with canopy morphology extracting methods for tree crown parameters evaluation in orchards. Sensors 2021, 21, 339. [Google Scholar] [CrossRef]
Figure 1. (a) Geographical location of the study region in Guangxi Zhuang Autonomous Region, China; (b) true color UAV image of the study region with the selected four standard plots; (c) close viewing of young papaya plants; and (d) close viewing of mature papaya plants. Note: M1 and M2 were the standard plots with mature papaya plants; Y1 and Y2 were the standard plots with young papaya plants. M1 and Y1 were used as experiments to develop the methods for information extraction in this study, while M2 and Y2 were used to verify the developed methods for the extraction.
Agronomy 14 00636 g001
Figure 2. Technical flowchart of this study.
Agronomy 14 00636 g002
Figure 3. RGB profiles of different objects: (a) mature papaya plants, (b) young papaya plants, (c) weeds, (d) soils, and (e) mulch. The red lines in the images show the selected position, and the curves in the profiles represent the changes in the pixel values of the corresponding bands.
Agronomy 14 00636 g003
Figure 4. Comparison of vegetation indices for mature and young papayas.
Agronomy 14 00636 g004
Figure 5. The results of image enhancement for typical papaya canopies in the orchard.
Agronomy 14 00636 g005
Figure 6. Change in the three accuracy indices with kernel size for VDVI and RGBVI in the mature and young papaya plots: (a) the precision index, (b) the recall index, and (c) the F-score index.
Agronomy 14 00636 g006
Figure 7. Crown planar area extraction using VDVI and the low-pass filter in the (a) M1 and (b) Y1 plots.
Agronomy 14 00636 g007
Figure 8. Pixel histograms of different types of papaya trees and the results of extracting the single and connecting papaya crowns and their top layers with the MSDT method for different n values.
Agronomy 14 00636 g008
Figure 9. Change in papaya tree number extraction accuracy with different n values for the (a) single mature papayas, (b) crown-connecting mature papayas, and (c) single young papayas. The abbreviations are as follows: P, precision; R, recall; and F, F-score.
Agronomy 14 00636 g009
Figure 10. The results of papaya tree number extraction for the (a) M1 and the (b) Y1 plots. The abbreviations are as follows: TP, true positive; FP, false positive; and FN, false negative.
Agronomy 14 00636 g010
Figure 11. Verification of the accuracy of papaya crown planar area extraction, with accuracy classifications of TP, FN, and FP for M2 (a); P, F, and R for M2 (b); TP, FN, and FP for Y2 (c); and P, F, and R for Y2 (d). The abbreviations are as follows: TP, true positive; FP, false positive; FN, false negative; P, precision; R, recall; and F, F-score.
Agronomy 14 00636 g011
Figure 12. The results of papaya crown planar area extraction for the M2 (a) and Y2 (b) plots.
Agronomy 14 00636 g012
Figure 13. Verification of the accuracy of papaya tree number extraction, with accuracy classifications of TP, FN, and FP for M2 (a); P, F, and R for M2 (b); TP, FN, and FP for Y2 (c); and P, F, and R for Y2 (d). The abbreviations are as follows: TP, true positive; FP, false positive; FN, false negative; P, precision; R, recall; and F, F-score.
Agronomy 14 00636 g013
Figure 14. The results of papaya tree number extraction for M2 (a) and Y2 (b). The abbreviations in the figure are as follows: TP, true positive; FP, false positive; and FN, false negative.
Agronomy 14 00636 g014
Table 1. Visual interpretation of crown and numbers of papaya individuals for standard plots.
Research AreaStandard PlotCrown Planar Area (m2)Number
(Papaya)
Experimental areaM1380.44229
Y1111.90205
Verification areaM2550.46241
Y2150.19228
Table 2. Technical specification of UAV flight campaigns.
ItemTechnical Specification
UAV typeDJI Phantom 4 RTK
Viewing angle90° to the ground
Image sensor1-inch CMOS, 20 million pixels
Camera lensFOV 84°; 8.8 mm/24 mm: aperture f/2.8-f/11
ISO scope100
Camera focal length8.8 mm
Photo size in W/H ratio and pixelsW/H 4:3, 4864 × 3648
Positioning accuracyVertical 1.5 cm + 1 ppm (RMS), Horizontal 1 cm + 1 ppm (RMS); Note: 1 ppm means that error increases 1 mm for 1 km movement of the vehicle
Duration of flight25 min
Date of the UAV flight
campaigns
15 December 2022
UAV flight height55 m relative to the ground surface
Overlapping of imaging80% along flight direction and 70% between flight directions
Imaging number636 photos
Spatial resolution0.015 m at the central pixel of the photos
Table 3. Quantitative comparison of the three vegetation indices for different ground objects in the orchard.
Land ObjectNGRDIRGBVIVDVI
MeanStdCRDMeanStdCRDMeanStdCRD
Papaya0.1530.080-0.4420.176-0.2310.107-
Weed0.0750.09950.8%0.3800.18513.8%0.1820.09921.2%
Soil−0.1730.089213.3%0.0070.08998.5%−0.0340.058114.6%
Mulch film0.0350.04677.0%0.0040.02699.1%−0.0010.010100.3%
Table 4. Vegetation index and coefficient of variation after filtering.
MethodPapayaWeed
MeanStdCVMeanStdCV
RGBVI0.4420.1760.3970.3800.1850.486
RGBVI + low-pass0.4420.1310.2960.3780.1450.384
RGBVI + high-pass0.4460.8841.9830.3950.9782.476
VDVI0.2310.1070.4660.1820.0990.546
VDVI + low-pass0.2300.0790.3430.1800.0800.444
VDVI + high-pass0.2320.5562.3930.1930.5042.611
Disclaimer/Publisher’s Note: The statements, opinions and data contained in all publications are solely those of the individual author(s) and contributor(s) and not of MDPI and/or the editor(s). MDPI and/or the editor(s) disclaim responsibility for any injury to people or property resulting from any ideas, methods, instructions or products referred to in the content.

