Apparent Accumulated Nitrogen Fertilizer Recovery in Long-Term Wheat–Maize Cropping Systems in China


1
College of Plant Science and Technology, Beijing University of Agriculture, Beijing 102206, China
2
Ministry of Agriculture Key Laboratory of Plant Nutrition and Nutrient Cycling, Institute of Agricultural Resources and Regional Planning, Chinese Academy of Agricultural Sciences, Beijing 100081, China
3
School of Resources and Environment, University of Jinan, Jinan 250022, China
*
Author to whom correspondence should be addressed.
Agronomy 2018, 8(12), 293; https://0-doi-org.brum.beds.ac.uk/10.3390/agronomy8120293
Submission received: 25 October 2018
/
Revised: 28 November 2018
/
Accepted: 30 November 2018
/
Published: 4 December 2018
Abstract
:Recovery efficiency of nitrogen fertilizers has always been an important issue, especially for N fertilizer recommendation rate in cropping systems. Based on the equilibrium of N in the soil–plant system, apparent accumulated N fertilizer recovery (NREac) was determined for long-term (15-years) experiments in wheat (Triticum aestivum L.) and maize (Zea mays L.) rotations at five field sites with various soils and climate characteristics in China. The result showed that the frequency of cropping and the content of soil clay affected NREac positively and negatively, respectively. In the absence of nutrient deficiencies and other soil constraints (from NPK (nitrogen, phosphorus and potassium) in S2-CP (site2-Changping) in Beijing, S3-ZZ (site3-Zhengzhou) in Henan province and S4-YL (site4-Yangling) in Shaanxi province), NREac had a narrow range from 70% to 78% with the highest average of 75% in wheat and maize cropping system. Meanwhile, the value 75% of NERac is a rational value proved by 3414 experiments. Additionally, the nitrate-N approach suggested that nitrate-N could be utilized by subsequent crops, the amount of which is calculated by the equation −1.23 × [(NO3−-N) − 87]. Furthermore, another simpler and feasible method was proposed to maintain basic soil fertility while achieving a rational grain yield and maintaining a safe environmental upper threshold of nitrate. The present study provided a suit of methods for N fertilizer recommendations for the optimization of N applications in wheat and maize cropping system in China.
1. Introduction
The recovery efficiency of N fertilizers applied to crops (REN: the ratio of total N uptake by aboveground plant dry matter to the amount of fertilizer-N applied) has always been an important issue due to opposing goals [1]. On the one hand global food security must keep pace with an increasing world population, but at the same time there are legitimate concerns about environmental pollution caused by excess N applied to crops [1,2]. It is estimated that food demand will rapidly increase to 2.8 × 10⁹ t in 2030 and the corresponding consumption of fertilizer-N is predicted to be 9.6 × 10⁷ t compared with 7.8 × 10⁷ t year−1 in 1995/1997 worldwide [3]. Especially in China, the total consumption of fertilizer-N has increased from 0.93 × 10⁷ t in 1980 to 2.39 × 10⁷ t in 2013 [4]. Fixen and West [5] reported that fertilizer-N supplies basic food needs for at least 40% of the global population and estimated that at least 60% of humanity will eventually owe its nutritional survival to fertilizer in the future. On the other hand, Chinese farmers always apply excess fertilizer-N to crops expecting to produce maximum yield. It is estimated that only 30–50% of applied N fertilizers are taken up by crops worldwide [6]. In China, Fixen and West [5] documented that AEN (agronomic N use efficiency: kg grain per kg fertilizer-N) decreased from approximately 10–15 during 1958–1963 to 10 during 1981–1983 for wheat, and from 20–30 to 13.4 for maize. Consequently, environmental pollution due to excess N applied to crops is gradually becoming serious and a major cause for concern. Nitrate pollution in groundwater is one of the major pollution problems which have been reported in many countries such as the UK, Denmark, Belgium, France and India [7].
The need for food security and environmental protection is the paradox for fertilizer-N use [8,9]. Thus, a balancing between grain yield and the risk of nitrate-N loss is a common aim for both agronomists and environmentalists. Changes of REN, yield and soil NO3−-N accumulation were subject to external factors, such as rate, place and time of applied N fertilizers, etc. As a result, Benbi and Biswas [10] reported that REN varied from 25 to 90% for both maize and wheat, which provided a possibility for mediating the paradox by improving fertilizer-N recommendation. The rate of N applied in the field was initially based on the theory of target yield fertilizer recommendation reported by Truog [11], and gradually improved with its widespread application [12,13,14,15,16,17], where determination of REN is the key. At present there are two methods, the difference and 15N isotopic methods, to estimate REN [18]. However, both methods have some assumptions. The former assumes that soil N uptake by the crop is the same for both fertilized and unfertilized N treatments, while the latter assumes that the isotope composition of the tracer is constant, soil microbial populations make no distinction between the 14N and 15N isotopes, and the chemical identities of isotopes are maintained in biochemical systems. In general, the value determined by the former is lower than the latter on soils with higher available N, and the former is higher than the latter on soils with lower available N, which the elusive soil nitrogen-supplying capacity could account for. Unfortunately, approaches to measure REN are not widely accepted across a wide range of soils [19,20,21].
Therefore, a feasible method to estimate REN is an agenda for fertilizer-N recommendation, especially in wheat–maize cropping system in China, which is a dominant cropping system with excessive N rate and high level of residual soil nitrate-N [22]. Accordingly, a long-term experiment of national soil fertility and fertilizers in wheat–maize cropping system was used in the present study. The objectives were to: (i) discuss the factors affected NREac (NREac: apparent accumulated N recovery efficiency); (ii) determine NREac on the condition of nitrogen equilibrium in the soil–plant system [23,24]; (iii) further complete target yield N recommendation with regulating the relationship between N fertilization and utilization of soil NO3−-N in the wheat–maize cropping system in China.
2. Materials and Methods
The data involved in this study was derived from a network of experiments in China, which was set up in 1990 to determine the response of crops to fertilizers on various types of soil under different climatic conditions. The study was composed of five sites, distributed in five districts: Urumqi (in Xinjiang province, icon S1-WQ), Changping (in Beijing, icon S2-CP), Zhengzhou (in Henan province, icon S3-ZZ), Yangling (in Shaanxi province, icon S4-YL) and Qiyang (in Hunan province, icon S5-QY), which dominate soils and climates of wheat and maize growing regions in China. Initial properties of soils are briefly listed in Table 1 and more details can be found in Liu [25].
The present study included two cropping systems, one crop of wheat or maize per year in S1-WQ, another wheat–maize rotation per year at the other four sites. All experiments were unreplicated in a randomized design due to pressure on experiment land, where plot size varied between 100 and 468 m2. Each experiment consisted of the following nine treatments: (1) CK (unfertilized), (2) PK (phosphorus and potassium), (3) N (nitrogen), (4) NK (nitrogen plus potassium), (5) NP (nitrogen plus phosphorus), (6) NPK (nitrogen, phosphorus plus potassium, (7) FS (NPK plus straw), (8) FM (NPK plus manure) and (9) HF (high NPK plus straw). Rates of fertilizers are shown in Liu et al. [25], in which the rates of manures or straw were based on N concentration, ratio of N from fertilizer to from manures or straws is 7:3, and the amounts of P and K were computed by P and K concentrations multiplied by the rates of applied manures or straw, respectively. Manures were applied after composting and straw was derived from corresponding treatments. All straw or manures were applied once-yearly as soon as the crop (wheat or maize) was harvested in S1-WQ, or wheat was harvested at the other four sites. The sources of N, P and K were urea, superphosphate and potassium chloride, respectively. Half of the N and all of the P and K were applied as basal fertilizer. The remainder of the N was applied as topdressing when needed. Irrigation was adjusted to annual precipitation when needed. When necessary, weeding by hand and pesticide applications were implemented.
2.1. Sampling and Analysis
Crops were harvested manually close to the ground with sickles at maturity and totally removed from the plots. Grain and straw were laid out in the sun on concrete slabs before threshing and then oven-dried at 65 °C to uniform moisture level before weighed, and then ground to pass a 0.15-cm sieve and stored for analysis. Plant samples to be tested were from the center of the plot in order to minimize marginal effects.
Soil samples were collected from the plough layer (0–20 cm) at the start of the experiment and between crop harvest and fertilizer application each autumn. At least five cores in each plot of each site were taken with a 5-cm diameter auger. Cores from the same plot were mixed thoroughly and air-dried, ground to pass through a 2.0-mm sieve and stored for analysis.
Plant samples were analyzed for total nitrogen using the micro-Kjeldahl digestion method, while soil samples were analyzed for total nitrogen, total phosphorus and total potassium using micro-Kjeldahl digestion, colorimetric analysis and a dissolution-flame photometer, respectively [26].
2.2. Calculation and Statistical Analysis
Based on mass balance theory, apparent accumulated N recovery efficiency (NREac%) was calculated as total N uptake (Np, in kg ha−1) by crops (grain and straw) divided by total N rate (Nf, in kg ha−1) using the following equation:
where i is the number of cultivation years and the maximum value of n is 15 years in the present study. Np has been calculated in the companion paper [25] using the following equation:
where Yieldwheat and Yieldmaize represent the grain yields of wheat and maize (kg ha−1), respectively, and 2.73% and 2.21% were the corresponding N concentrations in the aboveground biomass of wheat and maize, respectively. Moreover, on the principle of yield-based N recommendations [12,27], the following equation was used to compute a recommended N rate:
where NREac.opt is an optimal NREac with application of an economically optimal N rate (Nf.opt). In the present study, NREac.opt is the average of NREac from NPK treatment in S2-CP, S3-YL and S4-ZZ, and the value is 75%.
In order to assess the reliability of N rate recommended by Equation (3), the experiment with ‘3414w design was introduced into the present study, which is one of D-optimal design for quadratic regression [28]. In the experiment of ‘3414′ design, 3 represents 3 factors (nitrogen, phosphorus and potassium), 4 represents 4 rates of factors (0, 50% normal rate, normal rate and 150% normal rate), and 14 represents 14 treatments. Since 2005, the “3414” experiment was carried out nationwide that is a standard method for fertilizer recommendation in China [29]. Four of the 14 treatments were selected in the present study and they were N0P2K2, N1P2K2, N2P2K2 and N3P2K2, where N0, N1, N2 and N3 represent nitrogen rates and P2 and K2 represent appropriate phosphorus and potassium rates in the locality, respectively. More details are shown in Appendix A and Appendix References. A quadratic curve fitted the data was as follows:
where Yield is grain yield (kg ha−1), Nf is the rate of applied N, Yield0 is an intercept, defined as a basic grain yield (kg ha−1) without applied N, a and b are two coefficients.
Nf.opt is reached when
where P equals the ratio of the cost of 1 kg fertilizer N to the price of 1 kg grain yield, and there are 2.33 (±0.28) and 2.76 (±0.50) for wheat and maize, respectively in the present study [30] and the variance of P does not make sense to the results of the study. Therefore, Nf.opt was calculated by the following equation:
Based on the ‘3414′ design and Equations (4) and (6), the following equation fitted the relationship between Yieldopt and Yield0:
where Yieldopt is a grain yield at Nf.opt and α is a coefficient.
Statistical analyses were performed using SPSS analytical software (SPSS Inc., Chicago, IL, USA; version 19). Linear regression was used to determine the relationship between Nf.opt with estimatied by NREac and measured in “3414” experiments, and correlation between yieldopt and yield0. A quadratic curve regression was used to fit the response of yield to N application in “3414” experiments. Analysis of variance (ANOVA) was used to test the differences of NREac% among treatments and experiment sites.
3. Results
3.1. Factors Affecting NREac
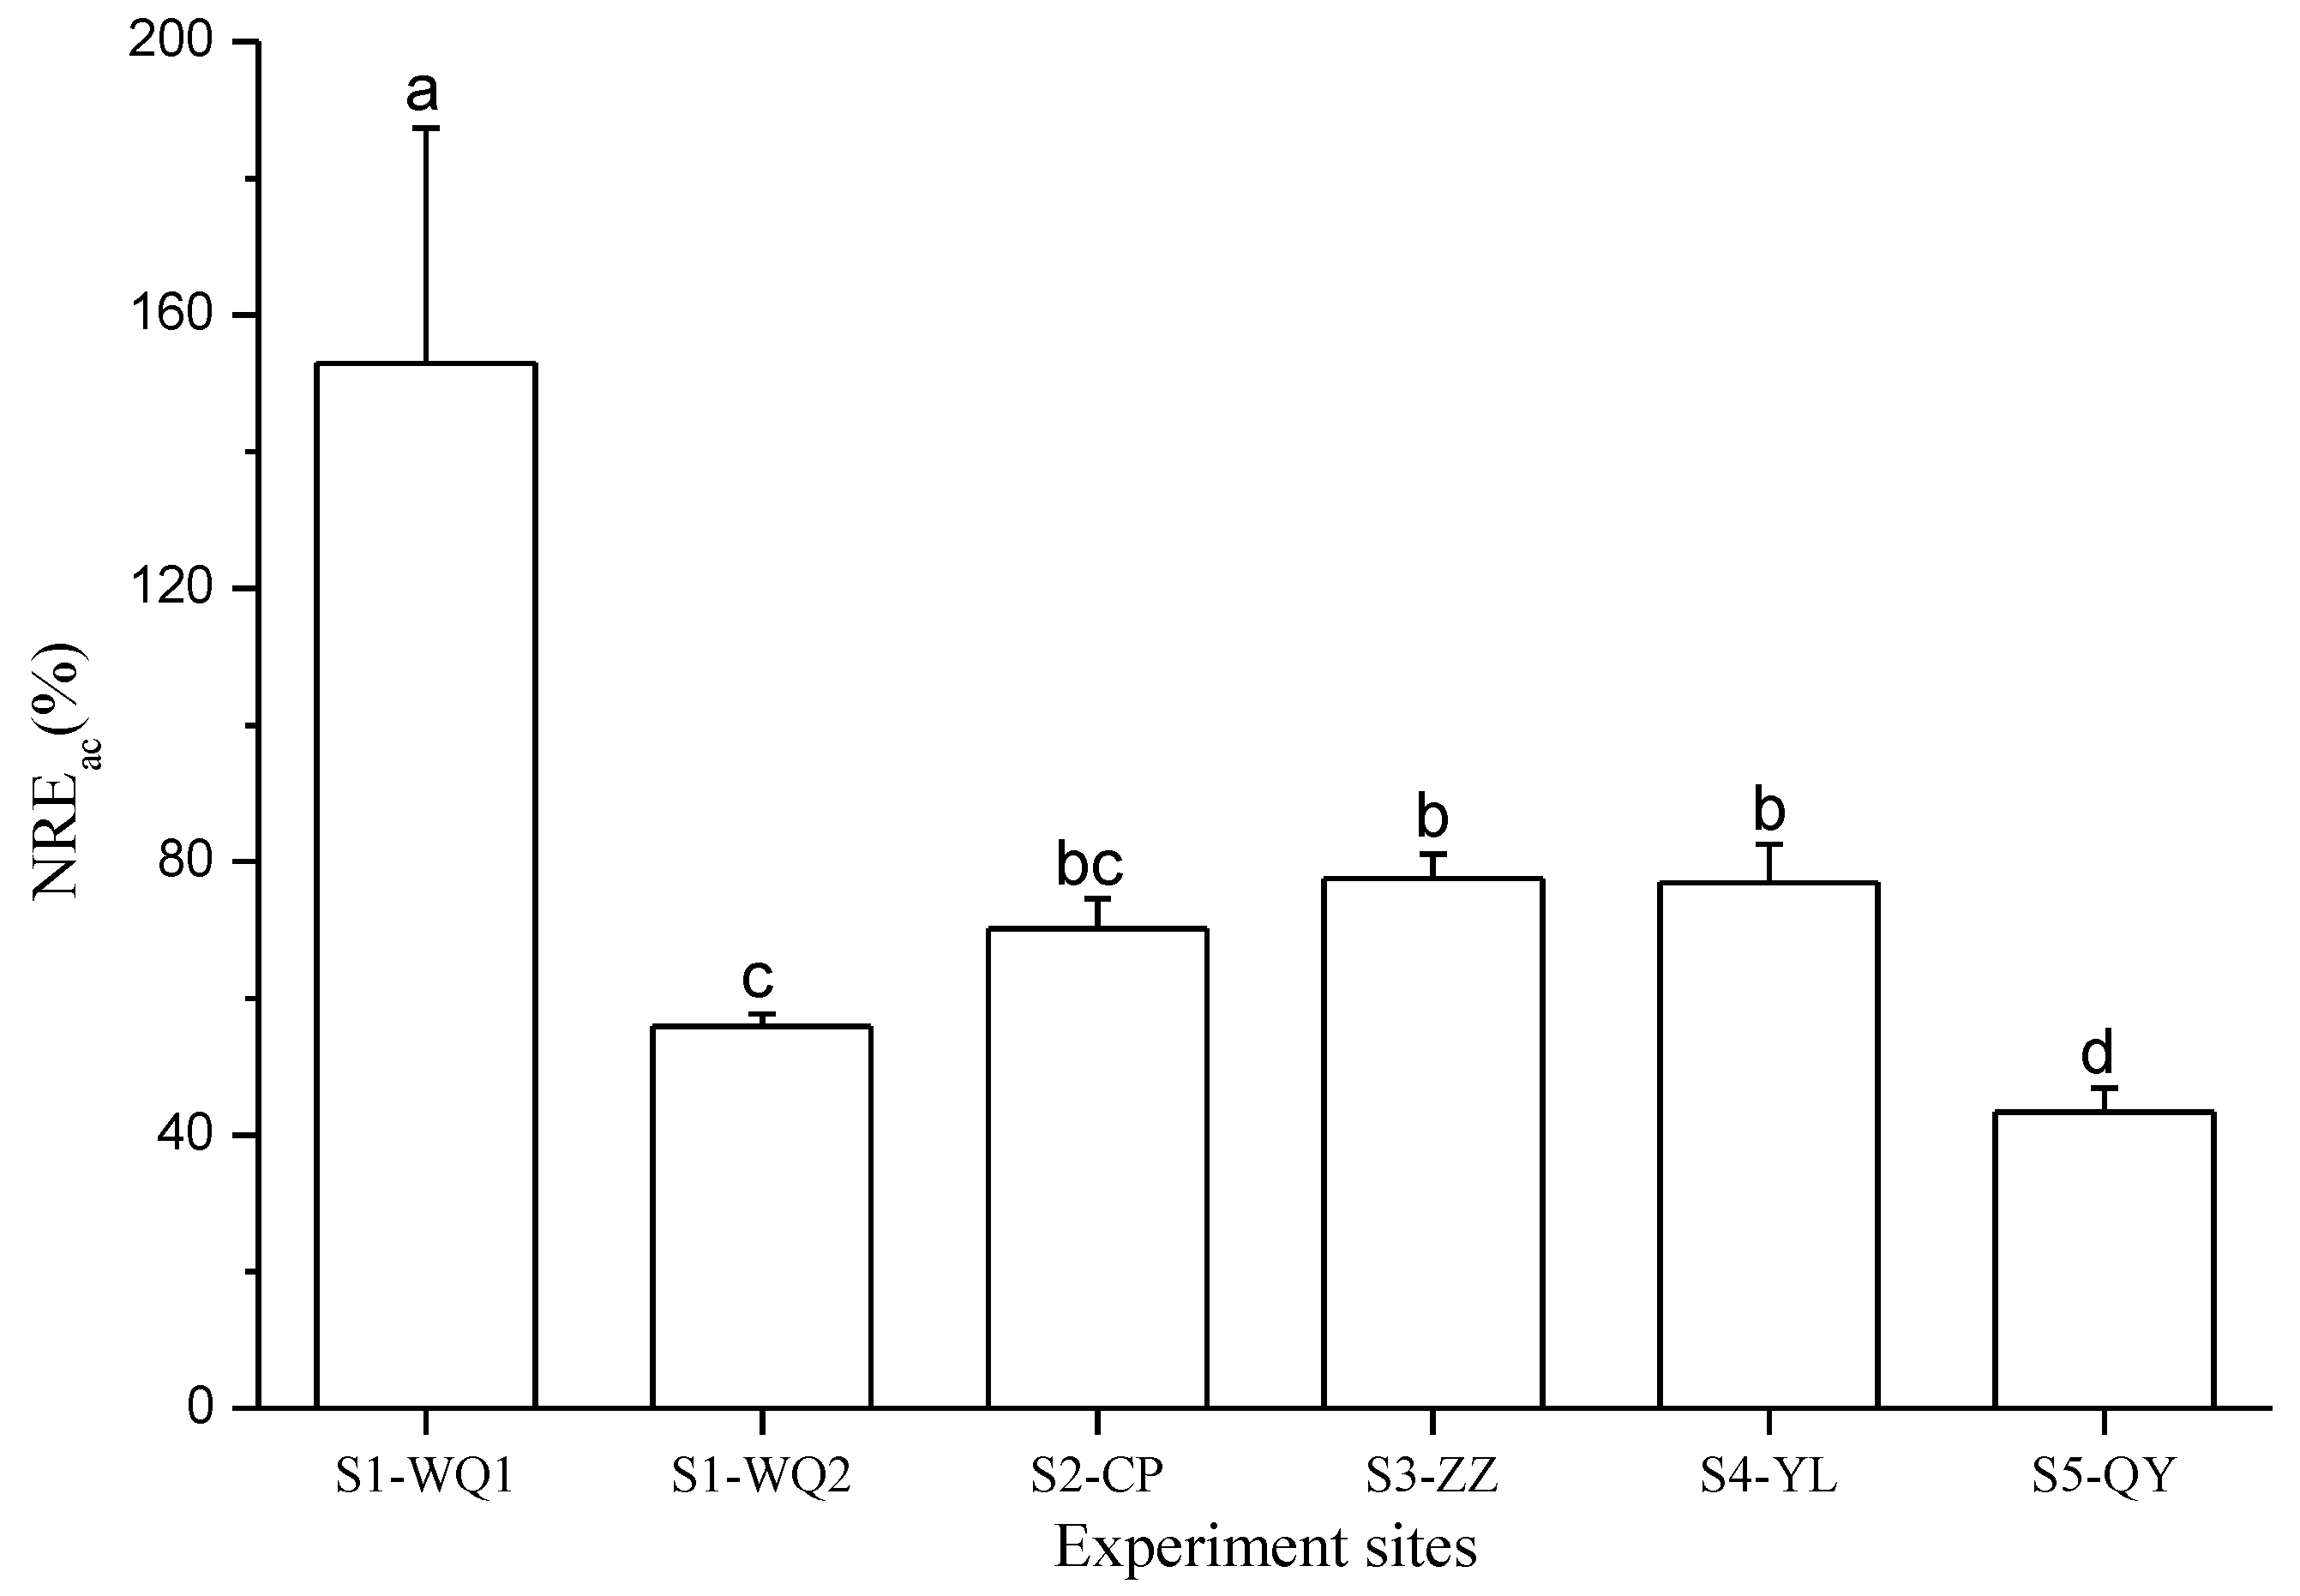
Apparent accumulated nitrogen recovery efficiencies (NREac) for the whole years of cultivation (15 years) are shown in Table 2. Values of NREac for all treatments have a wide variation that ranged from 24 to 161%. Except all treatments in S5-QY and S1-WQ1 during 1991–1994, and N in S2-CP and S4-YL, NREac from the same treatment were always higher in the wheat–maize rotation per year (in S2-CP, S3-ZZ and S4-YL) than in the wheat–maize-maize rotation per 3 years (in S1-WQ2). And averages of the former were 40, 46, 71, 75, 62, 71 and 62 for N, NK, NP, NPK, FS, FM and HF treatments, respectively. When comparing NREac among treatments combined application of N, P and K in all experimental sites, there were also discrepancies. NREac from the NPK treatment were always higher than that from incomplete nutrients treatments, in which the values from NP were the highest followed by that from NK and N in all experiment sites (except from N and NK in S1-WQ2). Especially, NREac from NPK was significant higher in S1-WQ1 with lower N input than in S1-WQ2 with normal N input. There were no significant differences among NREac from NPK in the wheat–maize rotation per year (in S2-CP, S3-ZZ and S4-YL) and the average of NREac was 75% with a standard deviation of 6% (Figure 1).
On the other hand, NREac was also affected by N rates. The higher N rates (HF) are always lower than normal N rates in NREac in all sites except S5-QY. Due to its location in the subtropical humid climate zone characterized by higher temperature (mean annual temperature 18.3 °C) and intensive precipitation (the sum of precipitation from Mar. to Aug. accounting for 70% of precipitation in a whole year), values of NREac from inorganic N treatments (N, NK, NP and NPK) are the lower than the combined treatments of inorganic and organic N in S5-QY. These results were mainly attributed to decreasing soil pH. At the start of experiment, the initial soil pH in S5-QY was 5.7, where the growth of wheat and maize might be restricted. Furthermore, N fertilization accelerated soil acidification. In 2005, soil pH decreased approximately to 4.
3.2. Assessment of Nf.opt and Relationship between Yieldopt and Yield0
Using 3414 data, correlations between Nf·opt estimated by NREac and Nf·opt measured with a quadratic curve are illustrated in Figure 2. For both of wheat and maize, the values of r2 are above 0.9 with significant relationships (p < 0.01) which suggested that NREac of 75% from NPK in S2-CP, S3-ZZ and S4-YL is an optimal NREac. Meanwhile, relationships between Yieldopt and Yield0 were illustrated in Figure 3, where values of r2 are 0.62 and 0.73 for wheat and maize, respectively. And both correlations are significant (p < 0.01).
4. Discussion
NREac are affected by cropping, soil properties and the environment, etc. Usually, crop rotation has higher nutrients recovery efficiency than monoculture. Long-term studies showed that crop rotation contributed to maintaining higher production levels [31]. Furthermore, the present study proved that the frequency of crop rotation could strengthen the trend outlined by Peterson and Varvel [32,33,34]. Without nutrient deficiency (from NPK, FS, FM and HF), NREac in a three-year rotation (S1-WQ2) was always far lower than from a one-year rotation except in S5-QY (Table 2 and Figure 1). Moreover, soil texture might have an effect on mineralization and immobilization of soil nitrogen that finally influenced NREac. In the present study, clay content in S1-WQ and S5-QY were higher than in the other three sites (Table 1). Consequently, all NREac from sufficient nutrients were lower in S1-WQ2 and S5-QY than that in the other sites (Table 2 and Figure 1). This result was consisted with Hassink [35], who found that there was a significant negative relationship between clay content and the N mineralization rate. Soil pH is another soil property that affected NREac. There was an initial lower soil pH of 5.7 (Table 1) and gradual acidification due to continuous N fertilization in S5-QY. Liu et al. [25] discussed the determinant for plant growth due to decreasing pH, and eventually a lower NREac irreversibly occurred. In general, providing enough nutrients without other soil limitations in the same cropping period (S2-CP, S3-ZZ and S4-YL), NERac from NPK had a narrow variation with a range of 6 and maintained a higher level (average of 75%) (Table 2 and Figure 1).
The response of grain yield to applied N from NPK treatments is classically illustrated in Olfs et al. [8]. Grain yield increased with gradually increasing rate of applied N, which followed by an inflection point called an economically optimal yield (Yieldopt) when the profit from an increased yield of added N equalled zero. The corresponding applied N rate is called the economically optimal N rate (Nf.opt). Especially in the present study, grain yields were not significantly different between NPK and high N fertilization (HF) [25]. Therefore, based on the responses of grain yield to applied N [8], it was inferred that grain yield from NPK could be the Yieldopt and the corresponding N rate was equal to Nf.opt. Furthermore, there is a good correlation of Nf.opt between estimated by NREac (75%) and measured using a quadratic curve-fitting with data from the ‘3414′ design (Figure 2), which reconfirmed that the inference is correct. Therefore, the present study concluded that NREac of 75% could be equivalent to NREac.opt and Equation (3) could be used to estimate Nf.opt in wheat–maize cropping systems in China.
When the N rate exceeds crop N requirement, there is an accumulation of NO3−-N in the soil profile [36,37] as shown in Olfs et al. [8]. Moreover, the accumulated trend could be strengthened gradually with a further increasing N rate [8,38]. Previous research found that the content of NO3−-N from the NPK treatment used in the present study were lower in the 0–90 cm soil profile (approximate 100, 30 and 60 kg ha−1 in S2-CP, S3-ZZ and S4-YL, respectively) [39,40,41] which did not exceed the critical value of soil nitrate-N (a range of 66–118 kg ha−1) in the top 90 cm of the soil profile for high yield in the wheat–maize cropping system [22,42]. Moreover, nitrate accumulation did not occur in the deeper soil profile [39,40,41]. All of these observations suggested that N rates from the NKP treatment would be the rational N rates again and further confirmed that the N rates could maintain the apparent N balance of a soil–plant system in the three sites.
However, accumulation of NO3−-N in soil profile and nitrate leaching into ground water were serious and prevalent in wheat–maize cropping system in China [43]. Initially, agronomist have focused on NO3−-N accumulation mostly for environment pollution [44] and gradually utilized them by the subsequent crop [22,42,45]. Cui et al. [42] reported that NO3−-N content in the top 90 cm soil should be maintained at a level of about 87 kg ha−1 after maize harvest. Furthermore, the numerical relationship between residual soil-N and applied N was that 1 kg soil NO3−-N in the 0–90 cm soil profile was equivalent to 1.23 kg fertilizer-N [42]. The right side in Equation (3), therefore, should add Ns to utilize the abundant NO3−-N using the following equation:
where NO3−-N means the nitrate-N content (kg ha−1) in the top 90 cm soil profile, where 87 kg ha−1 is a critical value of soil NO3−-N balancing the benefits between the economy and the environment. In other words, neither the nitrate leaching risk nor depletion of NO3−-N happens in a soil profile while the content of soil NO3−-N is maintained at the critical value.
The nitrate-N approach, however, would already provide a method to utilize the abundant soil residual N, but implementation of the method is a challenge. One of the reasons is that the interval between the growth of maize and wheat is too short to determine soil nitrate in the wheat–maize cropping system in China. Additionally, the extension of the soil test at the farm level would be insurmountable due to the number of small farms involved. Therefore, a more feasible way for using Ns was needed in the present study. Fortunately, Cui [22,42] reported that the relationship between grain yield of wheat and maize and initial soil NO3−-N content in the top 90 cm of the soil profile before sowing were fitted by the following equations:
where RYWheat and RYMaize are the relative yields to the local highest yields of wheat and maize, respectively. And 0.16 and 0.21 were numerical relationships between relative grain yield and initial NO3−-N (0–90 cm soil profile) for wheat and maize, respectively.
To maintain yields at a rational level, the content of soil NO3−-N has to keep up with the critical value. Combining of Equations (8)–(10) and Figure 3, Ns could be calculated, called a basic soil productivity approach, using the following equations:
where 81.7(%) and 78.7(%) are two critical values of RYwheat and RYmaize, respectively. Exceeding the values means that N rate should be reduced in order to crop unitizing N from the abundant soil NO3−-N. Yieldopt is a goal yield that was estimated by an average of recently five-year yields multiplied by 1.1 [46]. Therefore, the abundant soil NO3−-N could be utilized by a basic soil productivity approach more easily than a nitrate-N approach.
In general, yield-based N fertilizer recommendations were not completely accepted by agronomists and farmers at its inception due to limitations such as yield variability [47,48], uncertainty of N recovery efficiency estimated by the difference or isotopic methods [18] because of the complexity of the soil-supplying N capacity [19,20,21]. However, based on the present study, the theory of yield-based N fertilizer recommendation was further improved. Particularly, it could be adapted in the wheat–maize cropping areas in China.
5. Conclusions
Apparent accumulated nitrogen recovery (NREac) was affected by a multitude of factors. The present result that the three-year rotation (S1-WQ2) was always far lower than from the one-year rotation in NREac suggested that a frequent of crop rotation affected the N cycle. Moreover, soil texture also affected NREac. In S1-WQ and S5-QY with higher soil clay contents, NREac from all treatments were always lower than that in the other sites with lower soil clay contents. In general, from the NPK treatment in S2-CP, S3-ZZ and S4-YL, the nitrate contents were lower and its accumulation did not occur in the soil profile. In other words, the present study provided evidence that N applied from the NPK treatment maintained an apparent N balance in the soil–plant system in the three sites. Meanwhile, NERac had a narrow variation with a range of 6% and maintained a higher level (average of 75%). Furthermore, grain yield from NPK in the three sites were the Yieldopt where NREac could be equal to that at Nf.opt. Additionally, based on the fact of accumulation of NO3−-N in the soil profile being serious and prevalent in the wheat–maize cropping system in China, NO3−-N should be utilized by subsequent crops. However, due to the logistical obstacle of determining profile NO3−-N at the farm level, a basic soil productivity approach was advocated in the present study. A yield-based N fertilizer recommendation was proposed in the present study yet needs to be further evaluated. For example, the critical value of NO3−-N is variable and should be adjusted in relation to soil type and management.
Author Contributions
Formal analysis, Y.J. and Q.L.; Funding acquisition, J.L. (Jie Liu) and Q.L.; Investigation, J.L. (Jie Liu); Resources, J.L. (Jumei Li) and Y.M.; Supervision, Y.M.; Writing—original draft, J.L. (Jie Liu).
Funding
This research was funded by National key R & D program (2016YFD0200301) and Scientific Research Project of Beijing Educational Committee (KM201710020008).
Acknowledgments
The authors thank all scientists associated with the National Long-Term Monitoring Network of Soil Fertility and Fertilizer Effects in China for providing the historic dataset of the long-term experiments, and Phillip M. Chalk for review and correction for English.
Conflicts of Interest
The authors declare no conflict of interest.
Appendix A

Table A1.
3414 data quoted from CSTJ (China Science and Technology Journal Database).
| Sites | Treatments | Applied Rate (kg ha−1) | Grain Yield (kg ha−1) | r2 | References | ||
|---|---|---|---|---|---|---|---|
| Village, Province | N | P | K | Wheat | |||
| Kaoshan, | N0P2K2 | 0 | 72 | 150 | 4260 | 0.946 | 1 |
| Anhui | N1P2K2 | 90 | 72 | 150 | 5280 | ||
| N2P2K2 | 180 | 72 | 150 | 6645 | |||
| N3P2K2 | 270 | 72 | 150 | 6390 | |||
| Xinji, | N0P2K2 | 0 | 26 | 75 | 2766 | 0.997 | 2 |
| Anhui | N1P2K2 | 98 | 26 | 75 | 4820 | ||
| N2P2K2 | 195 | 26 | 75 | 5852 | |||
| N3P2K2 | 293 | 26 | 75 | 6524 | |||
| Gupeizhen, | N0P2K2 | 0 | 90 | 150 | 3178 | 0.997 | 3 |
| Anhui | N1P2K2 | 90 | 90 | 150 | 6392 | ||
| N2P2K2 | 180 | 90 | 150 | 7206 | |||
| N3P2K2 | 270 | 90 | 150 | 6321 | |||
| Hengshan, | N0P2K2 | 0 | 90 | 150 | 4435 | 0.993 | 3 |
| Anhui | N1P2K2 | 90 | 90 | 150 | 5728 | ||
| N2P2K2 | 180 | 90 | 150 | 6826 | |||
| N3P2K2 | 270 | 90 | 150 | 6964 | |||
| Mingdong, | N0P2K2 | 0 | 90 | 150 | 5195 | 0.940 | 3 |
| Anhui | N1P2K2 | 90 | 90 | 150 | 6818 | ||
| N2P2K2 | 180 | 90 | 150 | 8358 | |||
| N3P2K2 | 270 | 90 | 150 | 7318 | |||
| Nongkesuo, | N0P2K2 | 0 | 90 | 150 | 4040 | 0.990 | 3 |
| Anhui | N1P2K2 | 90 | 90 | 150 | 5912 | ||
| N2P2K2 | 180 | 90 | 150 | 7070 | |||
| N3P2K2 | 270 | 90 | 150 | 6502 | |||
| Pancun, | N0P2K2 | 0 | 90 | 150 | 5460 | 0.994 | 3 |
| Anhui | N1P2K2 | 90 | 90 | 150 | 7463 | ||
| N2P2K2 | 180 | 90 | 150 | 8160 | |||
| N3P2K2 | 270 | 90 | 150 | 8314 | |||
| Shaogang, | N0P2K2 | 0 | 90 | 150 | 3847 | 0.984 | 3 |
| Anhui | N1P2K2 | 90 | 90 | 150 | 6084 | ||
| N2P2K2 | 180 | 90 | 150 | 7121 | |||
| N3P2K2 | 270 | 90 | 150 | 5630 | |||
| Shiba, | N0P2K2 | 0 | 90 | 150 | 3551 | 0.999 | 3 |
| Anhui | N1P2K2 | 90 | 90 | 150 | 6027 | ||
| N2P2K2 | 180 | 90 | 150 | 7050 | |||
| N3P2K2 | 270 | 90 | 150 | 7022 | |||
| Zhaoxin, | N0P2K2 | 0 | 90 | 150 | 5220 | 0.920 | 3 |
| Anhui | N1P2K2 | 90 | 90 | 150 | 6183 | ||
| N2P2K2 | 180 | 90 | 150 | 7878 | |||
| N3P2K2 | 270 | 90 | 150 | 7586 | |||
| Longkang, | N0P2K2 | 0 | 52 | 124 | 2754 | 0.984 | 4 |
| Anhui | N1P2K2 | 98 | 52 | 124 | 4367 | ||
| N2P2K2 | 195 | 52 | 124 | 5987 | |||
| N3P2K2 | 293 | 52 | 124 | 6090 | |||
| Xiaolou, | N0P2K2 | 0 | 43 | 81 | 5147 | 0.908 | 5 |
| Anhui | N1P2K2 | 98 | 43 | 81 | 5876 | ||
| N2P2K2 | 195 | 43 | 81 | 7209 | |||
| N3P2K2 | 293 | 43 | 81 | 6917 | |||
| Gaohuang, | N0P2K2 | 0 | 33 | 81 | 4545 | 1.000 | 6 |
| Anhui | N1P2K2 | 113 | 33 | 81 | 6240 | ||
| N2P2K2 | 225 | 33 | 81 | 7200 | |||
| N3P2K2 | 338 | 33 | 81 | 7350 | |||
| Xuji, | N0P2K2 | 0 | 26 | 75 | 4223 | 0.999 | 7 |
| Anhui | N1P2K2 | 90 | 26 | 75 | 5646 | ||
| N2P2K2 | 180 | 26 | 75 | 6198 | |||
| N3P2K2 | 270 | 26 | 75 | 5663 | |||
| Toupu, | N0P2K2 | 0 | 39 | 62 | 3945 | 0.952 | 8 |
| Anhui | N1P2K2 | 83 | 39 | 62 | 5444 | ||
| N2P2K2 | 165 | 39 | 62 | 7314 | |||
| N3P2K2 | 248 | 39 | 62 | 6935 | |||
| Yonggu, | N0P2K2 | 0 | 39 | 60 | 5475 | 0.972 | 9 |
| Anhui | N1P2K2 | 90 | 39 | 60 | 6375 | ||
| N2P2K2 | 180 | 39 | 60 | 7238 | |||
| N3P2K2 | 270 | 39 | 60 | 7035 | |||
| Dazhuang (a), | N0P2K2 | 0 | 39 | 87 | 3522 | 0.921 | 10 |
| Gansu | N1P2K2 | 60 | 39 | 87 | 4482 | ||
| N2P2K2 | 120 | 39 | 87 | 5460 | |||
| N3P2K2 | 180 | 39 | 87 | 4716 | |||
| Dazhuang (b), | N0P2K2 | 0 | 39 | 87 | 1511 | 0.963 | 10 |
| Gansu | N1P2K2 | 60 | 39 | 87 | 2825 | ||
| N2P2K2 | 120 | 39 | 87 | 3021 | |||
| N3P2K2 | 180 | 39 | 87 | 3263 | |||
| Handian, | N0P2K2 | 0 | 39 | 87 | 2883 | 0.898 | 10 |
| Gansu | N1P2K2 | 60 | 39 | 87 | 3294 | ||
| N2P2K2 | 120 | 39 | 87 | 3833 | |||
| N3P2K2 | 180 | 39 | 87 | 3512 | |||
| Nanhu, | N0P2K2 | 0 | 39 | 87 | 3960 | 0.995 | 10 |
| Gansu | N1P2K2 | 60 | 39 | 87 | 4200 | ||
| N2P2K2 | 120 | 39 | 87 | 4095 | |||
| N3P2K2 | 180 | 39 | 87 | 3465 | |||
| Tonghua, | N0P2K2 | 0 | 39 | 87 | 2129 | 0.990 | 10 |
| Gansu | N1P2K2 | 60 | 39 | 87 | 3458 | ||
| N2P2K2 | 120 | 39 | 87 | 4467 | |||
| N3P2K2 | 180 | 39 | 87 | 4322 | |||
| Yongning, | N0P2K2 | 0 | 39 | 87 | 3020 | 0.855 | 10 |
| Gansu | N1P2K2 | 60 | 39 | 87 | 3455 | ||
| N2P2K2 | 120 | 39 | 87 | 4313 | |||
| N3P2K2 | 180 | 39 | 87 | 3932 | |||
| Yuebao, | N0P2K2 | 0 | 39 | 87 | 2297 | 0.708 | 10 |
| Gansu | N1P2K2 | 60 | 39 | 87 | 2314 | ||
| N2P2K2 | 120 | 39 | 87 | 2409 | |||
| N3P2K2 | 180 | 39 | 87 | 2168 | |||
| Zhaodun, | N0P2K2 | 0 | 39 | 87 | 834 | 0.728 | 10 |
| Gansu | N1P2K2 | 60 | 39 | 87 | 1536 | ||
| N2P2K2 | 120 | 39 | 87 | 3858 | |||
| N3P2K2 | 180 | 39 | 87 | 2505 | |||
| Gaocheng (City, a), | N0P2K2 | 0 | 65 | 124 | 5805 | 0.998 | 11 |
| Hebei | N1P2K2 | 113 | 65 | 124 | 6795 | ||
| N2P2K2 | 225 | 65 | 124 | 6915 | |||
| N3P2K2 | 338 | 65 | 124 | 5985 | |||
| Gaocheng (City, b), | N0P2K2 | 0 | 65 | 124 | 5685 | 0.967 | 11 |
| Hebei | N1P2K2 | 113 | 65 | 124 | 7545 | ||
| N2P2K2 | 225 | 65 | 124 | 7950 | |||
| N3P2K2 | 338 | 65 | 124 | 8715 | |||
| Gaocheng (City, c), | N0P2K2 | 0 | 65 | 124 | 6555 | 0.925 | 11 |
| Hebei | N1P2K2 | 113 | 65 | 124 | 6915 | ||
| N2P2K2 | 225 | 65 | 124 | 7350 | |||
| N3P2K2 | 338 | 65 | 124 | 7140 | |||
| Gaocheng (City, d), | N0P2K2 | 0 | 65 | 100 | 5910 | 0.980 | 11 |
| Hebei | N1P2K2 | 90 | 65 | 100 | 7275 | ||
| N2P2K2 | 180 | 65 | 100 | 7260 | |||
| N3P2K2 | 270 | 65 | 100 | 6570 | |||
| Wangguaying, | N0P2K2 | 0 | 31 | 60 | 4886 | 0.995 | 12 |
| Henan | N1P2K2 | 81 | 31 | 60 | 6270 | ||
| N2P2K2 | 162 | 31 | 60 | 6615 | |||
| N3P2K2 | 243 | 31 | 60 | 6324 | |||
| Xieqiaozhen, | N0P2K2 | 0 | 39 | 87 | 3810 | 0.989 | 13 |
| Jiangsu | N1P2K2 | 105 | 39 | 87 | 5745 | ||
| N2P2K2 | 210 | 39 | 87 | 6270 | |||
| N3P2K2 | 315 | 39 | 87 | 6345 | |||
| Liutao, | N0P2K2 | 0 | 33 | 50 | 4503 | 0.930 | 14 |
| Jiangsu | N1P2K2 | 135 | 33 | 50 | 5623 | ||
| N2P2K2 | 270 | 33 | 50 | 5558 | |||
| N3P2K2 | 405 | 33 | 50 | 5367 | |||
| Sitaocun, | N0P2K2 | 0 | 33 | 50 | 3420 | 0.979 | 15 |
| Jiangsu | N1P2K2 | 135 | 33 | 50 | 5145 | ||
| N2P2K2 | 270 | 33 | 50 | 5445 | |||
| N3P2K2 | 405 | 33 | 50 | 5400 | |||
| Qianshan, | N0P2K2 | 0 | 37 | 31 | 4770 | 0.946 | 16 |
| Qinghai | N1P2K2 | 59 | 37 | 31 | 5760 | ||
| N2P2K2 | 117 | 37 | 31 | 7571 | |||
| N3P2K2 | 176 | 37 | 31 | 7650 | |||
| Chengguan, | N0P2K2 | 0 | 120 | 90 | 7464 | 1.000 | 17 |
| Shaanxi | N1P2K2 | 75 | 120 | 90 | 8122 | ||
| N2P2K2 | 150 | 120 | 90 | 8543 | |||
| N3P2K2 | 225 | 120 | 90 | 8671 | |||
| Chuanyuan, | N0P2K2 | 0 | 52 | 100 | 4458 | 0.993 | 18 |
| Shaanxi | N1P2K2 | 90 | 52 | 100 | 6568 | ||
| N2P2K2 | 180 | 52 | 100 | 7442 | |||
| N3P2K2 | 270 | 52 | 100 | 8111 | |||
| Qili, | N0P2K2 | 0 | 28 | 60 | 3750 | 0.992 | 19 |
| Sichuan | N1P2K2 | 59 | 28 | 60 | 5040 | ||
| N2P2K2 | 117 | 28 | 60 | 5622 | |||
| N3P2K2 | 176 | 28 | 60 | 6260 | |||
| Qixiang, | N0P2K2 | 0 | 90 | 30 | 5760 | 0.973 | 20 |
| Xinjiang | N1P2K2 | 98 | 90 | 30 | 6690 | ||
| N2P2K2 | 195 | 90 | 30 | 7980 | |||
| N3P2K2 | 293 | 90 | 30 | 8175 | |||
| Zepu (County), | N0P2K2 | 0 | 39 | 25 | 5000 | 1.000 | 21 |
| Xinjiang | N1P2K2 | 93 | 39 | 25 | 7046 | ||
| N2P2K2 | 186 | 39 | 25 | 8182 | |||
| N3P2K2 | 279 | 39 | 25 | 8455 | |||
| Maize | |||||||
| Caozhuang, | N0P2K2 | 0 | 589 | 75 | 5562 | 0.895 | 22 |
| Anhui | N1P2K2 | 113 | 589 | 75 | 5926 | ||
| N2P2K2 | 225 | 589 | 75 | 6176 | |||
| N3P2K2 | 338 | 589 | 75 | 5548 | |||
| Sanshipu, | N0P2K2 | 0 | 47 | 119 | 5259 | 0.999 | 23 |
| Anhui | N1P2K2 | 150 | 47 | 119 | 7069 | ||
| N2P2K2 | 300 | 47 | 119 | 8112 | |||
| N3P2K2 | 450 | 47 | 119 | 8108 | |||
| Gengzhuang, | N0P2K2 | 0 | 52 | 100 | 10869 | 0.967 | 24 |
| Liaoning | N1P2K2 | 105 | 52 | 100 | 12300 | ||
| N2P2K2 | 210 | 52 | 100 | 12401 | |||
| N3P2K2 | 315 | 52 | 100 | 12134 | |||
| Sandu(a), | N0P2K2 | 0 | 26 | 124 | 6204 | 0.967 | 25 |
| Guangxi | N1P2K2 | 105 | 26 | 124 | 8898 | ||
| N2P2K2 | 210 | 26 | 124 | 9102 | |||
| N3P2K2 | 315 | 26 | 124 | 8726 | |||
| Caohai, | N0P2K2 | 0 | 380 | 274 | 8266 | 0.988 | 26 |
| Guizhou | N1P2K2 | 235 | 380 | 274 | 9942 | ||
| N2P2K2 | 470 | 380 | 274 | 9845 | |||
| N3P2K2 | 705 | 380 | 274 | 10614 | |||
| Shazi(a), | N0P2K2 | 0 | 52 | 149 | 5369 | 0.967 | 27 |
| Guizhou | N1P2K2 | 90 | 52 | 149 | 7204 | ||
| N2P2K2 | 180 | 52 | 149 | 7604 | |||
| N3P2K2 | 270 | 52 | 149 | 7437 | |||
| Shazi(b), | N0P2K2 | 0 | 65 | 199 | 6503 | 0.998 | 27 |
| Guizhou | N1P2K2 | 113 | 65 | 199 | 7637 | ||
| N2P2K2 | 225 | 65 | 199 | 8571 | |||
| N3P2K2 | 338 | 65 | 199 | 8071 | |||
| Tianping, | N0P2K2 | 0 | 59 | 174 | 8199 | 1.000 | 28 |
| Guizhou | N1P2K2 | 105 | 59 | 174 | 8653 | ||
| N2P2K2 | 210 | 59 | 174 | 8639 | |||
| N3P2K2 | 315 | 59 | 174 | 9204 | |||
| Lejian(a), | N0P2K2 | 0 | 52 | 149 | 1766 | 0.987 | 29 |
| Guizhou | N1P2K2 | 90 | 52 | 149 | 4295 | ||
| N2P2K2 | 180 | 52 | 149 | 4467 | |||
| N3P2K2 | 270 | 52 | 149 | 2298 | |||
| Lejian(b), | N0P2K2 | 0 | 59 | 174 | 4176 | 0.996 | 29 |
| Guizhou | N1P2K2 | 105 | 59 | 174 | 6392 | ||
| N2P2K2 | 210 | 59 | 174 | 6902 | |||
| N3P2K2 | 315 | 59 | 174 | 6854 | |||
| Zhuping (County, a), | N0P2K2 | 0 | 39 | 75 | 4886 | 1.000 | 30 |
| Henan | N1P2K2 | 120 | 39 | 75 | 6683 | ||
| N2P2K2 | 240 | 39 | 75 | 7518 | |||
| N3P2K2 | 360 | 39 | 75 | 6828 | |||
| Zhuping (County, b), | N0P2K2 | 0 | 39 | 75 | 5423 | 0.995 | 30 |
| Henan | N1P2K2 | 120 | 39 | 75 | 7265 | ||
| N2P2K2 | 240 | 39 | 75 | 8100 | |||
| N3P2K2 | 360 | 39 | 75 | 7857 | |||
| Zhuping (County, c), | N0P2K2 | 0 | 33 | 62 | 4962 | 0.999 | 30 |
| Henan | N1P2K2 | 105 | 33 | 62 | 7203 | ||
| N2P2K2 | 210 | 33 | 62 | 8255 | |||
| N3P2K2 | 315 | 33 | 62 | 7322 | |||
| Zhuping (County, d), | N0P2K2 | 0 | 33 | 62 | 4590 | 0.964 | 30 |
| Henan | N1P2K2 | 105 | 33 | 62 | 6713 | ||
| N2P2K2 | 210 | 33 | 62 | 7560 | |||
| N3P2K2 | 315 | 33 | 62 | 6870 | |||
| Zhuping (County, e), | N0P2K2 | 0 | 33 | 62 | 3311 | 0.997 | 30 |
| Henan | N1P2K2 | 105 | 33 | 62 | 4658 | ||
| N2P2K2 | 210 | 33 | 62 | 6102 | |||
| N3P2K2 | 315 | 33 | 62 | 5778 | |||
| Zhuping (County, f), | N0P2K2 | 0 | 26 | 50 | 4806 | 0.998 | 30 |
| Henan | N1P2K2 | 90 | 26 | 50 | 5429 | ||
| N2P2K2 | 180 | 26 | 50 | 6228 | |||
| N3P2K2 | 270 | 26 | 50 | ||||
| Jiaohe (City), | N0P2K2 | 0 | 26 | 62 | 7275 | 0.993 | 31 |
| Jilin | N1P2K2 | 75 | 26 | 62 | 9030 | ||
| N2P2K2 | 150 | 26 | 62 | 10230 | |||
| N3P2K2 | 225 | 26 | 62 | 10395 | |||
| Shuangdian, | N0P2K2 | 0 | 21 | 102 | 5054 | 0.941 | 32 |
| Jiangsu | N1P2K2 | 150 | 21 | 102 | 8607 | ||
| N2P2K2 | 300 | 21 | 102 | 9970 | |||
| N3P2K2 | 450 | 21 | 102 | 10813 | |||
| Wangji, | N0P2K2 | 0 | 39 | 100 | 5130 | 0.998 | 33 |
| Jiangsu | N1P2K2 | 165 | 39 | 100 | 6375 | ||
| N2P2K2 | 330 | 39 | 100 | 8025 | |||
| N3P2K2 | 495 | 39 | 100 | 7620 | |||
| Gengzhuang (b), | N0P2K2 | 0 | 52 | 100 | 6245 | 0.986 | 34 |
| Liaoning | N1P2K2 | 90 | 52 | 100 | 7620 | ||
| N2P2K2 | 180 | 52 | 100 | 8349 | |||
| N3P2K2 | 270 | 52 | 100 | 8100 | |||
| Yezhai, | N0P2K2 | 0 | 65 | 50 | 6905 | 0.999 | 35 |
| Ningxia | N1P2K2 | 113 | 65 | 50 | 9944 | ||
| N2P2K2 | 225 | 65 | 50 | 10779 | |||
| N3P2K2 | 338 | 65 | 50 | 11219 | |||
| Huangguan, | N0P2K2 | 0 | 52 | 50 | 4268 | 0.994 | 36 |
| Ningxia | N1P2K2 | 248 | 52 | 50 | 7016 | ||
| N2P2K2 | 495 | 52 | 50 | 8577 | |||
| N3P2K2 | 743 | 52 | 50 | 8129 | |||
| Gongu (County), | N0P2K2 | 0 | 72 | 49 | 12330 | 0.994 | 1 |
| Xinjiang | N1P2K2 | 48 | 72 | 49 | 13140 | ||
| N2P2K2 | 97 | 72 | 49 | 13350 | |||
| N3P2K2 | 145 | 72 | 49 | 14820 | |||
| Wenyaer, | N0P2K2 | 0 | 42 | 25 | 11700 | 0.994 | 38 |
| Xinjiang | N1P2K2 | 113 | 42 | 25 | 14588 | ||
| N2P2K2 | 225 | 42 | 25 | 16538 | |||
| N3P2K2 | 338 | 42 | 25 | 12278 | |||
| Jiucheng, | N0P2K2 | 0 | 33 | 50 | 4553 | 0.970 | 39 |
| Yunnan | N1P2K2 | 113 | 33 | 50 | 5654 | ||
| N2P2K2 | 225 | 33 | 50 | 6603 | |||
| N3P2K2 | 338 | 33 | 50 | 6804 | |||
| Luoxiong, | N0P2K2 | 0 | 52 | 90 | 6326 | 0.960 | 40 |
| Yunnan | N1P2K2 | 138 | 52 | 90 | 7268 | ||
| N2P2K2 | 276 | 52 | 90 | 8111 | |||
| N3P2K2 | 414 | 52 | 90 | 7808 | |||
| Zhongcun, | N0P2K2 | 0 | 24 | 75 | 3510 | 0.986 | 41 |
| Zhejiang | N1P2K2 | 86 | 24 | 75 | 5444 | ||
| N2P2K2 | 173 | 24 | 75 | 5734 | |||
| N3P2K2 | 259 | 24 | 75 | 6240 | |||
Appendix References
- Huang, S.; Zhang, Z. Study on “3414” fertilizer effect experiment of wheat in kaoshan village, Dingyuan County in 2006. Agric. Technol. Serv. 2008, 25, 39–40. (In Chinese)
- Li, J.; Li, Z.; Li, K.; Huang, S. Report on “3414” fertilization experiment of wheat. Anhui Agric. Sci. Bull. 2008, 14, 142–175. (In Chinese)
- You, J.; Zhou, F.; Li, P.; Yu, Y.; Ma, B.; Jiang, H. Study on soil testing and fertilization of wheat in Mingguang City. Anhui Agric. Sci. Bull. 2007, 13, 120–122. (In Chinese)
- Ma, L.; Zhao, Y.; Yang, L.; Zhan, Q.; Fang, Y. Preliminary report on “3414” fertilization experiment of wheat. Anhui Agric. Sci. Bull. 2009, 15, 90–189. (In Chinese)
- Zhang, W. Report on fertilizer effect of “3414” field wheat experiment. Anhui Agric. Sci. Bull. 2009, 15, 62–63, 167. (In Chinese)
- Dai, H. Report on “3414” formula fertilization experiment of wheat. Anhui Agric. Sci. Bull. 2009, 15, 131–132. (In Chinese)
- Zhang, D.; Liu, L.; Hu, S.; Zhao, Q. Preliminary report on “3414” fertilizer effect experiment of wheat. J. Anhui Agric. Sci. 2008, 36, 15587–15589. (In Chinese)
- Liu, S. Report on “3414” fertilizer effect field wheat experiment in Wuhe County in 2007. Anhui Agric. Sci. Bull. 2008, 14, 89, 105. (In Chinese)
- Wu, X.; Chen, J.; Wang, G.; Xu, H. Study on the economic benefits of balance fertilizer of N, P and K to wheat. J. Hebei Agric. Sci. 2008, 12, 47–48, 78. (In Chinese)
- Zhao, Z. Study on indices of soil testing and fertilization of wheat in Zhuanglang County. Gansu Agric. Sci. Technol. 2009, 7, 30–33. (In Chinese)
- Sun, Y.; Du, J.; Jia, L.; Liu, M. Study on fertilizer effect of “3414” experiment of winter wheat in Gaocheng city, Hebei province. J. Hebei Agric. Sci. 2008, 12, 84–86. (In Chinese)
- Li, M.; Wang, L. Preliminary report on “3414” experiment of winter wheat in Lushang County in 2007. Anhui Agric. Sci. Bull. 2008, 14, 67–71. (In Chinese)
- Chen, A.; Jiang, D.; Wang, H.; Mao, X. A “3414” fertilizer effect experiment of weak gluten wheat in oil sandy soil. Mod. Agric. Sci. Technol. 2009, 19, 15–16. (In Chinese)
- Gong, C. Preliminary study on fertilization of P and K to wheat. Barly Cereal Sci. 2008, 1, 39–42. (In Chinese)
- Wang, K.; Zhu, H.; Wu, L.; Xu, l. Fertilization effect of “3414” experiment on wheat in Sandy loam soil in Xiangshui County in 2007–2008. Mod. Agric. Sci. Technol. 2008, 24, 177–178. (In Chinese)
- Ren, J. Fertilization effect of “3414” experiment on wheat in Guide County shallow hill region. Agric. Technol. Serv. 2009, 26, 40. (In Chinese)
- Fan, L.; He, L. Preliminary report on “3414” fertilizer effect experiment of wheat. Plant Prot. 2009, 11, 35–36. (In Chinese)
- Du, J.; Zhu, S.; Yuan, W.; Hou, X. The application of “3414” experiment in the production of Wheat. Shaanxi J. Agric. Sci. 2009, 6, 12–14. (In Chinese)
- Li, C. Study on of “3414” fertilizer effect experiment of wheat. Jiangsu Agric. Sci. 2009, 4, 336–338. (In Chinese)
- Li, W. Summary on “3414” experiment of wheat in Maigaiti County. Xinjiang Agric. Sci. Technol. 2008, 180, 27. (In Chinese)
- Tuohetiniyazi, N.; Ta, Y. Summary on “3414” experiment of winter wheat. Xinjiang Agric. Sci. Technol. 2008, 181, 29. (In Chinese)
- Shao, L. Fertilization effect of “3414” experiment on summer maize. Anhui Agric. Sci. Bull. 2008, 14, 129–130. (In Chinese)
- Sun, Y. Fertilization effect of “3414” field experiment on maize in Yingzhou region in 2008. Mod. Agric. Sci. Technol. 2009, 15, 12, 14. (In Chinese)
- Huang, L. Study on “3414” fertilizer effect experiment of maize in Gengzhuang town, Haicheng city. Rain Fed Crops 2009, 29, 148–149. (In Chinese)
- Wei, Z.; Zeng, G.; Wei, M.; Peng, C. Preliminary report on fertilizer effect of “3414” soil testing and fertilization experiment on maize. Mod. Agric. Sci. 2009, 16, 48–49, 51. (In Chinese)
- Deng, D.; Xiao, G.; Wei, X.; Liu, Q.; Kong, F. Fertilizer effect on maize with “3414” experiment in high elevation mountainous area of Weining County. Mod. Agric. Sci. Technol. 2009, 5, 156, 158. (In Chinese)
- Jiang, Z. “3414” fertilizer effect experiment of maize in Qinglong County. Agric. Technol. Serv. 2008, 25, 45–46. (In Chinese)
- Yuan, M. “3414+1” fertilizer effect experiment of maize in Tianping country, Tongzhi County. Agric. Technol. Serv. 2009, 26, 38–39. (In Chinese)
- Huang, L.; Kuang, Y.; Feng, S.; Zhen, L.; He, D. Fertilization effect of “3414” experiment on maize in yellow earths. Agric. Technol. Serv. 2009, 26, 50–51. (In Chinese)
- Yan, H.; Jing, S.; Song, Q.; Zhang, J.; Song, X. Preliminary report on “3414” fertilizer effect field experiment of summer maize. J. Seed Ind. Guide 2009, 3, 27–29. (In Chinese)
- Jin, F.; Yan, X.; Lin, Y.; Gao, Y.; Liu, W. Study on fertilizer effect of N, P and K on maize. J. Jilin Agric. Sci. 2008, 33, 48–50. (In Chinese)
- Shen, J.; Song, Y.; Mao, B.; Xu, Q.L.C.; Zhou, M. Preliminary study on “3414” fertilizer effect experiment of maize in albic soils in Donghai County. Mod. Agric. 2009, 3, 29–30. (In Chinese)
- Wang, L.; Wang, C.; Liu, Y. “3414” fertilizer effect experiment of maize. Mod. Agric. Sci. Technol. 2008, 15, 201–202.
- Shao, L. “3414” fertilizer effect experiment of summer maize. Anhui Agric. Sci. Bull. 2008, 14, 129–130. (In Chinese)
- Wang, W.; He, X.; Wang, G.; Wang, L.; Li, X.; Li, W. “3414” fertilizer effect experiment of maize in southern Ningxia mountain area. Ningxia J. Agric. For. Sci. Technol. 2008, 6, 77–79. (In Chinese)
- Yin, X.; Zhu, G.; Ji, W.; Sun, W.; Wang, S.; Dong, P. Effects of “3414” different fertilizer ratio experiment on the yield of maize interplanted with wheat in Ningxia. Ningxia J. Agric. For. Sci. Technol. 2008, 3, 31–32. (In Chinese)
- Shadekebieke, T.; Baxian, W. Study on “3414” fertilizer experiment of maize. Rural Sci. Technol. 2008, 2, 19–20. (In Chinese)
- Wang, N.; Yang, A.; Huang, H.; Wu, S.; Wang, T. Report of “3414” experiment of maize in Wenyaer vellige, Yining County. Xinjiang Agric. Sci. Technol. 2008, 182, 25. (In Chinese)
- Zhu, N.; Wan, Y.; He, Y.; Du, W. Preliminary report on “3414” soil testing and fertilization experiment of maize in Luxi County. Yunnan Agric. Sci. Technol. 2009, S, 51–52. (In Chinese)
- Qin, X.; Ruan, Y. Study on “3414” soil testing and fertilization experiment of maize in Luoping County. Yunnan Agric. 2009, 4, 26–27. (In Chinese)
- Chen, X. Preliminary report on optimal fertilization of maize in southern Zhejiang yellow mud gravel area. Mod. Agric. Sci. Technol. 2008, 24, 181, 184. (In Chinese)
References
- Cassman, K.; Dobermann, A.; Walters, D. Agroecosystems, nitrogen-use efficiency, and nitrogen management. AMBIO J. Hum. Environ. 2002, 31, 132–140. [Google Scholar] [CrossRef]
- Frink, C.; Waggoner, P.; Ausubel, J. Nitrogen fertilizer: Retrospect and prospect. Proc. Natl. Acad. Sci. USA 1999, 96, 1175–1180. [Google Scholar] [CrossRef] [PubMed] [Green Version]
- Roy, R.; Misra, R.; Montanez, A. Decreasing reliance on mineral nitrogen-yet more food. AMBIO J. Hum. Environ. 2002, 31, 177–183. [Google Scholar] [CrossRef]
- National Bureau of Statistics. China Statistical Yearbook; China Statistics Press: Beijing, China, 2012. [Google Scholar]
- Fixen, P.; West, F. Nitrogen fertilizers: Meeting contemporary challenges. AMBIO J. Hum. Environ. 2002, 31, 169–176. [Google Scholar] [CrossRef]
- Tilman, D.; Cassman, K.; Matson, P.; Naylor, R.; Polasky, S. Agricultural sustainability and intensive production practices. Nature 2002, 418, 671–677. [Google Scholar] [CrossRef] [Green Version]
- Liu, G.; Wu, W.; Zhang, J. Regional differentiation of non-point source pollution of agriculture-derived nitrate nitrogen in groundwater in northern China. Agric. Ecosyst. Environ. 2005, 107, 211–220. [Google Scholar] [CrossRef]
- Olfs, H.; Blankenau, K.; Brentrup, F.; Jasper, J.; Link, A.; Lammel, J. Soil-and plant-based nitrogen-fertilizer recommendations in arable farming. J. Plant Nutr. Soil Sc. 2005, 168, 414–431. [Google Scholar] [CrossRef]
- Hong, N.; Scharf, P.; Davis, J.; Kitchen, N.; Sudduth, K. Economically optimal nitrogen rate reduces soil residual nitrate. J. Environ. Qual. 2007, 36, 354–362. [Google Scholar] [CrossRef]
- Benbi, D.; Biswas, C. Nitrogen balance and N recovery after 22 years of maize-wheat-cowpea cropping in a long-term experiment. Nutr. Cycl. Agroecosyst. 1996, 47, 107–114. [Google Scholar] [CrossRef]
- Truog, E. Fifty years of soil testing. In Proceedings of the Transactions of 7th International Congress of Soil Science, Madison, WI, USA, 15 August 1960; Volume 4, pp. 46–52. [Google Scholar]
- Stanford, G. Rationale for optimum nitrogen fertilization in corn production. J. Environ. Qual. 1973, 2, 159–166. [Google Scholar] [CrossRef]
- Stanford, G.; Hunter, A. Nitrogen requirements of winter wheat (Triticum aestivum, L.) varieties ‘Blueboy’and ‘Redcoat’. Agron. J. 1973, 65, 442–447. [Google Scholar] [CrossRef]
- Shapiro, C.A.; Ferguson, R.B.; Hergert, G.W.; Wortmann, C.S.; Walters, D.T. Fertilizer Suggestions for Corn. 2003. Available online: http://www.ianrpubs.unl.edu/live/ec117/build/ec117.pdf (accessed on 3 October 2018).
- Beegle, D.; Wolf, A. Soil Test Recommendations Handbook for Agronomic Crops; Agricultural Analytical Services Lab, Pennsylvania State University: University Park, TX, USA, USA. 2000; Available online: https://agsci.psu.edu/aasl/soil-testing/soil-fertility-testing/handbooks/agronomic (accessed on 3 October 2018).
- Hoeft, R.; Peck, T.; Boone, L. Soil testing and fertility. In Illinois Agronomy Handbook: 2000–2001; University of Illinois: Urbana-Champaign, IL, USA, 2001; pp. 84–124. [Google Scholar]
- Dahnke, W.; Fanning, C.; Cattanach, A. Fertilizing Corn Grain, Popcorn, Silage Corn, and Sweet Corn. North Dakota State University Institutional Repository. 2010. Available online: http://hdlhandlenet/10365/9362 (accessed on 3 October 2012).
- Rao, A.; Smith, J.; Parr, J.; Papendick, R. Considerations in estimating nitrogen recovery efficiency by the difference and isotopic dilution methods. Fertil. Res. 1992, 33, 209–217. [Google Scholar] [CrossRef]
- Stanford, G.; Legg, J. Correlation of soil N availability indexes with N uptake by plants. Soil Sci. 1968, 105, 320–326. [Google Scholar] [CrossRef]
- Storrier, R.; Hanly, A.; Nicol, H. An evaluation of indices of available soil nitrogen. Anim. Prod. Sci. 1970, 10, 89–94. [Google Scholar] [CrossRef]
- Schomberg, H.; Wietholter, S.; Griffin, T.; Reeves, D.; Cabrera, M.; Fisher, D.; Endale, D.; Novak, J.; Balkcom, K.; Raper, R. Assessing indices for predicting potential nitrogen mineralization in soils under different management systems. Soil Sci. Soc. Am. J. 2009, 73, 1575–1586. [Google Scholar] [CrossRef]
- Cui, Z.; Chen, X.; Miao, Y.; Li, F.; Zhang, F.; Li, J.; Ye, Y.; Yang, Z.; Zhang, Q.; Liu, C. On-farm evaluation of winter wheat yield response to residual soil nitrate-N in North China Plain. Agron. J. 2008, 100, 1527–1534. [Google Scholar] [CrossRef]
- Lund, L. Variations in nitrate and chloride concentrations below selected agricultural fields. Soil Sci. Soc. Am. J. 1982, 46, 1062–1066. [Google Scholar] [CrossRef]
- Tanji, K.; Fried, M.; Van De Pol, R. A steady-state conceptual nitrogen model for estimating nitrogen emissions from cropped lands. J. Environ. Qual. 1977, 6, 155–159. [Google Scholar] [CrossRef]
- Liu, J.; Liu, H.; Huang, S.; Yang, X.; Wang, B.; Li, X.; Ma, Y. Nitrogen efficiency in long-term wheat–maize cropping systems under diverse field sites in China. Field Crop Res. 2010, 118, 145–151. [Google Scholar] [CrossRef]
- Page, A.L. Part 2. Chemical and microbiological properties. In Methods of Soil Analysis; Wi American Society of Agronomy Inc. & Soil Science Society of America Inc.: Wisconsin, USA, 1982. [Google Scholar]
- Meisinger, J. Evaluating plant-available nitrogen in soil-crop systems. Nitrogen Crop Prod. 1984, 4, 391–416. [Google Scholar]
- Gaffke, N.; Krafft, O. Exact D-optimum designs for quadratic regression. J. R. Stat. Soc. B 1982, 44, 394–397. [Google Scholar]
- Chen, X.; Zhang, F. Construction of index system on soil test and formula fertilization based on 3414 experiment. China Agric. Technol. Ext. 2006, 22, 36–39. (In Chinese) [Google Scholar]
- NAPCIDC. National Agricultural Product Cost and Income Data Compilation; China Statistics Press: Beijing, China, 2015. (In Chinese) [Google Scholar]
- Mitchell, C.; Westerman, R.; Brown, J.; Peck, T. Overview of long-term agronomic research. Agron. J. 1991, 83, 24–29. [Google Scholar] [CrossRef]
- Peterson, T.; Varvel, G. Crop yield as affected by rotation and nitrogen rate. I. Soybean. Agron. J. 1989, 81, 727–731. [Google Scholar] [CrossRef]
- Peterson, T.; Varvel, G. Crop Yield as Affected by Rotation and Nitrogen Rate. II. Grain Sorghum. Agron. J. 1989, 81, 731–734. [Google Scholar] [CrossRef]
- Peterson, T.; Varvel, G. Crop yield as affected by rotation and nitrogen rate. III. Corn. Agron. J. 1989, 81, 735–738. [Google Scholar] [CrossRef]
- Hassink, J. Effects of soil texture and grassland management on soil organic C and N and rates of C and N mineralization. Soil Biol. Biochem. 1994, 26, 1221–1231. [Google Scholar] [CrossRef]
- Malhi, S.; Harapiak, J.; Nyborg, M.; Flore, N. Soil chemical properties after long-term n fertilization of bromegrass: Nitrogen rate. Commun. Soil Sci. Plan. 1991, 22, 1447–1458. [Google Scholar] [CrossRef]
- Malhi, S.; Brandt, S.; Ulrich, D.; Lemke, R.; Gill, K. Accumulation and distribution of nitrate-nitrogen and extractable phosphorus in the soil profile under various alternative cropping systems. J. Plant Nutr. 2002, 25, 2499–2520. [Google Scholar] [CrossRef]
- Guillard, K.; Griffin, G.; Allinson, D.; Yamartino, W.; Rafey, M.; Pietrzyk, S. Nitrogen utilization of selected cropping systems in the US Northeast: II. Soil profile nitrate distribution and accumulation. Agron. J. 1995, 87, 199–207. [Google Scholar] [CrossRef]
- Yang, X.; Zhang, S.; Yuan, X.; Tong, Y. A long-term experiment on effects of organic manure and chemical fertilization on distribution, accumulation and movement of NO3−-N in soil. Plant Nutr. Fertil. Sci. 2001, 7, 134–138. (In Chinese) [Google Scholar]
- Bao, D.; Huang, S.; Huang, X.; Zhang, H. Effect of long-term fertilization on nitrate movement and distribution in Fluvo-aquic soil. In Proceedings of the 5th Cross-Strait Workshop on Soil and Fertilizer; 2004. (In Chinese). [Google Scholar]
- Zhang, Y.; Liu, H.; Li, Z.; Lin, B.; Zhang, F. Study of nitrate leaching potential from agricultural land in Northern China under long-term fertilization conditions. Plant Nutr. Fertil. Sci. 2005, 11, 711–716. (In Chinese) [Google Scholar]
- Cui, Z.; Zhang, F.; Miao, Y.; Sun, Q.; Li, F.; Chen, X.; Li, J.; Ye, Y.; Yang, Z.; Zhang, Q. Soil nitrate-N levels required for high yield maize production in the North China Plain. Nutr. Cycl. Agroecosyst. 2008, 82, 187–196. [Google Scholar] [CrossRef]
- Fang, Q.; Yu, Q.; Wang, E.; Chen, Y.; Zhang, G.; Wang, J.; Li, L. Soil nitrate accumulation, leaching and crop nitrogen use as influenced by fertilization and irrigation in an intensive wheat–maize double cropping system in the North China Plain. Plant Soil 2006, 284, 335–350. [Google Scholar] [CrossRef] [Green Version]
- Ju, X.; Liu, X.; Zhang, F.; Roelcke, M. Nitrogen fertilization, soil nitrate accumulation, and policy recommendations in several agricultural regions of China. AMBIO J. Hum. Environ. 2004, 33, 300–305. [Google Scholar] [CrossRef]
- Cui, Z.; Zhang, F.; Chen, X.; Miao, Y.; Li, J.; Shi, L.; Xu, J.; Ye, Y.; Liu, C.; Yang, Z. On-farm evaluation of an in-season nitrogen management strategy based on soil Nmin test. Field Crops Res. 2008, 105, 48–55. [Google Scholar] [CrossRef]
- Miller, G. Establishing Realistic Yield Goals; Cooperative Extension Service, Iowa State University: Ames, IA, USA, 1986. [Google Scholar]
- Timlin, D.; Pachepsky, Y.; Snyder, V.; Bryant, R. Spatial and temporal variability of corn grain yield on a hillslope. Soil Sci. Soc. Am. J. 1998, 62, 764–773. [Google Scholar] [CrossRef]
- Machado, S.; Bynum, E., Jr.; Archer, T.; Lascano, R.; Wilson, L.; Bordovsky, J.; Segarra, E.; Bronson, K.; Nesmith, D.; Xu, W. Spatial and temporal variability of corn grain yield: Site-specific relationships of biotic and abiotic factors. Precis. Agric. 2000, 2, 359–376. [Google Scholar] [CrossRef]
Figure 1.
NREac from NPK in all sites. Note: Different letters indicate significant differences at 0.05 levels; NREac is apparent accumulated N recovery efficiency; S1-WQ1 is an experiment at Urumqi during 1991–1994; S1-WQ2 is an experiment at Urumqi during 1995–2005.
Figure 1.
NREac from NPK in all sites. Note: Different letters indicate significant differences at 0.05 levels; NREac is apparent accumulated N recovery efficiency; S1-WQ1 is an experiment at Urumqi during 1991–1994; S1-WQ2 is an experiment at Urumqi during 1995–2005.

Figure 2.
Correlation between Nf.opt estimated using NREac (75%) and Nf.opt measured using 3414 experiments with a quadratic curve fitting for wheat and maize. Note: ** indicates significance at 0.01 level; Nf.opt is an economically optimal N rate; NREac is an apparent accumulated N recovery efficiency.

Figure 3.
Relationships between grain yieldopt and yield0 for wheat and maize based on 3414 experiments. Note: ** indicates significance at 0.01 levels; grain yieldopt is a grain yield at Nf.opt; grain yield0 is a grain yield without N input.
Figure 3.
Relationships between grain yieldopt and yield0 for wheat and maize based on 3414 experiments. Note: ** indicates significance at 0.01 levels; grain yieldopt is a grain yield at Nf.opt; grain yield0 is a grain yield without N input.

Table 1.
The experiment sites and initial properties.
| Sites | |||||
|---|---|---|---|---|---|
| Items | S1-WQ | S2-CP | S3-ZZ | S4-YL | S5-QY |
| Location | Wulumuqi, Xinjiang | Changping, Beijing | Zhengzhou, Henan | Yangling, Shaanxi | Qiyang, Hunan |
| Longitude | 87°25′58″ E | 116°12′08″ E | 113°39′25″ E | 108°03′54″ E | 111°52′32″ E |
| Latitude | 43°58′23″ N | 40°12′34″ N | 34°47′02″ N | 34°16′49″ N | 26°45′12″ N |
| Mean annual temperature, °C | 7.4 | 11.8 | 14.2 | 12.7 | 18.3 |
| Annual rainfall, mm | 247 | 577 | 644 | 542 | 1276 |
| Cropping, per year | wheat or maize | wheat–maize | wheat–maize | wheat–maize | wheat–maize |
| Soil classification in China | Grey desert soil | Fluvo-aquic soil | Fluvo-aquic soil | Loessial soil | Red earth |
| Soil classification in FAO | Calcaric Cambisol | Haplic Luvisol | Calcaric Cambisol | Calcaric Regosol | Eutric Cambisol |
| Sand/Silt/Clay (%) | 18.5/53.2/28.3 | 20.3/65.0/14.7 | 26.5/60.7/12.8 | 31.6/51.6/16.8 | 3.7/34.9/61.4 |
| Soil pH (water/soil = 2.5) | 8.1 | 8.2 | 8.3 | 8.6 | 5.7 |
| Organic carbon (g kg−1) | 8.8 | 7.1 | 6.7 | 6.3 | 6.7 |
| Total N (g kg−1) | 0.87 | 0.64 | 1.01 | 0.83 | 1.07 |
| Total P (g kg−1) | 0.67 | 0.69 | 0.65 | 0.61 | 0.45 |
| Total K (g kg−1) | 23 | 14.6 | 16.9 | 22.8 | 13.7 |
Table 2.
Table2. Average of NREac during 15 years at all sites.
| Treatment | Experiment Site (%) | |||||
|---|---|---|---|---|---|---|
| S1-WQ1 | S1-WQ2 | S2-CP | S3-ZZ | S4-YL | S5-QY | |
| N | 149 ab | 40 b | 39 e | 43 f | 40 c | 24 e |
| NK | 115 bc | 38 bc | 47 d | 50 e | 42 c | 30 d |
| NP | 155 ab | 58 a | 66 b | 77 a | 70 b | 39 c |
| NPK | 161 a | 62 a | 70 a | 78 a | 77 a | 43 b |
| FS | 103 c | 51 ab | 48 d | 64 c | 74 ab | 47 ab |
| FM | 50 d | 43 b | 65 b | 70 b | 78 a | 49 a |
| HF | 31 d | 26 c | 58 c | 56 d | 71 b | 47 ab |
Note: different letters indicate significance at 0.05 levels in a column; S1-WQ1 was an experiment at S1-WQ from 1990 to 1994 and S1-WQ2 from 1995 to 2004.
© 2018 by the authors. Licensee MDPI, Basel, Switzerland. This article is an open access article distributed under the terms and conditions of the Creative Commons Attribution (CC BY) license (http://creativecommons.org/licenses/by/4.0/).
Share and Cite
MDPI and ACS Style
Liu, J.; Li, J.; Ma, Y.; Jia, Y.; Liang, Q. Apparent Accumulated Nitrogen Fertilizer Recovery in Long-Term Wheat–Maize Cropping Systems in China. Agronomy 2018, 8, 293. https://0-doi-org.brum.beds.ac.uk/10.3390/agronomy8120293
AMA Style
Liu J, Li J, Ma Y, Jia Y, Liang Q. Apparent Accumulated Nitrogen Fertilizer Recovery in Long-Term Wheat–Maize Cropping Systems in China. Agronomy. 2018; 8(12):293. https://0-doi-org.brum.beds.ac.uk/10.3390/agronomy8120293
Chicago/Turabian StyleLiu, Jie, Jumei Li, Yibing Ma, Yuehui Jia, and Qiong Liang. 2018. "Apparent Accumulated Nitrogen Fertilizer Recovery in Long-Term Wheat–Maize Cropping Systems in China" Agronomy 8, no. 12: 293. https://0-doi-org.brum.beds.ac.uk/10.3390/agronomy8120293
Note that from the first issue of 2016, this journal uses article numbers instead of page numbers. See further details here.