Article

Seasonal Variation in Starch Accumulation and Starch Granule Size in Cassava Genotypes in a Tropical Savanna Climate

1
Department of Agronomy, Faculty of Agriculture, Khon Kaen University, Khon Kaen 40002, Thailand
2
Department of Biology, Faculty of Science, Khon Kaen University, Khon Kaen 40002, Thailand
3
Peanut and Jerusalem Artichoke Improvement for Functional Food Research Group, Department of Agronomy, Faculty of Agriculture, Khon Kaen University, Khon Kaen 40002, Thailand
*
Author to whom correspondence should be addressed.
Submission received: 24 October 2018 / Revised: 25 November 2018 / Accepted: 27 November 2018 / Published: 7 December 2018
(This article belongs to the Section Crop Breeding and Genetics)

Abstract

:
The information on genotypic responses to the seasonal variation in the starch content, starch yield, and starch quality of cassava is limited. The objective of this research was to investigate the seasonal variation of starch characteristics of three cassava genotypes grown under irrigation. The experiment was conducted at four planting dates (20 April, 30 June, 5 October, and 15 December 2015). Three cassava genotypes (CMR38-125-77, Kasetsart 50, and Rayong 11) were evaluated in a randomized complete block design with four replications and the plants were harvested at 12 months. The planting date contributed the largest portion of the total variation in the starch content, starch yield, and starch granule size. The amylose content variability was heavily influenced by genotype. Cassava planted on 5 October or 15 December had greater starch content, starch yield, and starch granule in most genotypes. This was likely due to a higher temperature and solar radiation during the 3–9 months post-planting. CMR38-125-77 showed a consistently high starch content, starch yield, and high amylose content for most planting dates except for the starch yield on 20 April, of which Rayong 11 was the best. These findings will be useful for choosing suitable cassava genotypes for different growing seasons and for facilitating breeding efforts for high starch-yielding and high-quality cassava starch in the future.

1. Introduction

Based on molecular techniques, archaeological evidence and fossil remains, the domestication of cassava (Manihot esculenta Crantz, 2n = 36) traced back to about 7000 to 12,000 years ago, and their selection by ancient farmers and modern plant breeders resulted in the modern cassava cultivars with extraordinary characteristics including a high biomass and high starch yield, high ability to grow in unfavorable environments, and tolerance to drought [1]. Nowadays, cassava contributes significantly to the nutrition and livelihood of up to 800 million people worldwide [2]. The starchy tuberous roots can be consumed after cooking or used as a raw material in the manufacture of processed food, animal feed, bio-ethanol or industrial products. In Asia, cassava was introduced about two hundred years ago [3], and it is mainly grown for commercial proposes such as dried chips, pellets and starch for animal feed and industries as well as for fuel production [2,4]. In 2020, the global demand for cassava production for food and industrial purposes is expected to reach up to about 290 million tons [5]. For this reason, a better understanding of the edaphic and climatic factors affecting the starch quality and quantity of cassava would enhance its use. Multi-environment trials have been found to be essential for determining the genotype stability and predicting the performance of the traits across environments [6]. The reports in tuber crops demonstrated that effect of the season is higher magnitude than the effect of the years for biomass and tuber yield, and the genotype by season interaction was more important than genotype by year interaction [7,8], indicating the importance in the evaluation of cassava genotypes across seasons.
Southeast Asia is one of the major cassava producers with the production rapidly increasing, and Thailand ranks first as the world’s exporter of cassava products [2,
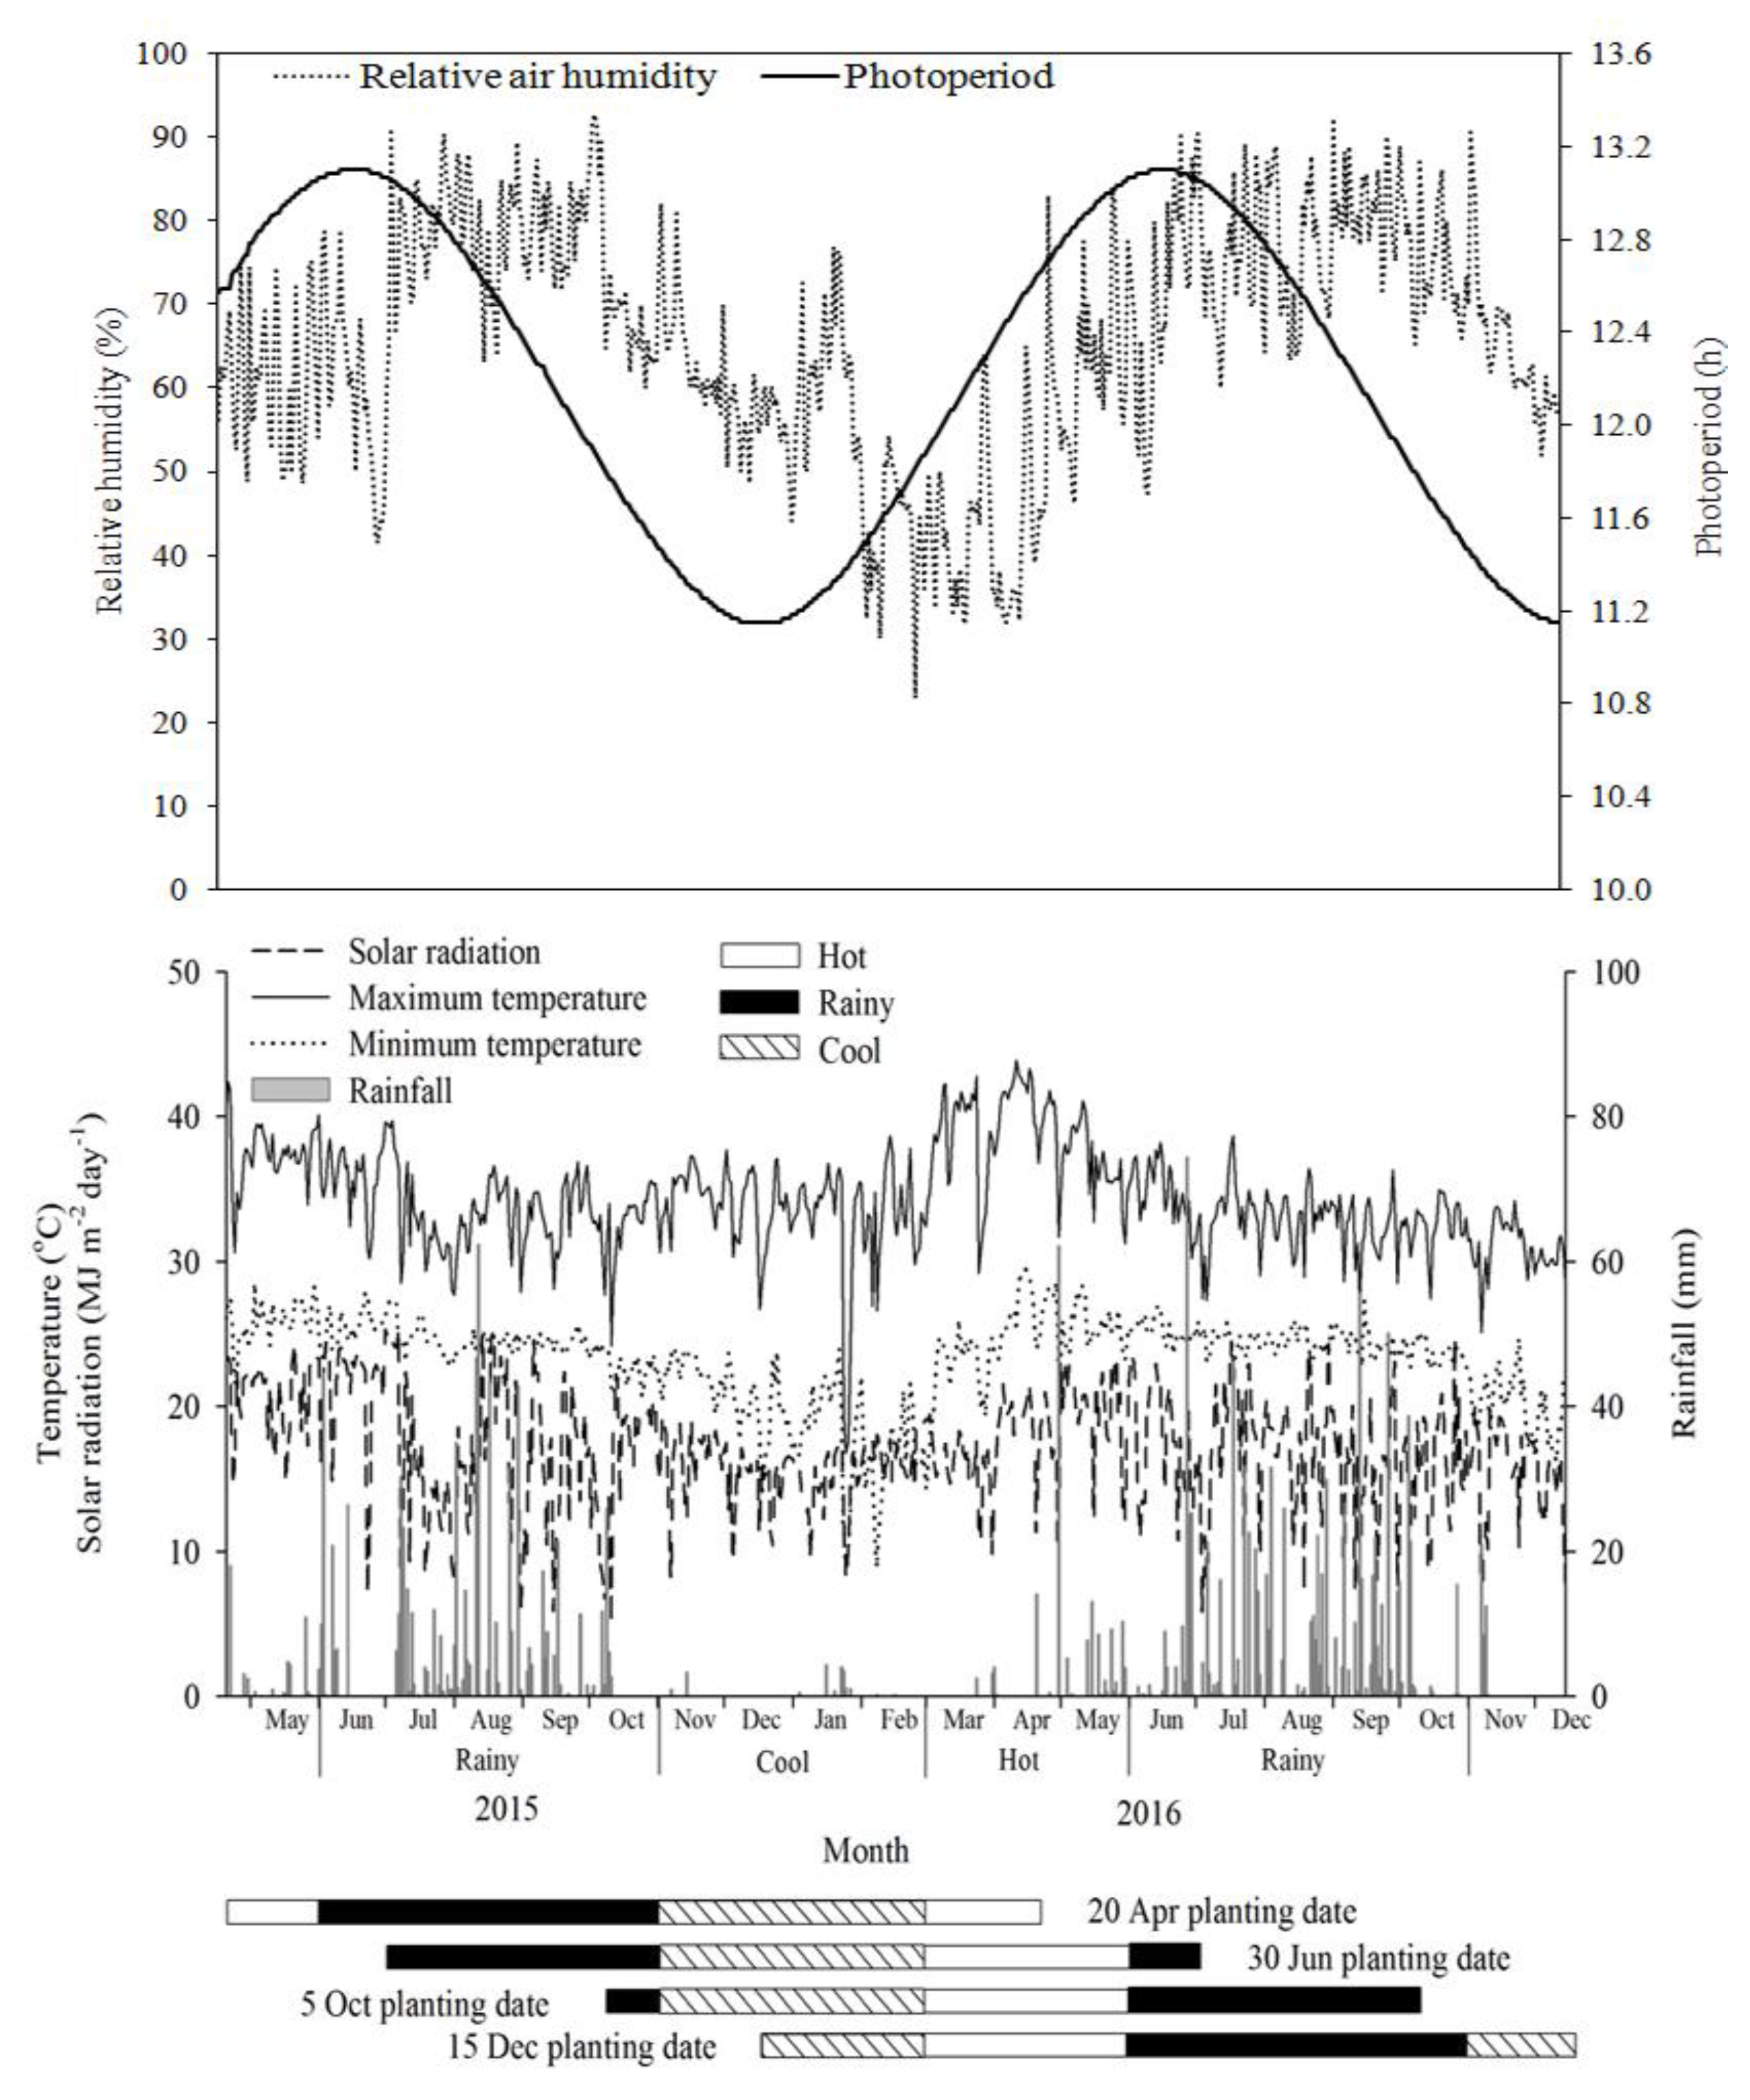
9]. Cassava can be planted year round in Thailand due to its wide range of adaptability. The crop duration covers almost all seasons including the hot dry season (March to May), the rainy season (May to October) and the cool dry season (November to February). Several investigations on seasonal variations under rainfed conditions that affect the starch content, starch yield, ratio of amylose and amylopectin, and starch granule size of cassava have been published [10,11,12,13,14]. These traits are important for industrial applications and food as they affect the quality of the final products such as functional foods (resistant starch), paper, cardboard, plywood, fabric, glue, cosmetic, and pharmaceutical and bio-products [14,15,16].
Santisopasri et al. [13] demonstrated that seasonal variation affects the content, yield, and quality of starch in cassava. The authors reported that when cassava was planted in the early rainy season (without initial water stress), the starch content and root yield was higher than when cassava was planted in the post-rainy season (with the initial water stress) by 16.46–24.46% and 11.81–35.64%, respectively. Teerawanichpan et al. [14] reported that the starch granules were smaller when the crop was subjected to drought stress at the early development stage (1–4 month after planting) when compared to the crops without water stress at the early development stage. Furthermore, the granules remained small even when the crops were provided with sufficient rainfall later in their development. Gu, et al. [17] also reported that water stress reduced the granule size of cassava starch, and drought stress at early growth stages had a greater effect on granule size than did the stress at the terminal growth stage, while rainfall and temperature had a small effect on the granule shape [13]. In other crops, Barnabás et al. [18] revealed that high temperatures (37/28 °C, day/night) from flowering to grain maturity caused a significant reduction in the starch accumulation of wheat and barley.
As mentioned above, the previous studies on seasonal variation have been carried out under rainfed conditions, and only key events of the effects of water stress had been reported and well-documented. However, in some areas where resources are available, cassava is produced under good management practices to increase productivity per unit area. To our knowledge, the information on the effects of other climatic factors such as solar radiation, air temperatures, and relative humidity on the starch content, yield, amylose content and granule size of fully-irrigated crops under different growing seasons and the responses of cassava varieties are not clearly understood. Therefore, the aims of this work were to investigate the effect of seasonal variation on starch content, starch yield, amylose content, and granule size distribution of four cassava genotypes under full irrigated conditions. The information from this study will help to improve cassava cultivation and identify cassava genotypes for plant breeding programs aimed at improving starch quality and quantity.

2. Materials and Methods

2.1. Experimental Description and Field Trials

Three cassava genotypes (CMR38-125-77, Kasetsart 50 and Rayong 11) with different starch bulkings were chosen for this study. CMR38-125-77 and Rayong 11 were developed by the Department of Agriculture, Bangkok, Thailand, and their starch bulking started at the early growth stage and late growth stage, respectively. Kasetsart 50 was released by Kasetsart University, Bangkok, Thailand, and this genotype had starch bulking at the mid-stage. Four planting dates were used in this study, which represented the planting conditions of the crop in the hot dry, mid rainy, late rainy and cool seasons (20 April, 30 June, 5 October, and 15 December 2015, respectively). The experiment was conducted at the Field Crop Research Station, Faculty of Agriculture, Khon Kaen University, Khon Kaen, Thailand (16°47´ N and 102°81´ E) using a randomized complete block design (RCBD) with four replications. The climate is classified as a tropical savanna climate according to the Köppen climate classification [19]. Land preparation was done following normal procedures for the cultivation of cassava using a 3-disk tractor and a 7-disk tractor and then the soil ridges were made [20]. Plot size was 20 × 7 m with a spacing of 1 m between rows and 1 m between plants within a row. Therefore, each plot had 140 plants.
The stems of 9-month-old cassava were cut into sections of 20 cm (length) and treated with thiamethoxam (Syngenta crop protection limited, Bangkok, Thailand) (3-(2-chloro-thiazol-5-ylmethyl)-5-methyl-(1,3,5)-oxadiazinan-4-ylidene-N-nitroamine 25% water dispersible granules) at a rate of 5 g per 20 L of water for 30 min to reduce mealy bug (Pseudococcidae) problems and then they were incubated under warm temperature (25–30 °C) for three days to stimulate bud germination. The planting hills were made on the top of soil ridges, and carbosulfan (Food machinery and chemical corporation, Rayong, Thailand) (2,3-dihydro-2,2-dimethylbenzofuran-7-ylmethylcarbamate 3% granular) was applied at the rate of 15 kg ha−1 to protect them from insects. The germinated stem cuttings were inserted vertically into the soil ridges to cover 2/3 of the cutting length. Weeds were controlled by an application of alachlor (Kemfac limited, Samutprakan, Thailand) (2-cholro-2’,6’-diethyl-N-(methoxymethyl) acetanilide 48%, w/v, emulsifiable concentrate) at a rate of 3 L ha−1 before planting and hand weeding was done regularly.
At one month after planting (MAP), chemical fertilizers were applied to the crop based on soil analysis and cassava nutrient requirements proposed by Howeler [21]. At two MAP, ammonium sulfate ((NH4)2SO4) (Chia tai company limited, Phranakhonsiayutthaya, Thailand) and potassium chloride (KCl; 60% K2O) (Chia tai company limited, Phranakhonsiayutthaya, Thailand) were applied at rates of 223.18 and 93.75 kg ha−1, respectively [20]. Because available phosphorus content in the soil was high, no applications of phosphorus fertilizer were used. Insufficient micronutrients were foliar sprayed at 15 days after planting and 1 MAP including 1% ZnSO4·7H2O, 1% MnSO4, and 0.05% CuSO4·5H2O based on the recommendation suggested by Janket et al. [22]. Sets of tensiometers were installed at 20 and 40 cm soil depths in two replications for all planting dates to monitor soil moisture in the experimental field. Supplementary irrigation was applied by an overhead sprinkler irrigation system when the water tension at 40 cm of soil depth was close to −30 kPa to keep the plots well-watered. Irrigation was stopped when the level of water tension at 20 cm was between −10 to 0 kPa. Pests and diseases were controlled as necessary.

2.2. Soil and Plant Determination and Sample Preparation for Laboratory Analyses

Soil samples were randomly taken pre-planting and post-planting from 6 points in each planting date at the depths of 0–30 and 30–60 cm; the samples were bulked, mixed, and analyzed to determine soil physicochemical properties including the percentage of sand, silt, clay, organic matter percentage, soil pH, electrical conductivity (EC), cation exchange capacity (CEC), total nitrogen (N), available phosphorus (P), exchangeable potassium (K), and total calcium (Ca), magnesium (Mg) and sulfur (S).
Eighteen plants in each plot were harvested at 12 MAP for all planting dates and used to determine the storage root yield, biomass, starch content, amylose content, and starch granule size distribution. The plants were separated into leaves, petioles, stems, and storage roots. Storage roots were washed in tap water to remove the adhering soil, and about 10% of the total fresh weight of each plant part was then sub-sampled. The subsamples of all plant parts were oven-dried at 70 °C for 72 h or until the weights were constant and dry weights were recorded.
Starch samples were prepared within 12 h after harvest. Eight to twelve storage roots were sub-sampled, washed again in tap water, and then peeled for granule size distribution determination. For the starch content determination, subsamples were left unpeeled. The storage roots were then sliced into thin pieces, discarding the head and tip of storage roots. Then, the samples were oven dried at 50–55 °C until reaching a constant weight using tray drier (EQ-04SW, Leehwa industry company, Kyongbuk, Korea). The dried samples were ground in an electronic blender (Standard EM-11, Sharp Thai company limited, Bangkok, Thailand) and then sieved with 200 µm and 106 µm diameter sieves for starch content and granule size distribution analyses, respectively. The ground samples were stored in cleaned plastic zip bags and kept in a dry dark place until further analyses. During the experiment, daily maximum temperature, minimum temperature, solar radiation, relative humidity, and precipitation were recorded by an automatic weather station (Watchdog 2700, Path computation element group, Meschede, Germany) located in the experimental field. The growing degree days was also calculated by summation of daily mean temperatures from the day of planting to harvest time.

2.3. Determination of Starch Content by Polarimetric Method

2.3.1. The Determination of Total Rotary Power (P)

The 5 g of the ground samples were transferred to a 200 mL glass flask and 50 mL of hydrochloric acid (RCI labscan limited, Bangkok, Thailand) (0.31 N) was added. The flask was plugged and shaken for 3 min or until the sample was uniformly suspended and then an additional 50 mL of hydrochloric acid was added into the samples. The flask was immersed in a boiling water bath (WNE-22, Memmert, Schwabach, Germany), shaken vigorously and steadily for the first 3 min to avoid coagulation of the sample, and then kept in the bath for a total of 15 min. Then, 60 mL of cold water was added immediately to obtain a temperature of 20 °C. After cooling, 20 mL of 4% sodium phosphotungstate (Sigma-Aldrich company limited, St. Louis, MO, USA) was added and the samples were shaken for approximately 30 seconds. The sample was diluted to 200 mL with distilled water and mixed and filtered using number 1 filter paper. The solution was discarded for first 25 mL and remaining of the filtrate was transferred into a 200 mm tube, and total rotary power measured with a polarimeter (Polatronic MH8, Schmidt haensch, Berlin, Germany).

2.3.2. Determination of the Rotary Power (P’) of Substances Soluble

Twelve and a half grams of the ground samples were transferred to a 250 mL glass flask, and 200 mL of distilled water was added into the sample. The flask was shaken vigorously every 10 min for a total of 1 h (6 times) in order to disperse the sample. The solution was diluted to 250 mL with distilled water, mixed, allowed to stand, and then filtered through a number 42 filter paper. A total of 100 mL of the filtrate was transferred into a 200 mL glass flask, and 4.2 mL of 25% hydrochloric acid was then added to the filtrate, and the sample was shaken vigorously. The flask was then immersed in a boiling water bath for 15 min and the processes for rotary power determination were continued as above. The starch content (%) was calculated as follows:
Starch   content   ( % )   =   2000   ×   ( P P )   ×   100   ×   L [ a ] 20   D   ×   ( 100 M )  
P = total rotator power in degrees; P = rotator power in degrees given by substances soluble in water; [a]20 °D = specifies optical rotation of pure starch (cassava starch = 180°); M = starch moisture (%); L= standard tube length (200 mm is 1).
The starch content was calculated on a dry weight basis and starch yield was calculated by the following formula:
Starch   yield   ( kg   ha 1 )   =   starch   content   ( % )   ×   storage   root   yield   ( kg   ha 1 )  

2.4. Determination of Starch Granule Size Distribution by Laser Diffraction

The starch granule size distribution was measured by the laser diffraction method as described by Teerawanichpan et al. [14]. Before analysis, the starch was suspended in deionized distilled water and sonicated by the ultrasonic bath (50/60 Hz, Ney, Sacramento, CA, USA) for 30 min. The distribution of starch particle size was then determined by a laser diffraction spectrometer (Mastersizer 2000, Malvern instruments limited, Malvern, UK). A red light source: He-Ne laser source (γ663 nm), blue light source: solid state light source, beam length: 2.35 mm, laser power: 82.5 and a constant rotation speed of 3500 min−1 was used for the measurements, and each sample was measured three times.

2.5. Determination of Amylose and Amylopectin

Amylose content was measured by the iodine-affinity method as described by Hoover and Ratnayake [23]. A total of 20 mg of sieved cassava starch was weighed individually into a glass tube, and then 8 mL of 90% dimethyl sulfoxide (DMSO) (Sigma-Aldrich company limited, St. Louis, MO, USA) was added to the sample and boiled for 15 min or until the solution was clear. The crude starch solution was then brought to 25 mL by adding distilled water. A total of 1 mm of this crude starch solution was then added to 40 mL of distilled water and stained by 5 mL of a solution containing 0.06345% iodine (I2) (Sigma-Aldrich company limited, St. Louis, MO, USA) and 0.1079% potassium iodide (KI) (Sigma-Aldrich company limited, St. Louis, MO, USA) and diluted to a final volume of 50 ml. After mixing, the solution was incubated for 15 min at room temperature and the absorbance of the iodine-starch complex was measured colorimetrically using a UV-VIS spectrophotometer (Genesys 10s UV-VIS spectrophotometer, Thermo fisher scientific, Madison, WI, USA) at 600 nm. The amylose content was calculated as the percentage of the total cassava starch sample by comparing it with a standard absorption curve of potato amylose (cat. No. 10130, Fluka, Buchs, Switzerland), and the amylopectin content was calculated by subtracting the fraction of amylose from 100. The ratio of amylose and amylopectin was also calculated by dividing the total amylose by the total amylopectin.

2.6. Statistical Analysis

A statistical analysis was carried out using MSTAT-C version 1.42 [24]. Individual analyses of variance were performed for each character in each planting date according to an RCBD. Homogeneity of variance was tested for all parameters by Bartlett’s test to examine the homogeneity of the error variance. Combined analysis of variance of all four seasons was performed for those parameters when the error variances of four planting dates were homogeneous. Tukey’s honestly significant difference was used to compare the means at an alpha level of 0.05. A stepwise regression analysis was used to examine the relationship between starch characteristics and climatic factors including the total solar radiation, minimum and maximum temperatures, mean temperature, growing degree-days, the photoperiod, and relative humidity. Graphical presentations were prepared based on the mean values using Microsoft Excel (Office 365, Microsoft, Washington, DC, USA).

3. Results

3.1. Soil Properties and Growth Conditions

The soil used in this study is a Yasothon series (Yt: fine-loamy; siliceous, isohypothermic, Oxic Paleustults), which is distributed widely in Northeast Thailand. The physical and chemical properties of the soil are presented in Table 1. The soil texture was loamy sand with a pH of 5.67 to 7.04 (averaged 0–60 cm). On average at the depth 0–60 cm, most soil chemical and physical properties such as the total nitrogen (0.01 to 0.03%), exchangeable potassium (12.8 to 54.6 mg kg−1), total magnesium (30.8 to 50.4 mg kg−1), organic matter (0.33 to 0.53%), and cation exchange capacity (1.82 to 5.27 cmol kg−1) were low and very low compared with the nutrient requirements for cassava [20]. However, the exchangeable calcium (200 to 387 mg kg−1), total sulfur (3.0 to 53.5 mg kg−1), and electrical conductivity (0.02 to 0.05 dS m−1) were medium, whereas the available phosphorus values (17.2 to 62.9 mg kg−1) were high [21].
Since the first planting date was grown in the hot dry season (20 April), it received high temperatures and high solar radiation during the first few months of plant growth and lower temperatures and lower solar radiation during the mid-growth stage (2–8 MAP; canopy and root development to high carbohydrate partitioning to storage roots) (Figure 1). Daily temperatures and solar radiation during growth in the early rainy season (30 June) were cooler with more clouds during the initial growth period of the 20 April. Daily temperature and solar radiation in the late rainy season and cool season (5 October and 15 December) were similar to the 20 April planting date during the initial plant growth stage (about 1–4 month). Thereafter, crops received high temperature and high solar radiation for a long-term during the period between the canopy and root development and storage root bulking to high carbohydrate partitioning in the storage roots. However, no water stress was observed during the growing season in all planting dates because the cassava crops were irrigated.

3.2. Combined Analysis of Variance

Planting dates were significantly different for biomass, starch content, starch yield, and starch granule size but not for the amylose content and the ratio of amylose and amylopectin (Table 2). Genotypes were significantly different for most traits except the starch content. The interactions between the genotype and planting date were also significant for biomass, starch yield, the amylose content and the ratio of amylose and amylopectin but not for the starch content and granule size. The planting date contributed to the largest variations for starch content (35.3%), starch yield (34.9%), and starch granule size (43.7%). The amylose content was more related to the genotypes (27.8%) and, harmoniously, the ratio of amylose and amylopectin was also heavily related to the genotypes (25.7%). The contributions of the genotype and the genotype by the planting date interaction were lower than the variations in planting date for biomass, starch content, starch yield, and granule size, ranging from 4.6% to 27.0% and 8.3% to 33.3% for the genotype and the genotype by planting date interaction, respectively. For the amylose content and the ratio of amylose and amylopectin, the contribution of the genotype by planting date interaction was larger. As the interaction between the genotypes and the planting date was significant, the data for the four planting dates were analyzed separately.

3.3. Variation in Starch Content and Starch Yield

The crop planted in late rainy and cool planting dates (5 October and 15 December) had a higher starch content than did the crop grown in hot dry and early rainy seasons for most genotypes (20 April and 30 June) except for Rayong 11, which showed a similar starch contents, ranging from 80.3% to 83.5%. However, CMR38-125-77 had not only the highest starch content in the rainy and cool planting dates but also high starch content in the hot dry season, as it was not significantly different from the crops planted in the late rainy and cool planting dates (Table 3).
Planting dates were also significantly different for the starch yield for all genotypes. The results indicated that the crops planted in the cool season (15 December) had a higher starch yield than did those planted in the hot dry, early rainy, and late rainy seasons for most genotypes. Rayong 11 was an exception as it showed a higher starch yield when planted in the hot dry season (17,680 kg ha−1) than at the other planting dates (accounting for 7781–11, 704 kg ha−1). However, CMR38-125-77 and Kasetsart 50 not only had the highest starch yield in the cool planting date but also a high starch content in the late rainy season, as they were not significantly different from the crops planted in the cool planting date. In addition, Kasetsart 50 also had a high starch yield in the hot season (Table 3).
Significant differences among the cassava genotypes were found for starch yield at all planting dates, but the cassava genotypes were not significantly different for the starch content. CMR38-125-77 tended to have consistently high starch content and it was also the highest genotype for starch yield for most planting dates except for starch yield in the hot dry season. In this study, Rayong 11 had a high starch yield in the hot dry season only. However, Kasetsart 50 also had a high starch yield in the late rainy and cool planting dates as it was not significantly different from CMR 38-125-77 in those planting dates (Table 3).

3.4. The Variation in Amylose Content, Ratio of Amylose and Amylopectin, and Starch Granule Size Distribution

The planting dates were not significantly different for amylose content and the range of amylose contents was between 22.1% and 22.5% (Table 4). However, the cassava genotypes were significantly different for amylose in all planting dates. CMR38-125-77 had the highest amylose content in three planting dates from four planting dates (20 April, 30 June, and 15 December) whereas Kasetsart 50 had also the highest amylose content in the planting dates of 30 June, 5 October, and 15 December. Similarly, the genotype with the highest amylose content for each planting date also had the highest ratio of amylose and amylopectin (Table 4).
The planting dates were significantly different for granule sizes (d (0.5)) and the range of granule sizes of the three cassava genotypes planted under well-irrigated conditions was between 15.26 µm and 16.49 µm. The results indicated that the crop planted in the early rainy, late rainy and cool planting seasons (30 June, 5 October, and 15 December) had larger average starch granule sizes than did the crop planted in the hot dry season (20 April).
Significant differences among cassava genotypes were found for the starch granule size in the crops planted in the hot dry season (20 April), but the differences for starch granule size were not significant in other planting dates. CMR38-125-77 and Rayong 11 had a significantly larger starch granule size than did other cassava varieties in the hot dry season (20 April), and CMR 38-125-77 also tended to have a larger starch granule in the planting dates in the mid and late rainy seasons (30 June and 5 October), whereas Rayong 11 tended to have a larger starch granule in the cool season (15 December).

3.5. Stepwise Analysis

A stepwise regression analysis indicated that the variation in the starch content in CMR38-125-77 could be explained by the photoperiod and relative humidity during growth periods of 1 to 12 months with a determination coefficient (R2) of 0.37–0.43 (Table 5). The variation in the starch content in Kasetsart 50 and Rayong 11 could be explained by the photoperiod and maximum air temperature during 1–6 MAP (R2 = 0.41–0.60), whereas, during 6–12 MAP, the variation in the starch content could be explained by the relative humidity and solar radiation in Kasetsart 50 (R2 = 0.48–0.61) and it could be explained by the relative humidity and maximum air temperature in Rayong 11 (R2 = 0.36–0.38). The photoperiod and relative humidity would be the most important factors contributing to this trait in CMR38-125-77 and Kasetsart 50 as indicated by the highest absolute t value. Kasetsart 50 during 3–6 and 9–12 MAP was the exception as it showed the highest absolute t value for the maximum air temperature and total solar radiation, respectively. Similarly, the photoperiod showed the highest absolute t value at the early growth stage (1–3 MAP) in Rayong 11, but during 3–12 MAP, the maximum air temperature and relative humidity showed the highest absolute t value in this genotype.
For starch yield, the stepwise regression analysis indicated that the variation in starch yield could be explained by the total solar radiation, photoperiod, and relative humidity during crop growth periods of 1 to 12 months in all genotypes (R2 = 0.61–0.86) (Table 6). During 1–6 MAP, stepwise regression analysis indicated that photoperiod and solar radiation showed the highest absolute t value for starch yield in CMR38-125-77 and Rayong 11 and that the photoperiod showed the highest absolute t value in Kasetsart 50. During 6–12 MAP, relative humidity and photoperiod showed the highest absolute t value in CMR38-125-77 and Kasetsart 50, but the relative humidity showed the highest absolute t value in Rayong 11. Moreover, the stepwise regression analysis also indicated that the variations in amylose content and starch granule size for the three cassava genotypes depended on the total solar radiation, photoperiod, and relative humidity during the growth periods. However, the determination coefficients were low for both traits in this study, the growing degree days and minimum air temperature throughout the growth periods were not correlated with all the starch parameters, so, the data were not shown in the current manuscript.

4. Discussion

Knowledge of the responses of cassava to the season for starch content and starch yield, as well as the starch quality, is important for cassava breeding, production, and utilization. Past research has shown that water stress is a major factor affecting the starch content, starch yield, and starch granule of cassava [12,14]. The research presented in this current manuscript was conducted under irrigation, thus, water stress did not have a significant effect on the crop differences among planting dates and the crop differences were mainly due to other climatic factors and crop genotypes.
The planting date contributed to the largest portion of the total variation in starch content (35.3%), starch yield (34.9%), and starch granule size (43.7%). The Amylose content and ratio of amylose and amylopectin were most affected by the crop genotypes (27.8% and 25.7%). The results of the effect of seasonal variation under irrigated conditions on cassava in this study were similar to those in previous studies under rainfed conditions [12,13,25], and the findings were also in agreement with the studies on other crop species such as cereal crops [26]. As the crops in earlier studies were planted under rainfed conditions, water stress would be the main factor affecting the variation in those reported. As in our study, Teerawanichpan et al. [14] also found that the season did not cause differences in amylose content in cassava but genotype did. Similar results were also reported in indica rice [27]. In contrast, high or low temperatures during crop growth could change the amylose content in maize [28,29] and wheat [30,31,32]. The interactions between the planting date and genotype were also significant and the variations due to the interaction between planting date and genotype shared rather large portions of total variations in starch yield (33.3%), granule size (10.9%), amylose content, and ratio of amylose and amylopectin (22.8% and 23.8%). These findings were in agreement with those in previous studies on cassava genotypes. The researchers indicated that the interactions between planting date and genotype shared large portions of total variations in storage root fresh weight, storage roots dry weight, total dry weight, starch content by density method (Rieman balance), crop growth rate, and storage root growth rate [33,34]. The results revealed that cassava genotypes responded differently to planting dates or environmental conditions.
Based on the stepwise regression analysis, the variation in starch content in CMR38-125-77 was dependent largely on the photoperiod and relative humidity throughout growth periods. The variations in starch content in Kasetsart 50 and Rayong 11 were associated with the photoperiod and maximum air temperature during 1–6 MAP, whereas, during 6–12 MAP, this parameter was associated with the relative humidity and solar radiation in Kasetsart 50 and the relative humidity and maximum air temperature in Rayong 11 (Table 5). The total solar radiation, photoperiod, and relative humidity throughout the growth periods explained the variations in starch yield in all genotypes. During 1–6 MAP, photoperiod and solar radiation would be the most important climatic factors contributing to starch yield in CMR38-125-77 and Rayong 11, and the photoperiod showed the most important climatic factors in Kasetsart 50. During 6–12 MAP, the relative humidity and photoperiod would be the most important factors contributing to starch yield in CMR38-125-77 and Kasetsart 50, but relative humidity showed the most important climatic factors in Rayong 11 (Table 6).
This study indicated that growing cassava in the planting dates of 5 October and 15 December produced the highest starch content, starch yield, and larger starch granules for most genotypes. The crops in these planting dates were planted in the late rainy and cool seasons and received high temperatures, high solar radiation, and a longer photoperiod during the stages of canopy development and storage root bulking (3–6 MAP). After 6 MAP, the crops in these planting dates received relatively high temperatures, high solar radiation, and a high atmospheric humidity for 2–3 months during June to August at 7–9 MAP of plant age (long-term in the planting date of 15 December) followed by lower temperatures, lower atmospheric humidity, and a shorter photoperiod during late-growth stage of 10–12 MAP.
The optimum temperature range for photosynthesis, starch biosynthesis, and related enzyme activities in cassava was from 25 to 35 °C [35,36]. The crops planted on 5 October and 15 December receiving the optimum conditions during the stages of canopy development and storage root bulking could synthesize higher starch and the synthesized starch was accumulated in the stems, leaves, and storage roots. The starch accumulated in these plant parts was further accumulated in storage roots at the later stages of the growth cycle. An earlier report by Fukai et al. [37] also showed that high solar radiation during the growing period resulted in an increase in the total biomass production and storage root dry weight in cassava. Similarly, a high solar radiation (22 MJ m–2 day–1), high mean annual temperature (28 °C), and high atmospheric humidity (70%) during the growing period resulted in a higher root dry weight of cassava (27 t ha–1) [38,39]. Furthermore, high temperatures during the growing period resulted in a high crop growth rate but a low distribution ratio of carbohydrate, whereas lower temperatures and a shorter photoperiod during the growing period resulted in a low crop growth rate but a high distribution ratio of carbohydrates [25,40,41]. Additionally, El-Sharkawy [42] reported that planting cassava under high atmospheric humidity and high solar radiation resulted in the increases in the stomatal opening, photosynthesis rate, and plant growth and development compared to that under low atmospheric humidity condition. This might explain why crops planted in the late rainy season and the cool season had a higher starch content and starch yield.
For the other two planting dates (20 April and 30 June), the crops were planted in the hot dry and early rainy seasons and, thereby, the crops received high temperature and high solar radiation for the first few months during the initial plant growth followed by lower temperatures and solar radiation during the mid-growth stage, resulting in a reduced photosynthetic capacity and starch biosynthesis and the low partitioning of assimilates to the storage roots. The development of fibrous roots is highly reduced under low light intensity. The cassava crops, which are subjected to a low light period, may have limited ability to absorb soil water and nutrients at the times when the demand is high. Low light intensities and temperatures have been shown to be the major reason for the reduction in plant growth rate and development in cassava by many authors [25,43,44,45,46]. However, the investigation of nutrient uptake in cassava under different planting dates is still required in order to understand the responses of cassava genotypes in different planting dates. Moreover, a low yield and content of starch, as well as the smaller granule size of the crops planted in these two seasons, were also due to high temperatures, high solar radiation, high relative humidity and high rainfall during the late maturity stage that resulted in re-growth of cassava leaves. The leaf re-growth was related to the increase in leaf dry weight and the reduction in the storage root dry weight [41]
In this study, CMR38-125-77 showed a consistently high starch content and starch yield, for most planting dates except for the starch yield on 20 April, in which Rayong 11 was the highest. This might be due to the fact that Rayong 11 had mechanisms such as a good canopy architecture, leaf thickness, and leaf covered with wax to maintain a high humidity level under its canopy during the cool season when the atmospheric relative humidity was low. Besides, CMR38-125-77 and Kasetsart 50 showed consistently high amylose and the ratio of amylose and amylopectin for all planting dates. On the other hand, Rayong 11 was the lowest for these traits for most planting dates except on 20 April in which it was equal to Kasetsart 50. The genotype with a higher content of amylose and ratio of amylose and amylopectin can be assumed to have a lower glycaemic index [47].
Temperature interactions between genotype and temperature for yield and starch yield have been reported before. For example, the popayán variety of cassava had the highest yield when grown at 20 °C but had low yields at 28 °C, whereas other cassava varieties tested had the highest yield when grown at 28 °C [48]. Air temperatures below 20 °C have been reported to decrease the rate of photosynthesis, growth, and the storage root weight of cassava by El–Sharkawy [44,45].
In other tuber crops such as Jerusalem artichoke, low temperatures and short photoperiods favored tuber development but reduced the vegetative and reproductive development [7,8]. These authors also reported that when the crop was grown in the post-rainy season, it had a higher tuber dry weight than did the crop grown in the early rainy season, whereas the crop grown in the early rainy season had a higher total dry matter than did the crop grown in the post-rainy season. Likewise, Van Dam et al. [49] demonstrated that high temperatures of the day/night temperature (30/24 °C) delayed the tuber initiation and tuber growth and also reduced the partitioning of photosynthates to sink (tubers) in potato. In our irrigation study, CMR38-125-77 and Rayong 11 seemed to have larger starch granule sizes and genetics was the major contribution to granule sizes. In previous investigations, the granule size of starch appeared to be affected by changes in environmental conditions, crop management, and genetics [14,50,51]. These differences are likely due to water management.

5. Conclusions

Under irrigated conditions, planting date was the main cause of differences in starch content, starch yield, and starch granule size, but not for amylose content. Planting cassava on 5 October and 15 December when the temperature and solar radiation were high during the stem and leaf development stage until high translocation of carbohydrate to storage roots (3–9 MAP) resulted in a greater starch content, starch yield and starch granules in most genotypes when compared to the same genotype at the other planting date. Overall, CMR38-125-77 was superior for the starch content, starch yield, and also had a high amylose content at the final harvest for most planting dates. Rayong 11 was superior to other genotypes at the 20 April planting date. The information on the starch quality and yield at different planting dates will aid farmers and plant breeding efforts to maximize the starch content and yield, amylose content, and starch granule traits.

Author Contributions

Conceptualization, N.V., P.B., P.T. and S.J.; Data curation, A.J.; Formal analysis, A.J. and S.J.; Investigation, A.J.; Methodology, A.J., N.V., P.B. and S.J.; Supervision, S.J.; Writing–original draft, A.J.; Writing–review & editing, B.T., W.K., P.B., T.K. and S.J.

Funding

This research was funded by the Royal Golden Jubilee Ph.D. Program (grant no. PHD/0216/2560) and the National Science and Technology Development Agency (NSTDA), Thailand.

Acknowledgments

Special thanks to Khon Kaen University for providing facilities in conducing this experiment, and we would like to thank Craig K. Kvien and Corley Holbrook for their suggestions and language editing.

Conflicts of Interest

The authors declare no conflict of interest.

References

  1. Zhang, S.; Chen, X.; Lu, C.; Ye, J.; Zou, M.; Lu, K.; Feng, S.; Pei, J.; Liu, C.; Zhou, X.; et al. Genome-wide association studies of 11 agronomic traits in cassava (Manihot esculenta Crantz). Front. Plant Sci. 2018, 9. [Google Scholar] [CrossRef]
  2. Food and Agricultural Organization of the United Nations (FAO). Available online: http://fao.org/faostat/en/#home (accessed on 4 October 2017).
  3. Howeler, R.H. Cassava production practices in Asia-can they maintain soil productivity? In Proceedings of the International symposium held in Nanning, Guangxi, China, 11–15 November 1996; CIAT: Bangkok, Thailand, 2000.
  4. Maung Aye, T.; Howeler, R.H. Integrated crop management for cassava cultivation in asia. In Achieving Sustainable Cultivation of Cassava Volume 1: Cultivation Techniques; Clair, H., Ed.; Burleigh Dodds Science Publishing Limited: Cambridge, UK, 2017; pp. 1–29. [Google Scholar]
  5. Westby, A. Cassava utilization, storage and small-scale processing. In Cassava: Biology, Production and Utilization; Hillocks, R.J., Thresh, J.M., Bellotti, A., Eds.; CABI Publishing: New York, NY, USA, 2002; pp. 281–300. [Google Scholar]
  6. Osiru, M.O.; Olanya, O.M.; Adipala, E.; Kaping, R.; Lemaga, B. Yield stability analysis of Ipomoea batatus L. cultivars in diverse environments. Aust. J. Crop. Sci. 2009, 3, 213–220. [Google Scholar]
  7. Puangbut, D.; Jogloy, S.; Vorasoot, N.; Patanothai, A. Responses of growth, physiological traits and tuber yield in Helianthus tuberosus to seasonal variations under tropical area. Sci. Hortic. 2015, 195, 108–115. [Google Scholar] [CrossRef]
  8. Puangbut, D.; Jogloy, S.; Vorasoot, N.; Holbrook, C.C.; Patanothai, A. Responses of inulin content and inulin yield of Jerusalem artichoke to seasonal environments. Int. J. Plant Prod. 2015, 9, 599–608. [Google Scholar] [CrossRef]
  9. Office of Agricultural Economics. Available online: http://www.oae.go.th (accessed on 13 April 2018).
  10. Asaoka, M.; Okuno, K.; Sugimoto, Y.; Kawakami, J.; Fuwa, H. Effect of environmental temperature during development of rice plants on some properties of endosperm starch. Starch-Stärke 1984, 36, 189–193. [Google Scholar] [CrossRef]
  11. Defloor, I.; Dehing, I.; Delcour, J.A. Physico-chemical properties of cassava starch. Starch-Stärke 1998, 50, 58–64. [Google Scholar] [CrossRef]
  12. Sriroth, K.; Piyachomkwan, K.; Santisopasri, V.; Oates, C.G. Environmental conditions during root development: Drought constraint on cassava starch quality. Euphytica 2001, 120, 95–101. [Google Scholar] [CrossRef]
  13. Santisopasri, V.; Kurotjanawong, K.; Chotineeranat, S.; Piyachomkwan, K.; Sriroth, K. Impact of water stress on yield and quality of cassava starch. Ind. Crops Prod. 2001, 13, 115–129. [Google Scholar] [CrossRef]
  14. Teerawanichpan, P.; Lertpanyasampatha, M.; Netrphan, S.; Varavinit, S.; Boonseng, O.; Narangajavana, J. Influence of cassava storage root development and environmental conditions on starch granule size distribution. Starch-Stärke 2008, 60, 696–705. [Google Scholar] [CrossRef]
  15. Molenda, M.; Stasiak, M.; Horabik, J.; Fornal, J.; Blaszczak, W.; Ornowski, A. Microstructure and mechanical parameters of five types of starch. Pol. J. Food Nutr. Sci. 2006, 15, 161–168. [Google Scholar] [CrossRef]
  16. Wani, A.A.; Singh, P.; Shah, M.A.; Schweiggert-Weisz, U.; Gul, K.; Wani, I.A. Rice starch diversity: Effects on structural, morphological, thermal, and physicochemical properties—A review. Compr. Rev. Food Sci. Food Saf. 2012, 11, 417–436. [Google Scholar] [CrossRef]
  17. Gu, B.; Yao, Q.Q.; Li, K.M.; Chen, S.B. Change in physicochemical traits of cassava roots and starches associated with genotypes and environmental factors. Starch-Stärke 2013, 65, 253–263. [Google Scholar] [CrossRef]
  18. Barnabás, B.; Jäger, K.; Fehér, A. The effect of drought and heat stress on reproductive processes in cereals. Plant Cell Environ. 2008, 31, 11–38. [Google Scholar] [CrossRef]
  19. Peel, M.C.; Finlayson, B.L.; McMahon, T.A. Updated world map of the Köppen-Geiger climate classification. Hydrol. Earth Syst. Sci. Discuss. 2007, 4, 439–473. [Google Scholar] [CrossRef]
  20. Good Agricultural Practices for Cassava. Available online: http://www.acfs.go.th/standard/download/eng/GAP_cassava.pdf (accessed on 21 October 2017).
  21. Howeler, R.H. Cassava mineral nutrition and fertilization. In Cassava: Biology, Production and Utilization; Hillocks, R.J., Thresh, J.M., Bellotti, A., Eds.; CABI Publishing: New York, NY, USA, 2002; pp. 281–300. [Google Scholar]
  22. Janket, A.; Vorasoot, N.; Kesmala, T.; Jogloy, S. Influence of zinc, copper and manganese on dry matter yield and physiological traits of three cassava genotypes grown on soil micronutrient deficiencies. Pak. J. Bot. 2018, 50, 1719–1725. [Google Scholar]
  23. Hoover, R.; Ratnayake, W.S. Current Protocols in Food Analytical Chemistry; John Wiley&Sons: New York, NY, USA, 2001. [Google Scholar]
  24. Freed, R.D.; Nissen, O. MSTAT-C Version 1.42; Michigan State University: East Lansing, MI, USA, 1992. [Google Scholar]
  25. Keating, B.A.; Evenson, J.P.; Fukai, S. Environmental effects on growth and development of cassava (Manihot esculenta Crantz) II. Crop growth rate and biomass yield. Field Crop. Res. 1982, 5, 283–292. [Google Scholar] [CrossRef]
  26. Beckles, D.M.; Thitisaksakul, M. How environmental stress affects starch composition and functionality in cereal endosperm. Starch-Stärke 2014, 66, 58–71. [Google Scholar] [CrossRef]
  27. Madan, P.; Jagadish, S.V.K.; Craufurd, P.Q.; Fitzgerald, M.; Lafarge, T.; Wheeler, T.R. Effect of elevated CO2 and high temperature on seed-set and grain quality of rice. J. Exp. Bot. 2012, 63, 3843–3852. [Google Scholar] [CrossRef]
  28. Fergason, V.L.; Zuber, M.S. Influence of environment on amylose content of maize endosperm. Crop Sci. 1962, 2, 209–211. [Google Scholar] [CrossRef]
  29. Lu, T.J.; Jane, J.L.; Keeling, P.L.; Singletary, G.W. Maize starch fine structures affected by ear developmental temperature. Carbohydr. Res. 1996, 282, 157–170. [Google Scholar] [CrossRef]
  30. Hurkman, W.J.; McCue, K.F.; Altenbach, S.B.; Korn, A.; Tanaka, C.K.; Kothari, K.M.; Johnson, E.L.; Bechtel, D.B.; Wilson, J.D.; Anderson, O.D.; et al. Effect of temperature on expression of genes encoding enzymes for starch biosynthesis in developing wheat endosperm. Plant Sci. 2003, 164, 873–881. [Google Scholar] [CrossRef]
  31. Labuschagne, M.T.; Elago, O.; Koen, E. The influence of temperature extremes on some quality and starch characteristics in bread, biscuit and durum wheat. J. Cereal Sci. 2009, 49, 184–189. [Google Scholar] [CrossRef]
  32. Liu, P.; Guo, W.; Jiang, Z.; Pu, H.; Feng, C.; Zhu, X.; Peng, Y.; Kuang, A.; Little, C.R. Effects of high temperature after anthesis on starch granules in grains of wheat (Triticum aestivum L). J. Agric. Sci. 2011, 149, 159–169. [Google Scholar] [CrossRef]
  33. Sawatraksa, N.; Banterng, P.; Jogloy, S.; Vorasoot, N.; Hoogenboom, G. Chlorophyll fluorescence and biomass of four cassava genotypes grown under rain-fed upper paddy field condition in tropics. J. Agro. Crop Sci. 2018, 204, 554–565. [Google Scholar] [CrossRef]
  34. Phoncharoen, P.; Banterng, P.; Vorasoot, N.; Jogloy, S.; Theerakulpisut, P.; Hoogenboom, G. Growth rates and yields of cassava at different planting dates in a tropical savanna climate. Sci. Agric. 2018, in press. [Google Scholar]
  35. El-Sharkawy, M.A.; Cock, J.H.; Held, A.A. Photosynthetic responses of cassava cultivars (Manihot esculenta Crantz) from different habitats to temperature. Photosynth. Res. 1984, 5, 243–250. [Google Scholar] [CrossRef]
  36. Saithong, T.; Rongsirikul, O.; Kalapanulak, S.; Chiewchankaset, P.; Siriwat, W.; Netrphan, S.; Suksangpanomrung, M.; Meechai, A.; Cheevadhanarak, S. Starch biosynthesis in cassava: A genome-based pathway reconstruction and its exploitation in data integration. BMC Syst. Boil. 2013, 7, 75. [Google Scholar] [CrossRef]
  37. Fukai, S.; Alcoy, A.B.; Llamelo, A.B.; Patterson, R.D. Effects of solar radiation on growth of cassava (Manihot esculenta Crantz.). I. Canopy development and dry matter growth. Field Crop. Res. 1984, 9, 347–360. [Google Scholar] [CrossRef]
  38. El-Sharkawy, M.A. Drought-tolerant cassava for Africa, Asia, and Latin America. Bio. Sci. 1993, 43, 441–451. [Google Scholar] [CrossRef]
  39. El-Sharkawy, M.A.; Cock, J.H.; Lynam, J.K.; Hernandez, A.D.P.; Cadavid, L.F.L. Relationships between biomass, root–yield and single–leaf photosynthesis in field-grown cassava. Field Crop. Res. 1990, 25, 183–201. [Google Scholar] [CrossRef]
  40. Boerboom, B.W. A model of dry matter distribution in cassava (Manihot esculenta Crantz). Neth. J. Agri. Sci. 1978, 26, 267–277. [Google Scholar]
  41. Keating, B.A.; Evenson, J.P.; Fukai, S. Environment effects on growth and development of cassava (Manihot esculenta Crantz) III. Assimilate distribution and storage organ yield. Field Crop. Res. 1982, 5, 293–303. [Google Scholar] [CrossRef]
  42. El-Sharkawy, M.A. Effect of humidity and wind on leaf conductance of field grown cassava. Rev. Bras. Fisiol. Vegetal. 1990, 2, 17–22. [Google Scholar]
  43. Aresta, R.B.; Fukai, S. Effects of solar radiation on growth of cassava Manihot esculenta Crantz II. Fibrous root length. Field Crop. Res. 1984, 9, 361–371. [Google Scholar] [CrossRef]
  44. El-Sharkawy, M.A. International research on cassava photosynthesis, productivity, eco-physiology, and responses to environmental stresses in the tropics. Photosynthetica 2006, 44, 481–512. [Google Scholar] [CrossRef]
  45. El-Sharkawy, M.A. Stress tolerant cassava: The role of integrative ecophysiology breeding research in crop improvement. OJSS 2012, 2, 162–186. [Google Scholar] [CrossRef]
  46. Luo, X.; Huang, Q. Relationships between leaf and stem soluble sugar content and tuberous root starch accumulation in cassava. J. Agric. Sci. 2011, 3, 64–71. [Google Scholar] [CrossRef]
  47. Dipnaik, K.; Kokare, P. Ratio of amylose and amylopectin as indicators of glycaemic index and in vitro enzymatic hydrolysis of starches of long, medium and short grain rice. J. Res. Med. Sci. 2017, 5, 4502–4505. [Google Scholar] [CrossRef]
  48. Irikura, V.; Cock, J.H.; Kawano, K. The physiological basis of genotype-temperature interactions in cassava. Field Crop Res. 1979, 2, 227–239. [Google Scholar] [CrossRef]
  49. Van Dam, J.; Kooman, P.L.; Struik, P.C. Effects of temperature and photoperiod on early growth and final number of tubers in potato (Solanum tuberosum L.). Potato Res. 1996, 39, 51–62. [Google Scholar] [CrossRef]
  50. Sriroth, K.; Santisopasri, V.; Petchalanuwat, C.; Kurotjanawong, K.; Piyachomkwan, K.; Oates, C.G. Cassava starch granule structure-function properties: Influence of time and conditions at harvest on four cultivars of cassava starch. Carbohydr. Polym. 1999, 38, 161–170. [Google Scholar] [CrossRef]
  51. Vasconcelos, L.M.; Brito, A.C.; Carmo, C.D.; Oliveira, P.H.G.A.; Oliveira, E.J. Phenotypic diversity of starch granules in cassava germplasm. Genet. Mol. Res. 2017, 13, 16. [Google Scholar] [CrossRef]
Figure 1. The relative air humidity (%), photoperiod (h), solar radiation (MJ m−2 day−1) maximum and minimum air temperatures (°C), and rainfall (mm) during the crop growth period of cassava.
Agronomy 08 00297 g001
Table 1. The soil physicochemical properties at pre-planting and post-planting in the experimental fields at depths of 0–30 cm and 30–60 cm.
Soil Physicochemical PropertiesApril 2016June 2016October 2016December 2016
0–30 cm30–60 cm0–30 cm30–60 cm0–30 cm30–60 cm0–30 cm30–60 cm
Physical properties
Sand (%)83.984.485.478.585.573.085.878.3
Silt (%)10.09.57.67.58.510.010.112.3
Clay (%)6.16.17.014.06.017.04.19.5
Chemical properties at pre-planting
Total N (%)0.020.020.030.020.020.010.020.01
Available P (mg kg−1)61.256.524.517.262.922.725.717.4
Exchangeable K (mg kg−1)54.635.634.220.249.012.841.416.6
Exchangeable Ca (mg kg−1)339387335379200287245225
Mg (mg kg−1)36.334.950.446.339.740.130.838.4
S (mg kg−1)53.543.247.541.15.419.33.08.3
Exchangeable Na (mg kg−1)47.442.424.825.326.224.925.724.0
pH (1:1 H2O)6.66.75.86.15.65.35.65.5
EC (dS m−1)0.050.040.060.030.030.030.030.02
OM (%)0.440.430.530.380.460.330.440.34
CEC (cmol kg−1)3.35.31.82.82.05.33.04.8
Chemical properties at post-planting
Total N (%)0.020.020.020.010.020.010.020.02
Available P (mg kg−1)57.253.915.910.228.914.916.112.7
Exchangeable K (mg kg−1)33.027.726.215.529.620.142.431.0
Exchangeable Ca (mg kg−1)351364239299216377297312
Mg (mg kg−1)44.633.452.347.635.962.958.157.6
S (mg kg−1)24.229.38.135.79.336.212.420.9
Exchangeable Na (mg kg−1)65.466.221.040.719.237.428.537.4
pH (1:1 H2O)7.06.96.45.75.95.66.06.0
EC (dS m−1)0.050.050.020.040.070.050.070.05
OM (%)0.480.450.260.210.560.270.440.35
CEC (cmol kg−1)3.23.51.72.62.05.13.24.2
N: nitrogen; P: phosphorus; K: potassium; Ca: calcium; Mg: magnesium; S: sulfur; EC: electrical conductivity; CEC: cation exchange capacity; OM: organic matter.
Table 2. The mean squares from the combined analysis of variance for biomass, starch content, starch yield, granule size (d (0.05)), amylose content, and ratio of amylose and amylopectin of three cassava genotypes at harvest stage in four planting dates.
Source of VariancedfMean Square
Biomass (t ha−1)Starch Content (%)Starch Yield (kg ha−1)Granule Size (d (0.05))Amylose (%)Ratio of Amylose and Amylopectin
Planting date (D)3568.2 (71.3) **51.4 (35.3) *72700000 (34.9) **1.62 (43.7) *3.9 (9.5) ns0.00081 (7.2) ns
Reps within D1212.4 (6.2)11.4 (31.2)6250739 (12.0)0.22 (7.8)2.4 (23.0)0.00072 (25.3)
Genotype (G)255.6 (4.6) **10.5 (4.8) ns35470000 (11.4) **1.50 (27.0) **17.0 (27.8) **0.00435 (25.7) **
G × D651.5 (12.9) **6.1 (8.3) ns34710000 (33.3) **0.20 (10.9) ns4.6 (22.8) **0.00135 (23.8) **
Pooled error244.9 (4.9)3.7 (20.4)2188152 (8.4)0.15 (10.6)0.9 (16.8)0.00025 (17.9)
Numbers within the parenthesis are percent of sum squares to total sum of squares; ns, * and ** = non significant, significant at p ≤ 0.05 and significant at p ≤ 0.01 level, respectively; df = degree of freedom; d (0.05) indicates the size of the particle expressed as the mass median diameter at which 50% of the sample is smaller and 50% is larger than this size.
Table 3. The starch concentration (% of dry weight) and starch yield (kg ha−1) of the three cassava genotypes under different planting dates with full irrigation.
Planting DateStarch Content (% of Dry Weight)Starch Yield (kg ha−1)
CMR 38-125-77Kasetsart 50Rayong 11CMR 38-125-77Kasetsart 50Rayong 11
20 April82.16 ab75.12 b82.0112,029 b B12,476 ab B17,680 a A
30 June79.53 b76.48 b80.3212,940 b A8362 b B7781 b B
5 October82.83 ab80.97 ab81.3215,252 ab A11,830 ab AB11,144 b B
15 December84.44 a82.45 a83.4918,609 a A16,068 a A11,704 b B
Different lowercase letters with the same column indicate a significant difference between the planting dates of each cassava genotype and different capital letters within the same row indicate a significant difference between the cassava genotypes of each planting date.
Table 4. The Amylose, ratio of amylose and amylopectin, and granule size distribution of starch isolated from the storage roots of the three cassava genotypes under different planting dates with full irrigation.
Planting DateGenotypeAmylose (%)Ratio of Amylose and AmylopectinGranule Size Distribution (µm)
d (0.1)d (0.5)d (0.9)
20 AprilCMR 38-125-7724.3a0.32 a7.5115.84 a29.51
Kasetsart 5021.6b0.28 b6.7514.41 b26.48
Rayong 1121.6b0.28 b7.4115.52 ab28.68
Mean22.50.297.2215.26 B28.22
30 JuneCMR 38-125-7722.6ab0.30 ab7.8916.3931.52
Kasetsart 5023.2a0.30 a7.4315.6731.91
Rayong 1120.5b0.26 b7.7516.1731.92
Mean22.10.297.6916.08 A31.78
5 OctoberCMR 38-125-7721.3b0.27 b8.0616.6131.32
Kasetsart 5023.2a0.30 a7.3015.6730.57
Rayong 1120.2c0.26 c7.5416.0032.17
Mean21.50.287.6316.09 A31.35
15 DecemberCMR 38-125-7721.0ab0.28 ab7.7116.3930.86
Kasetsart 5022.3a0.29 a7.5016.2031.33
Rayong 1120.4b0.26 b8.2816.8832.14
Mean21.20.277.8316.49 A31.44
d (0.1), d (0.5), and d (0.9) are the standard percentiles referred to as 10%, 50%, and 90% of the total starch that has a diameter (mm) less than the indicated values, respectively. Different capital letters and lowercase letters indicate a significant difference between the planting dates and cassava genotypes of each planting date, respectively.
Table 5. The stepwise regression analysis for the starch content (%) and climatic factors of the three cassava genotypes grown in the four planting dates.
Months After PlantingVariableCoefficienttDetermination Coefficient (R2)
CMR38-125-77
1–3Constant115.88.82 **0.39
Photoperiod (h)−2.78−2.60 *
3–6Constant90.127.8 **0.37
Relative humidity (%)−0.13−2.61 *
6–9Constant49.85.01 **0.43
Photoperiod (h)2.673.21 **
9–12Constant73.4722.9 **0.38
Relative humidity (%)0.132.63 *
Kasetsart 50
1–3Constant82.5569.3 **0.41
Photoperiod (h)−7.04−2.41 *
3–6Constant10.230.63 ns0.60
Photoperiod (h)8.114.02 **
Maximum air temperature (°C)−1.16−2.65 *
6–9Constant67.0717.8 **0.48
Relative humidity (%)0.213.5 **
9–12Constant115.314.7 **0.61
Total solar radiation−0.02−4.50 **
Rayong 11
1–3Constant115.57.48 **0.36
Photoperiod (h)−2.82−2.24 ns
3–6Constant52.84.5 **0.38
Maximum air temperature (°C)0.812.4 *
6–9Constant79.3780.0 **0.36
Relative humidity (%)6.942.31 *
9–12Constant100.711.2 **0.36
Maximum air temperature (°C)−0.49−2.21 *
t = t-test (or student); ns, * and ** = non-significant, significant differences at p ≤ 0.05 and p ≤ 0.01, respectively; Climatic factors were used to examine the relationship between the starch characteristics as follows; total solar radiation, minimum and maximum temperatures, mean temperature, growing degree-days, photoperiod, and relative humidity.
Table 6. The stepwise regression analysis for starch yield (kg ha−1) and climatic factors of the three cassava genotypes grown in the four planting dates.
Months After PlantingVariableCoefficienttDetermination Coefficient (R2)
CMR38-125-77
1–3Constant65,4256.33 **0.68
Photoperiod (h)−4132−4.91 **
3–6Constant−2397−0.27 ns0.75
Total solar radiation16.33.24 **
Relative humidity (%)−122.82.7 *
6–9Constant−30,760−3.68 **0.76
Total solar radiation−28.3−2.73 *
Photoperiod (h)74024.41 **
9–12Constant38,1132.93 *0.69
Photoperiod (h)−2860−2.64 *
Relative humidity (%)174.04.32 **
Kasetsart 50
1–3Constant66,8544.76 **0.61
Total solar radiation12.62.34 *
Photoperiod (h)−6074−3.93 **
3–6Constant−43,373−3.45 **0.70
Photoperiod (h)51754.93 **
Relative humidity (%)−94.94−2.19 *
6–9Constant−5888−1.74 ns0.72
Relative humidity (%)295.35.41 **
9–12Constant72645.45 **0.73
Photoperiod (h)−5560−5.02 **
Relative humidity (%)102.82.49 *
Rayong 11
1–3Constant20,4431.7 ns0.76
Total solar radiation28.496.19 **
Photoperiod (h)−43533.29 **
3–6Constant−50,636−5.06 **0.86
Total solar radiation−39.52−6.72 **
Photoperiod (h)10,2008.61 **
6–9Constant52,9956.63 **0.82
Total solar radiation76.16.32 **
Photoperiod (h)−15,900−7.56 **
Relative humidity (%)5517.92 **
9–12Constant40,8783.09 **0.82
Total solar radiation−92.5−5.19 **
Photoperiod (h)12,7423.62 **
Relative humidity (%)−523−6.14 **
t = t-test (or student); ns, * and ** = non-significant, significant differences at p ≤ 0.05 and p ≤ 0.01, respectively. Climatic factors were used to examine the relationship between the starch characteristics as follows: total solar radiation, minimum and maximum temperatures, mean temperature, growing degree-days, photoperiod, and relative humidity.

