Modeling Water and Nitrogen Balance of Different Cropping Systems in the North China Plain


1
College of Land Science and Technology, China Agricultural University, Beijing 100193, China
2
College of Surveying and Geo-informatics, North China University of Water Resources and Electric Power, Zhengzhou 450046, China
*
Author to whom correspondence should be addressed.
Agronomy 2019, 9(11), 696; https://0-doi-org.brum.beds.ac.uk/10.3390/agronomy9110696
Submission received: 2 October 2019
/
Revised: 23 October 2019
/
Accepted: 23 October 2019
/
Published: 30 October 2019
(This article belongs to the Special Issue Sustainable Cropping Systems)
Abstract
:The North China Plain (NCP) is experiencing serious groundwater level decline and groundwater nitrate contamination due to excessive water pumping and application of nitrogen (N) fertilizer. In this study, grain yield, water and N use efficiencies under different cropping systems including two harvests in 1 year (winter wheat–summer maize) based on farmer (2H1Y)FP and optimized practices (2H1Y)OPT, three harvests in 2 years (winter wheat–summer maize–spring maize, 3H2Y), and one harvest in 1 year (spring maize, 1H1Y) were evaluated using the water-heat-carbon-nitrogen simulator (WHCNS) model. The 2H1YFP system was maintained with 100% irrigation and fertilizer, while crop water requirement and N demand for other cropping systems were optimized and managed by soil testing. In addition, a scenario analysis was also performed under the interaction of linearly increasing and decreasing N rates, and irrigation levels. Results showed that the model performed well with simulated soil water content, soil N concentration, leaf area index, dry matter, and grain yield. Statistically acceptable ranges of root mean square error, Nash–Sutcliffe model efficiency, index of agreement values close to 1, and strong correlation coefficients existed between simulated and observed values. We concluded that replacing the prevalent 2H1YFP with 1H1Y would be ecofriendly at the cost of some grain yield decline. This cropping system had the highest average water use (2.1 kg m−3) and N use efficiencies (4.8 kg kg–1) on reduced water (56.64%) and N (81.36%) inputs than 2H1YFP. Whereas 3H2Y showed insignificant results in terms of grain yield, and 2H1YFP was unsustainable. The 2H1YFP system consumed a total of 745 mm irrigation and 1100 kg N ha–1 in two years. When farming practices were optimized for two harvests in 1 year system (2H1Y)OPT, then grain yield improved and water (18.12%) plus N (61.82%) consumptions were minimized. There was an ample amount of N saved, but water conservation was still unsatisfactory. However, considering the results of scenario analyses, it is recommended that winter wheat would be cultivated at <200 mm irrigation by reducing one irrigation event.
1. Introduction
The North China Plain (NCP) is located in the eastern coastal region of China (34°46–40°25′ N and 112°30′–119°30′ E). The plain covers an area of about 409,500 km2, most of which is <50 m above sea level and extends to Henan, Hebei, and Shandong provinces [1,2,3]. The region has a subtropical monsoon climate with highly variable rainfall and a typical temperature [4]. Cereal crops such as wheat, maize, sorghum, rice, barley, millet, and oats are grown here. While winter wheat and summer maize are staple crops, widely cultivated in rotations using the double cropping system [5], which accounts for >60% of the national wheat and >30% of the maize grain demand [6].
Since the 1970s, the annual use of the two-harvest cropping system greatly increased the total grain output. However, it has also caused severe groundwater decline [7,8], because both crops generally have high water requirements to complete their life cycle [9,10]. Crop water requirement does not meet the balance between groundwater recharge through rain and evapotranspiration (ET) loss from plant and soil [11]. An estimated amount of more than 450 mm yr−1 irrigation water is required to maintain high crop yield under the conventional double cropping system [12], which dominatingly depends on pumping of groundwater, and there is no access to irrigation from the river source. Thus, the groundwater is almost the only source of irrigation [13]. In the last 20 years, sustained water pumping has adversely affected aquifers. Consequently, the groundwater level fell rapidly, at the rate of approximately 1 m yr−1. On the other hand, the double cropping system under conventional farming practices contaminated groundwater by NO3− leaching [14], surface water quality degradation [2], soil acidification [15,16], and air pollution [17] due to excessive and long-term use of N fertilizers under low efficiency of farmer cultivation practices. Around 500 to 600 kg N ha−1 yr−1 of fertilizer is normally applied to achieve maximum yield. Agronomically, it is an excessive application rate based on general crop N requirements, which range from 200 to 300 kg N ha−1 yr−1 [18].
A reduction in the application of N and proper irrigation scheduling can help to achieve sustainable yield goals by simultaneously protecting natural resources and atmosphere [19]. About 15–35% of water consumption can be lowered by improving water use efficiency [20]. It is possible through efficient management strategy and optimal cropping system [21]. However, there are numerous constraints associated with the optimal cropping system [22]. Since the field, dynamic observation of evapotranspiration, water drainage, N losses, and crop growing indices are time consuming and costly. Crop model-based improved simulation techniques with response to environmental conditions have been developed for making effective and proper use of input resources [23]. Simulation models define the systematic processes related to crop growth and development and are useful tools to assess the impact of soil extrinsic factors (fertilization), variability of climatic conditions, and crop management practices [24,25] by providing credible predictions [26]. Typically, crop models consider the time span in which a specific growth stage takes place and initiate biomass of crop components, e.g., roots, leaves, stems, and yield attributes, as they change time to time, and similarly, changes in the nutrients content and soil moisture status. Mostly, models use major information on crop growth factors. They are of various types, classified into three broad categories i.e., statistical, functional, and mechanistic models [27], and are widely used in agricultural research to solve and identify problems integrated in the complex farming system [28]. The crop modeling analyses showed that cereal crops are most vulnerable to increasing water scarcity in many countries of the world [29]. Recently, an integrated soil-crop model (WHCNS, soil water-heat-carbon-nitrogen simulator) was developed based on the Chinese climate, soil types, and field management and the model has been successfully applied to simulate water use, N loss, and N use efficiency in China [30,31,32]. Previous research showed that the model simulated soil and crop indicators agreed well with observed data [33]. However, there is still limited work on the simulation of water and nitrogen balance under diversified crop rotations using this model.
Therefore, the main aims of this study were: (1) To evaluate grain yield, water and N use efficiencies under different cropping systems using the WHCNS model, and (2) to optimize water and N management by scenario analyses.
2. Materials and Methods
2.1. Description of Study Site
Quzhou County (114.9° E, 36.7° N, 40 m above sea level) belongs to the prefecture-level city of Handan, located upstream of the Heilonggang River basin in southern Hebei province, which is one of the most affected area in terms of groundwater depletion in the world [34]. Fertilizers are highly used with inefficiency in the study area. A recent research of Cai et al. [35] and Ling et al. [36] reported an increasing trend of dependence on chemical fertilizers up to 36.3% in the current production system exceeding international standards for the sake of yield [37].
The county belongs to a continental monsoonal climate. The long-term annual mean air temperature is 13.1 °C and the mean annual precipitation is 534.9 mm. About >68% of precipitation occurs during the June to September months of the year. The soil of this site is alkaline in nature with a pH > 8.0, has a silty texture, nitrogen < 0.68 g kg−1, phosphorus < 6 mg kg−1, and potassium < 75 mg kg−1 [3]. The soil properties at different depths are presented in Table 1.
2.2. Detail of Experimental Design and Management Practices
Four replicated randomized complete block design field experiments were conducted from 2004 to 2006 on different cropping systems including two harvests in 1 year (winter wheat–summer maize) based on farmer (2H1Y)FP and optimized practices (2H1Y)OPT, three harvests in 2 years (winter wheat–summer maize–spring maize, 3H2Y), and one harvest in 1 year (spring maize, 1H1Y). The plot size was 84 m2 (10 m long × 8.4 m wide). Wheat variety Shijiazhuang-8 was sown (row spacing 15 cm) on 10 October and harvested on 15 June, then summer maize cultivar Zhengdan-958 was grown (row spacing 60 cm) after 2–5 days gap for two years. Nongda-1505 spring maize variety was employed for both monoculture (1H1Y) and triple cropping (3H2Y) systems. The sowing date of spring maize was on 27 April which was harvested on 8 October of the same year. Cropping systems were rotated for a two-year period by following these sowing dates. The seed rate for winter wheat was 385 kg ha−1, and 24–30 kg for maize. The final plant density of maize was 6–7 plants m2. Except for 2H1YFP, the other cropping systems were managed under optimized water and fertilizer practices based on soil testing. Irrigation was applied to keep soil moisture in the rooting zone between 50% and 85% of the available field capacity. The 2H1YFP system was fully irrigated based on local farmer practices. Winter wheat was irrigated 3–5 times and maize crop was irrigated 2 times through the flooding method. In 2H1YFP system, the N rates were 300 kg N ha−1 and 250 kg N ha−1 for wheat and maize cultivation in each season, respectively, through 2–3 split doses. The optimized cropping systems 2H1YOPT, 3H2Y, and 1H1Y received 420, 325, and 205 kg N ha−1, respectively. Fertilizer application was through the broadcasting method. Precision land leveling was done for each cropping system to ensure uniform germination and growth, and 45 kg ha−1 of phosphorus was applied as a basal dose for vigorous seedling establishment. Other agronomical measurements such as weed, pest, and disease controlling were according to local farmer practices.
2.3. Data Collection, Methods, and Analyses
The soil water content was measured using TDR (MP917) probes (Environmental Sensors, Inc., Sidney; BC; Canada) [38] from shallow to deep soil layers of 0–30, 30–60, 60–90 and 90–120 cm, and soil samples were taken as well with help of auger for observation of soil N concentrations. Five core samples were properly mixed, sieved with 4 mm sieves, extracted with 0.01 mol L−1 CaCl2 (1:10, soil/water), and then filtered. The ready samples were analyzed by continuous flow analyzer (TRAAC 2000, Bran and Luebbe, Norderstedt; SH; Germany). The soil water content (cm3 cm−3), and N concentrations (mg kg−1), dry matter (kg ha−1) and leaf area index (m2 m−3) were observed during key growth stages, and grain yield (kg ha−1) was measured after harvesting. Winter wheat was harvested by its full physiological maturity indicator (completely loss of green color from glumes), and maize crop was harvested when the grain moisture content was dropped <20%. Replicated cob samples were oven dried to keep grain moisture <15%, and then threshed. The N balance, NUE, water balance, and WUE were calculated using Equations (1)–(4) respectively. All the collected data were simulated using the WHCNS model and statistically analyzed using Statistix 8.1 software (Tallahassee; FL; USA) to determine significant differences at p < 0.05 probability level [36]. In addition, we established different scenarios to optimize water and N management based on the experimental results. Complete detail of scenarios is given in Section 2.4.1.
where, Nfer is total N fertilizer rate (kg N ha−1), Nmin is net mineralization (kg N ha−1), Nvol = volatilization (kg N ha−1), Nden = denitrification (kg N ha−1), Nlea is N leaching (kg N ha−1), Nup is crop N uptake (kg N ha−1), GY is grain yield (kg ha−1), I is irrigation (mm), P is precipitation (mm), ET is evapotranspiration (mm) and D is drainage (mm), R is runoff (mm) [39,40]. WS and NF are water-saving and N fertilizer, respectively, Wu/Fu = Water use (mm) and Fertilizer use (kg) of cropping system [41].
2.4. WHCNS Model
The WHCNS model was used to simulate the effect of irrigation levels and N fertilizer rates on the growth and yield of different cropping systems. Model is efficient in the simulation of soil water movement, N transport, crop growth, development, and grain yield under different crop rotations and management practices. It can simulate complex and intensive cropping systems characteristic to NCP. It is comprised of 5 primary modules, (a) soil water, (b) heat transfer, (c) N transport, (d) soil organic carbon turnover, and (e) crop growth. The reference crop evapotranspiration (ETo) was calculated by using the Penman-Monteith equation [42] proposed by Allen et al. [43]. Water infiltration and their redistribution in the soil profile, runoff, and soil N concentrations (NH4+ and NO3−) were simulated by using the Green-Ampt model and Richards equation, SCS curve number and convection dispersion equations respectively [44,45,46]. Soil heat transfer simulation imported from the Hydrus-1D and soil organic matter dynamics were directly derived from the Daisy model. Crop growth and development processes, dry matter formation and grain yield simulations were performed using the improved PS123 model [47]. More detailed information is available in the paper of Liang et al. [30].
2.4.1. Scenarios Setting
Scenario setup is one of the important technique to set an unlimited number of treatments that could be not possible or difficult in field experiments due to space, time and financial limitations etc. Therefore considering successful prediction of model, best management practice, and latest research findings of Ling et al. [36], we further changed farming practices, where N rates and irrigation levels were linearly increased and decreased for winter wheat, summer and spring maize to extensively examine the effect of excessive and deficit irrigation, and N input managements on cropping systems. These scenarios were simulated using the WHCNS model (Table 2).
Hence, each crop received excessive and deficit N, and irrigation treatments as well as evaluated under rainfed conditions.
2.4.2. Model Input Data
Model input system requires information about crop growth stages with root, shoot and leaf weight (g), plant type C3 or C4, critical temperature ranges, sowing date, seed, and fertilizer rate, application timing and harvesting date, basic soil properties, carbon (kg h−1) and C/N ratio, latitude and longitude of the site, as well as daily rainfall, relative humidity, maximum, minimum and mean air temperature. The soil data for soil saturated water content (θs), water content at field capacity (θfc) and permanent wilting point (θwp), and saturated hydraulic conductivity (Ks) were calibrated from the soil analyses laboratory report, which is presented in Table 1 and basic crop parameters are given in Table 3. The meteorological data used in the model were acquired from a nearby automatic weather station, located approximately 5.5 km away from the research site.
2.4.3. Statistical Evaluation of the Model
The model performance was evaluated using: (i) Root mean square error (RMSE) to measure how much error there is between two data sets of predicted and observed, (ii) the Nash-Sutcliffe model efficiency coefficient (NSE) and (iii) index of agreement (d), which are standardized measures in the modeling, and (iv) Pearson correlation coefficient analyses was applied to quantify the magnitude of the collinearity between observed and predicted variables.
where Oi = observed value, Pi = predicted value, and O is the mean of the measured values, n is the number of data values, GY = grain yield.
The lower RMSE, the good model performance [48]. The NSE ranges from – to 1.1 show the great efficiency, 0 indicates the predicted values are as accurate as of the mean of the observed data, and <0 result indicates that observed average value is a good predictor as compared to the model [49]. While d value varies from 0 to 1. A closer value to 1 show a perfect match of simulated results with observed data, and 0 specify no agreement at all [50]. In case of correlationship, the thumb rule for interpretation based on positive (+) or negatives (−) sizes is, 0.90–1.00 (Very high), 0.70–0.90 (High), 0.50–0.70 (Moderate), 0.30–0.50 (low), 0.0–0.30 (No) [51]. The r close to 1 illustrates model fit [52].
3. Results
3.1. WHCNS Model Calibration and Validation
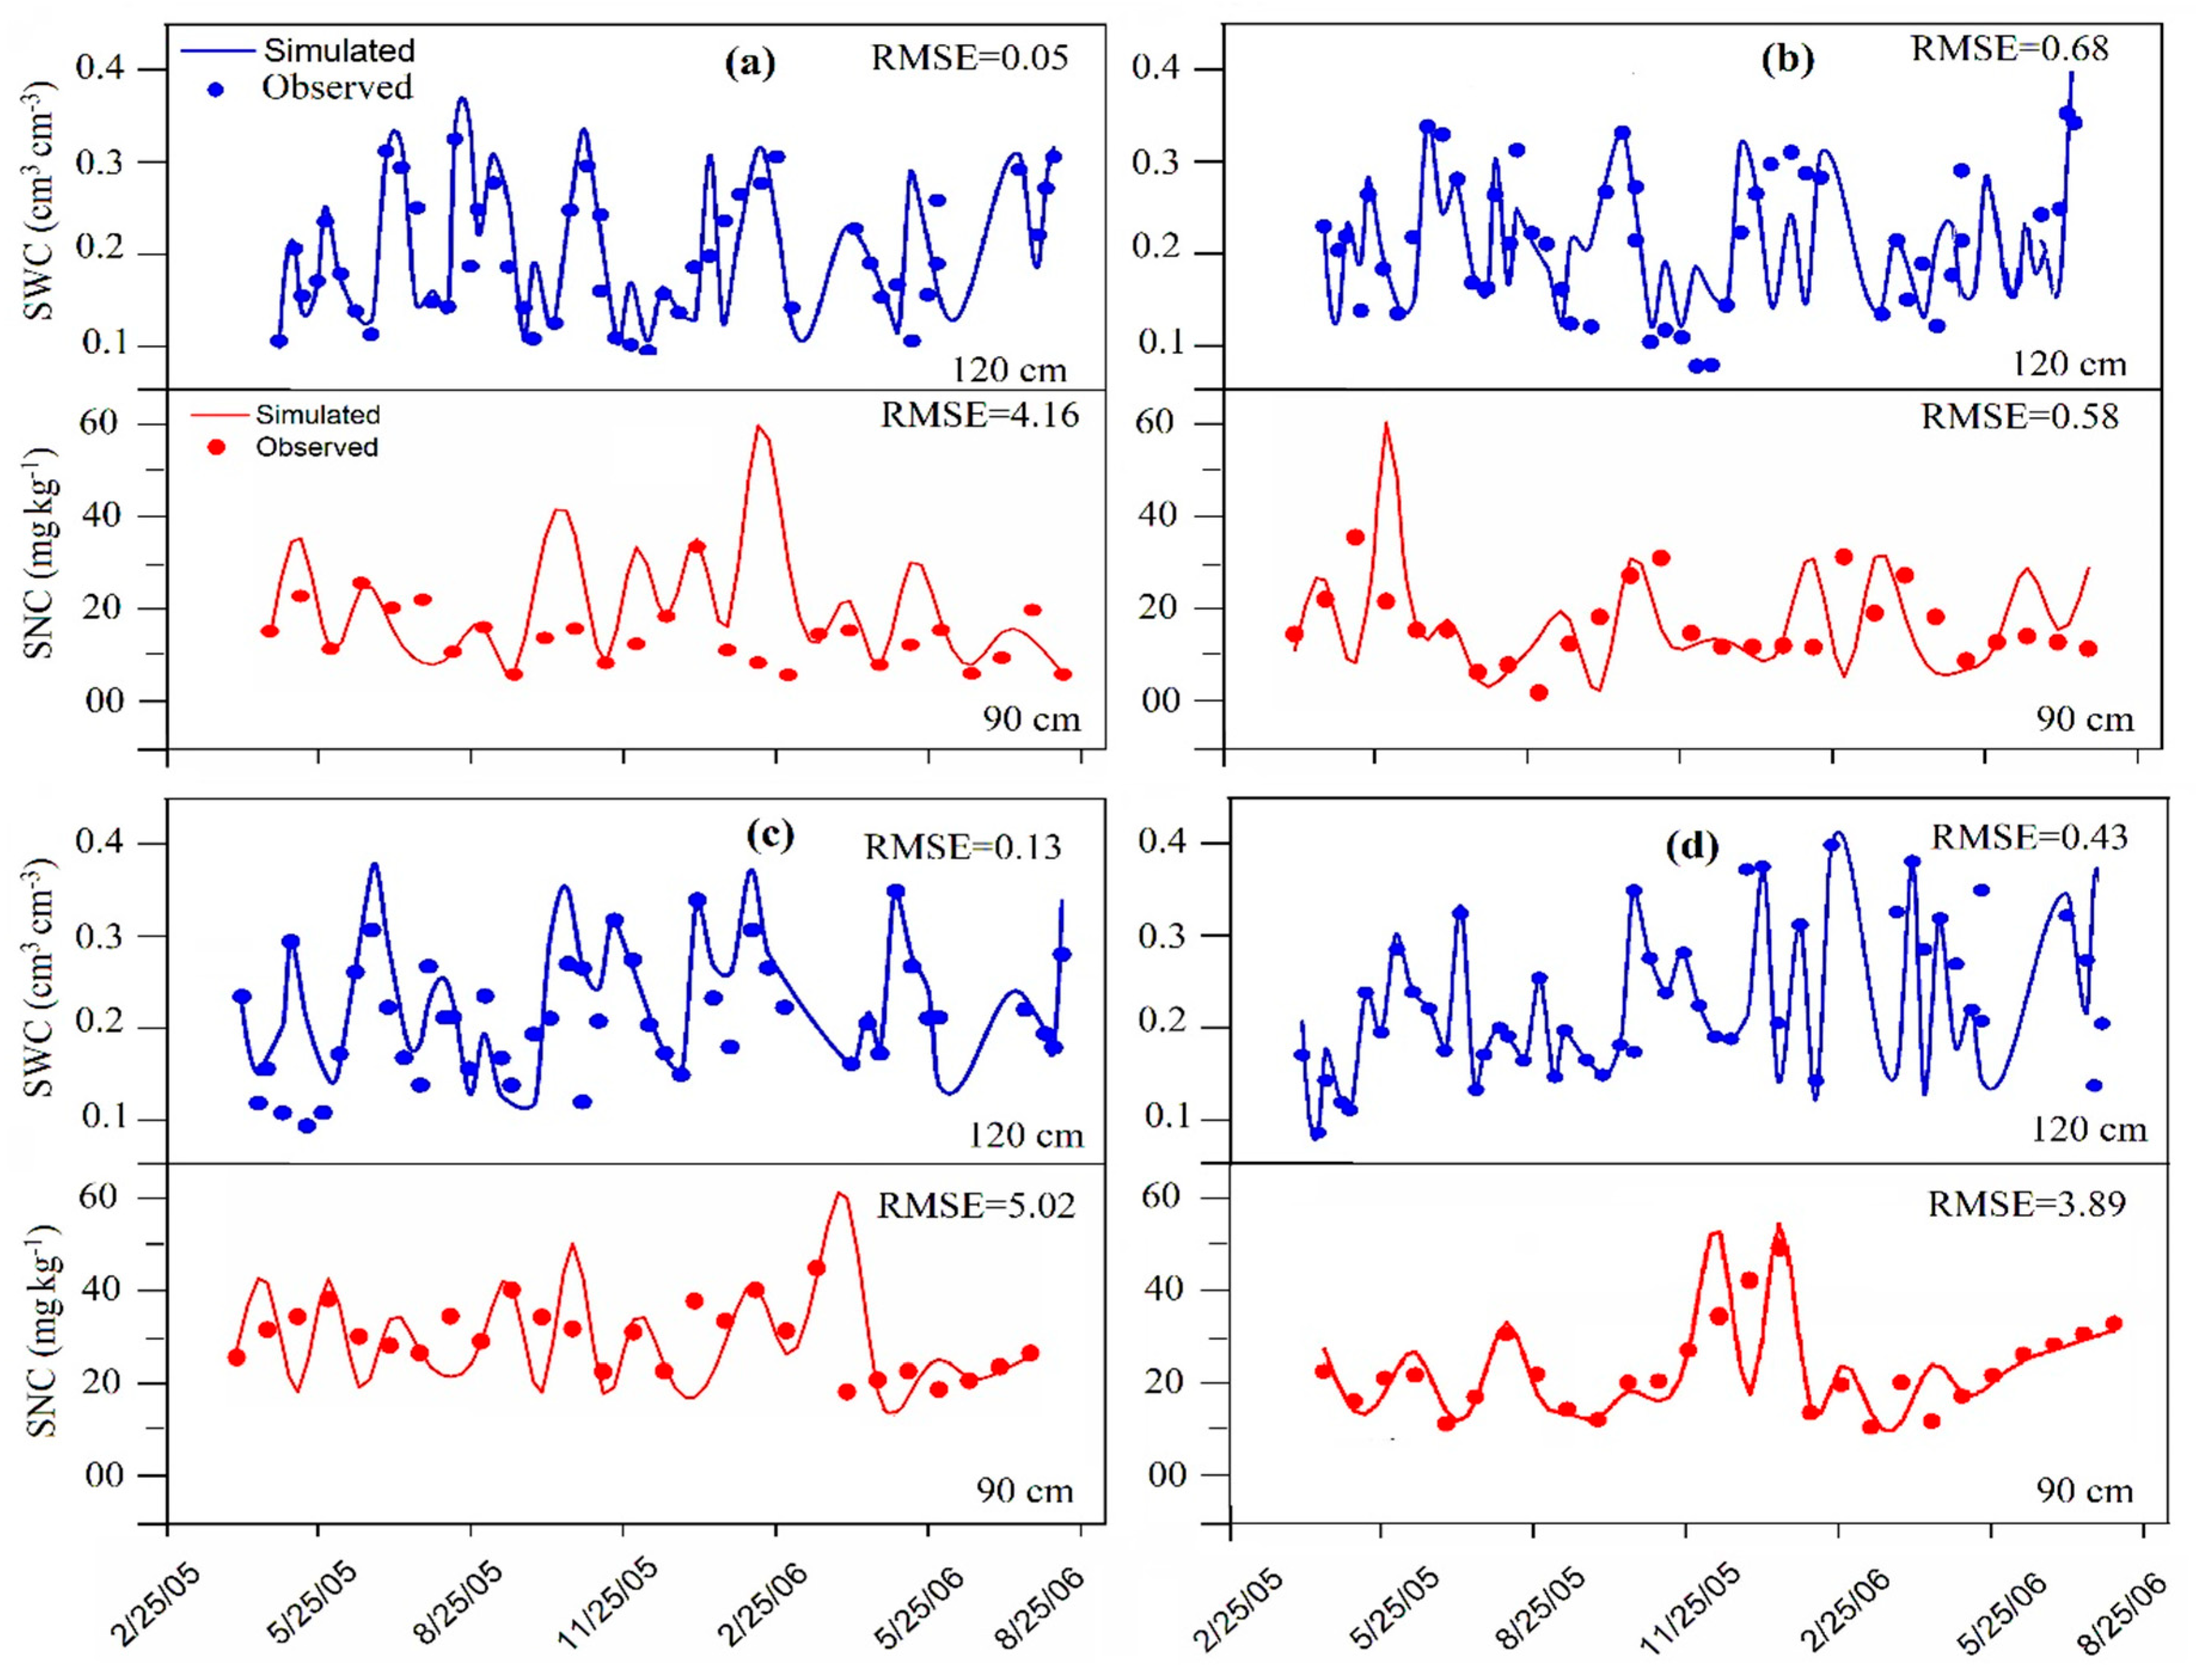
The observed soil water content (cm3 cm−3), soil N concentration (mg kg−1), leaf area index (m2 m−3), dry matter (kg ha−1), and grain yield (kg ha−1) data from 2H1YFP were used to calibrate the model, and then validated by the field experimental data obtained from other cropping systems (2H1YOPT, 3H2Y and 1H1Y). The results were statistically evaluated by RMSE and related statistical indices. The model simulation was satisfactory for all cropping systems. The observed data points fluctuated up-down close to the predicted curve which was in good agreement between model simulated and absolute values. Hence, RMSE values of soil water content at 0–120 cm soil depth for 2H1YFP, 2H1YOPT, 3H2Y and 1H1Y were 0.05, 0.68, 0.13 and 0.43, respectively (Figure 1). While, shallow to deep soil layer (0–30, 30–60, 60–90, 90–120 cm) wise RMSE values are given in Table 4. It has been found that RMSE of volumetric water contents decreased as soil depth increased. The minimum RMSE for upper soil (0–30 cm) was 0.06, and for deeper soil (90–120 cm) was 0.04. The RMSE values for soil N concentration were varied from 7.43–2.10, and for leaf area index, dry matter and grain yield ranged from 0.49–0.55, 1326.9–1608.3 and 280.91–609.96 respectively. From the yield point of view, the minimum RMSE 280.91 was showed from the 2H1YFP system. The cumulative simulated grain yield was only a 7.47% difference than observed. Predictions were accurate for each system with 3.42–1.02% variation (Figure 2). In addition, the correlation degree of strength varied from parameter-to-parameter. The sizes of correlation coefficient values were within very high, high and moderate. Figure 3 Illustrates integrated correlationships for soil water content, soil N concentration, leaf area index, dry matter, and grain yield of different cropping systems. While cropping system wise r values and other statistical indices are shown in Table 4. The simulated and observed data of crop growth and yield attributes had a very strong correlation coefficient strength (0.89–0.99). Whereas, soil N concentration had strong (0.61–0.88) and soil water content had moderate correlation (0.53–0.76) according to Mukaka [51], who briefly elaborated the correlation coefficient and provided guidance for correct use. The WHCNS model performance was valid season-to-season, because of better parameters assumption. Statistical indices well specified performance of the model. The model can be effectively used to simulate soil, crop growth, and yield indicators. There was a minor simulation error based on overall figures, which indicated a better sensitivity of the model. The slight fluctuation of RMSE values in all cropping systems could be attributed to the temporal change of soil moisture and nutrients status after irrigation and N fertilization [53,54,55,56,57,58,59]. In the current study, RMSE ranges were <8 at the top layer, and <3 at 60–90 cm soil depth. Statistically, there is no threshold limit. Generally, low RMSE is a sign of model efficiency [37,46].
3.2. Grain Productivity
Results revealed that the 2H1YFP cropping system consumed excessive irrigation (745 mm) and N fertilizer (1100 kg) as compared to optimized management practices, and showed a low total yield of 21,474 kg as well (Figure 2a). Significantly (p < 0.05) high yield 22,758 kg obtained from 2H1YOPT, where 18.12% low irrigation (610 mm) and 61.82% deficit N rate were applied. In this system, winter wheat accounted for 5635 kg ha−1 and maize 5788 kg ha−1 in the first growing season, but in the subsequent year, winter wheat yield was 3488 kg ha–1 with 38.10% reduction and summer maize yield was 7847 kg ha−1 with 35.57% addition. The reason for the decrease in winter wheat yield was low rainfall, and the increase of maize yield in second year cycle was precipitation events. The heavy rainfall recorded during the late season, particularly in maize crop period throughout the experimental period. While the 3H2Y system showed total grain yield of 17,612 kg and monoculture 1H1Y had total grain yield of 17,471 kg. In 1H1Y system, spring maize yield was high in both two years. First year yield was 8331 kg ha−1 and second years was 8761 kg ha−1. There was no significant difference between 3H2Y and 1H1Y in terms of total productivity (Figure 2). On an annual basis, the yield differences were very low among all cropping systems. The 2H1YFP had average annual yield range of 10737.5 kg. It was <5.64% than 2H1YOPT, and >17.98% to 18.64% than 3H2Y and 1H1Y cropping systems.
3.3. Evapotranspiration, Drainage, Runoff and Water Use Efficiency
The model was applied to simulate runoff, drainage and evapotranspiration (Table 5). Results showed that drainage and water runoff were associated with rainfall intensity. The 2H1YFP system had 243 mm drainage (>2H1YOPT), and 3H2Y had 113 mm drainage (≥1H1Y). The commutative drainage was high, about 517 mm during maize growing seasons, and only 106 mm during wheat seasons of all cropping systems. The maximum runoff water loss occurred when rainfall was >300 mm. In case of total evapotranspiration water loss, the lowest evapotranspiration (812 mm) was simulated from 1H1Y, followed by 3H2Y (1013 mm). Double cropping system under farmer and optimized management practices had equal evapotranspiration rate (128 mm). Thus, there was a significantly high (351.7 mm) positive water balance calculated from spring maize cultivation in the second year. The average water balance order was 1H1Y > 3H2Y > 2H1YFP > 2H1YOPT.
Across all cropping systems, the average water use efficiency was low in the 2H1YFP (1.8 kg m−3), 2H1YOPT (1.9 kg m−3) and 3H2Y (1.8 kg m−3) as compared to 1H1Y (2.1 kg m–3). The summer and spring maize crops had maximum water use efficiency throughout the experimental trails.
3.4. Crop N Uptake, N Loss and N Use Efficiency
The summer and spring maize crops had higher crop N uptake than winter wheat in all cropping systems (Table 6). Crop N uptake was significantly high in 1H1Y monoculture rotation. First year spring maize had 216 kg N ha–1 uptake, and subsequent year had 234 kg N ha–1. Average N uptakes were 184.25, 163.5, 177.6 and 225 kg N ha−1 in 2H1YFP, 2H1YOPT, 3H2Y and 1H1Y systems respectively. Thus the sequence was 1H1Y > 2H1YFP > 3H2Y > 2H1YOPT.
The N loss through volatilization, denitrification and leaching are not only yield affecting factor, but also the primary cause of maximum N deposition in the terrestrial and aquatic systems. The current study showed that the double cropping system under farmer (2H1YFP) and optimized practices (2H1YOPT) had higher N loss, total ranged from 118–265 kg. The lowest N loss was 46.1 kg from the 1H1Y, and 3H2Y had 66.8 kg N loss. Therefore, the 2H1YFP and 2H1YOPT had low average N use efficiency than 3H2Y and 1H1Y systems. The highest mean N use efficiency (34.8 kg kg−1) was from 1H1Y monoculture. Generally, N use efficiency was higher for all crops grown in the first season of first rotation in each cropping system and subsequently dropped (Table 6).
3.5. Results of Scenario Analyses
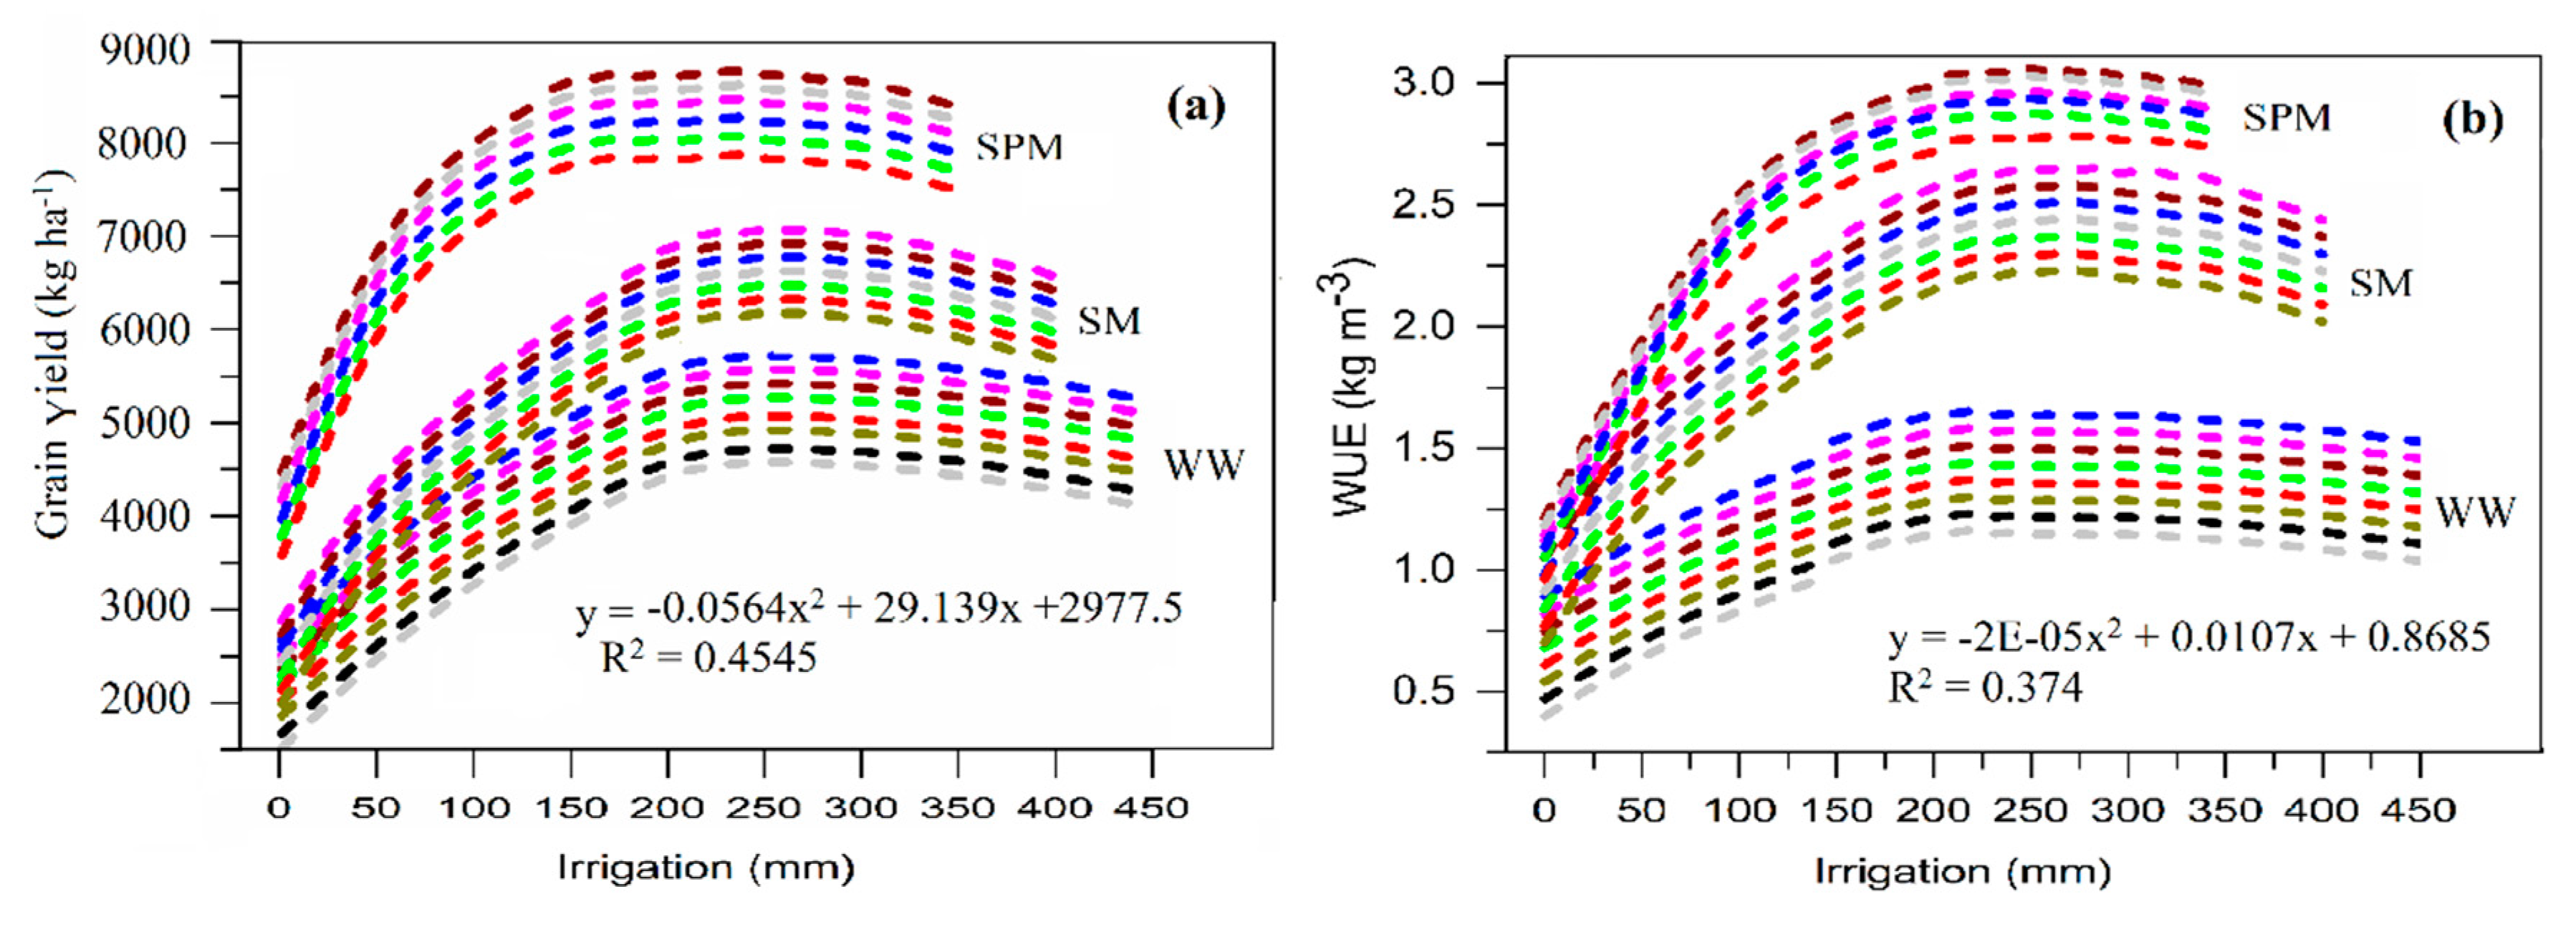
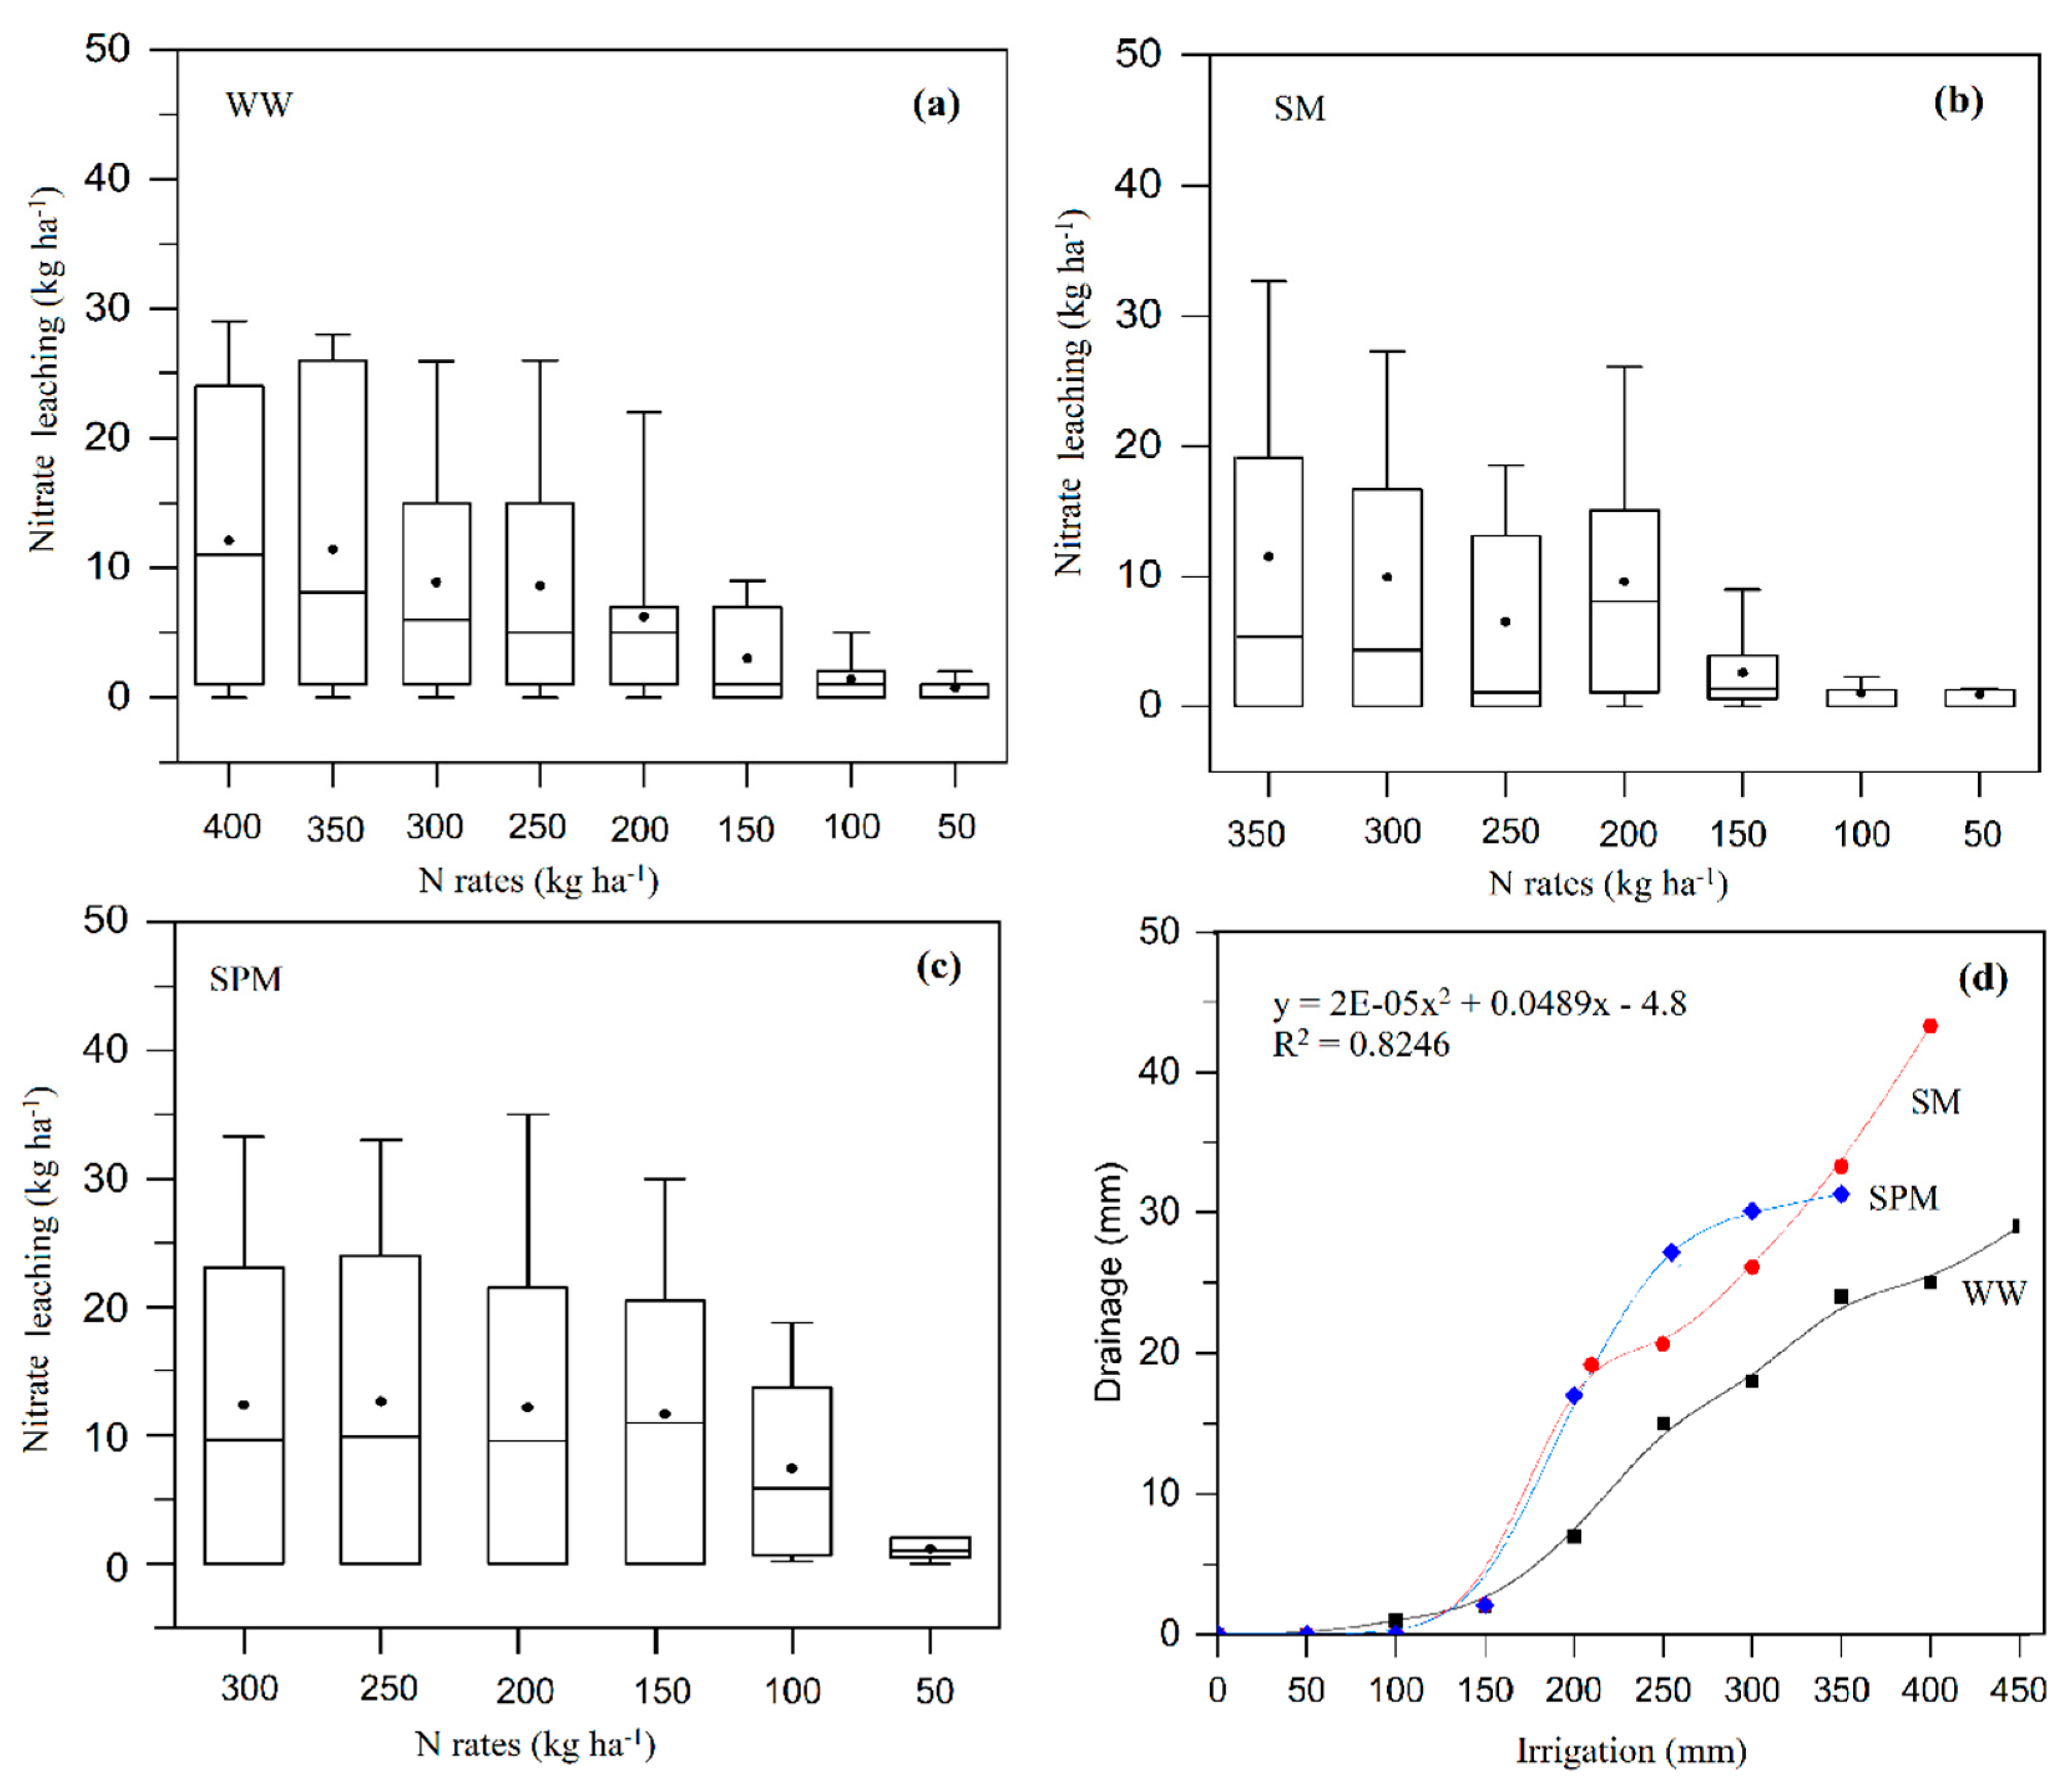
Initially, an increasing yield response of winter wheat, summer and spring maize showed with the interaction of increasing N rates and irrigation levels (Figure 4a). When irrigation and N doses were increased to excessive, then yield was decreased or there was no significant increase. The grain yield was <3000, <4000 and <7000 kg ha−1, respectively at 0–50 mm irrigation in combination with all N rates. The grain yield curves of winter wheat reached to peak from the 200 mm irrigation × 150–250 kg N ha−1 with the highest simulated yield of 5000–5750 kg ha−1, summer maize from the 200 mm irrigation × 100–1 50 kg N ha−1 with yield of 6200–7000 kg ha−1, and spring maize from the >150 mm irrigation ha−1 × 100–250 kg N ha−1 with yield of 8400–8540 kg ha−1. In the case of N and water use efficiencies, which is the ratio of grain yield to the amount of N and irrigation depleted by crop during the growth period (Figure 4b,c). The N use efficiency was the lowest at >250, >200 and >150 kg N ha−1 for winter wheat, summer and spring maize, respectively due to low yield. The spring maize had the highest N use efficiency (37.5 kg kg−1) from the 50 to100 kg N ha–1. While water use efficiency also lowered as the irrigation increased. The spring maize had the highest water use efficiency (>2.8 kg m−3). Furthermore, when irrigation level was set to 0 mm in the model as rainfed condition, then simulated yield of spring maize yield was >4000 kg ha−1 with the combination of 50–100 kg N ha−1, and the yield response of winter wheat was <2500 kg ha−1 (Figure 4a). Going in depth, the N leaching and drainage prediction of WHCNS model showed that the N loss was correlated to N rate and drainage was closely associated to irrigation amount. As the N rates and irrigation amounts were increased, the N leaching and water drainages increased too. The rates of N leaching and drainage were notable when N rate was >250 kg ha−1 and irrigation level was >200 mm ha−1 for winter wheat with a maximum N leaching of 28.3 kg ha−1 and drainage 29.0 mm. Both, summer and spring maize crops had the higher N leaching when N rate was >150 and >100 kg N ha−1, respectively (Figure 5b,c).
4. Discussion
4.1. Effect of Different Cropping Systems on Grain Yield, Water and N Use Efficiencies
The modeling based study of crops is an effective method to optimize the farming practices and suggest possible solution for sustainable agriculture development. The predicted results for 2H1YFP cropping system under local farmer practices indicated that the yield is not related to excessive irrigation and N application. This is also confirmed from the observed data. The low yield was obtained from the double cropping system plots, despite the field soil had the high amendment of irrigation and N fertilizer. We found that, although 2H1YOPT increased grain yield (5.97%) and reduced N fertilizer (61.81%) as compared to 2H1YFP, the 610 mm irrigation consumption is still high. The high water use in the double cropping system also reported by many other researchers [60,61,62]. Therefore, only N saving is unsustainable, because irrigation water is quite important factor in the crop production system. About 420 mm irrigation was used by wheat crop in the 2H1YOPT. The rainfall was significantly low (<250 mm) throughout the winter wheat growing season of this study period, which limited grain yield. Water saving technology [63], proper plant density [64], minimum tillage [65], and other agronomic and breeding approaches would be advantageous to reduce water consumption of winter wheat. Furthermore, the evapotranspiration sequence was 1H1Y < 3H2Y < 2H1YOPT < 2H1YFP. The irrigation levels and N fertilizer rates of 3H2Y were <41.20% and <70.45%, respectively than 2H1YFP, but this 3H2Y system failed due to low grain yield output. Only monoculture 1H1Y system was dominant over all other systems in the light of both environmental protection and groundwater security at cost of some grain yield loss. In this system, irrigation level was <56.64% (323 mm) and N fertilizer was <81.36% (205 kg) than 2H1YFP. Similar results also reported by Meng et al. [66]. Yang et al., [37], studied five crops (wheat–maize–cotton–sweet potato –peanuts) in rotations using DSSAT crop model for a 12 years long term field experiment, and found that wheat accounted for >40% crop water use. The 2H1YFP had the highest annual evapotranspiration rate (734 mm) with 1.1 m groundwater decline. The monoculture of any crop used less water than prevalent 2H1YFP. Monoculture cultivation of maize reduced >60% irrigation and >70% N fertilizer [3]. There were two important reasons of high yield of continuous 1H1Y system to low inputs in the present study, one was high average N mineralization (62.23 kg ha−1), N uptake (225 kg ha−1), N use efficiency (35.65 kg ha−1) and water use efficiency (2.15 kg m−3). It can be explained as temporal match between spring maize growth period and available resources. The spring maize being a C4 efficient, do not exhibit photorespiration, uses CO2, solar radiation, temperature, and water more efficiently than winter wheat [66,67], and other reasons of high yield of continuous 1H1Y system to low input treatments could be balanced N dose, which was <8.29% than 43–179 kg N ha−1 as recommended by Zhang et al. [68].
4.2. Effect of Cropping Systems on Water Drainage, and N Fates
Irrigation and N balancing as per need of normal plant growth by reducing the nitrate that transport to water bodies and gaseous loss to environment, is a big challenge in the crop production system [69]. When field water become excess, then it drains down from root zone carrying NO3− which contaminates groundwater. It has been identified that agricultural farming in China is causing more environmental pollution than any other source [70]. Our study revealed that the 1H1Y had the lowest N loss through leaching, denitrification, and volatilizations than the rest of the cropping systems (2H1YFP, 2H1YOPT and 3H2Y). The amounts of N leaching and volatilization were higher in 2H1YFP cropping system. Particularly, maximum N leaching and N volatilization loss measured from maize crop managed under farmer practices. The linking factor was high dose application of N fertilizer rates exceeding crop demand. The annual application of N fertilizer >550 kg ha−1 did not significantly increase grain yield, but led to twice time higher NO3− losses [71,72]. Bing et al. [73] observed the peak of N emission at >180 kg N ha–1, because crop plant can only uptake required amount to complete life cycle, when soil and environmental condition are favorable. The maximum N loss from double cropping system under farmer practices was due to excessive N application (550 kg N ha−1), and topdressing of N via broadcasting application method. This method of fertilizer application is inefficient. Beside greater N loss in volatilization due to increased time of N granules exposed to sun and air. There are also number of other disadvantages such as N fixation as granules cover large soil mass and wrong placement since plant cannot utilize N as N move latterly over some distance from the range of roots [73,74].
Based on the evidence of current research results, it was noticed that N leaching and drainage occurred due to spring rainfall events and excessive irrigation. The cause of volatilization was the raised temperature during the period from May to October in each year of entire experimental period. An average >20% NH3 volatilization was observed by Cui et al. [18] due to higher temperature. Another N loss was from denitrification pathway. It is a process, where NO3− converts into N2 by serial facilitation of soil microbes, depends on soil pH, aeration and energy [74]. The N denitrification was low in 2H1YFP, and higher in all other cropping systems. In case of the N mineralization, it was effective in 2H1YOPT, 3H2Y and 1H1Y systems, indicates stimulated soil microbial activity in optimized cropping systems, which increased plant available N. There was 210 kg N became available for 2H1YOPT, 148 kg N for 3H2Y and 124 kg for 1H1Y. We noticed that maize crop had bigger N net mineralization and N uptake than wheat crop. These results are in line with Ju et al. [75].
4.3. Best Management Practices (BMPs) for Different Cropping Systems
Based on experimental findings, which are briefly described above and deep analyses of management practices, showed that it is important to further optimize farming practices for reduction of nitrate loss while sustaining yield. The results of scenario analyses indicated that there is an opportunity to reduce some amount of N and irrigation from different cropping systems. In the 2H1YOPT cropping system, the cultivation of winter wheat using <200 mm irrigation and 100–150 kg N ha−1 and summer maize with inputs of <150 mm irrigation and <100 kg N ha−1 would be both environmentally and economically beneficial. Furthermore, irrigation ranging in between 100–150 mm ha−1 and <150 kg N ha−1 for spring maize cultivation would be a suitable management practice. These findings are in agreement with the conclusion of Zhao et al. [76] and Luo et al. [77]. Cultivation of crops under conventional practices will further increase groundwater decline. Keeping field moisture at optimum level and lowering N application would reduce the risk of environmental security [78].
5. Conclusions
It was a very critical decision to recommend an ideal cropping system considering simultaneously environmental and socioeconomic factors of the region. Therefore, grain yield, water and N use efficiencies under different cropping systems were compared through the WHCNS model, and optimized management practices were explored by scenario analyses. The results indicated that simulated soil water content, soil N concentration, leaf area index, dry matter and grain yield agreed well with observed values. So, the model could be used to quantitatively analyze the N fates, water and N use efficiencies under the different management practices. We concluded that replacing the prevalent 2H1YFP cropping system with 1H1Y would be ecofriendly at cost of some grain yield decline. Whereas, the 3H2Y showed insignificant results in terms of grain yield, and 2H1YFP was unsustainable. The 2H1YFP system consumed 745 mm water and 1100 kg N ha−1 in two years. When farming practices were optimized for two harvests in 1 year system (2H1Y)OPT, then grain yield improved and water (18.12%) and N (61.82%) consumption were minimized. There was an ample amount of N saved, but water conservation was still unsatisfactory. However, considering the results of scenario analyses, it is recommended that winter wheat would be cultivated at <200 mm irrigation by reducing one irrigation event.
Author Contributions
Data analyses, S.J.L. and H.L.; wrote the paper, S.J.L., K.H. and Y.W.; supervision, K.H.
Funding
The work was supported by the National Key R&D Program of China (2016YFD0800102 and 2017YFD0301102-5).
Acknowledgments
We thank Liang Jin for providing soil data for our study.
Conflicts of Interest
The authors declare no conflict of interest.
References
- Quan, J.; Zhang, Q.; He, H.; Liu, J.; Huang, M.; Jin, H. Analysis of the formation of fog and haze in North China Plain (NCP). Atmos. Chem. Phys. 2011, 11, 8205–8214. [Google Scholar] [CrossRef] [Green Version]
- Zhang, Z.; Tao, F.L.; Du, J.; Shi, P.J.; Yu, D.Y.; Meng, Y.B.; Sun, Y. Surface water quality and its control in a river with intensive human impacts. A case study of the Xiangjiang River. Chin. J. Environ. Manag. 2010, 91, 2483–2490. [Google Scholar] [CrossRef] [PubMed]
- Meng, Q.; Sun, Q.; Chen, X.; Cui, Z.; Yue, S.; Zhang, F.; Romheld, V. Alternative cropping systems for sustainable water and nitrogen use in the North China Plain. Agric. Ecosyst. Environ. 2012, 146, 93–102. [Google Scholar] [CrossRef]
- Lv, L.; Yao, Y.; Zhang, L.; Dong, Z.; Jia, X.; Liang, S.; Ji, J. Winter wheat grain yield and its components in the North China Plain: Irrigation management, cultivation, and climate. Chil. J. Agric. Res. 2013, 73, 233–242. [Google Scholar] [CrossRef] [Green Version]
- Xiao, D.P.; Tao, F.L.; Liu, Y.J.; Shi, W.J.; Wang, M.; Liu, F.S.; Zhang, S.; Zhu, Z. Observed changes in winter wheat phenology in the North China Plain for 1981-2009. Int. J. Biometeorol. 2013, 57, 275–285. [Google Scholar] [CrossRef]
- NBS (National Bureau of Statistics of China). China Agriculture Yearbook; China Agriculture Press: Beijing, China, 2009. Available online: http://www.stats.gov.cn/tjsj/ndsj/2009/indexeh.htm (accessed on 1 January 2012). (In Chinese)
- Gao, B.; Ju, X.T.; Meng, Q.F.; Cui, Z.L.; Christie, P.; Chen, X.P.; Zhang, F.S. The impact of alternative cropping systems on global warming potential, grain yield and groundwater use. Agric. Ecosyst. Environ. 2015, 203, 46–54. [Google Scholar] [CrossRef]
- Van Oort, P.A.J.; Wang, G.; Vos, J.; Meinke, H.; Li, B.G.; Huang, J.K.; van der Werf, W. Towards groundwater neutral cropping systems in the alluvial fans of the North China Plain. Agric. Water Manag. 2016, 165, 131–140. [Google Scholar] [CrossRef]
- An, P.; Ren, W.; Liu, X.; Song, M.; Li, X. Adjustment and optimization of the cropping systems under water constraint. Sustainability 2016, 8, 1207. [Google Scholar] [CrossRef]
- Kukal, M.S.; Irmak, S. Characterization of water use and productivity dynamics across four C3 and C4 row crops under optimal growth conditions. Agric. Water Manag. 2020, 227, 105840. [Google Scholar] [CrossRef]
- Yuan, Z.; Yan, D.H.; Yang, Z.Y.; Yin, J.; Breach, P.; Wang, D.Y. Impacts of climate change on winter wheat water requirement in Haihe River Basin. Mitig. Adapt. Strateg. Glob. Chang. 2016, 21, 677–697. [Google Scholar] [CrossRef]
- Sun, H.Y.; Liu, C.M.; Zhang, X.Y.; Shen, Y.J.; Zhang, Y.Q. Effects of irrigation on water balance, yield and WUE of winter wheat in the North China Plain. Agric. Water Manag. 2006, 85, 211–218. [Google Scholar] [CrossRef]
- Xiao, D.P.; Tao, F.L. Contributions of cultivars, management and climate change to winter wheat yield in the North China Plain in the past three decades. Eur. J. Agron. 2014, 52, 112–122. [Google Scholar] [CrossRef]
- Ju, X.T.; Kou, C.L.; Zhang, F.S.; Christie, P. Nitrogen balance and groundwater nitrate contamination: Comparison among three intensive cropping systems on the North China Plain. Environ. Pollut. 2006, 143, 117–125. [Google Scholar] [CrossRef] [PubMed] [Green Version]
- Guo, J.H.; Liu, X.J.; Zhang, Y.; Shen, J.L.; Han, W.X.; Zhang, W.F.; Christie, P.; Goulding, K.W.T.; Vitousek, P.M.; Zhang, F.S. Significant acidification in major Chinese croplands. Science 2010, 327, 1008–1010. [Google Scholar] [CrossRef]
- Schroder, J.L.; Zhang, H.; Girma, K.; Raun, W.R.; Penn, C.J.; Payton, M.E. Soil acidification from long-term use of nitrogen fertilizers on winter wheat. Soil Sci. Soc. Am. J. 2011, 75, 957–964. [Google Scholar] [CrossRef]
- Liu, C.; Wang, K.; Meng, S.; Zheng, X.; Zhou, Z.; Han, S.; Yang, Z. Effects of irrigation, fertilization and crop straw management on nitrous oxide and nitric oxide emissions from a wheat-maize rotation field in northern China. Agric. Ecosyst. Environ. 2011, 140, 226–233. [Google Scholar] [CrossRef]
- Cui, Z.L.; Chen, X.P.; Zhang, F.S. Current Nitrogen management status and measures to improve the intensive wheat-maize system in China. AMBIO 2010, 39, 376–384. [Google Scholar] [CrossRef]
- Liu, X.; Ju, X.; Zhang, F.; Pan, J.; Christie, P. Nitrogen dynamics and budgets in a winter wheat–maize cropping system in the North China Plain. Field Crops Res. 2003, 83, 111–124. [Google Scholar] [CrossRef]
- Kendy, E.; Zhang, Y.Q.; Liu, C.M.; Wang, J.X.; Steenhuis, T. Groundwater recharge from irrigated cropland in the North China Plain: Case study of Luancheng County, Hebei province, 1949–2000. Hydrol. Process. 2004, 18, 2289–2302. [Google Scholar] [CrossRef]
- Fang, Q.; Yu, Q.; Wang, E.; Chen, Y.; Zhang, G.; Wang, J.; Li, L. Soil nitrate accumulation, leaching and crop nitrogen use as influenced by fertilization and irrigation in an intensive wheat–maize double cropping system in the North China Plain. Plant Soil 2006, 284, 335–350. [Google Scholar] [CrossRef]
- Srivastava, P.; Singh, R.M. Optimization of cropping pattern in a canal command area using fuzzy programming approach. Water Resour. Manag. 2015, 29, 4481–4500. [Google Scholar] [CrossRef]
- Osama, S.; Elkholy, M.; Kansoh, R.M. Optimization of the cropping pattern in Egypt. Alex. Eng. J. 2017, 56, 557–566. [Google Scholar] [CrossRef]
- Craufurd, P.Q.; Vadez, V.; Jagadish, S.K.; Prasad, P.V.; Zaman, A.M. Crop science experiments designed to inform crop modeling. Agric. For. Meteorol. 2013, 170, 8–18. [Google Scholar] [CrossRef]
- Constantin, J.; Willaume, M.; Murgue, C.; Lacroix, B.; Therond, O. The soil-crop models STICS and AqYield predict yield and soil water content for irrigated crops equally well with limited data. Agric. For. Meteorol. 2015, 206, 55–68. [Google Scholar] [CrossRef]
- Yin, X.; van der Linden, C.G.; Struik, P.C. Bringing genetics and biochemistry to crop modelling, and vice versa. Eur. J. Agron. 2018, 100, 132–140. [Google Scholar] [CrossRef] [Green Version]
- Dourado, N.D.; Teruel, D.A.; Reichardt, K.; Nielsen, D.R.; Frizzone, J.A.; Bacchi, O.O.S. Principles of crop modeling and simulation: I. Uses of mathematical models in agricultural science. Sci. Agric. 1998, 55, 46–50. [Google Scholar] [CrossRef]
- Salo, T.J.; Palosuo, T.; Kersebaum, K.C.; Nendel, C.; Angulo, C.; Ewert, F.; Ferrise, R. Comparing the performance of 11 crop simulation models in predicting yield response to nitrogen fertilization. J. Agric. Sci. 2016, 154, 1218–1240. [Google Scholar] [CrossRef]
- Leng, G.; Hall, J. Crop yield sensitivity of global major agricultural countries to droughts and the projected changes in the future. Sci. Total Environ. 2018, 654, 811–821. [Google Scholar] [CrossRef]
- Liang, H.; Hu, K.; Batchelor, W.D.; Qi, Z.; Li, B. An integrated soil-crop system model for water and nitrogen management in North China. Sci. Rep. 2016, 6, 25755. [Google Scholar] [CrossRef] [Green Version]
- Li, Z.; Hu, K.; Li, B.; He, M.; Zhang, J. Evaluation of water and nitrogen use efficiencies in a double cropping system under different integrated management practices based on a model approach. Agric. Water Manag. 2015, 159, 19–34. [Google Scholar] [CrossRef]
- Xu, Q.; Li, Z.; Hu, K.; Li, B. Optimal management of water and nitrogen for farmland in North China Plain based on osculating value method and WHCNS model. Trans. Chin. Soc. Agric. Eng. 2017, 33, 152–158. [Google Scholar] [CrossRef]
- Zhang, H.; Hu, K.; Zhang, L.; Ji, Y.; Qin, W. Exploring optimal catch crops for reducing nitrate leaching in vegetable greenhouse in north China. Agric. Water Manag. 2019, 212, 273–282. [Google Scholar] [CrossRef]
- Xu, T.; Dengming, Y.; Baisha, W.; Wuxia, B.; Pierre, D.; Fang, L.Y.W.; Jun, M. The Effect evaluation of comprehensive treatment for groundwater overdraft in Quzhou county, china. Water 2018, 10, 874. [Google Scholar] [CrossRef]
- Cai, J.; Xia, X.; Chen, H.; Wang, T.; Zhang, H. Decomposition of fertilizer use intensity and its environmental risk in china’s grain production process. Sustainability 2018, 10, 498. [Google Scholar] [CrossRef]
- Du, L.; Xu, C.; Wu, Y.; Wang, M.; Chen, F. Water degradation footprint of crop production in Hebei province. J. Agro-Environ. Sci. 2018, 37, 286–293. [Google Scholar] [CrossRef]
- Yang, X.; Chen, Y.; Pacenka, S.; Gao, W.; Zhang, M.; Sui, P.; Steenhuis, T.S. Recharge and groundwater use in the North China Plain for six irrigated crops for an eleven year period. PLoS ONE 2015, 10, e0115269. [Google Scholar] [CrossRef] [PubMed]
- Chow, L.; Xing, Z.; Rees, H.; Meng, F.; Monteith, J.; Stevens, L. Field Performance of Nine Soil Water Content Sensors on a Sandy Loam Soil in New Brunswick, Maritime Region, Canada. Sensors 2009, 9, 9398–9413. [Google Scholar] [CrossRef]
- Liang, H.; Hu, K.; Qin, W.; Zuo, Q.; Zhang, Y. Modelling the effect of mulching on soil heat transfer, water movement and crop growth for ground cover rice production system. Field Crops Res. 2017, 201, 97–107. [Google Scholar] [CrossRef]
- Hussain, G.; Aljaloud, A.A.; Alshammary, S.F.; Karimulla, S. Effect of saline irrigation on the biomass yield and the protein, nitrogen, phosphorus and potassium composition of alfalfa in a pot experiment. J. Plant Nutr. 1995, 18, 2389–2408. [Google Scholar] [CrossRef]
- Siyal, A.A.; Mashori, A.S.; Bristow, K.L.; Van Genuchten, M.T. Alternate furrow irrigation can radically improve water productivity of okra. Agric. Water Manag. 2016, 173, 55–60. [Google Scholar] [CrossRef] [Green Version]
- Cai, J.; Liu, Y.; Lei, T.; Pereira, L.S. Estimating reference evapotranspiration with the FAO Penman-Monteith equation using daily weather forecast messages. Agric. For. Meteorol. 2007, 145, 22–35. [Google Scholar] [CrossRef]
- Allen, R.G.; Pereira, L.S.; Raes, D.; Smith, M. Crop Evapotranspiration-Guidelines for Computing Crop Water Requirements; FAO Irrigation and Drainage Paper 56; FAO: Rome, Italy, 1998. [Google Scholar]
- Green, W.H.; Ampt, G.A. Studies on soil physics: Part 1. The flow of air and water through soils. J. Agric. Sci. 1911, 4, 1–24. [Google Scholar]
- Richards, L.A. Capillary conduction of liquids through porous mediums. J. Appl. Phys. 1931, 1, 318–333. [Google Scholar] [CrossRef]
- Thomas, S. Introduction to climate modelling. In Advances in Geophysical and Environmental Mechanics and Mathematics, 1st ed.; Springer: Berlin/Heidelberg, Germany, 2011. [Google Scholar] [CrossRef]
- Driessen, P.M.; Konijn, N.T. Land-Use System Analysis; Wageningen Agricultural University: Wageningen, The Netherlands, 1992. [Google Scholar]
- Moriasi, D.N.; Arnold, J.G.; Van Liew, M.W.; Bingner, R.L.; Harmel, R.D.; Veith, T.L. Model evaluation guidelines for systematic quantification of accuracy in watershed simulations. Trans. ASABE 2007, 50, 885–900. [Google Scholar] [CrossRef]
- Nash, J.E.; Sutcliffe, J.V. River flow forecasting through conceptual models. Part I—A discussion of principles. J. Hydrol. 1970, 10, 282–290. [Google Scholar] [CrossRef]
- Willmott, C.J. On the validation of models. Phys. Geogr. 1981, 2, 184–194. [Google Scholar] [CrossRef]
- Mukaka, M.M. A guide to appropriate use of correlation coefficient in medical research. Malawi Med. J. 2012, 24, 69–71. [Google Scholar]
- Yang, Y.; Cui, Y.; Luo, Y.; Lyu, X.; Traore, S.; Khan, S.; Wang, W. Short term forecasting of daily reference evapotranspiration using the Penman-Monteith model and public weather forecasts. Agric. Water Manag. 2016, 177, 329–339. [Google Scholar] [CrossRef]
- Fang, Q.; Ma, L.; Yu, Q.; Malone, R.W.; Saseendran, S.A.; Ahuja, L.R. Modeling nitrogen and water management effects in a wheat-maize double-cropping system. J. Environ. Qual. 2008, 37, 2232–2242. [Google Scholar] [CrossRef]
- Hu, K.; Li, Y.; Chen, W.; Chen, D.; Wei, Y.; Edis, R.; Zhang, Y. Modeling nitrate leaching and optimizing water and nitrogen management under irrigated maize in desert oases in Northwestern China. J. Environ. Qual. 2010, 39, 667–677. [Google Scholar] [CrossRef]
- Liang, H.; Qi, Z.; Hu, K.; Li, B.; Prasher, S.O. Modelling subsurface drainage and nitrogen losses from artificially drained cropland using coupled DRAINMOD and WHCNS models. Agric. Water Manag. 2018, 195, 201–210. [Google Scholar] [CrossRef]
- Liang, H.; Hu, K.; Qin, W.; Zuo, Q.; Guo, L.; Tao, Y.; Lin, S. Ground cover rice production system reduces water consumption and nitrogen loss and increases water and nitrogen use efficiencies. Field Crops Res. 2019, 233, 70–79. [Google Scholar] [CrossRef]
- He, Y.; Liang, H.; Hu, K.; Wang, H.; Hou, L. Modeling nitrogen leaching in a spring maize system under changing climate and genotype scenarios in arid Inner Mongolia, China. Agric. Water Manag. 2018, 210, 316–323. [Google Scholar] [CrossRef]
- Wang, H.; Tong, W.; Zhao, X.; Wang, Z. Optimum management of water and fertilizer for potato in soft rock and sand compound soil based on WHCNS model: Scenario prediction. IOP Conf. Series: Earth and Environmental Sci. 2018, 170, 022171. [Google Scholar] [CrossRef]
- Jego, G.; Anchez, P.; Jose, M.; Justes, E. Predicting soil water and mineral nitrogen contents with the STICS model for estimating nitrate leaching under agricultural fields. Agric. Water Manag. 2012, 107, 54–65. [Google Scholar] [CrossRef] [Green Version]
- Zhang, X.; Qin, W.; Chen, S.; Shao, L.; Sun, H. Responses of yield and WUE of winter wheat to water stress during the past three decades: A case study in the North China Plain. Agric. Water Manag. 2017, 179, 47–54. [Google Scholar] [CrossRef]
- Umair, M.; Shen, Y.; Qi, Y.; Zhang, Y.; Ahmad, A.; Pei, H.; Liu, M. Evaluation of the CropSyst Model during Wheat-Maize Rotations on the North China Plain for Identifying Soil Evaporation Losses. Front. Plant Sci. 2017, 8, 1667. [Google Scholar] [CrossRef]
- Chu, Y.; Shen, Y.; Yuan, Z. Water footprint of crop production for different crop structures in the Hebei southern plain, North China. Hydrol. Earth Syst. Sci. 2017, 21, 3061–3069. [Google Scholar] [CrossRef] [Green Version]
- Sidhu, H.S.; Jat, M.L.; Singh, Y.; Sidhu, R.K.; Gupta, N.; Singh, P.; Gerard, B. Sub-surface drip fertigation with conservation agriculture in a rice-wheat system: A breakthrough for addressing water and nitrogen use efficiency. Agric. Water Manag. 2019, 216, 273–283. [Google Scholar] [CrossRef]
- Li, Q.; Bian, C.; Liu, X.; Ma, C.; Liu, Q. Winter wheat grain yield and water use efficiency in wide-precision planting pattern under deficit irrigation in North China Plain. Agric. Water Manag. 2015, 153, 71–76. [Google Scholar] [CrossRef]
- Guan, D.; Zhang, Y.; Al-Kaisi, M.M.; Wang, Q.; Zhang, M.; Li, Z. Tillage practices effect on root distribution and water use efficiency of winter wheat under rain-fed condition in the North China Plain. Soil Tillage Res. 2015, 146, 286–295. [Google Scholar] [CrossRef]
- Meng, Q.; Wang, H.; Yan, P.; Pan, J.; Lu, D.; Cui, Z.; Chen, X. Designing a new cropping system for high productivity and sustainable water usage under climate change. Sci. Rep. 2017, 7, 41587. [Google Scholar] [CrossRef] [PubMed]
- Sun, H.; Zhang, X.; Liu, X.; Liu, X.; Shao, L.; Chen, S.; Dong, X. Impact of different cropping systems and irrigation schedules on evapotranspiration, grain yield and groundwater level in the North China Plain. Agric. Water Manag. 2019, 211, 202–209. [Google Scholar] [CrossRef]
- Zhang, Y.; Wang, H.; Lei, Q.; Luo, J.; Lindsey, S.; Zhang, J.; Ren, T. Optimizing the nitrogen application rate for maize and wheat based on yield and environment on the Northern China Plain. Sci. Total Environ. 2018, 618, 1173–1183. [Google Scholar] [CrossRef]
- Dinnes, D.L.; Karlen, D.L.; Jaynes, D.B.; Kaspar, T.C.; Hatfield, J.L.; Colvin, T.S.; Cambardella, C.A. Nitrogen management strategies to reduce nitrate leaching in tile-drained Midwestern soils. Agron. J. 2002, 94, 153–171. [Google Scholar] [CrossRef]
- Watts, J. Chinese farms causes more pollution than factories, says official survey. The Guardian. 13 September 2010. Available online: https://www.theguardian.com/environment/2010/feb/09/china-farms-pollution (accessed on 20 June 2019).
- Ju, X.T.; Xing, G.X.; Chen, X.P.; Zhang, S.L.; Zhang, L.J.; Liu, X.J.; Zhang, F.S. Reducing environmental risk by improving N management in intensive Chinese agricultural systems. Proc. Natl. Acad. Sci. USA 2009, 106, 3041–3046. [Google Scholar] [CrossRef] [Green Version]
- Ji, B.; Yang, K.; Zhu, L.; Jiang, Y.; Wang, H.; Zhou, J.; Zhang, H. Aerobic denitrification: A review of important advances of the last 30 years. Biotechnol. Bioprocess Eng. 2015, 20, 643–651. [Google Scholar] [CrossRef]
- Cao, B.; He, F.Y.; Xu, Q.M.; Yin, B.; Cai, G.-X. Denitrification losses and N2O emissions from nitrogen fertilizer applied to a vegetable field. Pedosph 2006, 16, 390–397. [Google Scholar] [CrossRef]
- Leghari, S.J.; Wahocho, N.A.; Laghari, G.M.; Laghari, A.H.; Mustafa, B.G.; Hussain, T.K.; Lashari, A.A. Role of nitrogen for plant growth and development: A review. Adv. Environ. Biol. 2016, 10, 209–219. [Google Scholar]
- Ju, X.T.; Liu, X.J.; Zhang, F.S. Soil nitrogen mineralization and its prediction in winter wheat-summer maize rotation system. Chin. J. Appl. Ecol. 2003, 14, 2241–2245. [Google Scholar]
- Zhao, Z.; Qin, X.; Wang, Z.; Wang, E. Performance of different cropping systems across precipitation gradient in North China Plain. Agric. For. Meteorol. 2018, 259, 162–172. [Google Scholar] [CrossRef]
- Luo, J.; Shen, Y.; Qi, Y.; Zhang, Y.; Xiao, D. Evaluating water conservation effects due to cropping system optimization on the Beijing-Tianjin-Hebei plain, China. Agric. Syst. 2018, 159, 32–41. [Google Scholar] [CrossRef]
- Xiao, G.; Zhao, Z.; Liang, L.; Meng, F.; Wu, W.; Guo, Y. Improving nitrogen and water use efficiency in a wheat-maize rotation system in the North China Plain using optimized farming practices. Agric. Water Manag. 2019, 212, 172–180. [Google Scholar] [CrossRef]
Figure 1.
WHCNS model simulated (line) and observed (dots) soil water content (SWC, cm3 cm−3) and soil mineral N concentration (SNC, mg kg−1) of different cropping systems. (a), Two harvests in 1 year based on farmer (2H1Y)FP, (b), Optimized practices (2H1Y)OPT, (c), Three harvests in 2 years (3H2Y), and (d), One harvest in 1 year (1H1Y).

Figure 2.
Simulated (black bars) and observed (gray bars) grain yield and dray matter of different cropping systems. (a), two harvests in 1 year based on farmer (2H1Y)FP and (b), optimized practices (2H1Y)OPT, (c), three harvests in 2 years (3H2Y), and (d), one harvest in 1 year (1H1Y). WW, Winter wheat, SM, Summer maize and SPM, Spring maize.

Figure 3.
Relationship between simulated and observed soil water content (SWC, cm3 cm–3), soil mineral concentration (SNC, mg kg–1), leaf area index (LAI, m2 m–2) and grain yield (GY, kg ha–1) under different cropping systems.
Figure 3.
Relationship between simulated and observed soil water content (SWC, cm3 cm–3), soil mineral concentration (SNC, mg kg–1), leaf area index (LAI, m2 m–2) and grain yield (GY, kg ha–1) under different cropping systems.

Figure 4.
Scenarios based simulated grain yield (a), N use efficiency (b), and water use efficiency (c) under effect of deficit and excessive irrigation levels, and N rates. WW, winter wheat, SM, summer maize, SPM, spring maize.
Figure 4.
Scenarios based simulated grain yield (a), N use efficiency (b), and water use efficiency (c) under effect of deficit and excessive irrigation levels, and N rates. WW, winter wheat, SM, summer maize, SPM, spring maize.


Figure 5.
Simulated nitrate leaching (a–c) and drainage (d) under effect of excessive and deficit irrigation levels, and N rates. The boxes show the 25 50 and 75 percentiles, the line in the box indicates the median, black dots show mean, and the crosses indicate maximum and minimum. WW, winter wheat, SM, summer maize and SPM, spring maize.


Table 1.
Basic soil properties at different depths.
| Depth (cm) | BD (g cm–3) | Particle Fraction (%) | Soil Texture (USDA) | pH | θs (cm3 cm–3) | θfc (cm3 cm–3) | θwp (cm3 cm–3) | Ks (cm d–1) | ||
|---|---|---|---|---|---|---|---|---|---|---|
| Sand | Silt | Clay | ||||||||
| 0–30 | 1.42 | 33.1 | 46.6 | 20.3 | loamy | 8.4 | 0.47 | 0.275 | 0.125 | 17.27 |
| 30–60 | 1.42 | 24.4 | 53.1 | 22.5 | Silty loam | 8.7 | 0.39 | 0.295 | 0.132 | 15.88 |
| 60–90 | 1.33 | 29.6 | 45.5 | 24.9 | Loamy | 8.5 | 0.38 | 0.295 | 0.143 | 18.23 |
| 90–120 | 1.51 | 36.4 | 47.4 | 16.2 | Loamy | 8.6 | 0.39 | 0.260 | 0.111 | 5.11 |
Note: BD, Bulk density, θs, Soil saturated water content, θfc, Field capacity, θwp, Soil water content permanent wilting point and Ks, Saturated hydraulic conductivity.
Table 2.
Scenarios setting based on irrigation and N fertilizer management.
| Irrigation (mm ha–1) | Fertilization (kg N ha–1) | ||||||||||||
|---|---|---|---|---|---|---|---|---|---|---|---|---|---|
| I | WW | Dist | SM | Dist | SPM | Dist | F | WW | Splits | SM | Splits | SPM | Splits |
| I1 | 450 | 5 | 400 | 5 | 350 | 5 | F1 | 400 | 4 | 350 | 4 | 300 | 4 |
| I2 | 400 | 5 | 350 | 5 | 300 | 5 | F2 | 350 | 4 | 300 | 4 | 250 | 4 |
| I3 | 350 | 5 | 300 | 5 | 250 | 4 | F3 | 300 | 4 | 250 | 4 | 200 | 4 |
| I4 | 300 | 5 | 250 | 4 | 200 | 4 | F4 | 250 | 3 | 200 | 3 | 150 | 3 |
| I5 | 250 | 4 | 200 | 4 | 150 | 4 | F5 | 200 | 3 | 150 | 3 | 100 | 3 |
| I6 | 200 | 4 | 150 | 3 | 100 | 3 | F6 | 150 | 3 | 100 | 3 | 50 | 2 |
| I7 | 150 | 3 | 100 | 3 | 50 | 2 | F7 | 100 | 2 | 50 | 2 | – | – |
| I8 | 100 | 2 | 50 | 1 | 0 | – | F8 | 50 | 2 | – | – | – | – |
| I9 | 50 | 1 | 0 | – | – | – | – | – | – | – | – | – | – |
| I10 | 0 | – | – | – | – | – | – | – | – | – | – | – | – |
Note: WW, Winter wheat, SM, Summer maize, SPM, Spring maize, I, Irrigations, F, Fertilizers, Dist, Distribution of total irrigation amount into frequencies and Splits, Division of total N into a number of doses.
Table 3.
Crop parameters.
| Parameters | Description | Crops | ||
|---|---|---|---|---|
| WW | SM | SPM | ||
| Tbase | Base temperature for crop growth (°C) | 0 | 8 | 8 |
| Tsum | Effective accumulated temperature (°C) | 2100 | 1650 | 2250 |
| Ke | Extinction coefficient (0–1) | 0.6 | 0.6 | 0.6 |
| Kc_ini | Crop coefficients in initial stage (0–1) | 0.65 | 0.65 | 0.65 |
| Kc_mid | Crop coefficients in middle stage (0–1) | 1.25 | 1.35 | 1.25 |
| Kc_end | Crop coefficients in final stage (0–1) | 0.45 | 0.8 | 0.8 |
| SLA_max | Maximum specific leaf area (m2 kg–1) | 28 | 32 | 28 |
| SLA_min | Minimum specific leaf area (m2 kg–1) | 16 | 15 | 13 |
| AMAX | Maximal assimilation rate (kg ha–1 h–1) | 45 | 60 | 50 |
| R_max | Maximal rooting depth (cm) | 160 | 145 | 145 |
Note: WW, Winter wheat, SM, Summer maize, SPM, Spring maize.
Table 4.
Statistical indices of WHCNS model accuracy for soil water content, soil mineral N concentrations, leaf area index, crop dry matter and yield of all cropping systems.
Table 4.
Statistical indices of WHCNS model accuracy for soil water content, soil mineral N concentrations, leaf area index, crop dry matter and yield of all cropping systems.
| Cropping systems | Soil and Crop Indicators | |||||||||||||||||||
|---|---|---|---|---|---|---|---|---|---|---|---|---|---|---|---|---|---|---|---|---|
| Soil Water Content (cm3 cm−3) | ||||||||||||||||||||
| 0–30 cm | 30–60 cm | 60–90 cm | 90–120 cm | |||||||||||||||||
| RMSE | NSE | d | r | RMSE | NSE | d | r | RMSE | NSE | d | r | RMSE | NSE | d | r | |||||
| (2H1Y)FP | 0.07 | 0.92 | 0.99 | 0.53 | 0.04 | 0.96 | 0.96 | 0.70 | 0.05 | 0.96 | 0.97 | 0.64 | 0.07 | 0.98 | 0.98 | 0.57 | ||||
| (2H1Y)OPT | 0.08 | 0.96 | 0.95 | 0.60 | 0.09 | 0.92 | 0.97 | 0.54 | 0.06 | 0.98 | 0.99 | 0.52 | 0.05 | 0.97 | 0.99 | 0.60 | ||||
| (3H2Y) | 0.07 | 0.91 | 0.96 | 0.63 | 0.05 | 0.92 | 0.94 | 0.67 | 0.05 | 0.95 | 0.96 | 0.56 | 0.04 | 0.95 | 0.92 | 0.58 | ||||
| (1H1Y) | 0.06 | 0.96 | 0.98 | 0.55 | 0.07 | 0.91 | 0.95 | 0.52 | 0.06 | 0.91 | 0.95 | 0.76 | 0.05 | 0.96 | 0.93 | 0.53 | ||||
| Soil Nitrogen Concentration (mg kg-1) | ||||||||||||||||||||
| 0–30 cm | 30–60 cm | 60–90 cm | ||||||||||||||||||
| RMSE | NSE | d | r | RMSE | NSE | d | r | RMSE | NSE | d | r | |||||||||
| (2H1YFP) | 5.41 | 0.76 | 0.97 | 0.70 | 3.67 | 0.75 | 0.97 | 0.79 | 2.98 | 0.68 | 0.98 | 0.84 | ||||||||
| (2H1Y)OPT | 7.43 | 0.73 | 0.98 | 0.75 | 4.89 | 0.65 | 0.97 | 0.72 | 3.87 | 0.83 | 0.96 | 0.85 | ||||||||
| (3H2Y) | 6.64 | 0.62 | 0.98 | 0.66 | 4.26 | 0.85 | 0.98 | 0.86 | 3.67 | 0.55 | 0.99 | 0.88 | ||||||||
| (1H1Y) | 5.60 | 0.87 | 0.87 | 0.75 | 3.58 | 0.73 | 0.91 | 0.61 | 2.10 | 0.86 | 0.93 | 0.83 | ||||||||
| Leaf Area Index (m2 m−2) | Dry Matter (kg ha−1) | Grain Yield (kg ha−1) | ||||||||||||||||||
| RMSE | NSE | d | r | RMSE | NSE | d | r | RMSE | NSE | d | r | |||||||||
| (2H1Y)FP | 0.55 | 0.96 | 0.94 | 0.90 | 1326.9 | 0.92 | 0.93 | 0.96 | 280.91 | 0.99 | 0.90 | 0.98 | ||||||||
| (2H1Y)OPT | 0.49 | 0.94 | 0.95 | 0.89 | 1534.6 | 0.95 | 0.92 | 0.94 | 609.96 | 0.98 | 0.92 | |||||||||
| (3H2Y) | 0.51 | 0.95 | 0.96 | 0.94 | 1608.3 | 0.97 | 0.96 | 0.97 | 380.03 | 0.99 | 0.99 | |||||||||
| (1H1Y) | 0.81 | 0.92 | 0.94 | 0.94 | 1493.8 | 0.97 | 0.95 | 0.99 | 290.31 | 0.99 | −1.0 | |||||||||
Note: (2H1Y)FP, Tow harvests in 1 year based on farmer practices, (2H1Y)OPT, Two harvests in 1 year based optimized, (3H2Y), Three harvests in 2 years, and (1H1Y), One harvest in 1 year.
Table 5.
Water balance summary of different cropping systems.
| Cropping Systems | Rotations | Ir (mm) | Pr (mm) | Eta (mm) | D (mm) | R (mm) | Wbal (mm) | WUE (kg m-3) |
|---|---|---|---|---|---|---|---|---|
| (2H1Y)FP | WW | 240 | 109 | 328 | 13 | 0 | 8 | 1.6 |
| SM | 75 | 224 | 287 | 33 | 21 | −42 | 2.0 | |
| WW | 315 | 223 | 345 | 17 | 6 | 170 | 1.3 | |
| SM | 115 | 569 | 320 | 180 | 255 | −71 | 2.1 | |
| (2H1Y)OPT | WW | 180 | 109 | 302 | 7 | 0 | −20 | 1.6 |
| SM | 75 | 224 | 286 | 7 | 21 | −1.5 | 2.1 | |
| WW | 240 | 223 | 331 | 7 | 6 | 119 | 1.4 | |
| SM | 115 | 569 | 320 | 133 | 251 | −20 | 2.4 | |
| (3H2Y) | WW | 180 | 109 | 302 | 7 | 0 | −20 | 1.9 |
| SM | 75 | 224 | 285 | 8 | 21 | −1 5 | 1.7 | |
| WW | 183 | 633 | 426 | 98 | 245 | 47 | 1.7 | |
| (1H1Y) | SPM | 243 | 276 | 389 | 7 | 20 | 103 | 2.1 |
| SPM | 80 | 638 | 423 | 106 | 245 | −56 | 2.1 |
Note: Ir, Irrigation, Pr, Precipitation, Eta, Actual evapotranspiration, D, Drainage, R, Runoff, Wbal, Water balance and WUE, Water use efficiency.
Table 6.
N balance summary of different cropping systems.
| Cropping Systems | Rotations | Nfer | Nmin | Nvol | Nden | Nlea | Nup | Nbal | NUE |
|---|---|---|---|---|---|---|---|---|---|
| (kg ha–1) | (kg kg−1) | ||||||||
| (2H1Y)FP | WW | 300 | –8 | 30 | 2 | 2 | 144 | 114 | 28.9 |
| SM | 250 | –4 | 47 | 2 | 10 | 215 | −28 | 21.3 | |
| WW | 300 | –3 | 26 | 2 | 6 | 146 | 117 | 24.7 | |
| SM | 250 | –6 | 55 | 4 | 79 | 232 | −1.26 | 18.3 | |
| (2H1Y)OPT | WW | 120 | 11 | 2 | 9 | 1 | 134 | −1.4 | 34.1 |
| SM | 75 | 36 | 6 | 9 | 1 | 172 | −77 | 31.3 | |
| WW | 145 | 79 | 13 | 11 | 0 | 129 | 71 | 29.3 | |
| SM | 80 | 84 | 33 | 14 | 19 | 219 | −1.21 | 26.9 | |
| (3H2Y) | WW | 120 | 11 | 2 | 9 | 0.5 | 137 | −1.8 | 38.3 |
| SM | 75 | 37 | 7 | 9 | 1.3 | 169 | −74 | 26.5 | |
| WW | 130 | 100 | 25 | 10 | 3.0 | 227 | −35 | 27.2 | |
| (1H1Y) | SPM | 75 | 7 | 3 | 1 | 0.3 | 216 | −1.38 | 37.8 |
| SPM | 130 | 117 | 24 | 12 | 5.8 | 234 | −29 | 31.8 | |
Note: Nfer, Fertilization, Nmin, Net mineralization, Nvol, Ammonia volatilization, Nden, Denitrification, Nlea, N leaching, Nup, Crop N uptake, Nbal, Nitrogen balance and NUE, Nitrogen use efficiency.
© 2019 by the authors. Licensee MDPI, Basel, Switzerland. This article is an open access article distributed under the terms and conditions of the Creative Commons Attribution (CC BY) license (http://creativecommons.org/licenses/by/4.0/).
Share and Cite
MDPI and ACS Style
Leghari, S.J.; Hu, K.; Liang, H.; Wei, Y. Modeling Water and Nitrogen Balance of Different Cropping Systems in the North China Plain. Agronomy 2019, 9, 696. https://0-doi-org.brum.beds.ac.uk/10.3390/agronomy9110696
AMA Style
Leghari SJ, Hu K, Liang H, Wei Y. Modeling Water and Nitrogen Balance of Different Cropping Systems in the North China Plain. Agronomy. 2019; 9(11):696. https://0-doi-org.brum.beds.ac.uk/10.3390/agronomy9110696
Chicago/Turabian StyleLeghari, Shah Jahan, Kelin Hu, Hao Liang, and Yichang Wei. 2019. "Modeling Water and Nitrogen Balance of Different Cropping Systems in the North China Plain" Agronomy 9, no. 11: 696. https://0-doi-org.brum.beds.ac.uk/10.3390/agronomy9110696
Note that from the first issue of 2016, this journal uses article numbers instead of page numbers. See further details here.