Optimization of Germination Inhibitors Elimination from Sugar Beet (Beta vulgaris L.) Seeds of Different Maturity Classes


Department of Agroecology, Aarhus University, Forsøgsvej 1, 4200 Slagelse, Denmark
*
Author to whom correspondence should be addressed.
Agronomy 2019, 9(11), 763; https://0-doi-org.brum.beds.ac.uk/10.3390/agronomy9110763
Submission received: 18 October 2019
/
Revised: 7 November 2019
/
Accepted: 14 November 2019
/
Published: 16 November 2019
(This article belongs to the Section Crop Breeding and Genetics)
Abstract
:Endogenous inhibitors have a crucial effect on the success of sugar beet (Beta vulgaris) seed germination. The strength of this effect changes during seed maturation, and washing away these inhibitors can facilitate germination. Investigation of various washing factors such as water-to-seed ratio, stirring time, and speed of stirring on a mixed-maturity lot of sugar beet seeds revealed the significant effect of the interaction of all factors. Seeds with different maturity classes, from the same lot, were washed using procedures determined from the first experiment. Statistical analysis of the germination data of the washed seeds showed a significant difference in mean germination time depending on maturity class. Washing seeds of different maturity classes with 40 mL of water per gram of seed improved the germination performance of maturity classes 2 and 5, compared with 20 mL water per gram of seed. The UV absorbance of inhibitors washed from seeds differed between maturity classes. The change in seed moisture content during the washing process is another factor altered by the extent of seed development, and this variation in water uptake may reflect the pericarp structure of seed in different maturity classes. The findings in this manuscript highlight the importance of optimizing the pre-treatment procedures in accordance with the individual seed lot.
1. Introduction
Sugar beet (Beta vulgaris L.) seed is an achene, which is a small, single-seeded, dry indehiscent fruit. In this dispersal unit, the “true seed” is enclosed in a bulky pericarp. Dead perianth tissue is associated with pericarp [1,2]. In sugar beet, the perianth is partially lignified, although the proportion of precursors (phenols) of lignin biosynthesis varies among different maturity classes [3]. Due to the indeterminate flowering pattern in sugar beet, there is insufficient time for all seeds to develop fully. At harvest time, seeds will therefore be at different maturity levels [4].
An immature sugar beet seed contains a partially shrunken seed and some empty space in the cavity. The direct effect of these underdeveloped seeds on the germination potential of the seed lot has been demonstrated in various investigations [4,5,6,7]. The undesirable effect of immature seeds on the germination performance may be due to various characteristics of immature seeds, such as a high level of toxic substances, undeveloped embryo or a not fully structured pericarp. Identification of these seeds is very important for the improvement of the germination performance [3,8].
However, visible detection of underdeveloped seeds from good, fully filled ones is demanding [4] and requires advanced methods of investigation such as multispectral imaging, which enables the classification of different maturity levels. This machine vision technique for seed quality assessment is fast, nondestructive, and does not require any sample preparation [9].
Developmental variance among seed can affect the performance during germination [10]. Production of toxic substances is one of the most important causes that can inhibit the physiological process of germination [11]. Germination inhibitor is a general term referring to toxic substances produced by the plant, as well as substances with related structures that are not found in the plants. These chemicals inhibit or delay the germination process of the seeds in either the same species or others [8,11,12]. This inhibitory action can be through an osmotic effect, liberation of toxic chemicals, or limitation of the oxygen supply [1,11,12,13,14]. The amount of these toxic substances decreases with time until to harvest.
Since the early 1940s, different types of aqueous extracts of beet fruits or leaves have been known as seed germination inhibitors [15,16]. Different chemicals to varying degrees have been put forward as the reason for inhibition of the germination process not only between varieties but also in the same seed lot, such as ammonia, an unsaturated yellow oil, or phenolic compounds [14,16,17,18]. In general, these toxic substances can be located in different parts of the fruit (pulp, juice, or coat) or seed (coat, endosperm, or embryo), depending on the species [11]. The operculum and pericarp are the candidate locations of these toxic substances in beets [13,14,15,18,19,20,21].
Among various candidates for this inhibitory reaction, phenolic compounds have received the most attention [3,16,17]. Phenols are the major class of secondary compounds in terrestrial vascular plants [22]. Phenolic compounds or their derivatives are known as seed germination inhibitors [23]. Some phenolic compounds are intermediates in lignin biosynthesis, which happens in the perianth lignification process [3]. These compounds can be investigated by different methods, including HPLC, LC-MS, ultraviolet absorption [22,24]. Analyzing the UV-visible absorbance spectrum of beet seed steeping solutions is a reliable way to detect differences among different groups of seeds [17]. UV spectroscopy can be applied in quantitative determination of organic compounds such as phenols and pericarp water-soluble phenols should be traceable between 250 and 270 nm [13,25].
Tolman and Stout [18] reported that maturity is one of the important factors affecting the amount of toxic substances in seeds. Among these substances, phenols can cause oxygen limitation and hypoxia, affecting the germination performance of seeds by depriving the embryo of access to the proper amount of oxygen. Phenols are chemically active and are easily oxidized [26]. The effect of these chemicals is in addition to osmotic properties, caused by salt crystals present in the pericarp [11,12,14,18,21]. Salt crystals in the pericarp can restrict the seed water and oxygen uptake [21]. However, the possibility of severe effects from the high osmotic value is low, due to the halophytic characteristic of sugar beet [12].
Botanical seed characteristics determine sugar beet seed features. The pericarp is an influential part, the structure of which varies during development [21]. There is some evidence that water absorption by seeds differs due to maturity class, and this can in turn affect the germination potential [13]. Furthermore, pericarp characteristics can be influenced by washing seeds. Washing is the process of leaching out the inhibitors by use of water. Changing the pericarp water potential and seed moisture content are two possible effects of the washing treatment. However, the initial seed quality and germination potential indicate the efficiency of treatment to assist the woody sugar beet seed in absorbing water, leaching out toxic substances and promoting physiological processes resulting in uniform and fast germination [21,27,28].
Despite the importance of the maturity level of the harvested seed, information about how treatments that improve quality should be tailored to account for the seed maturity level is currently lacking. Therefore, many seeds of low germination potential are currently discarded, although a simple pre-germination treatment could improve their performance. Different factors can influence the success rate of the pre-germination treatment and need to be adjusted for each seed lot. The aim of this study was to identify the difference in the level of inhibitors in seeds of distinct maturity class and determine the optimum combination of affecting factors for improving the germination performance in each class.
2. Materials and Methods
MariboHilleshög, Holeby, Denmark provided the seed lot, which was produced in Italy and commercially standardized through post-harvest processing (cleaning and polishing). The seed lot was divided into two parts: (A) a basic sample, which consisted of seeds of various developmental stages and hence mixed maturity, and (B) a sorted sample, in which the seeds had been classified by their maturity level. Sorting was done with a chlorophyll seed analyzer, which allows seed classification according to their chlorophyll fluorescence (CF) levels. The CF range for each class was: class 1 (>3000 pA), class 2 (1500–3000 pA), class 3 (750–1500 pA), class 4 (250–750 pA), and class 5 (110–250 pA). The standard germination of the basic sample was 96%.
2.1. Mixed Maturity Sample
The effect of three factors involved in seed washing on the germination performance of seeds in the basic sample was examined. Duration of washing (1, 2, or 4 h), water-to-seed ratio (10, 20, or 40 mL of sterile distilled water per gram of seed), and the stirring speed (100, 200, or 400 rpm) were the examined factors in this experiment.
After the washing treatment, the seeds were dried back overnight under the half flow of laminar. The following day, seeds were surface-sterilized with 1.2% sodium hypochlorite solution for 1 min and rinsed 3 times for 1 min with sterile distilled water prior to the germination test. For the germination test, 100 seeds were divided into four sets of 25, with each set in one petri dish containing blue germination paper moistened with 5 mL of sterile distilled water. The blue germination paper allows easy detection of radicle protrusion. The petri dishes were sealed with parafilm to keep the moisture, germination conditions were set as recommended by ISTA [29]. Germination was registered, when radicle was ≥ 2 mm.
2.2. Distinct Maturity Classes
From the sorted sample, seeds of each maturity class were weighed prior to the start of the experiment. Further, with the aim of visualizing the maturity classes and the associated differences in pericarp development, multispectral images (MSI) were acquired using a VideometerLab 3 imaging system (Videometer A/S) and analyzed with the related software. The normalized Canonical Discriminant Analysis (nCDA) transformation model was calculated for seeds in each maturity class. This method was applied on the pixel level in order to achieve the optimal band normalization and be able to classify the studied seeds in distinct classes.
Based on the information from the evaluation of the basic sample, the speed of stirring and the duration of washing were kept constant. The effect of two water-to-seed ratios were selected for evaluation of washing efficiency on the germination performance of seeds of different maturity classes. Thus, seeds of each maturity class were washed with either 20 or 40 mL sterile distilled water per gram of seed for 4 h at a stirring speed of 400 rpm.
After the washing experiment of seeds of distinct maturity class, one mL of steeping solution of each maturity class was transferred to a quartz cuvette (12.5 × 12.5 × 45 mm) to record the UV spectrum of the sample using a Shimadzu UV-2700 spectrophotometer. Full absorbance spectra of the steeping solution and the absorbance at 260 nm was extracted for each treatment.
The increase in seed moisture content during each washing treatment was evaluated to determine the relation between the maturity class and water uptake. The moisture variation (%) among seeds with different developmental stages was calculated using Equation (1):
M = ((M1 − M0)/M1) × 100
M is the calculated moisture variation, M1 is the seed weight after washing, M0 is the dry weight before washing, adjusted for the initial moisture content. The outcome of this calculation is shown in Table 1 with color coding. The intensity of cell color increases with the percentage of seed moisture.
Germination tests were performed and registered as described in Section 2.1.
Statistical analysis was carried out in R version 3.4.2 [30]. Linear models were constructed with (1). Mean germination time (MGT) as a function of duration of washing (T), water-to-seed ratio (R) and stirring speed (S), and (2). MGT as a function of seed maturity level (M) and water-to-seed ratio (R). Significant factors were determined by ANOVA and significant differences between treatment groups were determined by a Tukey’s HSD test.
3. Results
3.1. Mixed Maturity Sample
After washing seeds of the basic sample with different combinations of washing duration, water-to-seed ratio and speed of stirring, the germination rate was recorded every day for 14 days. Statistical analysis of MGT of all treatments showed a significant interaction between the three factors. The heat map visualizing the interaction of factors’ effect on sugar beet seed performance is shown in Table 1. Color-coded cells in the map show the MGT, with the intensity of color proportional to the MGT, which is a measure of lower germination rate.
In general, longer duration of the washing process correlated with lower color intensity. The lowest MGT was in response to 10- and 40-mL application of water per gram of seed and 4 h stirring at 400 rpm. However, the difference was not so pronounced compared to the other proportion (20 mL). In applying a low proportion of water (10 mL), the combination of stirring speed and duration of experiment plays a notable role. When the speed is high (400 rpm), a longer duration (4 h) of washing is required to obtain a lower MGT. However, shorter time (1 h) could be considered at the lower stirring speed (100 rpm).
When washing seeds with 20 mL or 40 mL of water per gram of seeds, the longer duration of the experiment showed the lowest MGT at all stirring speeds tested. These results were more pronounced at lower stirring speeds. Overall, a longer duration of washing (4 h) combined with high speed (400 rpm) showed the lowest MGT.
3.2. Distinct Maturity Classes
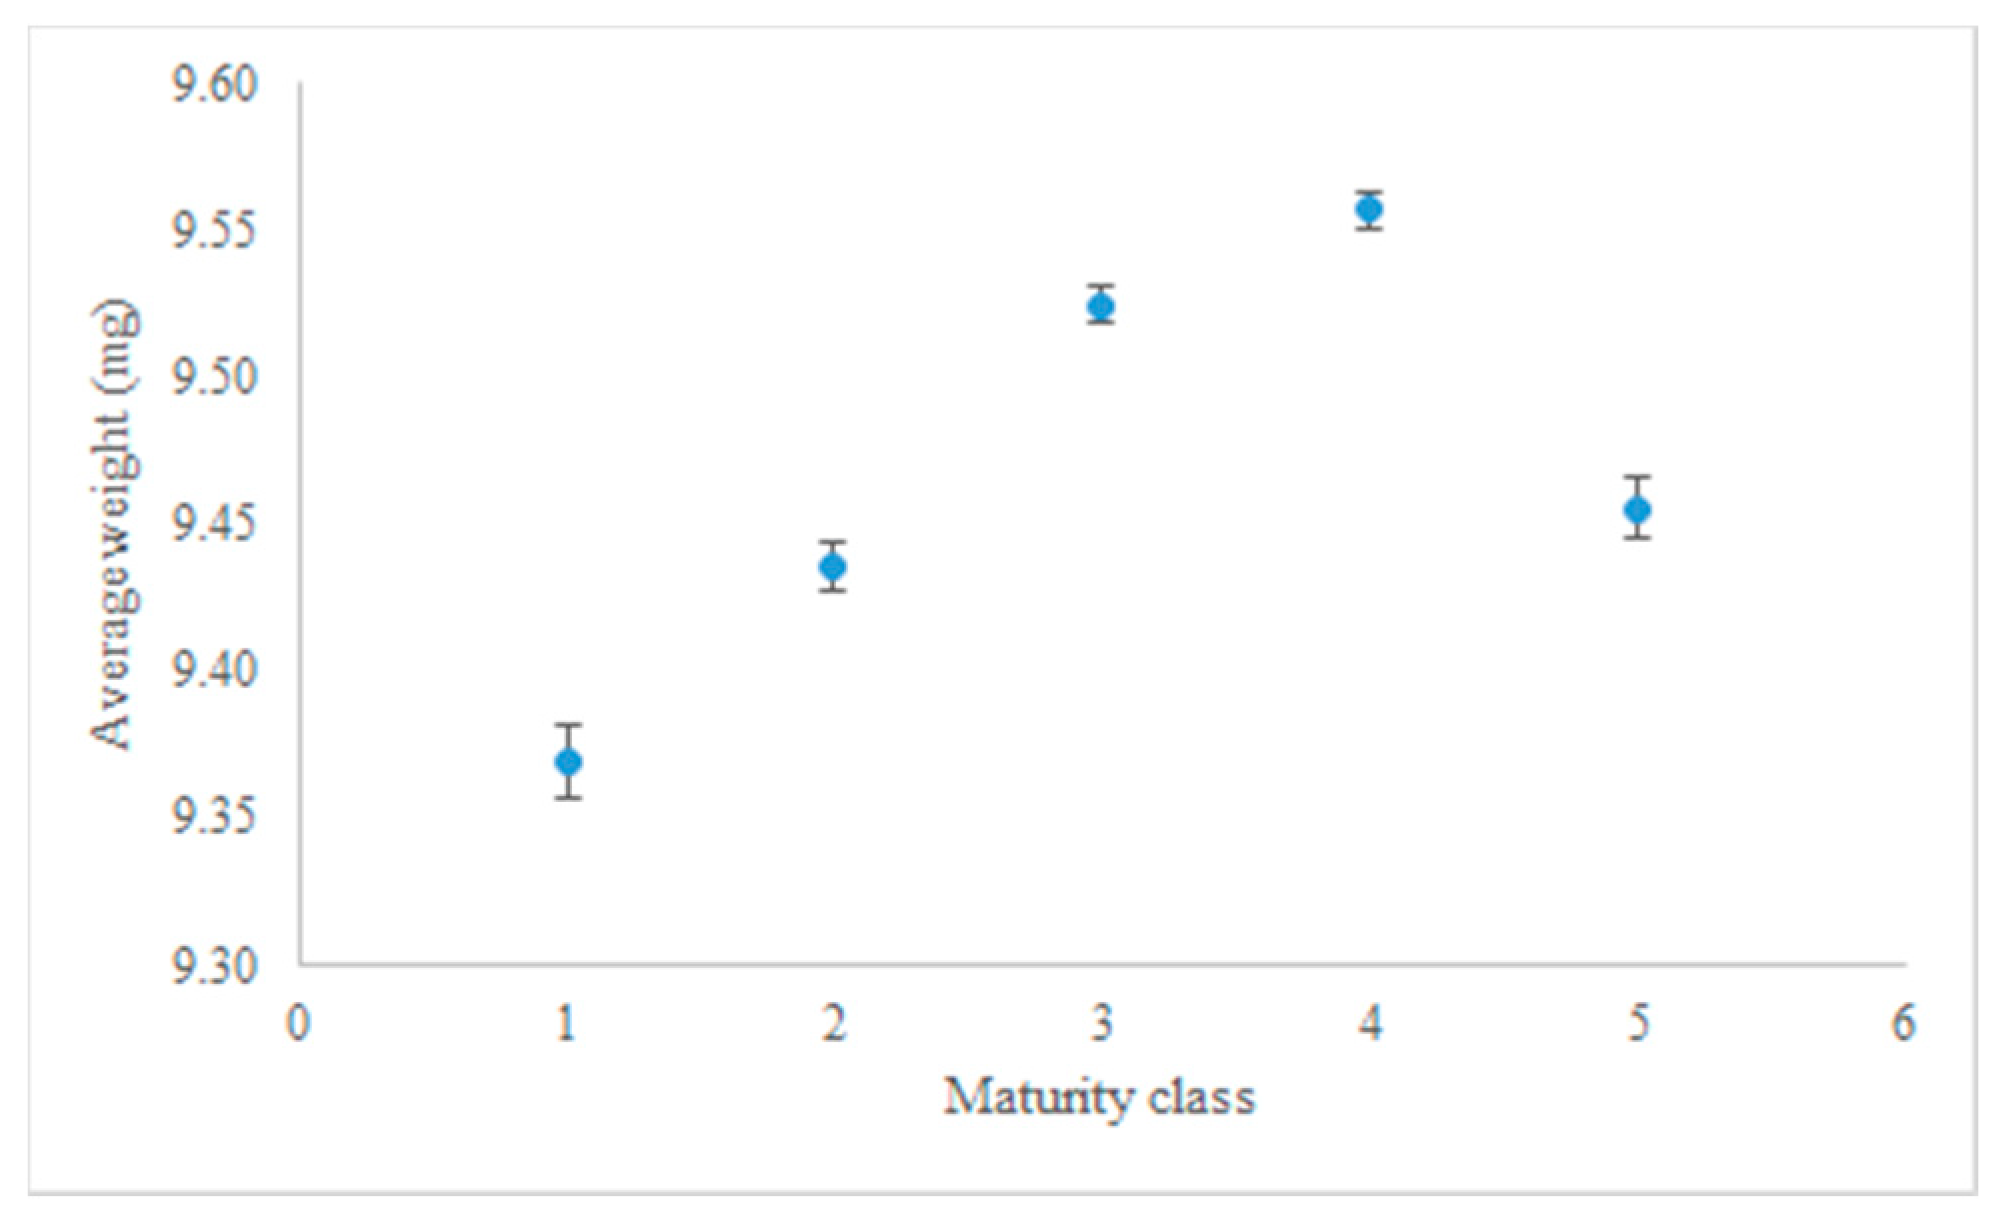
Dry weights of seeds in the maturity classes were compared (Figure 1). The lowest weight was in the first class of maturity and the seeds of maturity class 4 had the highest weight. Seed weights dropped considerably in maturity class five.
The nCDA transformation of the multispectral images showed a color intensity variation between the different maturity classes (Figure 2). High maturity was associated with red, while the blue color was associated with the low level of maturity. This intensity difference was attributed to the pericarp composition and structure variation. Since this feature of pericarp is related to the maturity class of the seeds, it can be beneficial in the seed maturity classification and provide more detailed information of the pericarp structure in each developmental stage of seeds. The MSI confirmed the five maturity classes obtained via chlorophyll fluorescence sorting, which was the method used by the provider of the seed sample.
The percentage of moisture change following the termination of the washing process was another factor evaluated (Table 2). In both ratios (R = 20, 40) studied, the overall trend was the same: Classes 1 and 2 had the highest increase in moisture, classes 3 and 4 had an intermediate increase; however, the percentage of moisture was notably lower in class 5.
The main factor evaluated in this part of the experiment was the water-to-seed ratio. Due to the large differences in germination inhibitors among five maturity classes, the effect of application of 20 vs. 40 mL water per gram of seed was chosen for investigation. The results of the statistical analysis of seed MGT after treatment for 4 h with a stirring speed of 400 rpm in two different proportions of water (20 or 40 mL per gram of seed) are presented in Figure 3.
When applying 20 mL water per gram of seed, the MGT of maturity classes 1 and 2 was higher than class 3 and 4 (Figure 3A). Even though the MGT was low in class 5, the variation was high and therefore the MGT of this class was not significantly different from class 1 and 2. Washing seeds with a higher proportion of water (40 mL) reduced the variation of MGT in class 5 notably (Figure 3B). The other affected class of maturity from this increase in water application was maturity class 2. In general, washing seeds with 40 mL of water per gram of seed compared to 20 mL showed a gradual decrease of MGT with increasing maturity class.
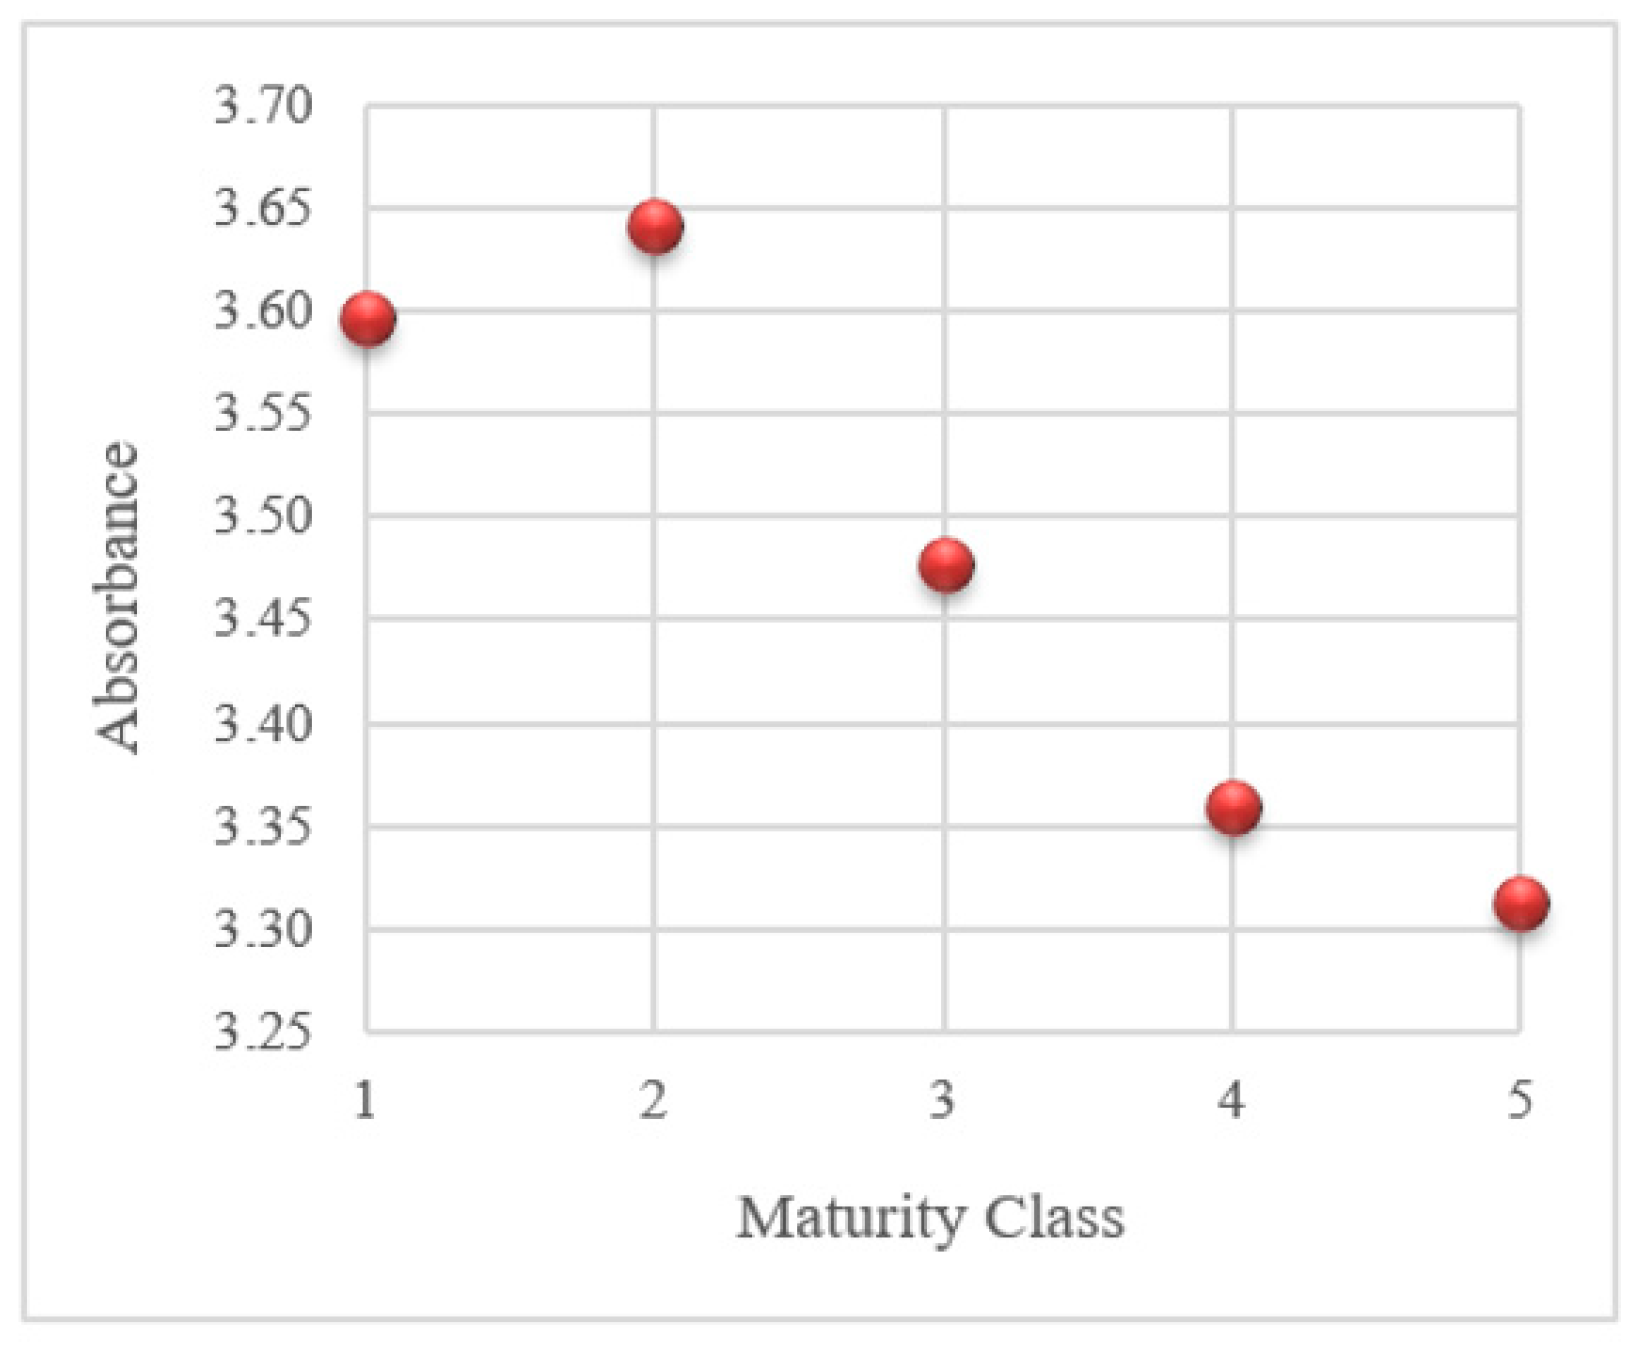
Since the main reason for washing seeds is to remove germination inhibitors, studying the effect of maturity in combination with different washing methods on the amount of these toxic substances in the steeping solution of seeds was highly relevant. To this end, after termination of washing treatments, the UV spectrum of the steeping solution of each maturity class of seeds was recorded (Figure 4). Since the trends were similar for both applied proportions of water, only the spectra of steeping solutions produced with 20 mL water per gram of seed are shown. Among the evaluated seed steeping solutions, the overall trend of the UV spectrum was similar between different maturity classes. However, the absorbance declined with rising maturity class. Maturity class 5 showed the lowest absorption, while the highest absorption was in classes 1 and 2. From the total spectrum, 260 nm was chosen as a characteristic wavelength of the phenolic compounds for comparison of steeping solutions across different maturities classes. The UV absorbance of steeping solutions produced by different treatments is illustrated in Figure 5. The trend for absorbance at 260 nm is similar to the full spectrum where maturity class 5 has the lowest absorbance. The absorbance for maturity classes 1 and 2 is considerably higher than for the other classes.
4. Discussion
According to Stout and Tolman [31], soaking beet seeds for two hours before testing is recommended by the Association of Official Seed Analysts and in the Federal Seed Act seed testing rules. Furthermore, Draycott [20] mentions that the duration of washing should be two to four hours in order to leach out the natural substances with inhibitory effects. Tohidloo et al. [27] applied shorter duration of washing along with extended process time, up to three hours, to improve germination performance. Śliwińska et al. [7] found improved germination results after soaking seeds for 3 h in water. Interesting comparisons can be drawn between these results, where seeds from two harvest times were studied and results from the current experiment with five maturity classes.
On the other hand, determining the proper proportion of water is necessary to ensure sufficient elimination of inhibitors as well as improved water uptake [18,27]. Longden [32] found that spraying seeds with water equal to 100–200% of their weight did not produce adequate progress in germination, unless it was repeated for four to five cycles. Another study used a water-to-seed ratio of 5:1 (by weight), which was equivalent to some commercial procedures [7]. Our results, however, illustrated the variable response to the proportion of water.
Tohidloo et al. [27] suggested that the germination of sugar beet seeds may accelerate for 2.5 days following the washing process, which may be the result of the removal of toxic substances. Longden [32] and Durant [33] also reported germination improvement for washed seeds. These results are in line with the outcome of the present study, where the treated seeds began to germinate 2 days before non-treated.
Moreover, the adverse effect of underdeveloped seeds on germination potential was demonstrated in previous studies [4,5,6], while their visual distinction with the naked eye was impossible [4]. Progress in multispectral imaging has provided imaging platforms, which are able to categorize various materials based on information contained in their surface components, such as color, texture, morphology, and chemical composition, in order to assess e.g., the seed quality [9,34]. There is a color gradient in the transformed images of seeds of different maturity classes, which was derived from the nCDA calculation of multispectral images (Figure 2).
These color combinations may be due to the chemical difference in the seed surface since the variation in chemical composition of the seed coat could affect the light reflection [35]; the combination of these substances changes during seed development [18]. Phenols play a fundamental role in this variation in reflection. Since phenols are the primary substances in lignin biosynthesis, their combination differs depending on the progress of the lignification process. Therefore, seeds of each maturity class have different amounts of lignin and phenols in their pericarp [3].
The relation between seed weight and germination performance has been shown in various studies [5,36]. In sugar beet, underdeveloped fruits are partially filled and have lower weight [4]. Meanwhile, the positive relationship between the sugar beet single fruit mean weight and maturity progress has been reported by Grimwade et al. [5]. A similar trend is visible in the different maturity classes used in this experiment (Figure 1). The considerable weight reduction in maturity class five could be due to the moisture loss during the time until harvest. The 3D X-ray image of this class, which was presented in our previous article [9], showed that the true seed is shrunk and there is more space in the cavity, compared to seeds of maturity class 4 [9].
Seed susceptibility to water absorption is also related to maturity class, with immature seeds tending to have a faster water uptake [10]. As shown in Table 1, in the first and second maturity classes, the less developed pericarp allows faster absorption. Therefore, the weight increase is higher compared to the other classes. This fast imbibition can be harmful for the embryo. As the seed becomes more developed, the pericarp contains more lignin and its permeability to water is lowered. On the other hand, the mature pericarp contains salt crystals [11,21]. Lower water uptake in higher maturity classes may thus be due to the osmotic effect of inner layers of pericarp.
Different levels of toxic substances accumulated in seeds harvested with distinct maturity levels [18]. Therefore, the beneficial effect of washing changes due to the amount of these substances, and applying a higher proportion of water may thus produce a more satisfactory outcome as the results showed for classes 2 and 5 [18]. Moreover, a longer time of washing was applied (4 h) to reduce the time required for seed enhancement.
Regarding the MGT results of different maturity classes, better seed performance in higher maturity classes could be due to lower concentrations of toxic substances (Figure 3). While these toxic substances were leaching out during the washing process, the high concentration of them in the steeping solution could have adversely affected the germination speed.
Phenolic compounds are candidates for germination inhibitors in sugar beet [3,14,15,19]. Oxidation of these water-soluble compounds appears to deprive the embryo of oxygen [13,17,19,37]. On the other hand, fruit tissue, which surrounds the true seed and is also known as the pericarp, can also restrict oxygen availability and water uptake [1,38]. Orzezko and Podlaski [21] showed the influence of seed washing on the pericarp density, which leads to a better water uptake potential.
Infrared or ultraviolet absorption-based methods appear to be a dependable approach for studying phenols [24]. Quantifying these compounds by UV-visible spectroscopy was found to be a reliable technique [16,17,39], and the absorption range of 230–300 nm was reported in literature as characteristic of these aromatic compounds [16,17]. From the full spectrum (Figure 4), the absorption at 260 nm (Figure 5) was selected to characterize the differences between steeping solutions derived from seeds of differing maturity classes.
The UV absorbance spectra of the washing solution for sugar beet seeds are in line with previous studies, which showed that various seed lots have similar spectral patterns and distinguished differences for absorbance in a specific UV region (250–270 nm) [17]. These results were in line with the extracted absorption of seeds steeping solutions full spectrum and absorption at 260 nm. The decreasing trend was seen with time to mature.
5. Conclusions
Complete separation of underdeveloped seeds is hardly possible in a seed lot, and even a low percentage of immature seeds can have an immediate effect on germination performance. This unfavorable performance can be due to the germination inhibitors and/or the developmental stage of the pericarp. Therefore, finding a proper method to leach out these toxic substances, while not harming the embryo by fast imbibition, can be beneficial. Our findings show that the duration of washing, proportion of applied water, and the speed of stirring should be adjusted for each seed lot and each maturity class. Multispectral imaging techniques can be helpful in visualizing the differences among pericarp developmental stages. This classification is important since the developmental stage of the pericarp plays a crucial rule for the number of inhibitors. As phenols are the primary compounds of interest among candidate inhibitory substances, the UV absorbance characteristics of the seed steeping solution can provide useful information for evaluating the concentration of these in water used to wash the seeds.
This study provides information regarding the difference in level of germination inhibitors in seeds of distinct maturity classes and further, it highlights the potential of applying the best combination of affecting factors for elimination of these substances, to improve the seed performance within each maturity class of the studied seed lot. As CF-sorters are now commercially available, the pre-treatment procedures may be tailored and applied to distinct maturity classes within a seed lot leading to an overall improved germination performance.
Author Contributions
B.B. and Z.S.: Initiated and designed the research; Z.S. performed the experiments, analysed data and wrote the manuscript; B.B. revised and edited the manuscript and provided advice on the experiments and presentation of results.
Funding
The work was funded by GUDP (Grønt Udviklings- og Demonstrations Program) project J.nr.: 34009-12-0528, the Danish Agricultural Agency under the Ministry of Environment and Food of Denmark.
Acknowledgments
We are grateful to MariboHilleshög for providing the seed samples.
Conflicts of Interest
The authors declare no conflict of interest. The funders had no role in the design of the study; in the collection, analyses, or interpretation of data; in the writing of the manuscript, or in the decision to publish the results.
References
- Hermann, K.; Meinhard, J.; Dobrev, P.; Linkies, A.; Pesek, B.; Heß, B.; Macháčková, I.; Fischer, U.; Leubner-Metzger, G. 1-Aminocyclopropane-1-carboxylic acid and abscisic acid during the germination of sugar beet (Beta vulgaris L.): A comparative study of fruits and seeds. J. Exp. Bot. 2007, 58, 3047–3060. [Google Scholar] [CrossRef] [PubMed]
- Richard, G.; Raymond, P.; Corbineau, F.; Pradet, A. Effect of the pericarp on sugar beet (Beta vulgaris L.) seed germination: Study of the energy metabolism. Seed Sci. Technol. 1989, 17, 485–498. [Google Scholar]
- Battle, J.P.; Whittington, W.J. The relation between inhibitory substances and variability in time to germination of sugar beet clusters. J. Agric. Sci. 1969, 73, 337–346. [Google Scholar] [CrossRef]
- Tekrony, D.M.; Hardin, E.E. The problem of underdeveloped seeds occuring in monogerm sugar beets. J. Am. Soc. Sugar Beet Technol. 1969, 15, 625–639. [Google Scholar] [CrossRef]
- Grimwade, J.A.; Grierson, D.; Whittington, W.J. The effect of difference in time to maturaty on the quality of seed produced by different varieties of sugar beet. Seed Technol. 1987, 15, 135–145. [Google Scholar]
- Snyder, F.W. Relation of sugar beet germination to maturity and fruit moisture at harvest. J. Am. Soc. Sugar Beet Technol. 1971, 16, 541–551. [Google Scholar] [CrossRef]
- Śliwińska, E.; Jing, H.-C.; Job, C.; Job, D.; Bergervoet, J.H.W.; Bino, R.J.; Groot, S.P.C. Effect of harvest time and soaking treatment on cell cycle activity in sugarbeet seeds. Seed Sci. Res. 1999, 9, 91–99. [Google Scholar] [CrossRef]
- Inoue, K.; Yamamoto, R. The Growth inhibitors in sugar beet seed balls. Jpn. J. Crop. Sci. 1977, 46, 298–305. [Google Scholar] [CrossRef]
- Boelt, B.; Shrestha, S.; Salimi, Z.; Ravn Jørgensen, J.; Nicolaisen, M.; Carstensen, J.M. Multispectral imaging—A new tool in seed quality assessment? Seed Sci. Res. 2018, 28, 222–228. [Google Scholar] [CrossRef]
- Snyder, F.W. Maturity effects on fruit characteristics, germination, and emergence of sugar beet. J. Am. Soc. Sugar Beet Technol. 1974, 18, 87–95. [Google Scholar] [CrossRef]
- Evenari, M. Germination inhibitors. Bot. Rev. 1949, 15, 153–194. [Google Scholar] [CrossRef]
- De Kock, P.C.; Hunter, R.F.; Macdonald, I.R. A germination inhibitor from sugar-beet. J. Exp. Bot. 1953, 4, 272–282. [Google Scholar] [CrossRef]
- Coumans, M.; Come, D.; Gaspar, T. Stabilized dormancy in sugarbeet fruits. I. Seed coats as a physicochemical barrier to Oxygen. Bot. Gaz. 1976, 137, 274–278. [Google Scholar] [CrossRef]
- Morris, P.C.; Grierson, D.; Whittington, W.J. Endogenous inhibitors and germination of Beta vulgaris. J. Exp. Bot. 1984, 35, 994–1002. [Google Scholar] [CrossRef]
- Junttila, O. Germination inhibitors in fruit extracts of red beet (Beta vulgaris cv. rubra). J. Exp. Bot. 1976, 27, 827–836. [Google Scholar] [CrossRef]
- Chiji, H.; Tanaka, S.; Izawa, M.; Iza, M. Phenolic germination inhibitors in the seed balls of red beet (Beta vulgaris L. var. rubra). Agric. Biol. Chem. 1980, 44, 205–207. [Google Scholar] [CrossRef]
- Duan, X.; Burris, J.S. Film coating impairs leaching of germination inhibitors in sugar beet seed. Crop. Sci. 1997, 37, 515–520. [Google Scholar] [CrossRef]
- Tolman, B.; Stout, M. Toxic effect on germinating sugar-beet seed of water-soluble substances in the seed ball. J. Agric. Res. 1940, 61, 817–830. [Google Scholar]
- Abts, W.; Vissers, C.; Vandenbussche, B.; De Proft, M.M.P. Study of ethylene kinetics during and after germination of sugar beet (Beta vulgaris L.) seeds and fruits. Seed Sci. Res. 2013, 23, 205–210. [Google Scholar] [CrossRef]
- Draycott, A.P. Sugar Beet; John Wiley and Sons Ltd.: Chicester, UK, 2006. [Google Scholar]
- Orzeszko-Rywka, A.; Podlaski, S. The effect of sugar beet seed treatments on their vigour. Plant. Soil. Environ. 2003, 49, 249–254. [Google Scholar] [CrossRef]
- Lemma, B.; Grehl, C.; Zech, M.; Mekonnen, B.; Zech, W.; Nemomissa, S.; Bekele, T. Phenolic compounds as unambiguous chemical markers for the identification of keystone plant species in the bale mountains, Ethiopia. Plants 2019, 8, 228. [Google Scholar] [CrossRef] [PubMed]
- Frabboni, L.; Tarantino, A.; Petruzzi, F.; Disciglio, G. Bio-herbicidal effects of oregano and rosemary essential oils on chamomile (Matricaria chamomilla L.) crop in organic farming system. Agronomy 2019, 9, 475. [Google Scholar] [CrossRef]
- Schmauch, L.J.; Grubb, M. Determination of phenols in waste waters by ultraviolet absorption. Anal. Chem. 1954, 26, 308–311. [Google Scholar] [CrossRef]
- Lin, S.Y. Ultraviolet Spectrophotometry. In Methods in Lignin Chemistry; Lin, S.Y., Dence, C.W., Eds.; Springer: Berlin, Germany, 1992; pp. 217–232. [Google Scholar]
- Devlin, H.R.; Harris, I.J. Mechanism of the oxidation of aqueous phenol with dissolved oxygen. Ind. Eng. Chem. Fundam 1984, 23, 387–392. [Google Scholar] [CrossRef]
- Tohidloo, G.; Fathollah Taleghani, D.; Chegini, S.; Chegini, M.A.; Paknejad, F.; Habib Khodaie, A.; Ilkaee, M.N.; Golzardi, F.; Jalili, F. Effect of polishing and washing on germination quality and viability of sugar beet seed. Int. J. Biosci. 2015, 6, 209–215. [Google Scholar]
- Habib, M. Sugarbeet (Beta vulgaris L.) seed pre-treatment with water and HCl to improve germination. Afr. J. Biotechnol. 2010, 9, 1338–1342. [Google Scholar]
- The International Seed Testing Association (ISTA). International Rules for Seed Testing, 13th ed.; The International Seed Testing Association (ISTA): Zürich, Switzerland, 2018. [Google Scholar]
- Core Development Team. R: The R Project for Statistical Computing 2015. Available online: https://cran.r-project.org/mirrors.html (accessed on 10 September 2017).
- Stout, M.; Tolman, B. Interference of ammonia, released from sugar beet seed balls, with laboratory germination tests. J. Am. Soc. Agron. 1941, 33, 65–69. [Google Scholar] [CrossRef]
- Longden, P.C. Advanced sugar beet seed. J. Agric. Sci. 1971, 77, 43–46. [Google Scholar] [CrossRef]
- Durrant, M.J.; Payn, P.A.; McLaren, J.s. The use of water and some inorganic salt solutions to advance sugar beet seed. II. Experiments under controlled and field conditions. Ann. Appl. Biol. 1983, 103, 517–526. [Google Scholar] [CrossRef]
- Wilkes, T.; Nixon, G.; Bushell, C.; Waltho, A.; Alroichdi, A.; Burns, M.; Wilkes, T. Feasibility study for applying spectral imaging for wheat grain authenticity testing in pasta. Food Nutr. Sci. 2016, 7, 355–361. [Google Scholar] [CrossRef]
- Dell’Aquila, A. Towards new computer imaging techniques applied to seed quality testing and sorting. Seed Sci. Technol. 2007, 35, 519–538. [Google Scholar] [CrossRef]
- Durrant, M.J.; Loads, A.H. Some changes in sugar beet seeds during maturation and after density grading. Seed Sci. Technol. 1990, 18, 11–21. [Google Scholar]
- Heydecker, W.; Chetram, R.S. Water relations of beetroot seed germination I. microbial factors, with special reference to laboratory germination. Ann Bot. 1971, 35, 17–29. [Google Scholar] [CrossRef]
- Godwin, J.; Raviv, B.; Grafi, G. Dead pericarps of dry fruits function as long-term storage for active hydrolytic enzymes and other substances that affect germination and microbial growth. Plants 2017, 6, 64. [Google Scholar] [CrossRef] [Green Version]
- Aleixandre-Tudo, J.L.; Toit, W.d. The role of UV-visible spectroscopy for phenolic compounds quantification in winemaking. In Frontiers and New Trends in the Science of Fermented Food and Beverages; Solis-Oviedo, R.L., Pech-Canul, A.D.L.C., Eds.; IntechOpen: London, UK, 2018. [Google Scholar]
Figure 1.
Seed average dry weight (mg), as a function of maturity class.

Figure 2.
Multispectral images (top row) and corresponding transformed image (bottom row) of seed in maturity class 5 to 1 (left to right), where class 5 is the most mature seed.
Figure 2.
Multispectral images (top row) and corresponding transformed image (bottom row) of seed in maturity class 5 to 1 (left to right), where class 5 is the most mature seed.

Figure 3.
MGT as affected by seed maturity class in two water-to-seed ratios (A): 20 and (B): 40 mL/g seed) employed during washing.
Figure 3.
MGT as affected by seed maturity class in two water-to-seed ratios (A): 20 and (B): 40 mL/g seed) employed during washing.

Figure 4.
Each maturity class seed steeping solution (20 ml/g seed) ultra-violet (UV) absorbance spectrum.
Figure 4.
Each maturity class seed steeping solution (20 ml/g seed) ultra-violet (UV) absorbance spectrum.

Figure 5.
UV absorbance at 260 nm of the steeping solutions of seeds of the five maturity classes (20 ml water/g seed).
Figure 5.
UV absorbance at 260 nm of the steeping solutions of seeds of the five maturity classes (20 ml water/g seed).


Table 1.
Mean germination time (MGT) comparison of seeds washed at three stirring speeds, S (100, 200, and 400 rpm) for three durations, T (1, 2, and 4 h) in different amounts of water, R (10, 20, and 40 mL) per gram of seed.
Table 1.
Mean germination time (MGT) comparison of seeds washed at three stirring speeds, S (100, 200, and 400 rpm) for three durations, T (1, 2, and 4 h) in different amounts of water, R (10, 20, and 40 mL) per gram of seed.
| R | 10 | 20 | 40 | |||||||
|---|---|---|---|---|---|---|---|---|---|---|
| S | 100 | 200 | 400 | 100 | 200 | 400 | 100 | 200 | 400 | |
| T | ||||||||||
| 1 | 3.36 ± 0.24 | 2.94 ± 0.30 | 3.83 ± 0.36 | 3.39 ± 0.42 | 3.52 ± 0.30 | 2.97 ± 0.14 | 3.43 ± 0.25 | 3.01 ± 0.20 | 3.21 ± 0.12 | |
| 2 | 3.72 ± 0.27 | 3.19 ± 0.20 | 3.45 ± 0.13 | 2.93 ± 0.09 | 3.32 ± 0.16 | 3.03 ± 0.17 | 2.93 ± 0.26 | 3.07 ± 0.09 | 2.90 ± 0.11 | |
| 4 | 3.56 ± 0.24 | 2.98 ± 0.24 | 2.64 ± 0.12 | 2.84 ± 0.04 | 3.08 ± 0.23 | 2.89 ± 0.08 | 2.96 ± 0.04 | 2.96 ± 0.18 | 2.65 ± 0.07 | |
Table 2.
The percentage of seed moisture change following the completion of washing as a function of maturity class, M (1–5) and applied ratio of water, R (20 or 40 mL), per gram of seed.
Table 2.
The percentage of seed moisture change following the completion of washing as a function of maturity class, M (1–5) and applied ratio of water, R (20 or 40 mL), per gram of seed.
| M | 1 | 2 | 3 | 4 | 5 | |
|---|---|---|---|---|---|---|
| R | ||||||
| 20 | 58.23 ± 2.9 | 58.45 ± 3.3 | 54.90 ± 2.9 | 54.21 ± 3.3 | 51.32 ± 2.7 | |
| 40 | 57.74 ± 2.6 | 58.38 ± 2.7 | 55.04 ± 3.1 | 53.37 ± 2.9 | 50.81 ± 2.2 | |
© 2019 by the authors. Licensee MDPI, Basel, Switzerland. This article is an open access article distributed under the terms and conditions of the Creative Commons Attribution (CC BY) license (http://creativecommons.org/licenses/by/4.0/).
Share and Cite
MDPI and ACS Style
Salimi, Z.; Boelt, B. Optimization of Germination Inhibitors Elimination from Sugar Beet (Beta vulgaris L.) Seeds of Different Maturity Classes. Agronomy 2019, 9, 763. https://0-doi-org.brum.beds.ac.uk/10.3390/agronomy9110763
AMA Style
Salimi Z, Boelt B. Optimization of Germination Inhibitors Elimination from Sugar Beet (Beta vulgaris L.) Seeds of Different Maturity Classes. Agronomy. 2019; 9(11):763. https://0-doi-org.brum.beds.ac.uk/10.3390/agronomy9110763
Chicago/Turabian StyleSalimi, Zahra, and Birte Boelt. 2019. "Optimization of Germination Inhibitors Elimination from Sugar Beet (Beta vulgaris L.) Seeds of Different Maturity Classes" Agronomy 9, no. 11: 763. https://0-doi-org.brum.beds.ac.uk/10.3390/agronomy9110763
Note that from the first issue of 2016, this journal uses article numbers instead of page numbers. See further details here.