Remote Measurement of Apple Orchard Canopy Information Using Unmanned Aerial Vehicle Photogrammetry


1
College of Engineering, Nanjing Agricultural University, Nanjing, Jiangsu 210031, China
2
Jiangsu Province Engineering Lab for Modern Intelligent Facilities of Agriculture Technology & Equipment, Nanjing, Jiangsu 210031, China
*
Author to whom correspondence should be addressed.
Agronomy 2019, 9(11), 774; https://0-doi-org.brum.beds.ac.uk/10.3390/agronomy9110774
Submission received: 10 September 2019
/
Revised: 12 November 2019
/
Accepted: 18 November 2019
/
Published: 19 November 2019
(This article belongs to the Special Issue Application of Remote Sensing in Orchard Management)
Abstract
:Information on fruit tree canopies is important for decision making in orchard management, including irrigation, fertilization, spraying, and pruning. An unmanned aerial vehicle (UAV) imaging system was used to establish an orchard three-dimensional (3D) point-cloud model. A row-column detection method was developed based on the probability density estimation and rapid segmentation of the point-cloud data for each apple tree, through which the tree canopy height, H, width, W, and volume, V, were determined for remote orchard canopy evaluation. When the ground sampling distance (GSD) was in the range of 2.13 to 6.69 cm/px, the orchard point-cloud model had a measurement accuracy of 100.00% for the rows and 90.86% to 98.20% for the columns. The coefficient of determination, R2, was in the range of 0.8497 to 0.9376, 0.8103 to 0.9492, and 0.8032 to 0.9148, respectively, and the average relative error was in the range of 1.72% to 3.42%, 2.18% to 4.92%, and 7.90% to 13.69%, respectively, among the H, W, and V values measured manually and by UAV photogrammetry. The results showed that UAV visual imaging is suitable for 3D morphological remote canopy evaluations, facilitates orchard canopy informatization, and contributes substantially to efficient management and control of modern standard orchards.
1. Introduction
The canopy is the part of a fruit tree in contact with light and the external environment, and it represents the main site for photosynthesis and respiration. Canopy information of fruit trees not only reflects the growth status and yield potential of fruit trees [1] but also serves as an important basis for decision making in the production processes [2], including orchard canopy pruning [3], irrigation and fertilization [4], drug spraying [5], and management during flowering [6].
Traditional orchard management methods have a low degree of informatization, which leads to various problems, including low production efficiency, excessive use of water/fertilizers/pesticides, and consequently serious pollution problems [2,4,5]. In addition, modern orchard management will be empowered by informatization, and informatization will provide opportunities for growers to make decisions on facts, as well as helping them to reproduce good practices. Therefore, it is urgent that research on the measurement technology of canopy information in modern standard orchards is strengthened and a solid foundation is established for efficient orchard management and control.
With the development of sensor technology, nondestructive large-area orchard canopy measurement can be realized by the joint use of unmanned aerial vehicles (UAVs) and visual imaging technology [7]. This approach provides a scientific and reliable information basis for decision making in intelligent orchard management and is of great significance to the development of modern standard orchards.
Two photogrammetry systems, namely vehicle-mounted [6,8,9] and UAV measurement systems [3], are commonly used for large-area orchard canopy measurements. Both types integrate visual imaging systems, such as RGB camera, time-of-flight (TOF) camera, multispectral camera, hyperspectral camera, 2D Lidar, and 3D Lidar, to achieve nondestructive 3D measurement of geometric morphology and physiological indexes of an orchard canopy. The UAV systems are more suitable for large-scale orchard information measurement [2,3,5], but the vehicle-mounted systems are more suitable for orchard management that requires real-time operations, such as targeted spraying [10], canopy pruning [3], and fruit positioning and picking [11]. UAV measurement systems are more suitable for the evaluation of orchard information, including remote evaluations of canopy geometric morphology [12], biomass [13], disease [5], water stress [14], vegetation index [15], and yield [16,17].
Currently, UAV visual imaging systems are capable of building a large-area orchard orthophoto map, vegetation index image, digital surface model (DSM), and 3D point-cloud model, thereby laying a solid foundation for orchard canopy measurement. A large amount of research has been conducted on the use of UAV sensing technology in various orchards, including peach [18], apple [8], mango [15], and grape orchards [19]. The research has mainly realized nondestructive remote measurements of yield, height, volume, flower and fruit identification, row spacing, biomass, weeds, water stress, disease, vegetation index, and other data.
Modern standard orchards are characterized by orderly rows and columns, which meets the requirement for the operation of agricultural machinery and equipment. Using an apple orchard as the research subject, this study used UAV visual imaging data to establish an orchard 3D point-cloud model. Next, through ground sampling and slope estimation, a model was preprocessed for ground correction, and then a row-column detection method was developed and used to realize a rapid single-tree point-cloud segmentation. Further, a calculation method based on the single-tree point-cloud model was established to determine the tree canopy height, width, and volume for remote estimation of 3D orchard canopy morphology. This method can provide a theoretical basis and technical support for canopy measurement and is of great significance for the promotion of efficient management and control of modern standard orchards.
2. Materials and Methods
2.1. Composition and Principle of a UAV Photogrammetry System
The UAV canopy photogrammetry system for the modern standard orchard used in the study was mainly composed of a Parrot Bluegrass UAV, Parrot Sequoia multispectral camera, Pix4Dcapture flight control software, Pix4Dmapper postprocessing software and graphics workstation, etc. The main technical parameters of the Parrot Bluegrass UAV and Parrot Sequoia multispectral camera can be found on the website at www.parrot.com. The main functions of the Pix4Dcapture flight control software were as follows: Parameters were set for a UAV flight mission, and to display real-time status, including the battery of the UAV, the battery of the parrot skycontroller, the number of satellites, the memory for image data storage, the flight coordinates of the UAV (double constellation GNSS device), the flight map, the flight altitude, and the ground sample distance (GSD). The primary functions of the Pix4Dmapper postprocessing software were as follows: Generate 3D point-cloud models, orthophoto images, DSM, vegetation index maps, and others based on the images collected by the UAV.
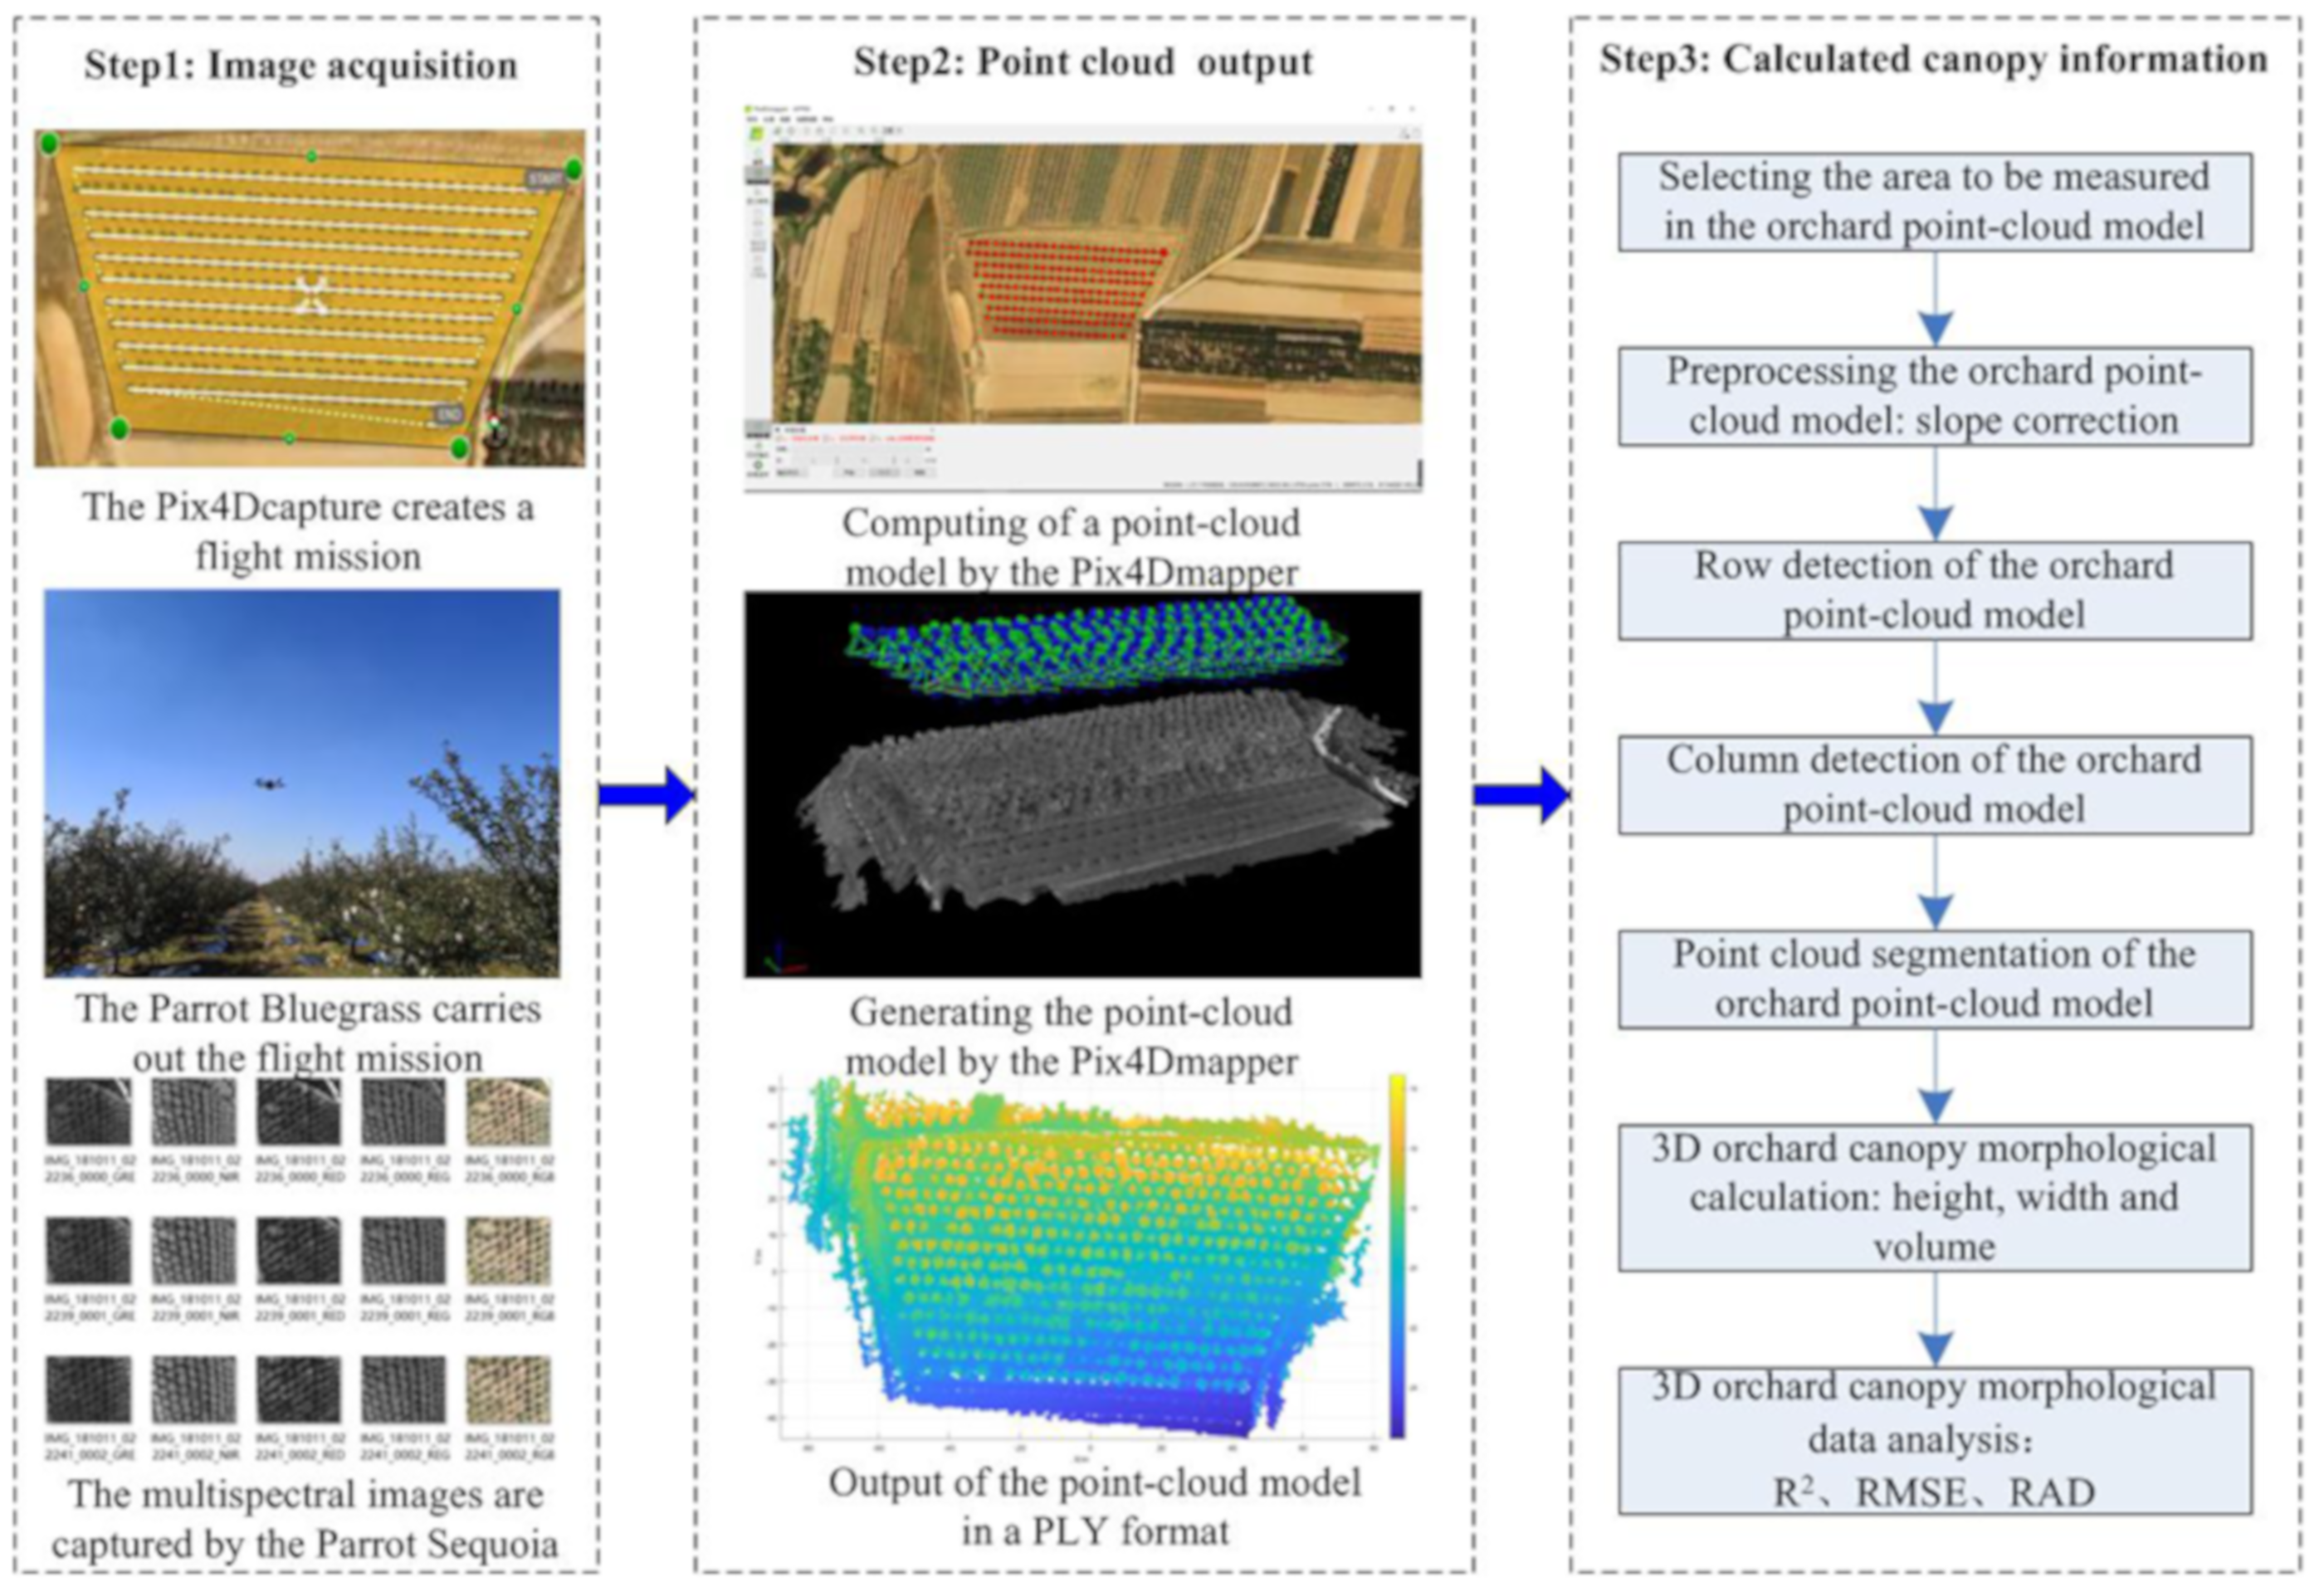
As shown in Figure 1, the operation of the UAV canopy photogrammetry system for modern standard orchards included the following steps.
2.1.1. Step 1: Image Acquisition
A flight mission was set up according to the conditions and requirements of the area to be measured using Pix4Dcapture, including the flight map boundary selection, flight path planning, flight altitude, flight speed, front overlap, and side overlap, etc. Next, a Parrot Bluegrass performed the flight mission, and the Parrot Sequoia multispectral camera captured multispectral images for each planned waypoint.
2.1.2. Step 2: Point-Cloud Output
The images captured during the flight mission were read and processed by Pix4D mapper. After performing the processes ‘Computing keypoints’, ‘Computing matches’, ‘Calibrate’, ‘Matches’, and ‘Point-cloud densification’ according to the GPS position information (longitude, latitude, and altitude) of flight waypoints, the PLY files of the orchard point-cloud data were created and output from Pix4D mapper.
2.1.3. Step 3: Calculated Canopy Information
Using MATLAB software, the orchard point-cloud data were read, according to the actual measurement area requirements, the boundary point coordinates of the orchard point-cloud model were defined manually, and the point-cloud signals in the area to be computed were screened out accordingly. Next, ground sampling for the point-cloud model was performed for a slope estimation of the ground, followed by a slope precorrection of the model. Then, the probability density estimation along the rows (Y-axis) from the point cloud, the points for row segmentation were determined based on the local peak and valley values and the boundary of each row were identified. Similarly, column segmentation was performed after a probability density estimation in the column direction (X-axis) from the point cloud. As a result, the point-cloud segmentation of each fruit tree in the orchard point-cloud model was accomplished and then stored in two-dimensional cell arrays. Finally, the morphological parameters of each fruit tree in the 3D point-cloud model, including the height, width, and canopy projection area and volume, were calculated, and the accuracy of the information obtained was evaluated and analyzed.
2.2. UAV Canopy Measurement
The study area for 3D canopy morphological measurements of apple trees in this study was located in Yaojia Village in Guandao Town of Shandong Province in China (Longitude: 120.634540°, Latitude:37.171436°). The study was performed from 8 October 2018 to 15 October 2018, which was the harvesting period of apples. The orchard was a modern standard orchard, suitable for large-scale agricultural machinery equipment operation in the orchard. The apple trees in the measured orchard area were the “Yanfu 3” variety at the age of 8 to 9 years. The line distance of the fruit tree in the measurement area was 5 m, and the plant distance was 4 m, with a small amount of dead trees or small fruit trees in the orchard. The measured area was 148 m × 69 m (length × width) and included 15 rows of apple trees. Because there was plenty of sunlight between 10:00 M and 2:00 PM on a sunny day, the impact of tree shadow on image processing was relatively small, so the UAV flight time was selected between 10:00 and 14:00. The flight altitude range of the previous study provided a reference for the UAV’s flight altitude selection, mainly referring to the following measurement conditions: The 3D structure of almond trees, 50 m [2]; vegetation classification, 20 and 50 m [15]; field-based plant height estimation, 20 m [20]; and tree crop structural properties, 30, 50, and 70 m [21]. In this study, the flight altitude of the UAV was selected as 22, 32, 43, 53, and 64 m, and the corresponding GSD was 2.07, 3.02, 4.05, 4.99, and 6.03 cm/px, respectively. The flight speed was ‘normal,’ and the average speed was 2.6, 3.7, 4.9, 6.1, and 7.3, respectively. The expected flying time was 11 min 18 s, 6 min 50 s, 4 min 39 s, 3 min 49 s, and 3 min 9 s, respectively. The power consumption ratio was 49.13%, 29.71%, 20.22%, 16.60%, and 13.70%, respectively. Both the image front overlap and side overlap were 80%. The image-capturing equipment used was Parrot Sequoia, consisting of a 16-megapixel RGB camera and four 1.2-megapixel global shutter single-band spectral cameras. The Parrot Skycontroller 2 and Pix4Dcapture app were used for ground control. During the study period, the sky was clear with very few clouds and a wind speed of less than 8 m/s, which met the requirements for remote sensing application through UAV.
2.3. Data Generation of the Orchard 3D Point Cloud Model
The Pix4Dmapper software was used to extract the orchard point-cloud data from the images collected by Parrot Bluegrass. The main processes included: Reading UAV images, selecting the coordinates, initialization processing, and generating point cloud and texture. The relevant parameter settings of Pix4Dmapper are shown in Table 1. Using the structure from motion (SFM) technique [22,23], a series of image processing steps in Pix4Dmapper, including ‘Computing keypoints’, ‘Computing matches’, ‘Calibrate’, ‘Matches’, and ‘Point-cloud densification’, were performed, and the PLY file of the orchard point-cloud model was finally output from the app.
In this study, multiple orchard point-cloud models with different flight altitudes were generated. At the flight altitudes of 22, 3, 43, 53, and 64 m, the number of images collected by Parrot Bluegrass was 2904, 736, 424, 304 and 204, respectively; according to the quality report generated by the Pix4Dmapper, the average GSD was 2.13, 3.31, 4.39, 5.43, and 6.69 cm/px, respectively; the number of 3D point-cloud signals was 3,826,639, 1,173,344, 746,324, 5481, and 4011, respectively; and the average point-cloud density was 364.77, 75.55, 32.01, 17.22, and 8.65 points/m3, respectively.
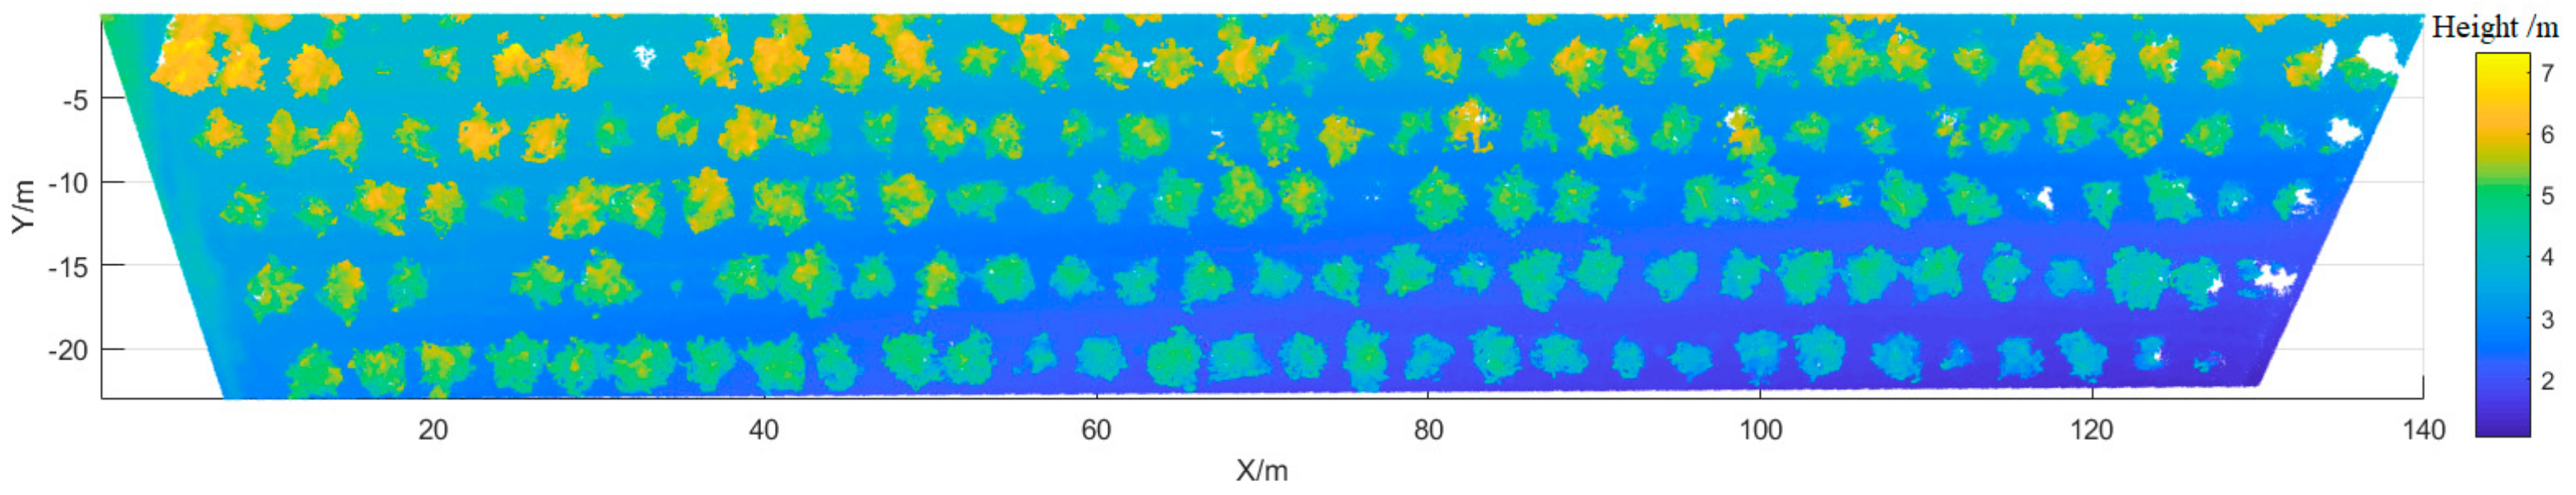
2.4. Computing and Data Analysis of 3D Orchard Canopy Morphology
The orchard point-cloud model was generated by the Pix4Dmapper, as shown in Figure 2. The same area of the point-cloud model was analyzed using the image data at different flight altitudes to compare and analyze the measurement accuracy of the 3D canopy morphology. The number of point-cloud signals in the measuring area was 1,206,177, 344,421, 195,095, 129,545, and 81,719, respectively, when the average GSD was 2.13, 3.31, 4.39, 5.43, and 6.69 cm/px, respectively. The white area was the area where the point cloud was successfully generated. These areas were very few and had very little influence on the measurement of the canopy information in the apple trees. The point-cloud data in the study area were pretreated (slope correction), and the point-cloud single-tree segmentation of fruit trees was achieved by row and column detection; the three-dimensional cloud model of each fruit tree was segmented. Finally, the 3D morphological parameters, the height, width, and volume of each fruit tree, were calculated, as shown in Equations (1)–(5). Meanwhile, the same morphological characteristic parameters of the apple trees in the study area were manually measured: Maximum height, maximum width, and maximum projection circumference of the canopy were measured with a tape measure, and the data were used to evaluate the accuracy of the UAV remote measurement.
2.5. Preprocessing of the Orchard Point-Cloud Model
Modern standard orchards are characterized by orderly plant rows and columns, which can meet the operation requirements of agricultural machinery and equipment. However, due to the slopes in orchards, which often affects evaluation, it is necessary to estimate the slope angle and make a correction accordingly. The first step was the point-cloud ground sampling in the measurement area. The point-cloud map was divided into 200 × 6 grids along the X-axis and Y-axis, and then the coordinates of each grid were calculated, including the X-mean, Y-mean, and Z-minimum value of the coordinates. A ground sampling map of the point cloud is shown in Figure 3. The second step was the plane fitting of the ground point cloud to determine the normal vector, P (a, b, and c), of the fitted ground plane and the center point, M (x0, y0, and z0), of the measurement area (Figure 3). The third step was the displacement processing of the point cloud in the measurement area. As shown in Equation (6), using the center point of the measurement area as the origin (0, 0, 0), all points were subjected to a slope-correction by transforming the normal vector, P, of the fitted ground plane to the Z-axis (0, 0, 1). The normal vector, P, was first rotated around the X-axis until the XOZ plane and then around the Y-axis until it reached the Z-axis. Therefore, the calculation formulas for point-cloud coordinate transformation are shown in Equations (7)–(9) below.
Figure 4 presents the slope correction results of the point-cloud map in the measurement area based on the normal vector of the fitted ground planes. The results from the XOY and YOZ plane views of the original point-cloud model before correction are demonstrated in Figure 4a,c, respectively, and the results after slope correction are shown in Figure 4b,d, respectively. The ground slopes of the point-cloud model were corrected, which laid a good foundation for the subsequent point-cloud segmentation.
2.6. Row and Column Detection Method of the Orchard Point-Cloud Model
To extract the 3D morphological geometric parameters of each apple tree, a rapid row and column detection method was proposed based on the probability density estimation of point-cloud coordinates, which was used for single-tree segmentation. The row characteristics of modern orchards were obvious, but the column characteristics were affected by the cultivation topography and actual growth of fruit trees (such as the dead trees or replanted trees). To eliminate the interference of the orchard ground on row and column segmentation, the ground point cloud signals were removed prior to row and column detection. The main steps of segmentation were as follows. The first step included setting the threshold value for the removal of the ground point cloud signals according to the ground height and were used to screen out the point-cloud coordinates with a Z value greater than the ground height. The second step included the estimation of the probability density of the Y-axis coordinates of the point-cloud model based on the principle of kernel density estimation. After the distribution probability density of the Y-axis coordinates was computed using Equation (10), the peak and valley probability density values and their corresponding Y values were identified:
where is the probability density value of x, n is the number of point clouds, h is the bandwidth, xi is the i-th point-cloud Y coordinate (row detection), and K (·) is the kernel function.
In this study, the performance of the row and column detection was statistically analyzed under two conditions, with and without the removal of ground point-cloud signals (RGPC and NRGPC, respectively). The segmentation accuracy and error rate of the point-cloud models established with a GSD of 2.13, 3.31, 4.39, 5.43, and 6.69 cm/px were calculated by using Equations (11) and (12):
where Cri is the accuracy of the i-th row (%), Ncri is the number of correctly segmented areas in the i-th row, Ni is the total number of areas in the i-th row, Eri is the detection error rate in the i-th row (%), and NEri is the number of incorrectly detected areas in the i-th row (including the areas that were detected multiple times or incorrectly detected).
3. Results and Discussion
3.1. Results of Row and Column Detection
In Figure 5a, the peak, valley, and boundary values of the Y-axis probability density are marked with red, blue, and yellow circles, respectively. The Y-axis boundary and valley points were used for row segmentation. The Y and Ymax parameters corresponding to the Ymin and valley value were sequentially saved to a row segmentation position array, L, which ultimately stored the i+1 row positions (i is the number of rows). According to the boundary values, Xmax and Xmin, of the X-axis coordinates, the coordinates of the corner points in the X and Y axes of each row segment were (Xmin, L (m)), (Xmax, L (m)), (Xmax, L (m + 1)), and (Xmin, L (m + 1)), where the value range of m was from 1 to i. Finally, the point-cloud coordinates of each row segment were saved. The third step was the column segmentation following similar procedures, during which the probability density of the X-axis coordinates of each row segment were sequentially estimated, and then the peak and valley probability density values and their corresponding X values were determined. As shown in Figure 5b, the peak, valley, and boundary values of the X-axis probability density are marked with red, blue, and yellow circles, respectively. The X-axis boundary and valley points were used for column segmentation. The X and Xmax corresponding to the Xmin and valley value were sequentially saved to a row segmentation position array, C [7] (the number of columns in each row might vary), where i was the row number. The coordinates for column segmentation of each row were saved. According to the boundary values, L (m) and L (m+1), of each row, the coordinates of the corner points on the X and Y axes of each column and row segment were (C{m} (n), L (m)), (C{m} (n + 1), L (m)), (C{m} (n + 1), L (m + 1)), and (C{m} (n), L (m + 1)), where m is in the range of 1−i, i is the number of rows, and n is in the range of 1 to size (C{m})−1. Finally, the point-cloud coordinates of each row and column segment were saved.
3.2. Results of Apple Tree Canopy Segmentation
In the study, there were five rows in the measurement area. The proposed detection method achieved an accuracy rate of 100% for row segmentation under all conditions with different GSD. There were 30, 31, 32, 33, and 34 apple trees from the first row to the fifth row, respectively, including eight dead trees (with fewer leaves), among a total of 160 trees.
The column detection results of the orchard point-cloud model are shown in Table 2. Under the condition of a GSD of 2.13, 3.31, 4.39, 5.43, and 6.69 cm/px, the proposed column detection method with RGPC had an average accuracy rate of 98.20%, 92.09%, 93.31%, 95.59%, and 90.86%, respectively, and an average error rate of 4.95%, 6.16%, 4.30%, 3.84%, and 6.83%, respectively; the proposed column detection method with NRGPC had an average accuracy rate of 94.37%, 88.37%, 86.34%, 86.23%, and 81.93%, respectively, and an average error rate of 7.53%, 9.29%, 10.60%, 15.14%, and 16.30%, respectively. The results showed that the column detection after RGPC processing had a significantly higher accuracy and lower error rate, performing more satisfactorily than the detection with NRGPC. In the detection with RGPC, the detection accuracy and error rate were not significantly affected by GSD. However, in the detection with NRGPC, the accuracy and error rate were significantly affected by GSD: A greater GSD corresponded to lower accuracy and a higher error rate. According to the statistical results of the column detection, the main causes for detection error recognition were the misdetection of the edges and the derecognition of the eight dead tree areas in the measurement area. Because the orchard point-cloud model was established based on the matching of the key points in the images collected by UAVs at different waypoints, the dead trees had very few leaves, and as a result, only a very small number of point cloud signals were generated in these areas, which affected the performance of the subsequent column detection.
3.3. Computing and Error Analysis of 3D Orchard Canopy Morphology
3.3.1. 3D Morphological Characterization Using the Canopy Point-Cloud Data of Apple Trees
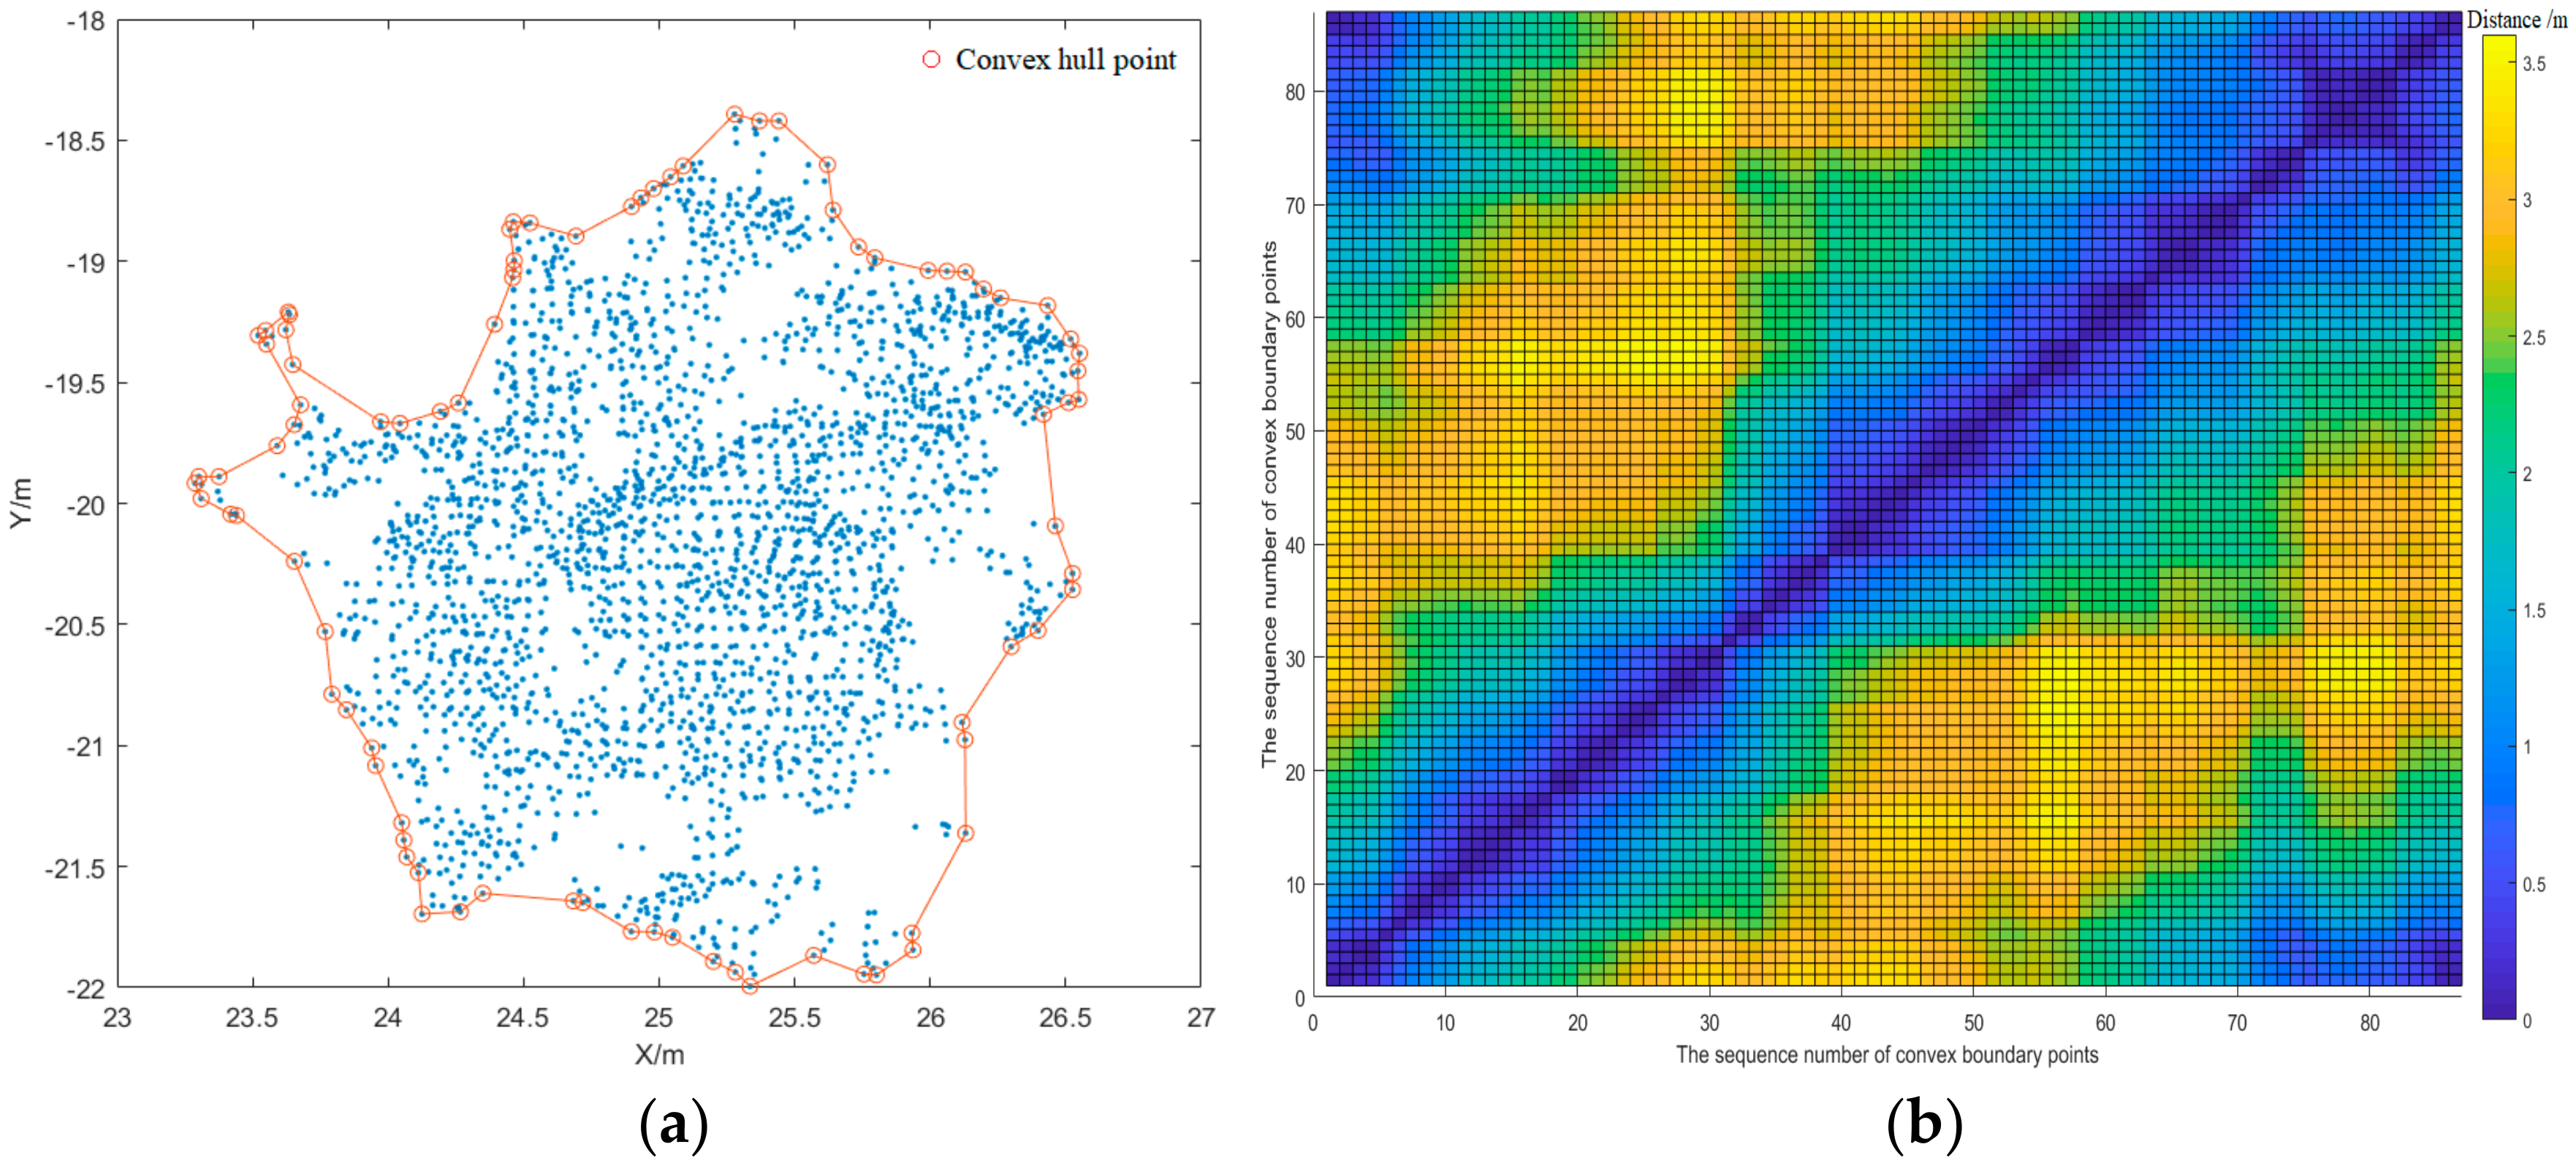
In this study, the row and column detection was treated by RGPC processing and the point-cloud data of each fruit tree were extracted and stored in a 2D cell array, AT{i,j}, for computation of the morphological characteristic parameters, maximum height, H, maximum width, W, and volume, V, of the apple canopy. The computation results were then compared with the results obtained by manual measurement for error analysis. The H value was the maximum vertical height in the Z-axis of the single-tree point-cloud model because the influence of the ground slope was negligible, as shown in Equation (1). The tree canopy has a complex 3D morphology and the canopy width varies largely from different angles of view, but the maximum canopy width is an independent stable characteristic parameter. The maximum width refers to the maximum distance between two boundary points of the canopy projection on the horizontal XOY plane. According to Graham’s algorithm [24], the convex hull of the point set of the canopy on the XOY plane was defined (Figure 6a). Each boundary point was used as reference point to calculate the maximum value of the reference point and other points, and select the maximum value, which was the maximum width of the canopy. That is, N boundary points, calculate N × N distance values, and select the maximum value (Figure 6b), which represented the maximum width of the canopy and was calculated by using Equation (2). The connection line with the maximum width is shown in Figure 6c. It is very difficult to accurately calculate the canopy volume of fruit trees because of their complex canopy morphology. This study applied an approximate estimation method of the canopy volume using an ellipsoidal circumscribing method based on the morphology of the apple trees in the measurement area. Because the point-cloud projection from the XOY plane view has a rotation invariant feature, the enclosed area by the point-cloud projection boundary on the XOY plane view (SXOY) was calculated using Equation (3). The radius, r, of the horizontal axis of the ellipsoid was calculated using Equation (4). Figure 6d shows the equivalent circle of the XOY plane view (the area of circle = SXOY). The average trunk height of the apple trees in the measurement area was 0.6 m; therefore, the canopy volume in the circumscribed ellipsoid could be calculated by using Equation (5).
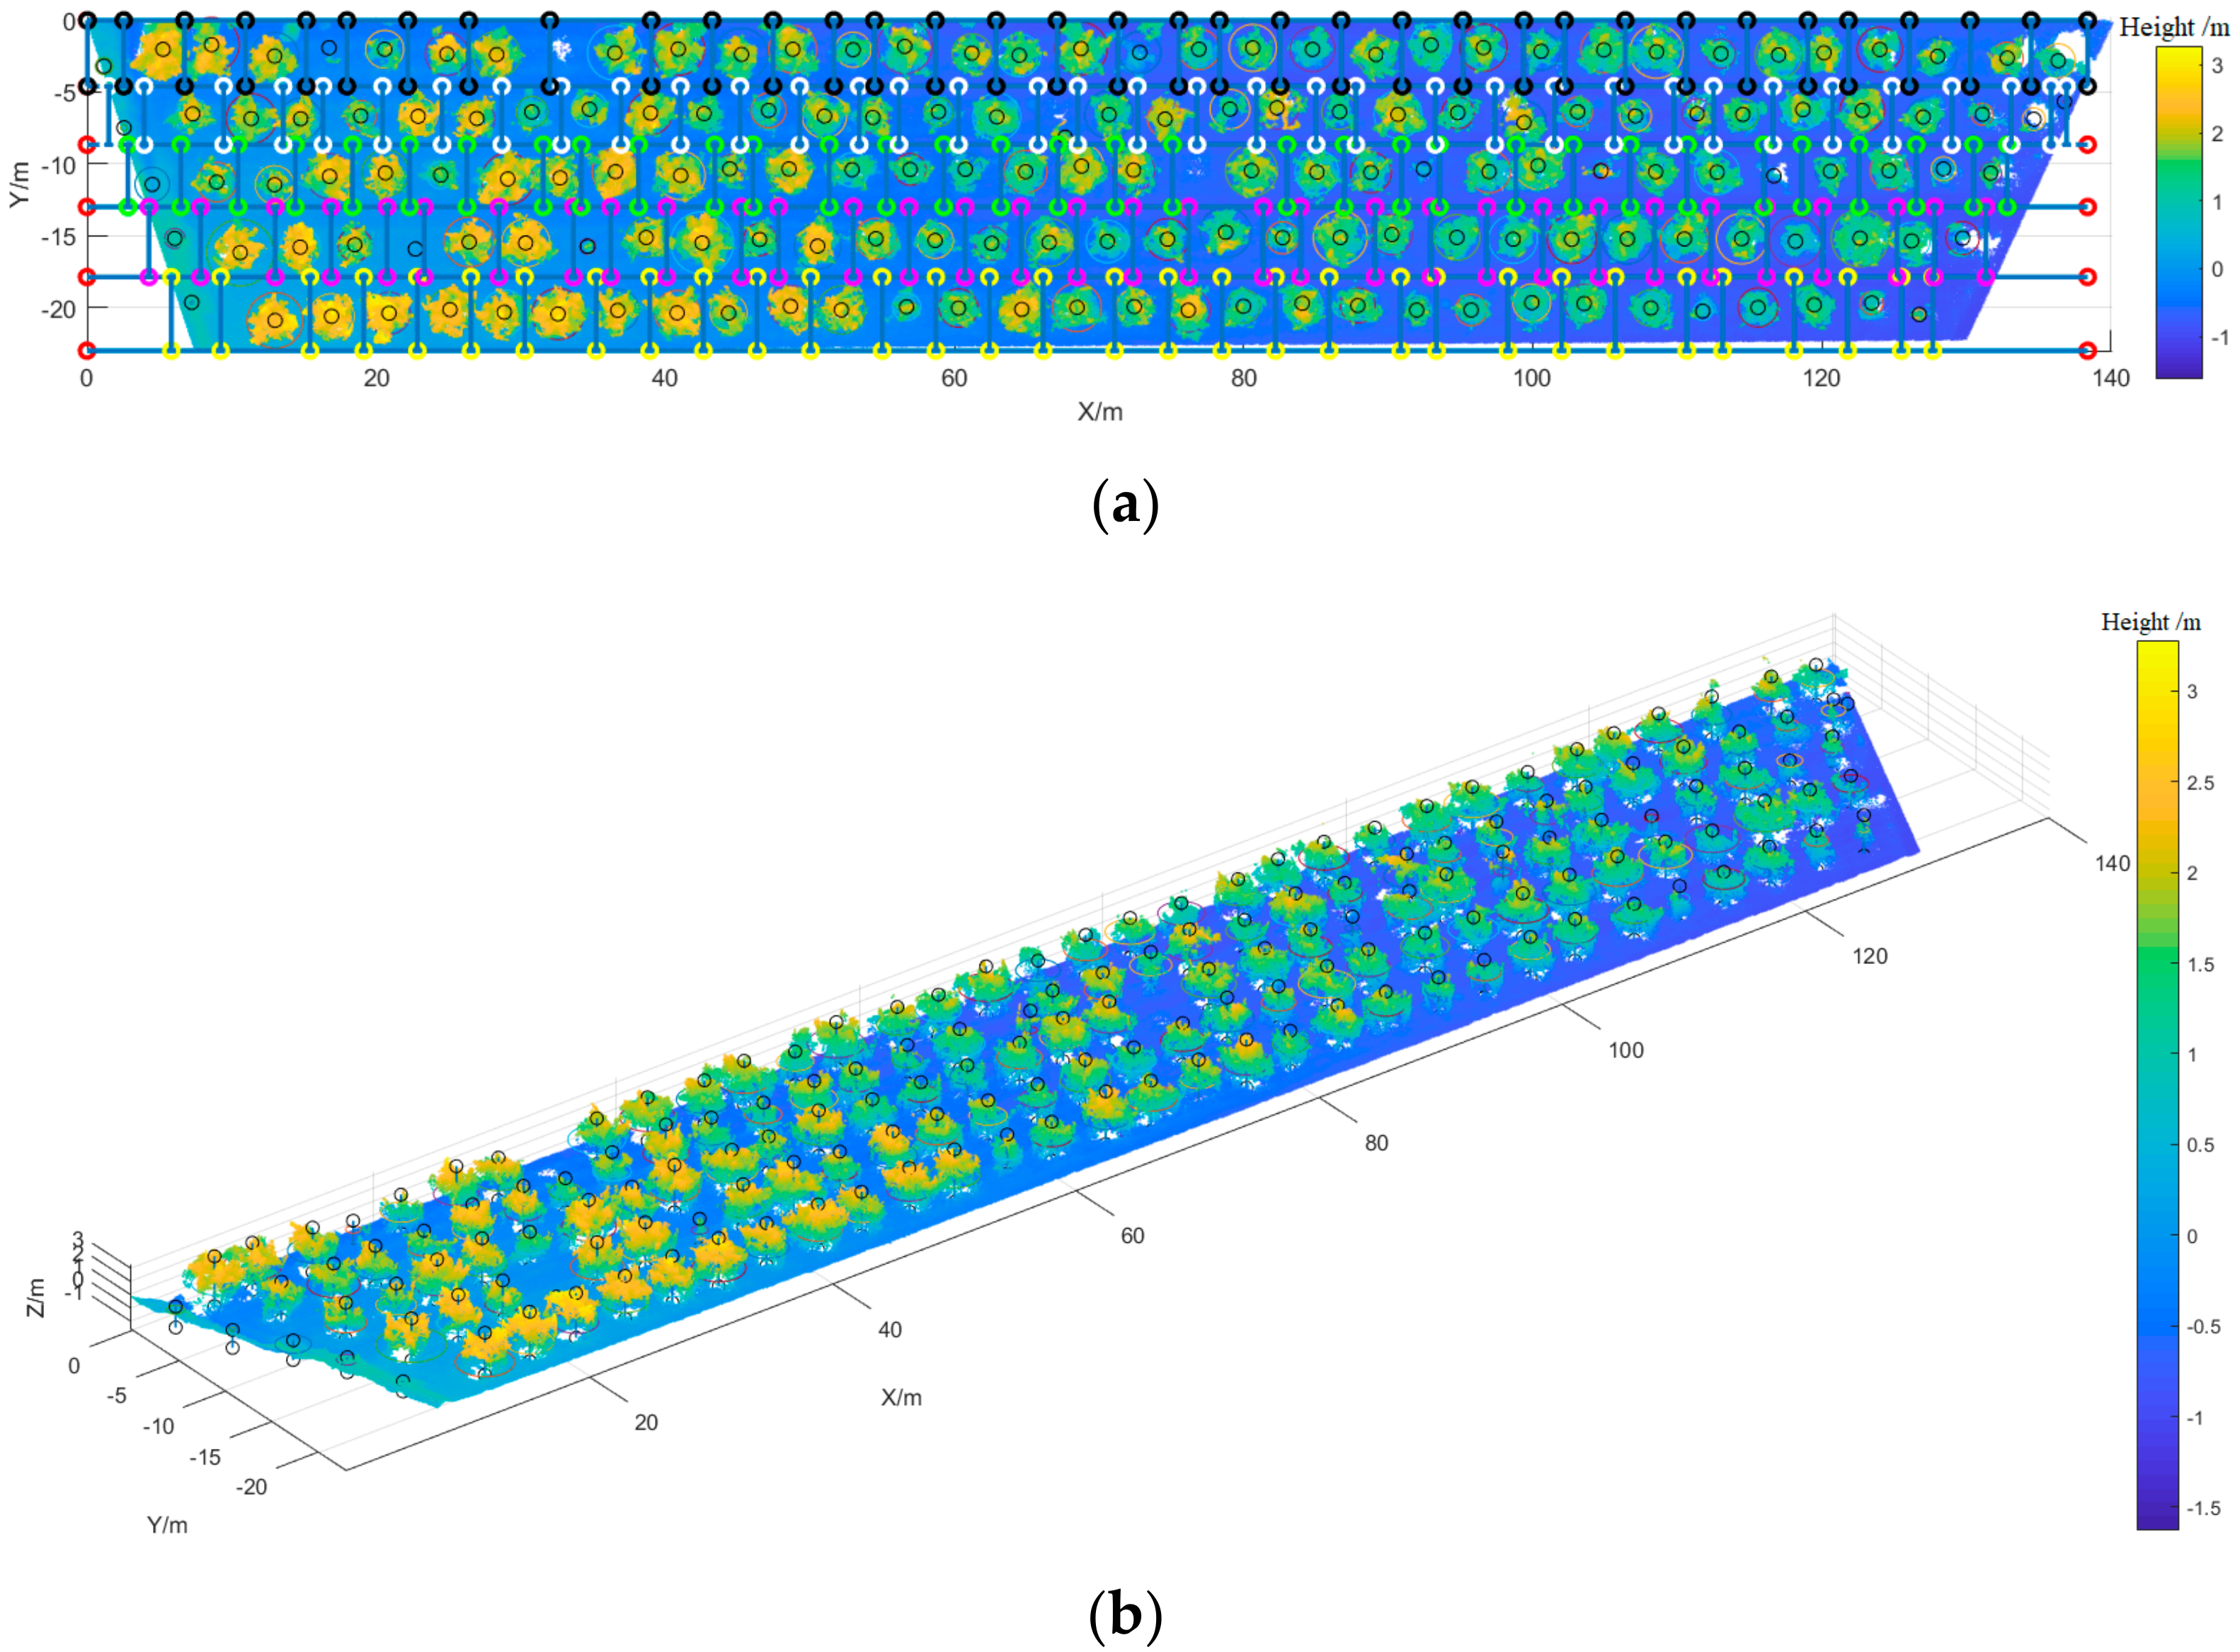
In Figure 7a, all the canopy-circumscribed equivalent circles are marked on the XOY plane view of the orchard point-cloud model. Figure 7b shows the highest points, the lowest points, and the height lines of all trees as well as the circumscribed equivalent circles on the XOY plane view. In Figure 7c, the circumscribed ellipsoids of all apple trees in the orchard point-cloud model are marked.
3.3.2. Calculation Error Analysis of the 3D Point-Cloud Morphology of the Orchard Canopy
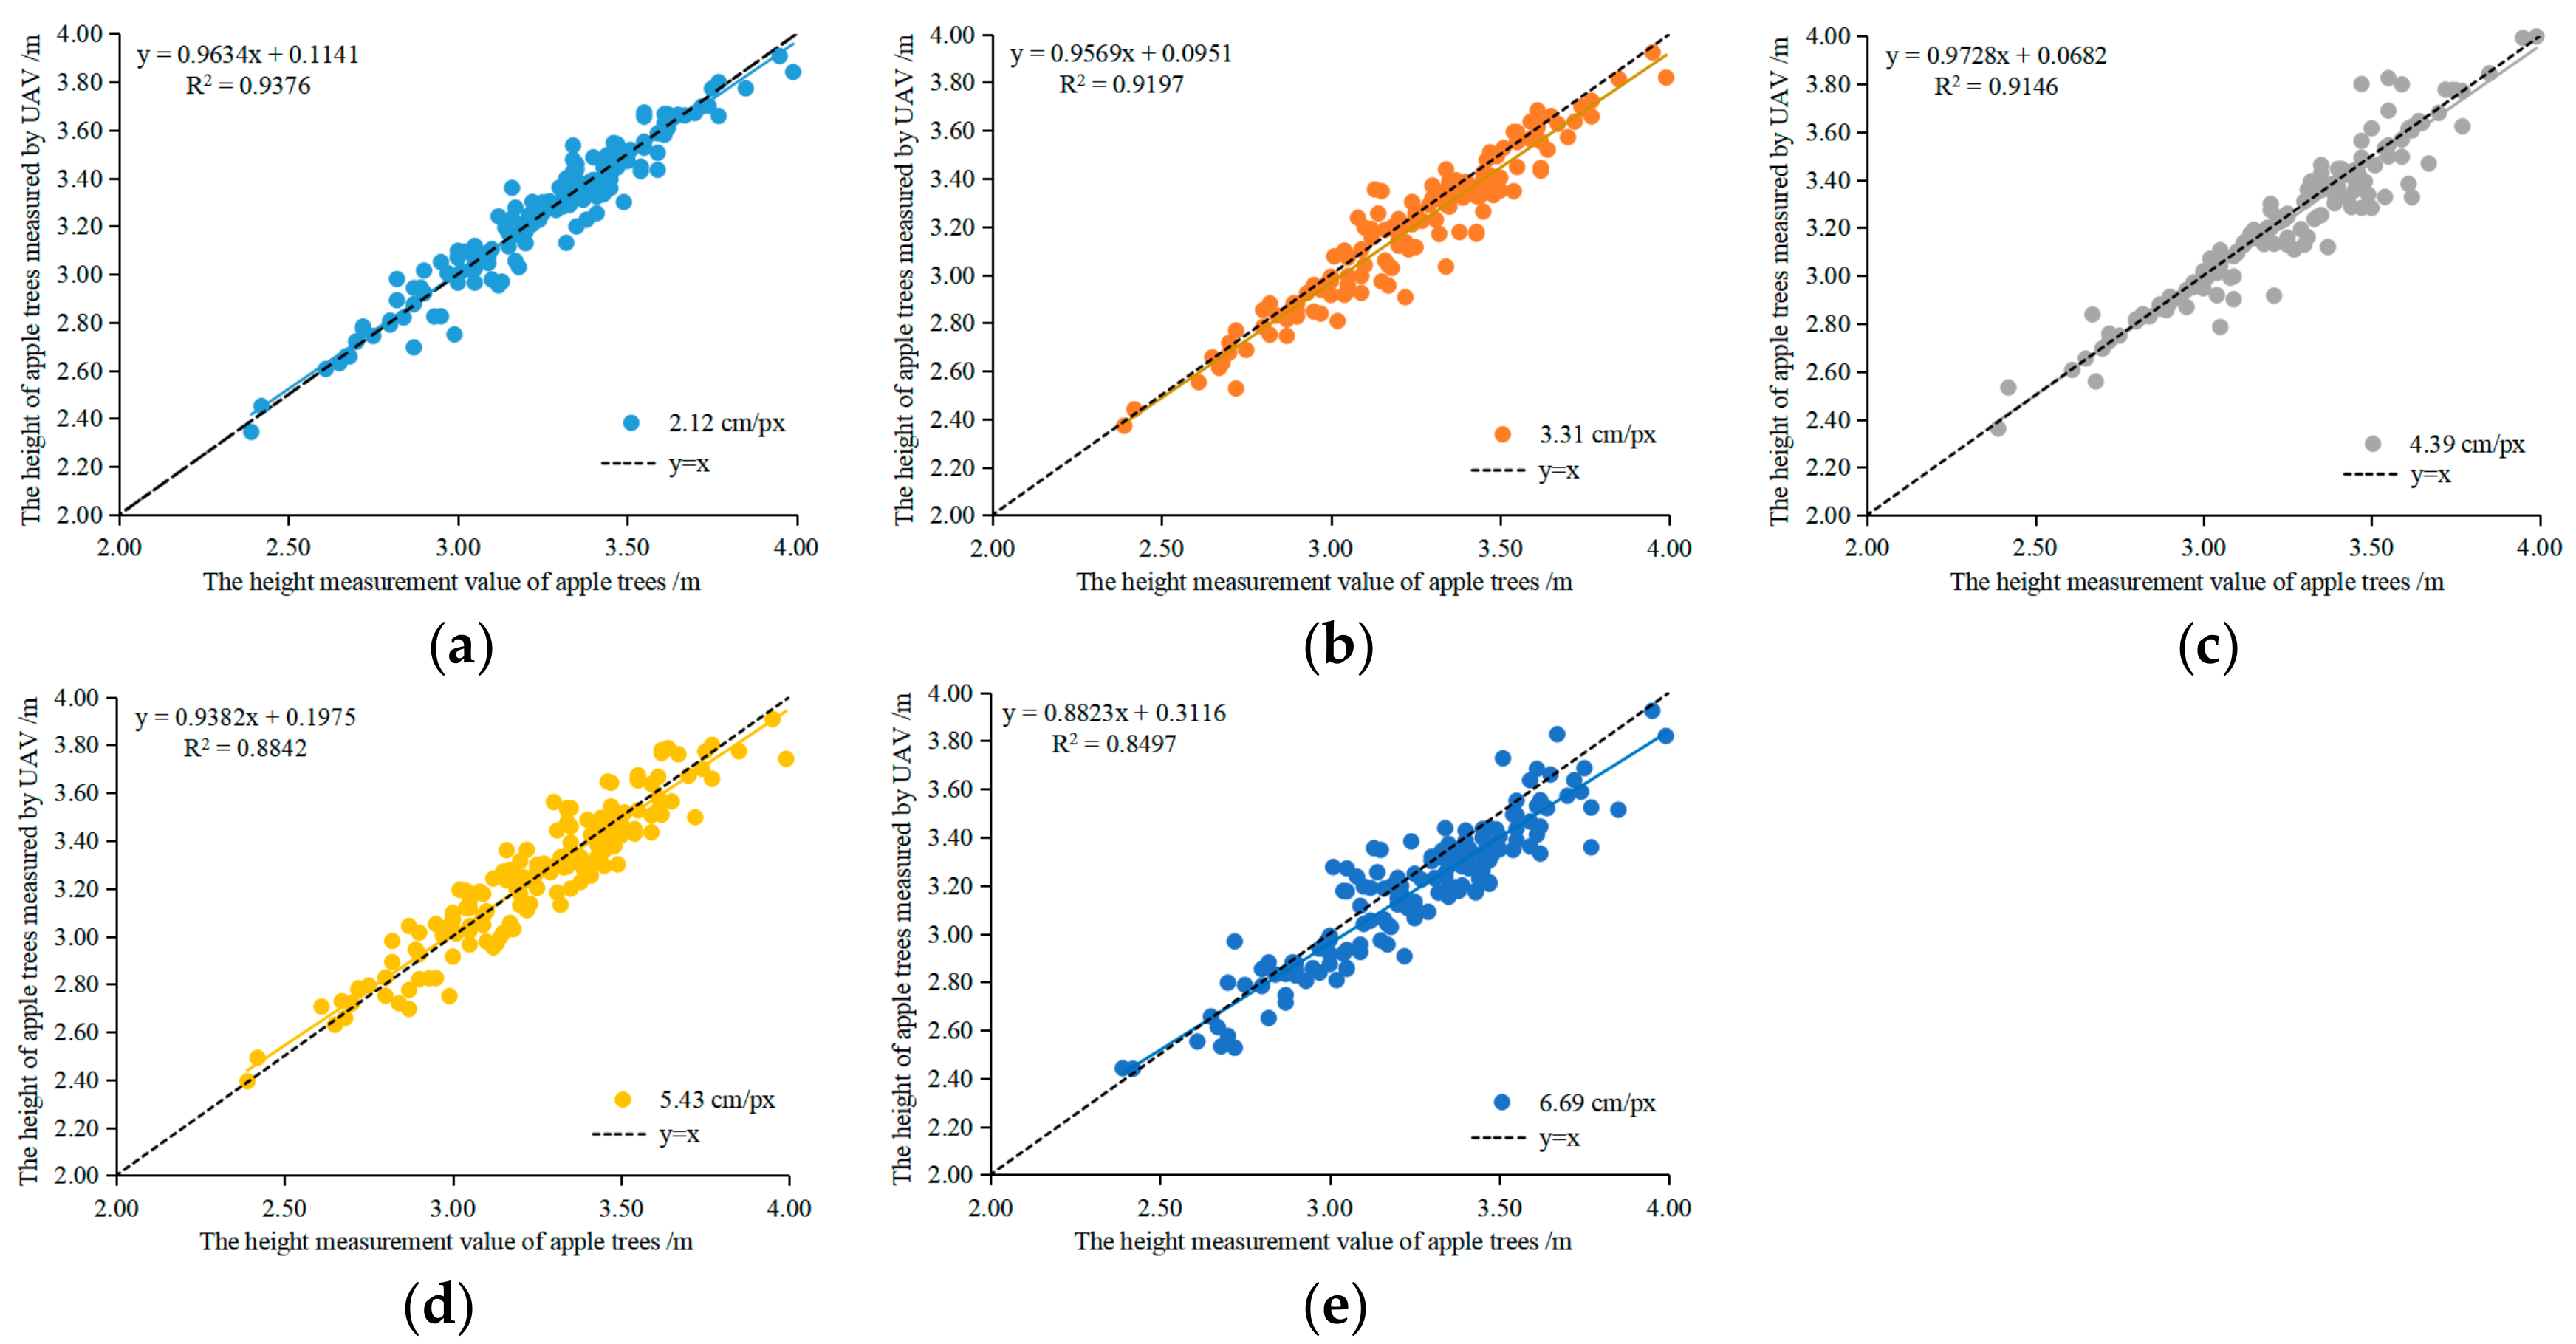
The canopy H, W, and V of all apple trees in the measurement area were calculated using the proposed 3D point-cloud morphological calculation method. The H was the vertical distance from the highest point of the apple tree canopy to the ground. The maximum width of the apple tree was measured many times; the maximum value was selected as the actual W. The actual V was calculated by using the ellipsoidal volume calculation formula based on the maximum circumscribed circumference and height of the tree canopy, which was measured manually. The calculated values and measured values of H, W, and V of all apple trees were compared and analyzed. Figure 8, Figure 9 and Figure 10 present the scatter plots showing the correlations between the values measured manually and estimated by UAV for the canopy height, width, and volume, respectively.
For the canopy H, when using a GSD of 2.13, 3.31, 4.39, 5.43, and 6.69 cm/px, the coefficient of determination, R2, between the measured value and the UAV-estimated value was 0.9376, 0.9197, 0.9146, 0.8842, and 0.8497, respectively; the RMSE was 0.08, 0.10, 0.09, 0.10, and 0.14 m, respectively; and the average relative error RADavg was 1.72%, 1.77%, 1.78%, 2.67%, and 3.42%, respectively. Compared with other field plants, such as sorghum and maize [20,23], using a UAV to measure the height information of the apple tree canopy, the correlation between the measured value and the actual value was more significant, and the relative error was smaller, mainly because the age of apple trees was 8 to 9 years in this study, the canopy volume of the apple trees was larger, and the leaves were more dense, thus making it more suitable to use UAV measurement. Compared with the measure method of fruit tree canopy information by Digital Terrain Model (DTM) or Digital Surface Model (DSM) [24], using a 3D point-cloud model to extract the height information of fruit trees has a higher measurement accuracy. However, very few studies have investigated fruit trees aged 1 to 3 years using the UAV measure method, mainly because the canopy of fruit trees has fewer branches and leaves, and the structure is relatively sparse, so it is not suitable to use UAV for measurement.
For the canopy W, when using a GSD of 2.13, 3.31, 4.39, 5.43, and 6.69 cm/px, the R2 between the measured value and the UAV-estimated value was 0.9492, 0.9171, 0.8760, 0.8648, and 0.8103, respectively; the RMSE was 0.12, 0.15, 0.18, 0.19, and 0.23 m, respectively; and the RADavg was 2.18%, 2.97%, 3.54%, 3.83%, and 4.92%, respectively. The canopy width of an apple tree is the largest width of the projection area under the top view of the UAV. The measurement accuracy of the apple tree canopy width based on the 3D point-cloud model is similar to the method of extracting the canopy width information of the apple tree based on DTM and DSM [24]. Compared with the method by the Kinect sensor to measure the canopy width, when GSD was 2.13 to 4.39 cm/px, the width measurement accuracy of fruit trees was similar, but with the increase of GSD, the point cloud density of the fruit trees decreases, resulting in the measurement accuracy being lower than the measuring method using the Kinect sensor [25].
For the canopy V, when using a GSD of 2.13, 3.31, 4.39, 5.43, and 6.69 cm/px, the R2 between the measured value and the UAV-estimated value was 0.9148, 0.8560, 0.8469, 0.8314, and 0.8032, respectively; the RMSE was 1.41, 1.63, 1.64, 1.91, and 2.21 m3, respectively; and the RADavg was 7.90%, 8.28%, 11.90%, 12.61%, and 13.69%, respectively. In this study, the volume of the apple tree canopy was extracted based on the 3D point-cloud model of the orchard, and the measurement accuracy was lower than vehicle lidar [1,9], which was mainly due to the fact that the 3D point-cloud model of the orchard generated by pix4Dmapper could not fully express the morphological information of the lower half of the apple trees, but the 3D point-cloud model of the apple tree canopy could be accurately reconstructed by the vehicle lidar, so the volume measurement accuracy was higher. The canopy shape of apple trees is very complex, and the volume calculation method has a great influence on the results [26]. Generally, the outer surrounding volume is the canopy volume. In this study, the projection area of the canopy in the XOY plane, the height of canopy, and the height of trunk were integrated, and Equations (3–5) were used to estimate the volume of the apple trees, which reduced the influence of canopy noise on the volume calculation and improved the stability of the volume measurement.
The statistical results showed that the GSD had a significant impact on the accuracy and correlation of the 3D morphological calculation of the orchard point-cloud model. The R2 decreased and RMSE increased as the GSD increased, which might be attributed to the difference in the point cloud density caused by GSD, as the average point-cloud density decreased significantly as GSD increased.
The measurement discrepancy of the canopy W was larger than that of H, which might be explained by the larger error in the manual measurement. The canopy W refers to the maximum width, which is very difficult to identify manually; instead, it can be quickly identified and measured by UAV photogrammetry by searching for the distances between the boundary points as long as the point-cloud model and tree area segmentation are accurate. The largest measurement discrepancy of the canopy V value among the three parameters might be attributed mainly to the approximate canopy volume evaluation based on the circumscribed ellipsoid approach. The joint effects of the estimation errors of H and SXOY and the manual measurement error resulted in a relatively large discrepancy for the canopy V value.
4. Conclusions
Based on the orchard point-cloud model generated by a UAV photogrammetry system, the normal vectors of the ground fitted plane in the model were determined by sampling the ground point clouds in this study. Subsequently, after slope correction of the point-cloud map, a row and column detection method based on probability point-cloud density estimation was established to achieve rapid point-cloud segmentation. Finally, the height, width, and volume of the tree canopy were computed for a remote evaluation of the orchard canopy 3D morphology.
The results showed that when the GSD ranged from 2.13 to 6.69 cm/px, the row detection accuracy of the orchard point-cloud model was 100.00%. The column detection with RGPC preprocessing achieved a detection accuracy in the range of 90.86% to 98.20% and an error rate in the range of 3.84% to 6.83%. The column detection with NRGPC preprocessing had a detection accuracy in the range of 81.93% to 94.37%, and an error rate in the range of 7.53% to 16.30%. Regarding the correlations between the values measured manually and estimated by UAV photogrammetry, the coefficient of determination R2 was 0.8497 to 0.9376, RMSE was 0.08 to 0.14 m, and RADavg was 1.72% to 3.42% for the canopy height, H; R2 was 0.8103 to 0.9492, RMSE was 0.12 to 0.23 m, and RADavg was 2.18% to 4.92% for the canopy width, W; and R2 was 0.8032 to 0.9148, RMSE was 1.41 to 2.21 m3, and RADavg was 7.90% to 13.69% for the canopy volume, V.
The main problem of the orchard point-cloud model generated by UAV photogrammetry was that the point-cloud signals were dense on the XOY horizontal plane view but sparse on the side views. In addition, GSD directly affected the point cloud density of the orchard. Both factors can affect the accuracy of the 3D morphological characteristic parameters of an orchard canopy extracted using the subsequent steps. Therefore, improving the reconstruction accuracy of the orchard point-cloud model is a critical task that needs to be addressed.
The remote UAV photogrammetry for 3D orchard canopy morphology proposed in this study is suitable for remote evaluation of 3D canopy morphological parameters of modern standard orchards and can be expanded to various types of fruit trees. The point-cloud preprocessing method, rapid row and column detection method, and 3D point-cloud morphological calculation method developed in this study can provide a theoretical basis and technical support for orchard canopy estimation, which is of great significance for the intelligent management and control of modern standard orchards.
Author Contributions
Conceptualization, G.S. and X.W.; Methodology, G.S., X.W. and Y.D.; Software, G.S. and Y.S.; Validation, G.S., Y.D. and Y.S.; Formal Analysis, G.S. and W.L.; Investigation, G.S., W.L. and Y.D.; Writing—Original Draft Preparation, G.S. and Y.D.; Writing—Review and Editing, G.S., X.W. and Y.D.; Project Administration, X.W. and Y.D.; Funding Acquisition, G.S.
Funding
The authors acknowledge the financial support provided by the National Key R&D Program of China (Grant No. 2017YFD0701400), the Fundamental Research Funds for the Central Universities (Grant No. KYGX201703), and the Natural Science Foundation of Jiangsu Province (Grant No. BK20170727), and the Natural Science Foundation of Jiangsu Province (Grant No. BK20181315).
Acknowledgments
The authors also thank the editor and anonymous reviewers for providing helpful suggestions for improving the quality of this manuscript.
Conflicts of Interest
The authors have no conflict of interest to declare.
References
- Underwood, J.P.; Hung, C.; Whelan, B.; Sukkarieh, S. Mapping almond orchard canopy volume, flowers, fruit and yield using lidar and vision sensors. Comput. Electron. Agric. 2016, 130, 83–96. [Google Scholar] [CrossRef]
- Torres-Sánchez, J.; de Castro, A.I.; Peña, J.M.; Jiménez-Brenes, F.M.; Arquero, O.; Lovera, M.; López-Granados, F. Mapping the 3D structure of almond trees using UAV acquired photogrammetric point clouds and object-based image analysis. Biosyst. Eng. 2018, 176, 172–184. [Google Scholar] [CrossRef]
- Jiménez-Brenes, F.M.; López-Granados, F.; de Castro, A.I.; Torres-Sánchez, J.; Serrano, N.; Peña, J.M. Quantifying pruning impacts on olive tree architecture and annual canopy growth by using UAV-based 3D modelling. Plant Methods 2017, 13, 55. [Google Scholar] [CrossRef] [PubMed]
- Pforte, F.; Selbeck, J.; Hensel, O. Comparison of two different measurement techniques for automated determination of plum tree canopy cover. Biosyst. Eng. 2012, 113, 325–333. [Google Scholar] [CrossRef]
- Garcia-Ruiz, F.; Sankaran, S.; Maja, J.M.; Lee, W.S.; Rasmussen, J.; Ehsani, R. Comparison of two aerial imaging platforms for identification of huanglongbing-infected citrus trees. Comput. Electron. Agric. 2013, 91, 106–115. [Google Scholar] [CrossRef]
- Wang, Z.; Underwood, J.; Walsh, K.B. Machine vision assessment of mango orchard flowering. Comput. Electron. Agric. 2018, 151, 501–511. [Google Scholar] [CrossRef]
- Aasen, H.; Honkavaara, E.; Lucieer, A.; Zarco-Tejada, P. Quantitative remote sensing at ultra-high resolution with UAV spectroscopy: A review of sensor technology, measurement procedures, and data correction workflows. Remote Sens. 2018, 10, 1091. [Google Scholar] [CrossRef]
- Kim, J.Y.; Glenn, D.M. Multi-modal sensor system for plant water stress assessment. Comput. Electron. Agric. 2017, 141, 27–34. [Google Scholar] [CrossRef]
- Polo, J.R.R.; Sanz, R.; Llorens, J.; Arnó, J.; Escolà, A.; Ribes-Dasi, M.; Masip, J.; Camp, F.; Gràcia, F.; Solanelles, F.; et al. A tractor-mounted scanning LIDAR for the non-destructive measurement of vegetative volume and surface area of tree-row plantations: A comparison with conventional destructive measurements. Biosyst. Eng. 2009, 102, 128–134. [Google Scholar] [CrossRef]
- Jichen, C.; Xiu, W.; Jian, S.; Songlin, W.; Shuo, Y.; Chunjiang, Z. Development of real-time laser-scanning system to detect tree canopy characteristics for variable-rate pesticide application. Int. J. Agric. Biol. Eng. 2017, 10, 155–163. [Google Scholar] [CrossRef]
- Nguyen, T.T.; Vandevoorde, K.; Wouters, N.; Kayacan, E.; De Baerdemaeker, J.G.; Saeys, W. Detection of red and bicoloured apples on tree with an RGB-D camera. Biosyst. Eng. 2016, 146, 33–44. [Google Scholar] [CrossRef]
- Zarco-Tejada, P.J.; Diaz-Varela, R.; Angileri, V.; Loudjani, P. Tree height quantification using very high resolution imagery acquired from an unmanned aerial vehicle (UAV) and automatic 3D photo-reconstruction methods. Eur. J. Agron. 2014, 55, 89–99. [Google Scholar] [CrossRef]
- Bendig, J.; Yu, K.; Aasen, H.; Bolten, A.; Bennertz, S.; Broscheit, J.; Gnyp, M.L.; Bareth, G. Combining UAV-based plant height from crop surface models, visible, and near infrared vegetation indices for biomass monitoring in barley. Int. J. Appl. Earth Obs. Geoinform. 2015, 39, 79–87. [Google Scholar] [CrossRef]
- Suárez, L.; Zarco-Tejada, P.J.; González-Dugo, V.; Berni, J.A.J.; Sagardoy, R.; Morales, F.; Fereres, E. Detecting water stress effects on fruit quality in orchards with time-series PRI airborne imagery. Remote Sens. Environ. 2010, 114, 286–298. [Google Scholar] [CrossRef]
- Ishida, T.; Kurihara, J.; Viray, F.A.; Namuco, S.B.; Paringit, E.C.; Perez, G.J.; Takahashi, Y.; Marciano, J.J. A novel approach for vegetation classification using UAV-based hyperspectral imaging. Comput. Electron. Agric. 2018, 144, 80–85. [Google Scholar] [CrossRef]
- Gong, Y.; Duan, B.; Fang, S.; Zhu, R.; Wu, X.; Ma, Y.; Peng, Y. Remote estimation of rapeseed yield with unmanned aerial vehicle (UAV) imaging and spectral mixture analysis. Plant Methods 2018, 14, 70. [Google Scholar] [CrossRef] [PubMed]
- Yeom, J.; Jung, J.; Chang, A.; Maeda, M.; Landivar, J. Automated open cotton boll detection for yield estimation using unmanned aircraft vehicle (UAV) data. Remote Sens. 2018, 10, 1895. [Google Scholar] [CrossRef]
- Park, S.; Ryu, D.; Fuentes, S.; Chung, H.; Hernández-Montes, E.; O’Connell, M. Adaptive estimation of crop water stress in nectarine and peach orchards using high-resolution imagery from an unmanned aerial vehicle (UAV). Remote Sens. 2017, 9, 828. [Google Scholar] [CrossRef]
- Comba, L.; Biglia, A.; Aimonino, D.R.; Gay, P. Unsupervised detection of vineyards by 3D point-cloud UAV photogrammetry for precision agriculture. Comput. Electron. Agric. 2018, 155, 84–95. [Google Scholar] [CrossRef]
- Malambo, L.; Popescu, S.C.; Murray, S.C.; Putman, E.; Pugh, N.A.; Horne, D.W.; Richardson, G.; Sheridan, R.; Rooney, W.L.; Avant, R.; et al. Multitemporal field-based plant height estimation using 3D point clouds generated from small unmanned aerial systems high-resolution imagery. Int. J. Appl. Earth Obs. Geoinf. 2018, 64, 31–42. [Google Scholar] [CrossRef]
- Johansen, K.; Raharjo, T.; McCabe, M.F. Using multi-spectral UAV imagery to extract tree crop structural properties and assess pruning effects. Remote Sens. 2018, 10, 854. [Google Scholar] [CrossRef]
- Han, X.; Thomasson, J.A.; Bagnall, G.C.; Pugh, N.A.; Horne, D.W.; Rooney, W.L.; Jung, J.; Chang, A.; Malambo, L.; Popescu, S.C.; et al. Measurement and calibration of plant-height from fixed-wing UAV images. Sensors 2018, 18, 4092. [Google Scholar] [CrossRef] [PubMed]
- Jiang, S.; Jiang, W. Efficient SfM for oblique UAV images: From match pair selection to geometrical verification. Remote Sens. 2018, 10, 1246. [Google Scholar] [CrossRef]
- Graham, R.L. An efficient algorith for determining the convex hull of a finite planar set. Inf. Process. Lett. 1972, 1, 132–133. [Google Scholar] [CrossRef]
- Yang, H.; Wang, X.; Sun, G. Three-Dimensional morphological measurement method for a fruit tree canopy based on Kinect sensor self-calibration. Agronomy 2019, 9, 741. [Google Scholar] [CrossRef]
- Fernández-Sarría, A.; Martínez, L.; Velázquez-Martí, B.; Sajdak, M.; Estornell, J.; Recio, J.A. Different methodologies for calculating crown volumes of Platanus hispanica trees using terrestrial laser scanner and a comparison with classical dendrometric measurements. Comput. Electron. Agric. 2013, 90, 176–185. [Google Scholar] [CrossRef]
Figure 1.
Operating principle of the UAV canopy photogrammetry system for modern standard orchards.

Figure 2.
3D point-cloud model of the orchard (XOY plane view, GSD = 2.13 cm/px).

Figure 3.
Ground-normal vector estimation of the orchard point-cloud model.

Figure 4.
Slope correction of the orchard point-cloud model. (a) Orchard point-cloud model before correction (XOY plane view); (b) Orchard point-cloud model after correction (XOY plane view); (c) Orchard point-cloud model before correction (YOZ plane view); (d) Orchard point-cloud model after correction (YOZ plane view).

Figure 5.
Row and column detection of the orchard point-cloud model. (a) Point-cloud probability density estimation of rows; (b) Point-cloud probability density estimation of columns.
Figure 5.
Row and column detection of the orchard point-cloud model. (a) Point-cloud probability density estimation of rows; (b) Point-cloud probability density estimation of columns.


Figure 6.
Morphological calculation of the fruit canopy projection on the XOY plane. (a) XOY convex hull boundary; (b) Distance set of the boundary points; (c) Canopy width; (d) Equivalent circle of the canopy projection.
Figure 6.
Morphological calculation of the fruit canopy projection on the XOY plane. (a) XOY convex hull boundary; (b) Distance set of the boundary points; (c) Canopy width; (d) Equivalent circle of the canopy projection.


Figure 7.
Orchard canopy detection. (a) Circumscribed equivalent circles of the orchard canopy projections on the XOY plane; (b) Orchard canopy height detection; (c) Orchard canopy volume detection.
Figure 7.
Orchard canopy detection. (a) Circumscribed equivalent circles of the orchard canopy projections on the XOY plane; (b) Orchard canopy height detection; (c) Orchard canopy volume detection.


Figure 8.
Canopy height values measured manually and estimated by UAV. (a) GSD = 2.12 cm/px; (b) GSD = 3.31 cm/px; (c) GSD = 4.39 cm/px; (d) GSD = 5.43 cm/px, GSD = 6.69 cm/px.
Figure 8.
Canopy height values measured manually and estimated by UAV. (a) GSD = 2.12 cm/px; (b) GSD = 3.31 cm/px; (c) GSD = 4.39 cm/px; (d) GSD = 5.43 cm/px, GSD = 6.69 cm/px.

Figure 9.
Canopy width values measured manually and estimated by UAV. (a) GSD = 2.12 cm/px; (b) GSD = 3.31 cm/px; (c) GSD = 4.39 cm/px; (d) GSD = 5.43 cm/px; (e) GSD = 6.69 cm/px.
Figure 9.
Canopy width values measured manually and estimated by UAV. (a) GSD = 2.12 cm/px; (b) GSD = 3.31 cm/px; (c) GSD = 4.39 cm/px; (d) GSD = 5.43 cm/px; (e) GSD = 6.69 cm/px.

Figure 10.
Canopy volume values measured manually and estimated by UAV. (a) GSD = 2.12 cm/px; (b) GSD = 3.31 cm/px; (c) GSD = 4.39 cm/px; (d) GSD = 5.43 cm/px; (e) GSD = 6.69 cm/px.
Figure 10.
Canopy volume values measured manually and estimated by UAV. (a) GSD = 2.12 cm/px; (b) GSD = 3.31 cm/px; (c) GSD = 4.39 cm/px; (d) GSD = 5.43 cm/px; (e) GSD = 6.69 cm/px.


Table 1.
Summary of parameters used for SFM processing in Pix4Dmapper.
| Pix4Dmapper | Parameters |
|---|---|
| Coordinate Systems | Image Coordinate System: WGS 84 (EGM 96 Geoid); Unit: m Output Coordinate System: WGS 84 / UTM zone 51N (EGM 96 Geoid) |
| Initial Processing | Keypoint image scale: Full Calibration Method: Standard Internal Parameter Optimization: All External Parameter Optimization: All Rematch: Auto, yes |
| Point cloud densification | Image scale-down: 1/2 of original image size Point density: Optimal Minimum Number of Matches: 3 Output format: PLY |
Table 2.
Column detection results of the orchard point-cloud model.
| Segmentation Method | Row | Number of Trees | Cr/% | Er/% | ||||||||
|---|---|---|---|---|---|---|---|---|---|---|---|---|
| GSD = 2.13 | GSD = 3.31 | GSD = 4.39 | GSD = 5.43 | GSD = 6.69 | GSD = 2.13 | GSD = 3.31 | GSD = 4.39 | GSD = 5.43 | GSD = 6.69 | |||
| RGPC | 1 | 30 | 100.00 | 100.00 | 100.00 | 93.33 | 100.00 | 3.33 | 3.33 | 0.00 | 6.67 | 3.33 |
| 2 | 31 | 100.00 | 93.55 | 93.55 | 96.77 | 96.77 | 3.23 | 6.45 | 6.45 | 6.45 | 6.45 | |
| 3 | 32 | 96.88 | 93.75 | 93.75 | 93.75 | 81.25 | 6.25 | 3.12 | 3.12 | 3.12 | 12.50 | |
| 4 | 33 | 100.00 | 87.88 | 93.94 | 100.00 | 93.94 | 6.06 | 9.09 | 6.06 | 0.00 | 3.03 | |
| 5 | 34 | 94.11 | 85.29 | 85.29 | 94.12 | 82.35 | 5.88 | 8.82 | 5.88 | 2.94 | 8.82 | |
| AVG | 98.20 | 92.09 | 93.31 | 95.59 | 90.86 | 4.95 | 6.16 | 4.30 | 3.84 | 6.83 | ||
| NRGPC | 1 | 30 | 96.67 | 100.00 | 86.67 | 86.67 | 86.67 | 10.00 | 3.33 | 16.67 | 20.00 | 16.67 |
| 2 | 31 | 100.00 | 93.55 | 93.55 | 93.55 | 77.42 | 3.23 | 6.45 | 3.22 | 12.90 | 19.35 | |
| 3 | 32 | 81.25 | 78.13 | 81.25 | 71.88 | 90.63 | 12.50 | 18.75 | 12.25 | 21.88 | 9.38 | |
| 4 | 33 | 93.94 | 84.85 | 87.88 | 87.88 | 66.67 | 6.06 | 9.09 | 9.09 | 12.12 | 27.27 | |
| 5 | 34 | 100.00 | 85.30 | 82.35 | 91.18 | 88.24 | 5.88 | 8.82 | 11.76 | 8.82 | 8.82 | |
| AVG | 94.37 | 88.37 | 86.34 | 86.23 | 81.93 | 7.53 | 9.29 | 10.60 | 15.14 | 16.30 | ||
© 2019 by the authors. Licensee MDPI, Basel, Switzerland. This article is an open access article distributed under the terms and conditions of the Creative Commons Attribution (CC BY) license (http://creativecommons.org/licenses/by/4.0/).
Share and Cite
MDPI and ACS Style
Sun, G.; Wang, X.; Ding, Y.; Lu, W.; Sun, Y. Remote Measurement of Apple Orchard Canopy Information Using Unmanned Aerial Vehicle Photogrammetry. Agronomy 2019, 9, 774. https://0-doi-org.brum.beds.ac.uk/10.3390/agronomy9110774
AMA Style
Sun G, Wang X, Ding Y, Lu W, Sun Y. Remote Measurement of Apple Orchard Canopy Information Using Unmanned Aerial Vehicle Photogrammetry. Agronomy. 2019; 9(11):774. https://0-doi-org.brum.beds.ac.uk/10.3390/agronomy9110774
Chicago/Turabian StyleSun, Guoxiang, Xiaochan Wang, Yongqian Ding, Wei Lu, and Ye Sun. 2019. "Remote Measurement of Apple Orchard Canopy Information Using Unmanned Aerial Vehicle Photogrammetry" Agronomy 9, no. 11: 774. https://0-doi-org.brum.beds.ac.uk/10.3390/agronomy9110774
Note that from the first issue of 2016, this journal uses article numbers instead of page numbers. See further details here.