Article

Assessment of Irrigation Needs in Sugar Beet (Beta vulgaris L.) in Temperate Climate of Kujawsko-Pomorskie Region (Poland)

by
Renata Kuśmierek-Tomaszewska
*,
Jacek Żarski
and
Stanisław Dudek
University of Science and Technology in Bydgoszcz, 85-029 Bydgoszcz, Poland
*
Author to whom correspondence should be addressed.
Submission received: 21 October 2019 / Revised: 21 November 2019 / Accepted: 25 November 2019 / Published: 28 November 2019
(This article belongs to the Section Water Use and Irrigation)

Abstract

:
The primary purpose of this work was to assess the need for irrigation in sugar beet cultivated in the temperate climate of the Kujawsko-Pomorskie region of Poland based on meteorological data from the period 1981–2010. The work was also aimed at determining the tendency of changes in the frequency and intensity of droughts during the period of high water needs for sugar beets (spanning July–August) and confirming the hypothesis that agricultural drought may be identified based on the indicator of meteorological drought—Standardized Precipitation Index (SPI). The occurrence of meteorological droughts amounted to 26.7–40.0%, depending on location. No significant trend of increasing dryness was found; however, quite the opposite, an upward tendency was identified, which indicates an improvement of precipitation conditions over time. It was found that sugar beet production in a temperate climate is carried out in the conditions of precipitation deficits, which amount to an average of 32–49 mm and a maximum of 112–173 mm in July–August, but the deficits showed neither significant nor targeted changes with time. A strong, significant relationship between meteorological (SPI) and agricultural (Pdef) drought indicators allows for a determination of sugar beet irrigation needs solely based on information on normalized precipitation values (SPI).

1. Introduction

Sugar beet is a crop grown on almost all continents, which tolerates different types of soil and climatic conditions. In 2017, the area of the world that cultivated this plant exceeded 4.8 million hectares, of which 69% was within Europe [1]. Poland is the third-largest producer of sugar beets in the European Union with the sugar production of 2.3 Mt per year and 18 operating sugar factories according to the European Association of Sugar Manufacturers statistics (CEFS) [2]. In 2017, the sugar yield per hectare in the EU increased to 12.92 t/ha (11.4%) compared to the results in the previous year, 2016, which may be due to the effect of the breeding progress [3] or cultivar adaptation to environmental conditions [4], or irrigation treatment used in production [5,6]. In the light of predicting climate change, water is becoming a limited resource in some regions of our planet; therefore, one has to keep in mind that the key to ensure the best crop performance is to use water in agricultural production efficiently and only when it is needed, avoiding unnecessary water waste. Increasing demand for water not only in agriculture but also in industry, as well as the spatial and temporal variability of atmospheric precipitation, has provoked a discussion regarding the need for irrigation in sugar beet crops in the transitional climate in Poland.
Located in the northern part of central Poland, the region of Kujawsko-Pomorskie is the second-largest producer of sugar beets in the country. In the years 2011–2017, sugar beets were cultivated here within an area of about 40 thousand hectares, representing 19.5% of the total domestic acreage [7]. The average sugar beet yields in Poland in 2017 amounted to 67.9 tons per hectare and were higher by 1.4 tons per hectare (2.1%) than what was obtained in 2016, and higher by 9.0 tons per hectare (15.3%) compared to the average yield for 2011–2015. One of the highest yields was obtained in the region of Kujawsko-Pomorskie (71.0 tons per hectare).
Sugar beet production in the Kujawsko-Pomorskie region is exposed to climatic risk resulting from the frequent occurrence of droughts during the period of increased water needs for the crop. Even in years favorable for sugar beet cultivation, water shortages may occur in the summer months, when the air temperature, water saturation deficit, and thus the transpiration process, are high. As a result of adverse weather conditions, yield limits occur due to water scarcity, in particular on light soils (which constitute over 65% of the arable area in the region), and furthermore the predicted climate change is expected to strengthen this effect in the future due to warming, changing precipitation patterns, and greater frequency of some extreme events [8,9,10]. As an example, the drought recorded in the region of Kujawsko-Pomorskie in 2015 caused a decrease in root yield by 12.7 t/ha, which is 21% lower, compared to the average yield of the period 2011–2017. The results of the field experiment reported by Freckleton et al. [11] indicate that in the absence of irrigation the sugar beet yield is mainly dependent on the air temperature in July and August and on the amount of precipitation during this period.
An active way of minimizing losses caused by drought during the period of high water needs for sugar beet, as well as increasing and stabilizing the average yield of the crop, is the use of irrigation in the cultivation process [12,13]. Since droughts in Poland occur irregularly, irrigation is not a basic agrotechnical treatment but is supplemental. For this reason, it is extremely important to precede the farmers’ investment in the irrigation system with a comprehensive assessment of the advisability of using this treatment.
According to the theory of climate change, the main symptom of which is an increase in air temperature, the occurrence of droughts in temperate latitudes will increase as well [14]. According to research carried out by Szyga-Pluta [15], based on a series of meteorological data covering the 30 measuring points of the Institute of Meteorology and Water Management–National Research Institute (IMGW–PIB), a statistically significant tendency (with a p-level of 0.1) for an increase of dryness was observed during the growing season in Poland. However, its relation to droughts was determined based on the k-Sielianinov coefficient, derived from atmospheric precipitation totals and air temperature value. In the case of droughts based on indicators computed based only on atmospheric precipitation totals (Standardized Precipitation Index (SPI), Relative Precipitation Index RPI), there was no significant long-term tendency of change, which means no threat of a growing water deficit. The most current knowledge confirms that atmospheric precipitation during the growing season in Poland does not show significant changes with time [16,17,18].
Since precipitation is the primary driver of meteorological drought, there are numerous indicators used for drought monitoring based solely on atmospheric precipitation data [19]. One that has gained importance in recent years as a potential drought indicator that permits comparisons across space and time is the Standardized Precipitation Index (SPI), which expresses the actual atmospheric precipitation as a standardized departure concerning precipitation probability distribution [20]. Concerns have been raised about the utility of an index based solely on precipitation data as a sufficient measure of a plant’s irrigation needs, as it does not deal with changes in evapotranspiration [21] or soil moisture data, which yield good results since soil moisture is directly related to plant condition [22,23]. However, in some regions, it may be impossible to gain detailed meteorological information, or some data may not be available as multi-annual records. Therefore, due to widespread access to data sources, SPI is commonly used in drought monitoring in different types of climate [24,25,26,27]. The primary purpose of this paper, carried out as part of the research strategy regarding the ongoing changes in the macroclimate of the Kujawsko-Pomorskie region, was to assess the need for irrigation in sugar beet crops based on meteorological conditions in the reference period of 1981–2010. The work was also aimed at determining the tendency of changes in the frequency and intensity of droughts during the period of high water needs for sugar beet (spanning July–August) in the studied years, confirming the hypothesis that there is a strong and significant relationship between indices identifying two types of drought: meteorological (determined on the basis of the SPI) and agricultural (estimated on the basis of rainfall deficits Pdef).
The expected audiences are not limited to regional or state levels but also include international communities that are interested in learning about climate change in this part of Europe or are planning to make some investments in Polish agriculture. Moreover, the prospective development of irrigation systems in the given area will impact water resources and their management in this region in the future. In our opinion, the results of this study may encourage farmers, officials, and decision-makers to think in a far-reaching way about water policy and water management in this area.

2. Materials and Methods
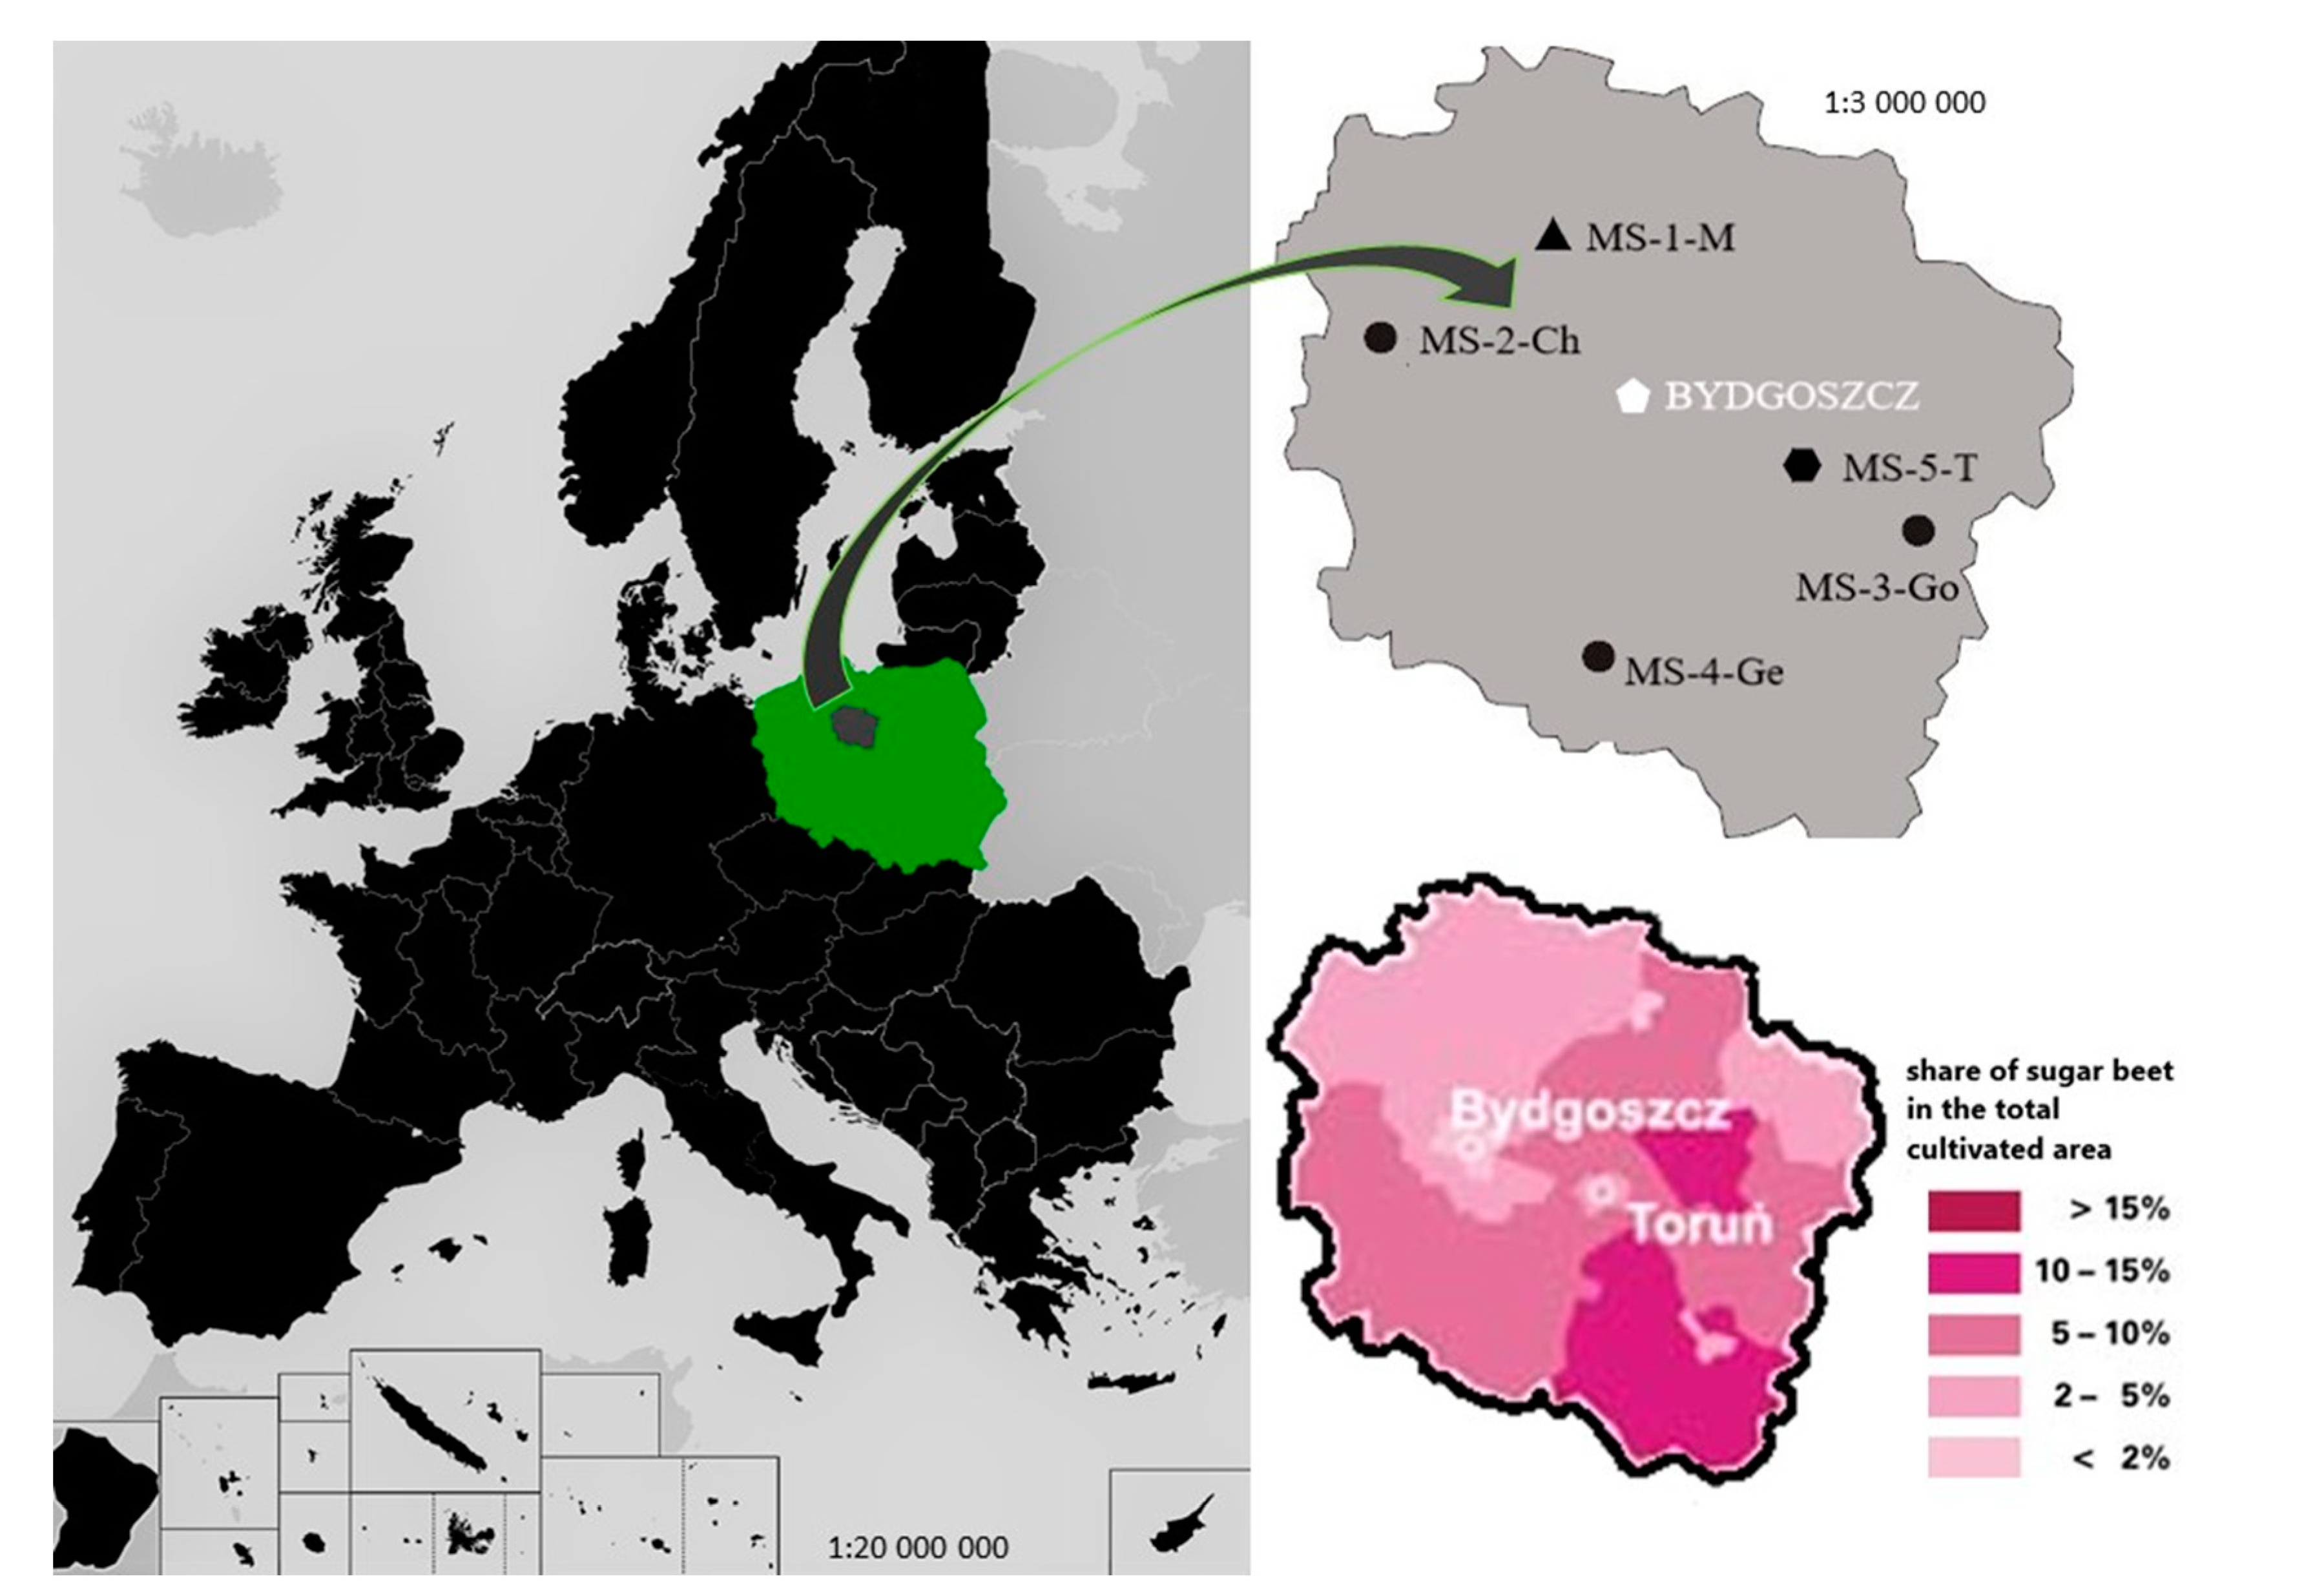
2.1. Study Area

The region of Kujawsko-Pomorskie has a surface of 18,000 km2, which is comparable to the area Slovenia or half of Switzerland. It has two capitals: Bydgoszcz (governor’s office) and Toruń (local government office) (marked in Figure 1 by a hexagon and a pentagon shape, respectively). The province is situated in the central part of Poland on both sides of the longest Polish river, the Vistula. Agriculture is a significant part of the economy and the overall area of farmland is 1036.6 thousand hectares (out of which 87.3% is arable land) [28]. The cultivated area of sugar beet in the region Kujawsko-Pomorskie has been changing during recent years. It amounted to 57.7 Kha in 2000, 48.8 in 2005, 38.4 in 2010, 44.8 in 2017, and increased in 2018 by 3.1% compared to the previous year. An average yield varies by year depending on precipitation patterns; e.g., in the 2018 dry growing season, the average yield of sugar beet amounted to 59.9 t/ha, which constituted 88.2% of the yield in 2017 when atmospheric precipitation was high and was evenly distributed [29]. Types of soils occurring in the region are fairly homogeneous: Luvisols and Cambisols dominate in the central and northern parts of the area, while in the south Luvisols and Phaeozems occur [30]. Agricultural production in the Kujawsko-Pomorskie region is to a great extent subject to climate risk, resulting from the substantial variability of atmospheric precipitation and thermal conditions within time [31].

2.2. Sources of Meteorological Data

A series of 30-year meteorological measurements of atmospheric precipitation and air temperature in the period of high water needs of sugar beet, spanning July and August, were taken for the research. The data were derived from 5 meteorological stations (MS), spread throughout the region of Kujawsko-Pomorskie (Figure 1). Three of them belong to local branches of the Central Research Centre for Cultivar Testing located in Chrząstowo (MS–2–Ch), Głodowo (MS–3–Go), and Głębokie (MS–4–Ge) (marked in Figure 1 by a dot shape). The fourth station is in Mochełek (MS–1–M) located at the Research Station of UTP University of Science and Technology in Bydgoszcz (marked by a triangle). The fifth station is in Toruń (MS–5–T) operating in the national network of the Institute of Meteorology and Water Management (IMGW–PIB) (marked by a hexagon). To check the homogeneity of precipitation data from the four measuring points, they were compared to the reference station in Toruń (MS–5–T). Stations in Chrząstowo (MS–2–Ch) and Mochełek (MS–1–M) represent the northern part of the region; the measuring point in Toruń (MS–5–T) depicts the center and the other two points located in Głodowo (MS–3–Go) and Glębokie (MS–4–Ge) represent the southern part of the study area (Figure 1). The geographical description of the listed sites is presented in the Results section. It should be emphasized that the measuring points are in rural areas where the impact of urban anthropogenic factors are minimal. To ensure the homogeneity of the meteorological data series, following the recommendations of the World Meteorological Organisation (WMO), precipitation totals of the 30-year normal period (1981–2010) were taken for the statistical analyses. We also ascertained that the rules of comparability of meteorological measurements and observations imposed by WMO were respected during the whole measuring period. It is important to verify it since failure to comply with those rules may often lead to wrong conclusions, e.g., due to the lack of comparability of measurement sites, measuring instruments, or data averaging procedures [32].

2.3. Meteorological and Agricultural Drought Indices

Meteorological droughts in sugar beet were identified based on the standardized precipitation index (SPI) [20,35]. The index was calculated separately for each location; 30–year data series of two-month precipitation totals (P) were normalized by the transforming function:
f(P) = (P)1/3.
Based on the SPI values, the drought level in the period of high water needs in sugar beet was determined according to the scale of precipitation monitoring in Poland, run by the Institute of Technology and Life Sciences (Table 1) [36].
The SPI allows the ability to identify meteorological droughts solely based on precipitation data, while, to determine the agricultural drought (aD) in crops, values of actual precipitation deficiencies (Pdef) concerning indicators of their precipitation needs (Popt) are needed. We used the values of precipitation needs of sugar beet elaborated by Dzieżyc et al. [37] for 10-day periods for 7 catchment areas in Poland and different types of soils: light, medium, and heavy. The region of Kujawsko-Pomorskie is located within two catchment areas of the Warta and Noteć Rivers (CA_III) and the middle part of the Vistula River (CA_IV). Partial and total precipitation needs (Popt) for these catchment areas in the period of high water needs of sugar beet (spanning July and August) cultivated on medium soil are presented in Table 2. Depending on thermal conditions, some corrections were necessary. In months when air temperature differed from the multi-annual average (which is 17.7 °C in July and 17.2 °C in August), precipitation needs on medium soils were increased or reduced by 3 mm for every 1 °C above or below the average.

2.4. Statistical Analysis

The statistical methods applied in this analysis are commonly used in agro-climatological studies [38]: analysis of regression and correlation (Pearson’s coefficient at the p-level of 0.05) and analysis of trends. Data analysis was performed with The Analysis ToolPak of Microsoft Excel 2010 add-in program data analysis tools.

3. Results and Discussion

Air temperature in July and August in the analyzed 30-year period (1981–2010) in the region was characterized by the variability typical for temperate warm, transitory climatic zones. Monthly temperatures in those two months mostly exceeded the long-term averages for this area (1951–1980), which are 17.7 °C in July and 17.2 °C in August. It is worth noting that the negative deviation concerning average multi-annual temperature accounted for an average of 33% in July and 26% in August (Figure 2). Their frequency depended slightly on the location: in July, negative deviations occurred 9 times in MS–4–Ge and 10 times in the other three places. In August, the negative deviations from the average occurred 7 times in MS–4–Ge and MS–1–M, 8 times in MS–2–Ch, and 9 times in MS–3–Go. Summarizing all the above, in the analyzed period, air thermal conditions exceeding the multi-annual averages prevailed. But, although upward trends were found at all locations in analyzed months, Pearson’s correlation coefficients did not exceed 0.2, which means they are not significant at a p-level of 0.05.
During the period of high water needs for the sugar beet (spanning July–August) the average multi-annual precipitation totals of 1981–2010 in the considered locations of the region were characterized by a spatial variability of 19.5%. The lowest precipitation was recorded in the northern part of the region in the Krajeńskie Lake District (MS–1–M, MS–2–Ch), and the highest in the center (MS–5–T) and the southern part, in MS–4–Go located in the Płońsk Upland (100 m asl). The average multi-annual precipitation in the period of July–August was an average of 138.2 mm for all locations (Table 3). Comparing this result with the data presented by other authors [17,18,39], one can confirm that the region is one of the areas with the lowest precipitation in Poland.
Attention should be paid to the fact that the time variability of July and August precipitation totals in the analyzed period was noticeably greater than their spatial variability. This is proved by both the extreme precipitation totals, as well as high coefficients of variation, which, depending on the place, ranged from 31.7% to 45.3% (Table 3). Moreover, Błażejczyk et al. [39] confirm the weak stability of precipitation in the region of Kujawy, which is one of the causes of an unstable hydrological regime. The difference between maximal and minimal precipitation totals in July and August in the study years 1981–2010 was on average approximately 220 mm. This result significantly exceeds the difference calculated for the spatial variability of precipitation; moreover, it is also higher than the optimal precipitation (Popt) for sugar beet in the phase of high water needs.
Great temporal variability and lesser spatial variation are related to the frequency of the occurrence of droughts during the period of high water needs for sugar beet plants (Table 4). It was ascertained that in the analyzed multi-annual period (1981–2010) meteorological droughts occurred from 8 to 12 times depending on the location in the region of the Kujawsko-Pomorskie, which is an incidence of 26.7–40.0% for all the analyzed cases. Results presented by Łąbędzki [40] for central Poland confirm a similar frequency of meteorological droughts designated using SPI.
Attention should be paid to the high compliance of drought occurrence in the analyzed localities. The entire region of Kujawsko-Pomorskie (five analyzed measuring points) was affected by the meteorological drought of the period spanning July–August in five out of 30 years: 1983, 1989, 1992, 1994, and 2005. Additionally, in four out of five locations, meteorological drought occurred simultaneously in the years 1982, 1984, and 1999. An extreme drought (SPI ≤ −2.00) in sugar beet crops occurred once in each location, and usually it occurred in different years, except for MS–1–M, where such conditions were identified twice. A similar frequency of occurrence referred to very dry periods (SPI from −1.50 to −1.99). Most frequently conditions with moderate droughts (SPI from −1.00 to −1.49) and weak droughts (SPI from −0.50 to −0.99) occurred. The weak drought was identified in the southern part of the region (MS–4–Ge) in seven vegetation periods.
To determine the future occurrence of meteorological droughts in the period spanning July–August in the region, we used trend analysis. The results of the analysis carried out based on SPI values calculated for the years 1981–2010 did not confirm a trend of increasing dryness for the July–August periods in the chosen locations of Kujawsko-Pomorskie (Figure 3). No significant changes in SPI values over time were found. However, these data were characterized by a very high variability over time, which is specific to the temperate transitory climate.
The low R2 values presented in Figure 3, ranging from 0.045 to 0.111, do not prove a tendency of improvement in precipitation conditions during the period of high water needs in sugar beet. The positive lines in all considered locations resulted from a more frequent occurrence of meteorological droughts in the period of 1981–1995, compared to the later years of 1996–2010. In the last five years of the analyzed multi-annual period, meteorological droughts did not occur in any of the considered locations.
Similarly, no significant trends and not even a slight tendency for improvement in precipitation conditions are noticeable in the case of agricultural drought indicators, which express actual precipitation deficiencies (Pdef) in sugar beet crops grown on medium soil (Figure 4). Precipitation deficiencies in sugar beet crops, and likewise SPI values, varied greatly in time. Maximum precipitation deficits in sugar beet crops in the period of July–August ranged from −112.4 mm in MS–3–Go, −141.8 mm in MS-4-Ge, −166.2 mm in MS–2–Ch to −173.8 in MS–1–M. In the case of such great precipitation shortages, in the period of high water needs for sugar beets, serious losses in plant production in the region occur. However, in the long-term average, the precipitation deficiencies were considerably smaller and ranged from −31.7 mm in MS–4–Go to −49.1 mm in MS–2–Ch.
The presence and magnitude of the average precipitation deficiencies are consistent with the conclusion resulting from long-term field research carried out by the research team from the University of Science and Technology in Bydgoszcz, Poland, that sugar beet production in the region of Kujawsko-Pomorskie is conducted in conditions of water deficits [41]. Results presented in the work by Ziernicka-Wojtaszek [42] confirm that the region of Kujawsko-Pomorskie is among those areas where hydro-thermal conditions in the period of June–August are designated as moderately dry. According to the statement of the author, as climate warming progresses, in the absence of significant trends of atmospheric precipitation in the temperate climate represented by the central part of Poland, the conditions may become even more arid. Consequently, it is commonly expected that forecasted climate change will have a significant impact on future changes in irrigation needs. The consistency of meteorological and agricultural drought occurrences in the region is presented in Figure 5. It should be noted that there was a strong positive correlation between those phenomena in all considered locations, which is compliant with the results of other studies [43,44]. Pearson’s correlation coefficients ranged in the region of Kujawsko-Pomorskie from 0.89 in southern (MS–3–Go) to 0.95 in the northern part (MS-1-M). This means that equations of regression allow the assessment of sugar beet precipitation deficiencies (Pdef) based on the SPI values, and thus only based on precipitation data, access to which is quite common. Furthermore, it must be stressed that the precipitation deficiencies determine the irrigation needs of sugar beet crops in the region and point to the great variability of this agrotechnical treatment in different growing seasons.
In the years 2009 and 2010, Łabędzki and Bąk [45] conducted in the region of Kujawy monitoring of meteorological drought using SPI (Standardized Precipitation Index) and agricultural drought in selected crops using CDI (Crop Drought Index). The authors calculated agricultural drought with the linear regression relationships between CDI and SPI. Their results confirmed that the verifiability of the agricultural drought forecast, referring to the cultivation of sugar beet on light soil, was 46% in 2009 and 100% in 2010. On heavy soil, in all periods for both years examined, the forecasts were found to be fully accurate. Only in individual cases, differences were found in the assessment of the intensity of actual and forecast agricultural droughts. Very strong correlation coefficients between the meteorological and agricultural drought indicators in the period spanning July–August presented in their work allow for a determination of sugar beet irrigation needs based solely on the values of the Standardized Precipitation Index. This correlates with the results of our research presented above, which confirms the usefulness of the SPI to assess agrometeorological drought and consequently the need for irrigation of sugar beet in temperate climates.
Based on the results presented in this paper, we propose using the two-month (July–August) SPI values to assess the needs of sugar beet irrigation in the temperate climate of the region Kujawsko-Pomorskie in the period of the high water needs of the crops. Studies by Ji and Peters [46], Rossi and Niemeyer [47] indicate that an index that is overall best-correlated to agricultural drought is a 3-month SPI. Peled et al. [48] and Ivits et al. [49] have assessed the link between meteorological and agricultural drought on a large, pan-European scale. The authors present a high correlation between various agricultural drought indicators and meteorological drought indices such as the three-month SPI [48] or the 12-month SPEI (Standardized Precipitation Evaporation Index) [49], which have spatially variable patterns across Europe. Several other studies have assessed the mutual relations between meteorological and agricultural drought indicators [50,51,52,53], and some of them also tested the link to crop yield [54,55]. Most of the studies deal with a case study region and a subset of indicators, e.g., the relation between meteorological variables and vegetation indices [56,57,58,59]. However, for agricultural drought monitoring operated on a regular basis, Łabędzki and Bąk [60] recommend combining the SPI with real-time monitoring of soil moisture deficit, crop water stress, and the evaluation of possible crop yield reduction.

4. Conclusions

The occurrence of meteorological droughts in the period spanning July–August in the region of Kujawsko-Pomorskie amounts to 26.7–40.0%, depending on location. No significant trend of increasing dryness for this period in the analyzed years was found; in fact, quite the opposite, an upward tendency was identified, which indicates an improvement of precipitation conditions.
Sugar beet production in the region is carried out in conditions of precipitation deficits, which amount to an average of 32–49 mm and are on the maximum of 112–173 mm, depending on the location, but the deficits showed neither significant nor targeted changes over time. A significant relationship between the meteorological and agricultural drought indicators allows for the determination of sugar beet irrigation needs based solely on the values of the Standardized Precipitation Index (SPI).
Additionally, it should be noted that SPI can be used as a preliminary indicator for assessing the risk of agricultural drought in a given region and thus for assessing the need for irrigation. To gain an assessment of the risk of drought in agriculture, it is important to realize that this phenomenon is relative rather than absolute and that it should be related to the particular agricultural land, soil, and crop concerned. It needs to be kept in mind that SPI interpretation must be cautious since it is a relative measure. In an area where the precipitation total in the average year does not meet the crops’ needs for water, the irrigation is vital. The methodology of SPI treats such conditions as normal, while in agricultural production they are often estimated as dry for a particular crop cultivated on specific soil (e.g., sugar beet). Therefore, after the initial drought assessment using the SPI, it is recommended to use more precise indicators for comprehensive agricultural drought assessment.

Author Contributions

All authors read and approved the manuscript. J.Ż. came up with the main idea of this research. Conceptualization, J.Ż. and R.K.-T.; methodology, J.Ż. and R.K.-T.; formal analysis, J.Ż. and R.K.-T.; validation, J.Ż. and S.D.; investigation, J.Ż. and R.K.-T.; resources, S.D.; data curation, R.K.-T. and S.D.; writing—original draft preparation, J.Ż. and R.K.-T.; writing—review and editing, R.K.-T.; visualization, R.K.-T.; supervision, J.Ż.

Funding

This research received no external funding.

Acknowledgments

The authors greatly appreciate Sophie Müller for the native proofread.

Conflicts of Interest

The authors declare no conflict of interest.

References

  1. FAO. FAOSTAT Statistics Database; Food and Agriculture Organization of the United Nations: Rome, Italy, 2019. [Google Scholar]
  2. CEFS. European Association of Sugar Manufacturers. Available online: https://cefs.org/resources/statistics/ (accessed on 30 August 2019).
  3. Hesadi, P.; Taleghani, D.F.; Shiranirad, A.; Daneshian, J.; Jaliliyan, A. Selection for Drought Tolerance in Sugar Beet Genotypes (Beta vulgaris L.). Biol. Forum. 2015, 7, 1189–1204. [Google Scholar]
  4. Studnicki, M.; Lenartowicz, T.; Noras, K.; Wójcik-Gront, E.; Wyszyński, Z. Assessment of Stability and Adaptation Patterns of White Sugar Yield from Sugar Beet Cultivars in Temperate Climate Environments. Agronomy 2019, 9, 405. [Google Scholar] [CrossRef]
  5. Tarkalson, D.D.; King, B.A.; Bjorneberg, D.L. Yield production functions of irrigated sugar beet in an arid climate. Agric. Water Manag. 2018, 200, 1–9. [Google Scholar] [CrossRef]
  6. Kiymaz, S.; Ertek, A. Water use and yield of sugar beet (Beta vulgaris L.) under drip irrigation at different water regimes. Agric. Water Manag. 2015, 158, 225–234. [Google Scholar] [CrossRef]
  7. GUS. Statistics Poland, National Statistical Office. Available online: https://bdl.stat.gov.pl/ (accessed on 17 March 2019).
  8. IPCC. Intergovernmental Panel on Climate Change. In Climate Change 2007: Synthesis Report. Contribution of Working Groups I, II and III to the Fourth Assessment Report of the Intergovernmental Panel on Climate Change; Intergovernmental Panel on Climate Change: Geneva, Switzerland, 2007; p. 104. [Google Scholar]
  9. Schindler, U.; Steidl, J.; Müller, L.; Eulenstein, F.; Thiere, J. Drought risk to agricultural land in Northeast and Central Germany. J. Plant Nutr. Soil Sci. 2007, 170, 357–362. [Google Scholar] [CrossRef]
  10. Okom, S.; Russell, A.; Chaudhary, A.J.; Scrimshaw, M.D.; Francis, R.A. Impacts of projected precipitation changes on sugar beet yield in eastern England. Meteorol. Appl. 2017, 24, 52–61. [Google Scholar] [CrossRef]
  11. Freckleton, R.P.; Watkinson, A.R.; Webb, D.J.; Thomas, T.H. Yield of sugar beet in relation to weather and nutrients. Agric. For. Meteorol. 1999, 93, 39–51. [Google Scholar] [CrossRef]
  12. Żarski, J.; Dudek, S.; Kuśmierek-Tomaszewska, R.; Rolbiecki, R.; Rolbiecki, S. Forecasting effects of plants irrigation based on selected meteorological and agricultural drought indices. Ann. Set Environ. Prot. 2013, 15, 2185–2203. (In Polish) [Google Scholar]
  13. Żarski, J.; Dudek, S.; Kuśmierek-Tomaszewska, R.; Żarski, W. Effects of agricultural droughts in the province of Kujawsko-Pomorskie and possibilities of minimizing their impact. Infrastruct. Ecol. Rural Areas 2017, 2, 813–824. (In Polish) [Google Scholar]
  14. Kuchar, L.; Iwański, S.; Diakowska, E.; Gąsiorek, E. Simulation of hydrothermal conditions for crop production purpose until 2050-2060 and selected climate change scenarios for North Central Poland. Infrastruct. Ecol. Rural Areas 2015, 1, 319–334. (In Polish) [Google Scholar]
  15. Szyga-Pluta, K. Variability of drought occurrence during the growing season in Poland in years 1966-2015. Przegl. Geofiz. 2018, 1, 51–67. (In Polish) [Google Scholar]
  16. Czarnecka, M.; Nidzgorska-Lencewicz, M. Multiannual variability of seasonal precipitation in Poland. Water Environ. Rural Areas 2012, 12, 45–60. (In Polish) [Google Scholar]
  17. Żarski, J.; Dudek, S.; Kuśmierek-Tomaszewska, R.; Bojar, W.; Knopik, L.; Żarski, W. Agro-climatological assessment of the growing season rainfall in the Bydgoszcz region. Infrastruct. Ecol. Rural Areas 2014, 3, 643–656. (In Polish) [Google Scholar]
  18. Tomczyk, A.M.; Szyga-Pluta, K. Variability of thermal and precipitation conditions in the growing season in Poland in the years 1966-2015. Theor. Appl. Climatol. 2019, 135, 1517–1530. [Google Scholar] [CrossRef]
  19. Smakthin, V.U.; Hughes, D.A. Automated estimation and analysis of meteorological drought characteristics from monthly data. Environ. Model. Softw. 2007, 22, 880–890. [Google Scholar] [CrossRef]
  20. Bąk, B.; Łabędzki, L. Assessing drought severity with the relative precipitation index (RPI) and the standardized precipitation index (SPI). J. Water Land Dev. 2002, 6, 89–105. (In Polish) [Google Scholar]
  21. Allen, R.G.; Pereira, L.S.; Raes, D.; Smith, M. Crop Evapotranspiration—Guidelines for Computing Crop Water Requirements; Food and Agriculture Organization of the United Nations: Rome, Italy, 1998; pp. 1–300. [Google Scholar]
  22. Holzman, M.E.; Rivas, R.; Piccolo, M. Estimating soil moisture and the relationship with crop yield using surface temperature and vegetation index. Int. J. Appl. Earth Obs. Geoinf. 2014, 28, 181–192. [Google Scholar] [CrossRef]
  23. Cao, Y.; Chen, S.; Wang, L.; Zhu, B.; Lu, T.; Yu, Y. An Agricultural Drought Index for Assessing Droughts Using a Water Balance Method: A Case Study in Jilin Province, Northeast China. Rem. Sens. 2019, 11, 1066. [Google Scholar] [CrossRef]
  24. De Oliveira-Júnior, J.F.; de Gois, G.; Bodas Terassi, P.M.; Silva Junior, C.A.; Cavalcante Blanco, C.J.; Sobral, B.S.; Cruz Gasparini, K.A. Drought severity based on the SPI index and its relation to the ENSO and PDO climatic variability modes in the regions North and Northwest of the State of Rio de Janeiro–Brazil. Atmos. Res. 2018, 212, 91–105. [Google Scholar] [CrossRef]
  25. Thanh, N.T. A Proposal to Evaluate Drought Characteristics Using Multiple Climate Models for Multiple Timescales. Climate 2018, 6, 79. [Google Scholar] [CrossRef]
  26. Łabędzki, Ł.; Bąk, B. Meteorological and agricultural drought indices used in drought monitoring in Poland: A review. Meteorol. Hydrol. Water Manag. 2014, 2, 3–14. [Google Scholar] [CrossRef]
  27. Osuch, M.; Romanowicz, R.J.; Lawrence, D.; Wong, W.K. Trends in projections of standardized precipitation indices in a future climate in Poland. Hydrol. Earth Syst. Sci. 2016, 20, 1947–1969. [Google Scholar] [CrossRef]
  28. European Commission JRC S3 Platform. Available online: https://s3platform.jrc.ec.europa.eu/ (accessed on 27 June 2019).
  29. GUS. National Statistical Office. Available online: https://stat.gov.pl/en/topics/agriculture-forestry/agriculture/ (accessed on 19 March 2019).
  30. Gleboznawcze, P.T. Systematyka gleb Polski (Polish soil classification), 2011. Soil Sci. Annu. 2011, 62, 1–193. [Google Scholar]
  31. Żarski, J.; Kuśmierek-Tomaszewska, R.; Dudek, S.; Kropkowski, M.; Kledzik, R. Identifying climatic risk to soybean cultivation in the transitional type of moderate climate in Central Poland. J. Cent. Eur. Agric. 2019, 20, 143–156. [Google Scholar] [CrossRef]
  32. Kuśmierek-Tomaszewska, R.; Żarski, J.; Dudek, S. Meteorological automated weather station data application for plant water requirements estimation. Comput. Electron. Agric. 2012, 88, 44–51. [Google Scholar] [CrossRef]
  33. Map of Location the Region of Kujawsko-Pomorskie in Poland. Available online: https://en.wikipedia.org/ (accessed on 31 August 2019).
  34. Map of Location the Meteorological Stations in the Region of Kujawsko-Pomorskie in Poland. Available online: http://www.chrzastowo.coboru.pl/punktydosw.aspx (accessed on 31 August 2019).
  35. Edwards, D.C.; McKee, T.B. Characteristics of 20th century drought in the United States at multiple scales. Atmos. Sci. 1997, 634, 1–30. [Google Scholar]
  36. Łabędzki, L.; Bąk, B. Monitoring and forecasting the course and impact of water deficit in rural areas. Infrastruct. Ecol. Rural Areas 2013, 1, 65–76. (In Polish) [Google Scholar]
  37. Dzieżyc, J.; Nowak, L.; Panek, K. Decade indicators of rainfall needs of arable crops in Poland. Zesz. Probl. Post. Nauk Roln. 1987, 314, 11–33. (In Polish) [Google Scholar]
  38. Garnier, B.J. Podstawy klimatologii; Wyd. IMGW: Warszawa, Poland, 1996; pp. 97–114. [Google Scholar]
  39. Błażejczyk, K.; Kasperska-Wołowicz, W.; Łabędzki, L.; Kunert, A. Multi-annual fluctuations in precipitation and their hydrological and ecological consequences in regional scale. In Regional Hydrological Impacts of Climatic Change–Hydroclimatic Variability; IAHS Publications: Wallingford, UK, 2005; pp. 65–70. [Google Scholar]
  40. Łabędzki, L. Estimation of local drought frequency in Central Poland using the standardized precipitation index SPI. Irrig. Drain. 2007, 56, 67–77. [Google Scholar] [CrossRef]
  41. Rzekanowski, C.; Żarski, J.; Rolbiecki, S. Requirements, results and perspectives of plant irrigation on the areas characterized by distinct water deficits. Post. Nauk Rol. 2011, 1, 51–63. (In Polish) [Google Scholar]
  42. Ziernicka-Wojtaszek, A. Pluviothermal Regionalization of Poland in Light of Present-Day Climate Change. Pol. J. Environ. Stud. 2020, 29, 1–8. [Google Scholar] [CrossRef]
  43. Łabędzki, L.; Bąk, B.; Kanecka-Geszke, E.; Kasperska-Wołowicz, W.; Smarzyńska, K. Związek między suszą meteorologiczną i rolniczą w różnych regionach agroklimatycznych Polski. Water Environ. Rural Areas Rozprawy i Monogr. 2008, 25, 1–136. (In Polish) [Google Scholar]
  44. Kuśmierek-Tomaszewska, R.; Dudek, S.; Żarski, J.; Januszewska-Klapa, K. Temporal variability of drought in field crops in the Region of Kujawsko-Pomorskie, Poland. Res. Rural Dev. 2018, 2, 62–68. [Google Scholar]
  45. Łabędzki, L.; Bąk, B. Predicting meteorological and agricultural drought in the system of drought monitoring in Kujawy and the upper Noteć valley. Infrastruct. Ecol. Rural Areas 2011, 5, 19–28. [Google Scholar]
  46. Ji, L.; Peters, A.J. Assessing vegetation response to drought in the northern Great Plains using vegetation and drought indices. Remote Sens. Environ. 2003, 87, 85–98. [Google Scholar] [CrossRef]
  47. Rossi, S.; Niemeyer, S. Drought monitoring with estimates of the Fraction of absorbed photosynthetically-active Radiation (fAPAR) derived from MERIS. In Remote Sensing for Drought. Innovative Monitoring Approaches, 1st ed.; Wardlow, B., Anderson, M., Verdin, J., Eds.; CRC Press, Taylor & Francis Group: Boca Raton, FL, USA, 2012; pp. 95–116. [Google Scholar]
  48. Peled, E.; Dutra, E.; Viterbo, P.; Angert, A. Technical note: Comparing and ranking soil drought indices performance over Europe, through remote-sensing of vegetation. Hydrol. Earth Syst. Sci. 2010, 14, 271–277. [Google Scholar] [CrossRef]
  49. Ivits, E.; Horion, S.; Fensholt, R.; Cherlet, M. Drought footprint on European ecosystems between 1999 and 2010 assessed by remotely sensed vegetation phenology and productivity. Glob. Chang. Biol. 2014, 20, 581–593. [Google Scholar] [CrossRef]
  50. Tadić, L.; Dadić, T.; Bosak, M. Comparison of different drought assessment methods in continental Croatia. Graćevinar 2015, 67, 11–22. [Google Scholar]
  51. Quiring, S.M. Monitoring drought: An evaluation of meteorological drought indices. Geogr. Compass 2009, 3, 64–88. [Google Scholar] [CrossRef]
  52. Quiring, S.M.; Papakryiakou, T.N. An evaluation of agricultural drought indices for the Canadian prairies. Agric. For. Meteorol. 2003, 118, 49–62. [Google Scholar] [CrossRef]
  53. Tian, L.Y.; Yuan, S.S.; Quiring, S.M. Evaluation of six indices for monitoring agricultural drought in the south-central United States. Agric. For. Meteorol. 2018, 249, 107–119. [Google Scholar] [CrossRef]
  54. Potopová, V.; Boroneanţ, C.; Boincean, B.; Soukup, J. Impact of agricultural drought on main crop yields in the Republic of Moldova. Int. J. Climatol. 2015, 36, 2063–2082. [Google Scholar] [CrossRef]
  55. Vicente-Serrano, S.M.; Beguería, S.; Lorenzo-Lacruz, J.; Camarero, J.J.; López-Moreno, J.I.; Azorin-Molina, C.; Revuelto, J.; Morán-Tejeda, E.; Sanchez-Lorenzo, A. Performance of drought indices for ecological, agricultural, and hydrological applications. Earth Interact. 2012, 16, 1–27. [Google Scholar] [CrossRef]
  56. Balaghi, R.; Tychon, B.; Eerens, H.; Jlibene, M. Empirical regression models using NDVI, rainfall and temperature data for the early prediction of wheat grain yields in Morocco. Int. J. Appl. Earth Obs. Geoinf. 2008, 10, 438–452. [Google Scholar] [CrossRef]
  57. Choi, M.; Jacobs, J.M.; Anderson, M.C.; Bosch, D.D. Evaluation of drought indices via remotely sensed data with hydrological variables. J. Hydrol. 2013, 476, 265–273. [Google Scholar] [CrossRef]
  58. Gouveia, C.; Trigo, R.M.; DaCamara, C.C. Drought and vegetation stress monitoring in Portugal using satellite data. Nat. Hazards Earth Syst. Sci. 2009, 9, 185–195. [Google Scholar] [CrossRef]
  59. Lu, L.; Kuenzer, C.; Wang, C.; Guo, H.; Li, Q. Evaluation of three MODIS-derived vegetation index time series for dryland vegetation dynamics monitoring. Remote Sens. 2015, 7, 7597–7614. [Google Scholar] [CrossRef]
  60. Łabędzki, Ł.; Bąk, B. Agroclimatic determinants of irrigation needs. Ecol. Eng. 2016, 47, 199–204. [Google Scholar] [CrossRef]
Figure 1. An overview map of meteorological stations in the region of Kujawsko-Pomorskie in Poland: MS–1–M (Mochełek), MS–2–Ch (Chrząstowo), MS–3–Go (Głodowo), MS–4–Ge (Głębokie), MS–5–T (Toruń) [7,33,34].
Agronomy 09 00814 g001
Figure 2. Deviations of air temperature in July and August in relation to the multi-annual mean values 1981–2010 (°C) in the region of Kujawsko-Pomorskie.
Agronomy 09 00814 g002
Figure 3. Temporal variation of meteorological drought index (SPI) in the period of high water needs of sugar beet (July–August) in Kujawsko-Pomorskie in the years 1981–2010.
Agronomy 09 00814 g003
Figure 4. Temporal variation of agricultural drought expressed as precipitation deficiency (Pdef) in the period of high water needs of sugar beet (July–August) in Kujawsko-Pomorskie in the years 1981–2010.
Agronomy 09 00814 g004
Figure 5. Relationship between the meteorological (SPI) and agricultural drought (Pdef) indices in the period of high water needs of sugar beet (July–August) in Kujawsko-Pomorskie in the years 1981–2010.
Agronomy 09 00814 g005
Table 1. Meteorological drought classes according to the standardized precipitation index (SPI) [36].
Classes of DroughtSPIGraphic Designation
Slightly dry−0.50/−0.99
Moderate dry−1.00/−1.49
Very dry−1.50/−1.99
Extremely dry≤−2.00
Table 2. Precipitation needs (Po) in sugar beet crops high water requirements period (July–August) in the region of Kujawsko-Pomorskie according to Dzieżyc et al. [37].
Catchment AreaPrecipitation Needs (Popt) (mm)
JulyAugustJuly–August total
10-day periodMonthly total10-day periodMonthly total
123123
CA_III2727318530252277162
CA_IV2628318528252477162
Table 3. The average multi-annual (1981–2010) totals of precipitation in the period of July–August in the region of Kujawsko-Pomorskie and statistics defining their temporal variability.
LocationLatitudeLongitudePrecipitation (mm)
Avg.
Max.
(Year)
Min.
(Year)
CV
(%)
MS–1–M53°13’N17°51’E132.4268.9
(1985)
34.2
(1994)
42.4
MS–2–Ch53°11’N17°35’E126.9235.5
(2010)
40.2
(1983)
38.6
MS–3–Go52°50’N19°15’E143.3255.6
(2010)
64.5
(1989)
31.7
MS–4–Ge52°39’N18°27’E136.6282.3
(2010)
40.4
(1989)
45.3
MS–5–T53°03’N18°36’E151.6279.0
(2010)
40.0
(1982)
41.9
Table 4. The occurrence of meteorological droughts in the period of high water needs of sugar beet (July–August) in the years 1981–2010 in the region of Kujawsko-Pomorskie.
YearLocation of Meteorological Stations
MS–1–MMS–2–ChMS–3–GoMS–4-GeMS–5–T
1981
1982
1983
1984
1985
1986
1987
1988
1989
1990
1991
1992
1993
1994
1995
1996
1997
1998
1999
2000
2001
2002
2003
2004
2005
2006
2007
2008
2009
2010
Classes of droughtNumber of droughts
Slightly dry34573
Moderately dry22344
Very dry12101
Extremely dry21111
Frequency (%)26.730.033.340.030.0
White spaces indicate periods without drought, SPI > −0.50.

