Article

Response of Boll Development to Macronutrients Application in Different Cotton Genotypes

1
Joint International Laboratory of Agriculture and Agri-Product Safety, Yangzhou University, Yangzhou 225009, China
2
Jiangsu Co-Innovation Center for Modern Production Technology of Grain Crops, Yangzhou University, Yangzhou 225009, China
3
Department of Environmental Science, University of Haripur, Haripur 21120, Pakistan
4
Department of Agronomy, Faculty of Agriculture, University of Swabi, Swabi 23340, Pakistan
5
Department of Agronomy, College of Agricultural studies, Sudan University of Science and Technology, Khartoum 13311, Sudan
6
Department of Agronomy, Faculty of Agriculture, University of Khartoum, Khartoum 11115, Sudan
*
Authors to whom correspondence should be addressed.
Submission received: 17 April 2019 / Revised: 14 June 2019 / Accepted: 16 June 2019 / Published: 19 June 2019
(This article belongs to the Special Issue Cotton Breeding, Genetics and Genomics)

Abstract

:
Combined application of nitrogen (N), phosphorus (P), and potassium (K) is a valuable practice to improve the growth and physiological activities of cotton, especially during a boll setting. The main purpose of this research was to investigate the effects of the different combined ratios of nitrogen (N), phosphorus (P), and K (potassium) on morpho-physiological activities of Bacillus thuringiensis (Bt) cotton genotypes Siza 1 and Sikang 1 during the cotton boll development stage. A two-year (2016–2017) field experiment was performed in which the total amount of combined N, P, and K were applied at different levels, B1 = 150 N, 0 P2O5, and 0 K2O kg ha−1 (control), B2 = 150 N, 45 P2O5, and 90 K2O kg ha−1, B3 = 150 N, 90 P2O5, and 135 K2O kg ha−1, and B4 = 150 N, 135 P2O5, and 180 K2O kg ha−1. Results revealed that combined application of N, P, and K significantly increased boll length by 5.8% and 2.3%, fresh boll weight by 12.2% and 16.4%, dry lint weight by 15.2% and 1.7%, number of seeds boll−1 by 15.2% and 2.5% as well as dry boll shell weight by 11.0% and 4.9% as compared with the treatment without P and K (1:0:0) across two growing seasons. Furthermore, superoxide dismutase activity was improved by 2.3% and 15.6% and soluble protein by 5.1% and 14.1% as compared with the control, respectively. Our study indicated that combined application of N, P, and K at appropriate ratios enhanced morpho-physiological activities (boll length, boll width, boll weight, protein content, sugar content, and superoxide dismutase) of cotton during boll development and generally the ratio of 150:135:180 considerably performed best amongst all treatments during two growing seasons in this study.

1. Introduction

Cotton is one of the most important cash crops, specifically cultivated for fiber and oilseed production. Globally, cotton is planted in more than 75 countries occupying more than 30 million hectares [1]. In the past two decades, Bacillus thuringiensis (Bt) cotton has been widely extended in the world due to its resistance to bollworm and less consumption of chemical pesticide [2]. China is one of the leading Bt cotton producers in the world with an average lint yield level of 1438 kg ha−1. However, there is a stagnancy of cotton production in terms of both quality and quantity in the past decade [3]. There are many field management aspects responsible for this stagnancy in China, such as inappropriate sowing method and time, unbalanced fertilization, inappropriate irrigation, poor pest management, and so on. Of all these aspects, the unbalanced application of fertilizer is certainly a major factor [4].
An adequate supply of diverse nutrients is necessary for ensuring reasonable cotton plant growth and development. Nitrogen (N), phosphorous (P), and potassium (K) are considered the three main nutrients to improve cotton production [5]. Compared with other nutrients, N, P, and K application is more fundamental and required in larger amounts to promote cotton plant growth and development because they are the three biggest elements consisting of biomass and yield of cotton plants [6]. Of these three elements, the effects of N application have been widely studied for the production of Bacillus thuringiensis cotton. It has been reported that N content, especially in fruiting leaves and leaf subtending cotton bolls (LSCB), is closely related with boll growth and fiber development [7,8]. The Bt protein expression in cotton plants is also enhanced with appropriate N application, which can positively enhance the resistance of cotton plants against bollworms. In China, there is a huge difference in N applied amount, ranging from a lower rate of 225 kg ha−1 to a very high rate of 450 kg ha−1 [9]. At the low applied N rate, cotton plants cannot obtain enough N that is necessary for photosynthesis, biomass accumulation, boll growth, and fiber development. When the N applied rate is too high, the use efficiency of N is decreased and the emission of nitrous oxide (N2O; from the application of nitrogen fertilizers) is increased, resulting into environmental problems. In China, there has been an increasing trend that more N is applied. The occurrence of this trend is caused by several factors. Firstly, the promotional effects of N application is more easily observed than P. Secondly, cotton producers can have easier access to N than to P and K [10]. In recent years, China begins to pay more and more attention to the environmental problems caused by the overuse of N and the deficiency of P and K and cotton producers are encouraged to adopt a balanced application of N, P, and K [11].
Inadequate and inappropriate supply of N, P, and K usually results into significantly decreased cotton plant physiological activities. Under nutrient stress conditions, the activities of antioxidant enzymes such as superoxide dismutase (SOD), catalase (CAT), and peroxidase (POD) that protect the plants against the toxic effects of ROS (reactive oxygen species) are usually decreased, resulting into the impairment of cotton plant growth and development. Under nutrient stress conditions, other physiological parameters including turgor pressure and water homeostasis, total soluble protein, seed enzymatic activation, and transportation of solutes are also affected, resulted into declined cotton productivity [12].
The use efficiency of N, P, and K application is not only decided by the applied amount of individual nutrient of N, P, and K but also by the ratio of these three elements. The appropriate ratio of N, P, and K can maximize the comprehensive use efficiency of these three elements. In many previous studies, the individual effects of N, P, and K application on cotton have been widely researched. There are also many studies on the interactive effects of N and P, and N and K. However, few studies have been done to investigate the combined effects of integrated application of N, P, and K at various ratios [13,14]. In order to maximize the use efficiency of chemical fertilizer and further promote cotton yield and fiber quality, a superior strategy is needed to be developed based on the better understanding how the combination of N, P, and K fertilizer works together on. The main purpose of this work was to investigate the effect of ratio of N, P, and K on cotton boll development and to compare the morpho-physiological characteristics of two Bt cotton genotypes.

2. Materials and Methods

A two-year (2016–2017) field experiment was performed on the Experimental Farm of Yangzhou University, Jiangsu Province, China (32.30° N, 1198 25° E). The soil is loamy clay and the soil layer of 0–20 cm contained 1.27 mg kg−1 total N, 107.2 mg kg−1 mineral N (sum of NO3 and NH4+-N), 15.1 mg kg−1 P Bray−1 (the soil phosphorus measured is that which is extracted by a solution consisting of 0.025 normal HCl (hydrochloric acid) and 0.03 normal NH4F (ammonium fluoride), referred to as Bray−1 extract), and 77.9 mg kg−1 soil test K with pH 6.9 (1:1 in water). The concentration of N, P, and K in soil was determined following the methods of Kjeldhal, Micro-Vanadate-Molybdate, and neutral ammonium acetate extract (using flame photometer) with minor modifications, respectively [15].
The experiment was performed in a randomized complete block design with two factors arranged in split plot arrangement in three replications. The first experimental factor was a cultivar, included two cotton varieties Siza1 (Bt transgenic hybrid) and its parent Sikang1 (abbreviated as A1 and A2) were used. The second experimental factor was the ratios of N, P, and K applied at four levels, 1:0:0, 1:0.3:0.6, 1:0.6:0.9, and 1:0.9:1.2 (abbreviated as B1, B2, B3, and B4). N, P, and K were applied in the form of urea, single super phosphate, and potassium chloride at the different combined rates of B1 = 150 N, 0 P2O5, and 0 K2O kg ha−1 (control), B2 = 150 N, 45 P2O5, and 90 K2O kg ha−1, B3 = 150 N, 90 P2O5, and 135 K2O kg ha−1, and B4 = 150 N, 135 P2O5, and 180 K2O kg ha−1.
The seeds were sown on April 20 in 2016 and 2017 in 24 plots with each plot of 28m2 (8.0 m × 3.5 m). The planting density was 30,000 plants ha−1, with a line spacing of 100 cm and a row spacing of 33.3 cm. The N was applied twice at the equal rate of 150 kg ha−1 after seed sowing and at an initial flowering stage. The chemical control was applied at peak-flowering and boll-setting period. Others’ field management practices were in conformity with local recommendations [16].

2.1. Observations and Measurements

2.1.1. Plant Growth Parameters

Ten uniform plants of each plot were tagged and observations were made at peak flowering (July 25), boll-setting (August 10), peak-boll setting (August 25), and boll-opening (September 20) stages.

2.1.2. Boll Development

(a)
Boll tagging: The flowers of all plots of the experiment were tagged from July 22 to July 26.
(b)
Sampling date: Samples were collected at the 3rd, 10th, 17th, 24th, 31st, 38th, 45th, and 52nd day after flowering (date of tagging), respectively. For each treatment, 10 bolls and their corresponding leaves were sampled for boll growth and physiological determinations.

2.1.3. Boll Measurements

(a)
Boll growth parameters: From each treatment five bolls were collected from field randomly for the determinations of growth parameters such as boll size (length and width). The data was measured with Vernier caliper by following the method in [17] with minor modifications.
(b)
Volume and fresh boll weight: Volume was determined immediately after collecting the sample from the field. The five bolls of cotton were soaked in labeled cylinder contained water and measured the results of water displacement according to the method in [18] with minor modifications. Then the fresh weight of five bolls was determined by an electronic scale.
(c)
Dry boll weight: The bolls were kept in an oven at 60 °C until constant weight. When the bolls were completely dried, the weight of dry boll shell weight, seed weight, and dry lint weight were measured with an electronic scale and converted into an average with minor modification [19]. The number of seeds was determined by counting the number of seeds boll−1 according to the method with minor modification [20].

2.1.4. Physiological Parameters

Five bolls for each treatments were sampled and immersed in liquid nitrogen for 15 min and stored at −80 °C for physiological determination. Different parameters were determined including seed soluble protein, soluble sugar, and SOD activity.
(a)
Soluble seed protein: For the extraction and analysis of soluble proteins, approximately 0.5 g of seed sample was used. The samples were homogenized at 4 °C in 5 mL Na-phosphate buffer (pH 7.2) and then centrifuged at 4 °C for 15 min. The supernatants were stored on ice for further analysis. The contents of soluble protein were determined by using the Coomassie blue dye-binding assay [21]. Absorbance readings were converted into protein content using bovine serum albumin (BSA) as the standard curve. Supernatants and dye were pipetted in spectrophotometer cuvettes and absorbance was measured with a spectrophotometer (Model 721, Shanghai Mapada Instruments Co. Ltd, Shanghai, China) at 595 nm.
(b)
Soluble sugars: Seed samples of 0.5 g were collected from each treatment at different growth stages. The seed samples were completely dried at 105 °C in an oven. Soluble sugars of seeds were determined in ethanol extract by the phenol-sulfuric acid method according to the protocol in [22].
(c)
Superoxide dismutase: Approximately 0.5 g of seed sample was used for the extraction and analysis of superoxide dismutase activity. The samples were homogenized at 4 °C and centrifuged at 10,000 rpm for 15 min. Later on the samples were stored on ice for further analysis. The SOD activity was assayed according to the method [23].

2.1.5. Yield and Yield Component

Number of bolls per plant and average boll weight were measured according to the method [24]. Opened bolls from tagged plants of each plot (the same ten plants used for plant growth determination) were counted, harvested, and air-dried to a constant weight.

2.2. Statistical Analysis

The experiment was conducted twice under the same environment conditions arranged in a 2 (varieties) × 4 (fertilizer levels) factorial completely randomized design with three replicates. Data presented in this study were the average of the two years. The average values across all the plants of each variable at (3rd, 10th, 17th, 24th, 31st, 38th, 45th, and 52nd day after flowering) were calculated for each treatment with in replicates. The data of each variable were subjected to analysis of variance (ANOVA) with the statistical package of MSTAT-C [25]. Treatment mean differences of each parameter were separated by the least significant difference (LSD) test if the F tests were significant at (p ≤ 0.05). The figures were generated by SigmaPlot 10.0 (SPSS Inc., Point Richmond, CA, USA).

3. Results

The boll length was affected by cultivar, ratio of N, P, and K, and their combination at 3, 10, 17, 38, and 52 days after flowering (DAF) during the first year and at 17 to 52 DAF during the second year (Table 1), but no significant differences were observed for boll length at 24, 31, and 45 DAF in 2016 and at 3 and 10 DAF in 2017. Siza 1 was 5.8% and 2.3% higher in boll length at 3 and 10 DAF as compared with Sikang 1 during the first year. The boll length was increased by 5.4% at the ratio of 1:0.3:0.6 at 3 DAF, and increased by 0.9% and 15.4% at the ratios of 1:0.6:0.9 and 1:0.9:1.2 at 45 DAF during the first year. However, during the second year the boll length was increased by 10.1% at the ratio of 1:0.3:0.6 at 45 DAF, and increased by 11.0% and 14.0% at the ratios of 1:0.6:0.9 and 1:0.9:1.2 at 38 and 45 DAF as compared to control (1:0:0), respectively. Furthermore, the boll length was decreased by 5.9% and 2.1% at the ratios of 1:0.3:0.6 and 1:0.9:1.2 at 45 and 17 DAF during the first year, and decreased by 4.2% at the ratio of 1:0.3:0.6 at 52 DAF during the second year.
The cotton boll width was affected by cultivar, ratio of N, P, and K, and their combination at 3, 10, 31, 38, and 52 DAF in 2016 and at 10, 24, 38, 45, and 52 DAF in 2017 (Table 2). No significant differences were observed for boll width at 24 and 45 DAF during the first year while at 3, 17, and 31 DAF during the second year. Siza 1 was 7.5% and 1.0% lowered at 38 DAF during the two growing seasons compared to Sikang 1. In 2016, at 17 DAF the boll width was increased by 10.1% and 1.8% at the ratios of 1:0.3:0.6 and 1:0.9:1.2 and at 31 DAF increased by 3.7% at the ratio of 1:0.6:0.9 as compared to control, respectively. However, in 2017 it was increased by 2.0%, 12.0%, and 4.3% at the ratios of 1:0.3:0.6, 1:0.6:0.9, and 1:0.9:1.2 at 24 DAF. Additionally, at 31 DAF the boll width was decreased by 2.4% and 3.4% at the ratios of 1:0.3:0.6 and 1:0.9:1.2, and at 38 DAF decreased by 4.1% with the ratio of 1:0.6:0.9 during the first year.
Fresh boll weight was also affected by cultivar, ratio of N, P, and K and their combination at 10, 17, 31, 38, 45, and 52 DAF in 2016 and at 10, 17, 24, 38, 45, and 52 DAF in 2017 (Table 3), but no significant differences were seen at 3 and 24 DAF in the first year and at 3 and 31 DAF in the second year. Siza 1 was 12.2% and 16.4% higher at 10 and 17 DAF in 2016–2017 compared to Sikang 1. During the first growing season, at 45 DAF the fresh boll weight was increased by 6.6%, 8.4%, and 0.5% at the ratios of 1:0.3:0.6, 1:0.6:0.9, and 1:0.9:1.2 as compared with control, respectively. However, during the second growing season, at 45 DAF it was also increased by 8.8%, 8.3%, and 0.5% at the ratios of 1:0.3:0.6, 1:0.6:0.9, and 1:0.9:1.2. Moreover, at 31 DAF the fresh boll weight was decreased by 1.9% and 7.4% at the ratios of 1:0.3:0.6 and 1:0.9:1.2 during the first year while at 24 DAF decreased by 4.2% and 2.0% at the ratios of 1:0.3:0.6 and 1:0.9:1.2 during the second year.
Dry lint weight was affected by cultivar, ratio of N, P, and K and their combination at 10, 17, 38, and 52 DAF in 2016 and at 3, 17, 24, 31, 45, and 52 DAF in 2017 (Table 4), but no significant differences were seen at 3, 24, and 45 DAF in the first year while at 10 DAF in the second year. Siza 1 was 15.2% and 8.6% higher in lint weight at 10 and 17 DAF during two growing seasons compared to Sikang 1.
During the first year, at 10 DAF, the dry lint weight was increased by 3.7% at the ratio of 1:0.3:0.6, and at 17 DAF increased by 20.7% and 51.7% at the ratios of 1:0.6:0.9 and 1:0.9:1.2 compared to control, respectively. However, during the second year at 17 DAF, it was also increased by 6.6%, 26.3%, and 1.3% at the ratios of 1:0.3:0.6, 1:0.6:0.9, and 1:0.9:1.2. Furthermore, at 52 DAF the dry lint weight decreased by 28.4%, 30.7, and 50.2% at the ratios of 1:0.3:0.6, 1:0.6:0.9, and 1:0.9:1.2 during the first year, respectively.
The number of seeds boll−1 was affected by cultivar, the ratio of N, P, and K and their combination at 10, 17, 24, 31, and 38 DAF in 2016 and at 17, 24, 31, 38, 45, and 52 DAF in 2017 (Table 5), but no significant differences were observed at 3, 45, and 52 DAF during the first year while at 3 and 10 DAF during the second year. Siza 1 was 15.2% and 2.5% higher in number of seeds boll−1 at 10 and 38 DAF in 2016, compared to Sikang 1. The ratio of 1:0.3:0.6, increased the number of seed boll−1 by 2.5% at 10 DAF, and the ratios of 1:0.6:0.9, and 1:0.9:1.2 increased by 3.0% and 32.0% at 17 DAF during the first year as compared to the control, respectively. However, the ratios of 1:0.3:0.6, 1:0.6:0.9, and 1:0.9:1.2 it was also increased the number of seeds per boll−1 by 14.4%, 20.7%, and 17.7% at 17 DAF during the second year, respectively. Moreover, the ratios of 1:0.3:0.6, 1:0.6:0.9, and 1:0.9:1.2 decreased by 33.5%, 31.7%, and 18.3% at 31 DAF during 2017.
The SOD activity was not affected by cultivar, ratio of N, P, and K and their combination at all the growth period of boll development in 2016, but significant differences were seen at 3 to 31 DAF except at 38 DAF in 2017 (Table 6). Compared with Sikang 1, Siza1 was 2.3% higher in SOD activity at 31 DAF. However, the ratios of 1:0.3:0.6, 1:0.6:0.9, and 1:0.9:1.2 increased the activity by 148.0%, 283.0%, and 235.0% as compared to control, respectively.
Dry boll shell weight was affected by cultivar, ratio of N, P, and K and their combination at 3, 10, 17, 31, 45, and 52 DAF in 2016 and at 3, 10, 24, 31, 38, and 45 DAF in 2017 (Table 7), but no significant differences were observed at 24 and 38 DAF during the first year and at 17 and 52 DAF during the second year. Siza 1 was 11.0% and 4.9% higher in boll shell weight at 10 and 52 DAF in 2016 compared to Sikang 1. The ratios of 1:0.3:0.6, 1:0.6:0.9, and 1:0.9:1.2 increased the boll shell weight by 8.2%–6.7%, 24.7%–6.7%, and 1.5%–18.0% at 45 DAF during the two growing seasons as compared to the control, respectively. However, the ratio of 1:0.3:0.6, decreased the dry boll shell weight by 27.3% and 8.7% at 31 and 38 DAF during 2016–2017, respectively.
The boll volume was affected by cultivar, ratio of N, P, and K and their combination at 3, 10, 17, 24, 31, 38, 45, and 52 DAF (Table 8). Compared with Sikang 1, Siza 1 was 12.3% and 11.3% higher in boll volume at 3 and 10 DAF. At 31 DAF, the boll volume was increased by 0.3% and 16.6% at the ratios of 1:0.3:0.6 and 1:0.6:0.9 and at 24 DAF, increased by 14.0% at the ratio 1:0.9:1.2 as compared with control, respectively. In addition, at 24 DAF it was decreased by 14.0% at the ratio of 1:0.3:0.6 and at 31 DAF, decreased by 11.3% and 4.4% at the ratios of 1:0.6:0.9 and 1:0.9:1.2, respectively. The boll volume was increased until 10 DAF, decreased at 17, 24, and 31 DAF and re-increased at 38, 45, and 52 DAF.
The seed weight was affected by cultivar, ratio of N, P, and K and their combination at 17, 38, 45, and 52 DAF in 2016 while at 24, 31, 45, and 52 DAF in 2017 (Table 9), but no significant differences were observed at 24 and 31 DAF in the first year and at 17 and 38 DAF in the second year. Siza 1 was 1.4% and 10.6% higher in seed weight at 24 and 52 DAF during the second year compared to Sikang 1. The seed weight was increased by 19.0%, 13.2%, and 22.3% at 38 DAF at ratios of 1:0.3:0.6, 1:0.6:0.9, and 1:0.9:1.2 during the first year as compared with the control, respectively. However, it was also increased by 32.0%, 24.2%, and 38.7% at 31 DAF with the ratios of 1:0.3:0.6, 1:0.6:0.9, and 1:0.9:1.2 during the second year. Moreover, the seed weight was decreased by 26.3% and 39.3% at the ratio of 1:0.9:1.2 at 52 DAF during the two growing seasons.
Protein content was affected by cultivar, ratio of N, P, and K, and their combination at 3, 10, 17, 24, and 45 DAF in 2016 and at 3 to 45 DAF in 2017 (Table 10), but no significant differences were observed at 31 and 38 DAF during the first year. As compared with Sikang 1, Siza1 was 5.1% and 14.1% higher in protein content at 27 and 24 DAF in 2016. The protein content was increased by 1.3%–10.4%, 6.8%–31.0%, and 6.1%–25.2% at the ratios of 1:0.3:0.6, 1:0.6:0.9, and 1:0.9:1.2 as compared with the control during 2016–2017, respectively. In addition, it was decreased by 0.2%, 24.2%, and 1.3% at the ratios of 1:0.3:0.6, 1:0.6:0.9, and 1:0.9:1.2 at 10 DAF during the first year while it decreased by 11.0% with the ratios of 1:0.6:0.9 at 3 DAF during the second year. The soluble protein was initially increased at 3 and 10 DAF and decreased until 45 DAF in both years.
Similar to the protein content, soluble sugar was affected by cultivar, ratio of N, P, and K, and their combination at 10 to 45 DAF except at 3 DAF (Table 11). Siza 1 was 19.4% and 33.1% higher in sugar content at 17 and 24 DAF compared to Sikang 1. At 10 DAF, the sugar content was increased by 4.5%, 24.5%, and 51.1% at the ratios of 1:0.3:0.6, 1:0.6:0.9, and 1:0.9:1.2 as compared to the control, respectively. However, at 10 and 45 DAF it was decreased by 7.1% and 0.7% with the ratios of 1:0.3:0.6 and 1:0.9:1.2. Soluble sugar content was initially increased at 3 to 10 DAF, decreased at 17 DAF and re-increased until 45 DAF.
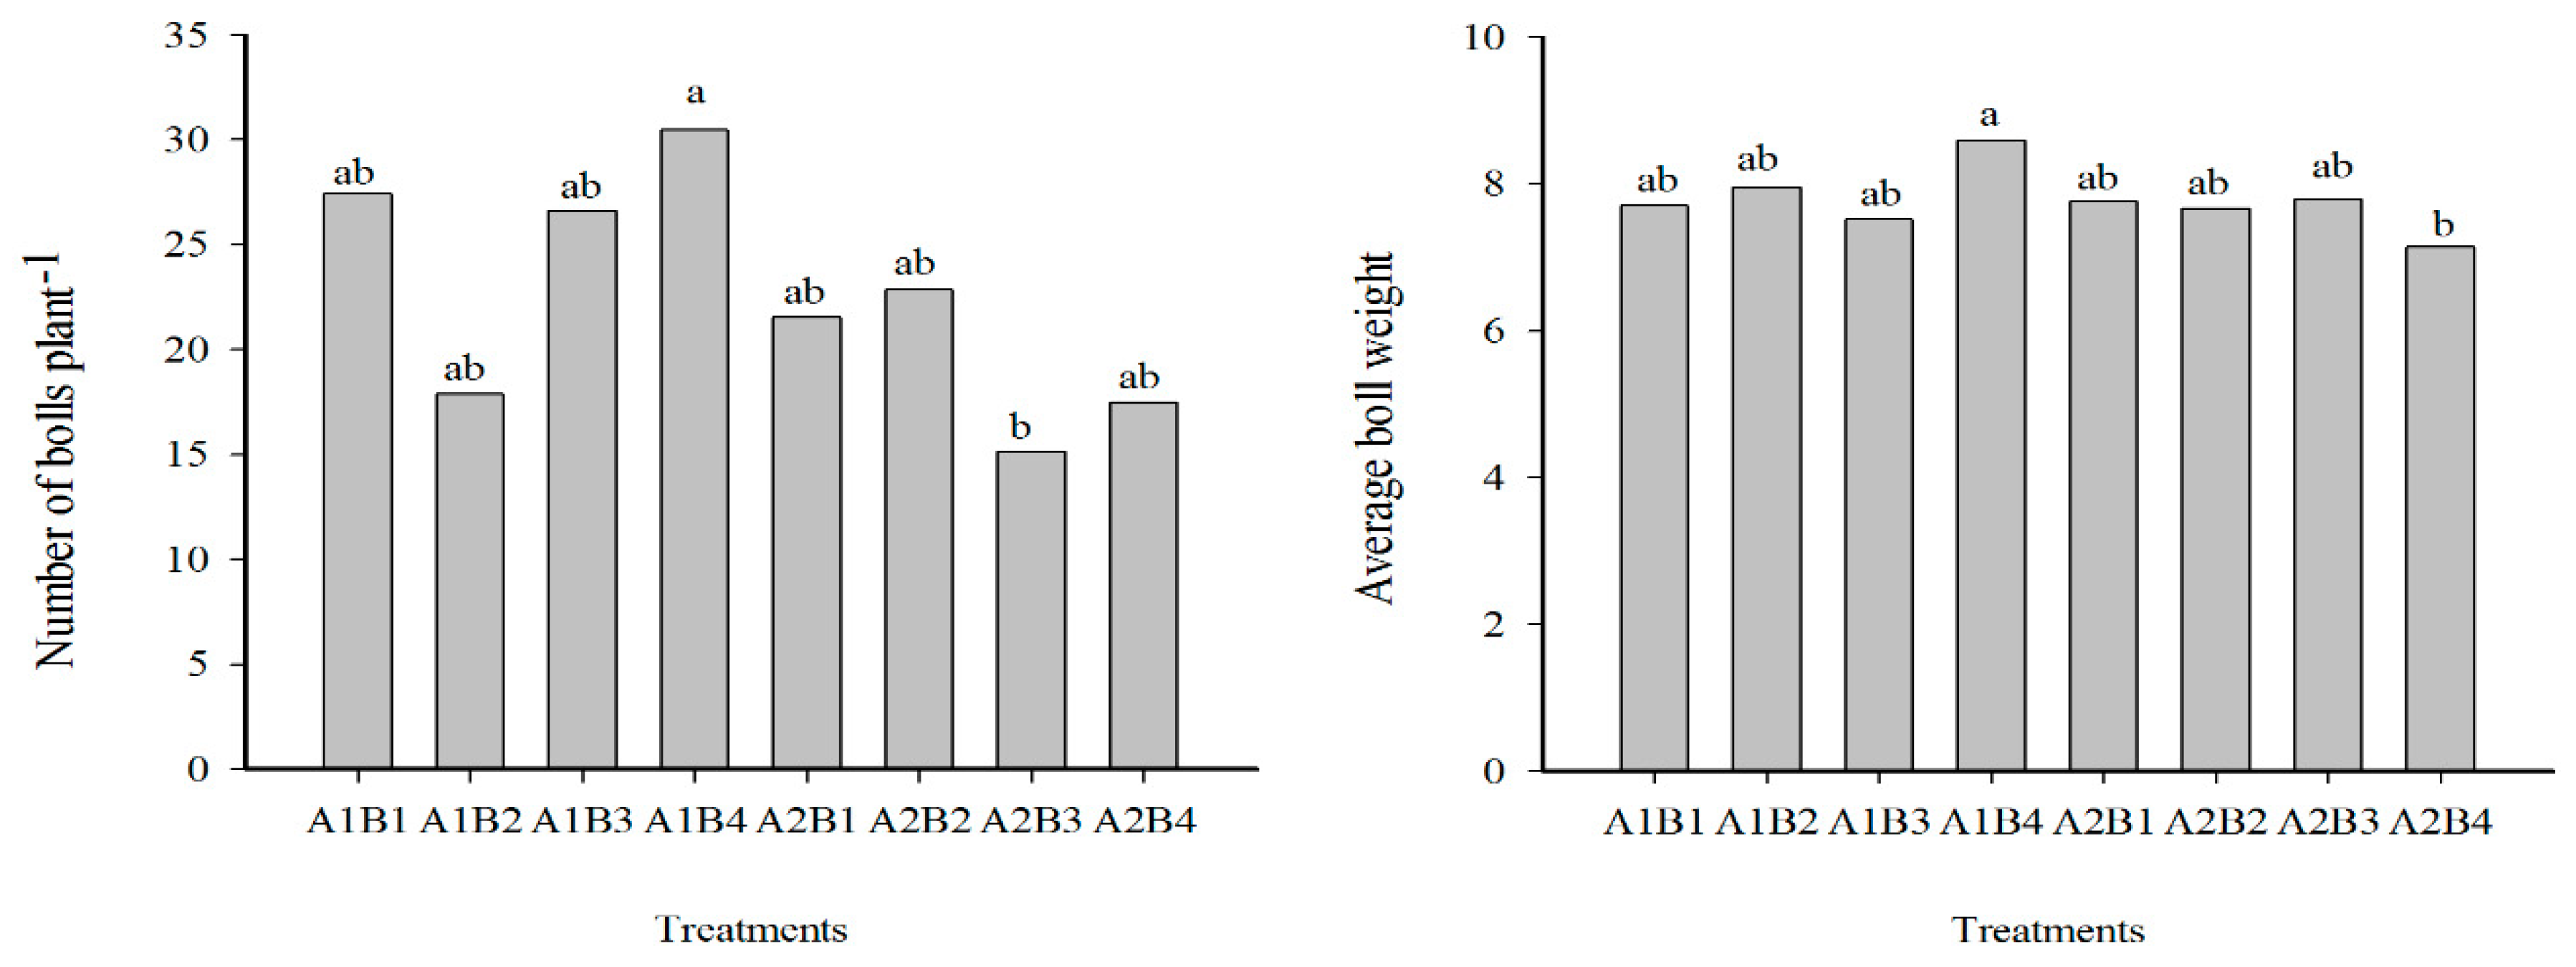
Number of bolls plant−1 and average boll weight was affected by cultivar, ratio of N, P, and K, and their combination in (Figure 1). Compared with Sikang 1, Siza 1 was 38.2% and 4.6% higher in a number of bolls plant−1 and average boll weight. Number of average boll weight was increased by 1.0% and 1.7% with the ratios of 1:0.3:0.6 and 1:0.9:1.2. However, the number of boll plant−1 decreased by 16.8%, 14.7%, and 2.0% with the ratios 1:0.3:0.6, 1:0.6:0.9, and 1:0.9:1.2 compared to the control, respectively.

4. Discussion

Nutrients, particularly the combined application of N, P, and K, play an important role in plant growth and productivity and/or are involved in different biological activity [26]. In the past decades, cotton growers and cotton physiologists paid more attention to the N application as compared to P and K. In the present study, we demonstrated the effects of different ratios of the combined application of N, P, and K on the boll development of two Bt cotton cultivars i.e., Siza 1 and Sikang1. This research added new knowledge on the importance of the combined application of N, P, and K on cotton production. In our study, the combined application of nutrients improved the plant growth parameters such as boll length, boll width, lint of cotton as well as physiological activities during both growing seasons. Similarly, Usherhood and Segars [27] suggested that the combination of N with the P nutrient improves the growth and productivity of cotton, but in the present study, we added P with N and K, which was significantly observed in the enhancement of plant growth and development together.
Furthermore, our data showed that the combined ratios of 1:0.9:1.2 had significantly increased the fresh boll weight across two years with varying response among different treatments (Table 3). The Sikang 1 cultivar has shown the best response under the higher ratios of combined N, P, and K (1:0.9:1.2) at 52 DAF during the two growing seasons. Our consequences were similar with the findings in [28], who reported that boll weight had positively augmented with the increasing rate of N and K. In the presence of a single application of N, cotton produced and retained a smaller number of boll and boll weight. In the contemporary work, the fresh boll weight was primarily increased at 10 DAF, decreased at 24 DAF, and re-increased at 52 DAF during the first year while it was increased at 17 DAF, decreased at 38 DAF, and again increased at 52 DAF during the second year, respectively. The possible reasons for the increase and decrease on different days after flowering (DAF) could be the climatic variations across the two years.
Aforementioned, the dry lint weight of cotton was enhanced during boll development (Table 4). Our results are in unison with the findings in [29], who had reported that the application of N, P, and K fertilizers enhance the lint weight of cotton. Our data represents that combined ratios of 1:0.6:0.9 and 1:0.9:1.2 have increased the dry lint weight of Sikang 1 as compared with Siza 1 at most of the growth stages across the two years. Other research reported the effect of K on lint weight was higher than that of P. The addition of P on cotton did not have any positive or negative effect on lint yield and quality [30]. Thus on the priority of research work [30] and those agreed with the findings [29], we concluded that the application of P fertilizer could be decreased without any negative effect on cotton lint yield and quality. Additionally, dry lint yield was significantly improved by K fertilizer, which was also reported [31].
As compared with the single application of N, Siza 1 at 10 and 17 DAF with combined ratios of 1:0.3:0.6 and 1:0.9:1.2 had significantly increased the number of seed boll−1 (Table 5). Furthermore Sikang 1 also showed an increase in the number of seed boll−1 at 17, 24, and 38 DAF under the higher ratio of combine N, P, and K (1:0.9:1.2) during the first year. Comparatively in 2016, the ratio 1:0.9:1.2 had significantly increased Sikang 1 seeds boll−1 at 24, 38, 45, and 52 DAF as compared with Siza 1. Our results were not in line with the findings in [32], who reported that the number of seeds boll−1 was reduced due to the higher application of N. In the present study, higher N application had enhanced the number of cotton seeds. In the current research, these differences might be responsible for the contribution of the P and K with N application. This research is supported by the results of Gormus et al. [33] who had found that the higher ratios of K significantly improved the number of cotton seed boll−1.
The higher ratios of combined N, P, and K application enhanced the contents of soluble protein and soluble sugar. In the current study, Sikang 1 showed a higher number of soluble proteins as compared to Siza 1 with the ratios of 1:0.3:0.6 at 10 and 17 DAF during the first year (Table 10 and Table 11). In addition, during the second year, Siza1 showed a higher number of protein contents as compared to Sikang 1 at 10, 17, 31, and 38 DAF with the ratios of 1:0.3:0.6 as compared to the control, respectively. Our results are in accordance with the findings of Chen and co-workers [34], who reported that Bt cultivars have higher protein contents as compared to its parent cultivars. Siza 1, required more N as compared to its parental cultivar Sikang 1, which could be the possible reason for the higher protein content of Siza 1 during the second year.
The combined nutrients significantly improved SOD contents during the second year (Table 6). SOD contents were increased at all the respective growth periods except at 38 DAF during the first and second year. This might be because of the applied fertilizers or the effect of different environmental stresses. Our results are in agreement with the study of Hammad et al. [35], who had reported that during stress plants release different kinds of antioxidant enzymes for reducing oxidative damage to detoxify ROS (reactive oxygen species) and ROS scavengers are those antioxidant enzymes that include superoxide dismutase (SOD), catalase (CAT), and peroxidase (POD). In 2016 and 2017, the cotton dry lint weight and number of seeds boll−1 was increased until 10 DAF and decreased from 17 to 45 DAF and was increased again at 52 DAF (Table 4 and Table 5). It might be due to the applied fertilizer rates at different developmental stages. Our results are in accordance with the findings of Gormus et al. [33], who reported that the fertilizer requirements for cotton development are different at various growth stages.

5. Conclusions

In this work, the ratios of N, P, and K (B1 = 150 N, 0 P2O5 and 0 K2O kg ha−1 control, B2 = 150 N, 45 P2O5, and 90 K2O kg ha−1, B3 = 150 N, 90 P2O5, and 135 K2O kg ha−1, and B4 = 150 N, 135 P2O5, and 180 K2O kg ha−1) increased all the morpho-physiological activities where Siza 1 showed higher numbers of bolls plant−1, average boll weight as well as soluble sugar contents. However, Sikang 1 exhibited higher boll length, boll width, fresh boll weight, dry lint weight, number of seeds boll−1, dry boll shell weight, boll volume, and seed weight across both growing seasons. All these indices sorted out the best practices for achieving the higher cotton yield as compared with the single N application. The N, P, and K ratio of 1:0.9:1.2 was much appropriate during the two growing seasons for Sikang 1 cultivar. Therefore, it can be concluded from the findings that the appropriate combination of N, P, and K fertilizers and Sikang 1 variety is a promising alternative for good economic returns in the Yangtze River Valley of China.

Author Contributions

Conceptualization, M.E.H.I.; Data curation, X.S. and N.E.A.N.; Formal analysis, G.Z. (Guanglong Zhu); Investigation, Z.A.; Methodology, G.Z. (Guisheng Zhou); Software, Y.J.; Supervision, G.Z. (Guisheng Zhou); Writing—original draft, I.A.; Writing—review and editing, I.A. All authors contributed to editing the manuscript.

Funding

This research was funded, in part, by Jiangsu Provincial Key R & D Program (BE2016345), Jiangsu Provincial Agricultural Innovation Fund (CX16(1005)), and Jiangsu Provincial Modern Agricultural Industrialization Development Program (2019).

Conflicts of Interest

The author declares no conflict of interest.

References

  1. Ali, N. Nitrogen utilization features in cotton crop. Am. J. Plant Sci. 2015, 6, 987. [Google Scholar] [CrossRef]
  2. Huang, J.; Hu, R.; Pray, C.; Qiao, F.; Rozelle, S. Biotechnology as an alternative to chemical pesticides: A case study of Bt cotton in China. Agric. Econ. 2003, 29, 55–67. [Google Scholar] [CrossRef]
  3. Yang, G.-Z.; Zhou, M.-Y. Multi-location investigation of optimum planting density and boll distribution of high-yielding cotton (G. hirsutum L.) in Hubei province, China. Agric. Sci. China 2010, 9, 1749–1757. [Google Scholar] [CrossRef]
  4. Nasim, W.; Ahmad, A.; Wajid, A.; Akhtar, J.; Muhammad, D. Nitrogen effects on growth and development of sunflower hybrids under agro-climatic conditions of Multan. Pak. J. Bot. 2011, 43, 2083–2092. [Google Scholar]
  5. Guo, J.H.; Liu, X.J.; Zhang, Y.; Shen, J.; Han, W.; Zhang, W.; Christie, P.; Goulding, K.; Vitousek, P.; Zhang, F. Significant acidification in major Chinese croplands. Science 2010, 327, 1008–1010. [Google Scholar] [CrossRef] [PubMed]
  6. Dong, H.; Li, W.; Eneji, A.E.; Zhang, D. Nitrogen rate and plant density effects on yield and late-season leaf senescence of cotton raised on a saline field. Field Crop. Res. 2012, 126, 137–144. [Google Scholar] [CrossRef]
  7. Ma, R.; Zhou, Z.; Wang, Y.; Feng, Y.; Meng, Y. Relationship between nitrogen concentration in the subtending leaf of cotton boll and fiber quality indices. Sci. Agric. Sin. 2009, 42, 833–842. [Google Scholar]
  8. Wenqing, Z.; Yali, M.; Binglin, C. Effects of fruiting-branch position, temperature-light factors and nitrogen rates on cotton (Gossypium hirsutum L.) fiber strength formation. Sci. Agric. Sin. 2011, 44, 3721–3732. [Google Scholar]
  9. Li, L.; Fang, W.; Xie, D.; Ma, Z.; Zhang, D. Effect of nitrogen application rate on dry matter accumulation and N, P, K uptake, distribution and utilization in different organs of hybrid cotton under high-yield cultivated condition. Cotton Sci. 2010, 22, 347–353. [Google Scholar]
  10. Pettigrew, W.; Meredith, W.; Young, L. Potassium fertilization effects on cotton lint yield, yield components, and reniform nematode populations. Agron. J. 2005, 97, 1245–1251. [Google Scholar] [CrossRef]
  11. Amin, A.; Nasim, W.; Mubeen, M.; Nadeem, M.; Ali, L.; Hammad, H.M.; Sultana, S.R.; Jabran, K.; ur Rehman, M.H.; Ahmad, S. Optimizing the phosphorus use in cotton by using CSM-CROPGRO-cotton model for semi-arid climate of Vehari-Punjab, Pakistan. Environ. Sci. Pollut. Res. 2017, 24, 5811–5823. [Google Scholar] [CrossRef] [PubMed]
  12. Benito, B.; Haro, R.; Amtmann, A.; Cuin, T.A.; Dreyer, I. The twins K+ and Na+ in plants. J. Plant Physiol. 2014, 171, 723–731. [Google Scholar] [CrossRef] [PubMed]
  13. Shabbir, R.N.; Waraich, E.; Ali, H.; Nawaz, F.; Ashraf, M.; Ahmad, R.; Awan, M.; Ahmad, S.; Irfan, M.; Hussain, S. Supplemental exogenous NPK application alters biochemical processes to improve yield and drought tolerance in wheat (Triticum aestivum L.). Environ. Sci. Pollut. Res. 2016, 23, 2651–2662. [Google Scholar] [CrossRef] [PubMed]
  14. Vieira, J.L.V.; Nardi, K.T.; Silva, G.R.A.; Moreira, L.A.; Zavaschi, E.; Moura, T.A.; Otto, R. Nutrient Uptake by High-Yielding Cotton Crop in Brazil. Rev. Bras. De Ciência Do Solo 2018, 42. [Google Scholar] [CrossRef]
  15. Ibrahim, M.E.H.; Zhu, X.; Zhou, G.; Ali, A.Y.A.; Ahmad, I.; Farah, G.A. Nitrogen fertilizer alleviated negative impacts of NaCl on some physiological parameters of wheat. Pak. J. Bot. 2018, 50, 2097–2104. [Google Scholar]
  16. Tung, S.A.; Huang, Y.; Ali, S.; Hafeez, A.; Shah, A.N.; Song, X.; Ma, X.; Luo, D.; Yang, G. Mepiquat chloride application does not favor leaf photosynthesis and carbohydrate metabolism as well as lint yield in late-planted cotton at high plant density. Field Crop. Res. 2018, 221, 108–118. [Google Scholar] [CrossRef]
  17. Chen, Y.; Ye, G.; Zhang, L.; Wang, Y.; Zhang, X.; Chen, D. Effect of trans-Bacillus thuringiensis gene on gibberellic acid and zeatin contents and boll development in cotton. Field Crop. Res. 2007, 103, 5–10. [Google Scholar] [CrossRef]
  18. Wang, Y.; Ye, G.; Luan, N.; Xiao, J.; Chen, Y.; Chen, D. Boll size affects the insecticidal protein content in Bacillus thuringiensis (Bt) cotton. Field Crop. Res. 2009, 110, 106–110. [Google Scholar] [CrossRef]
  19. Feng, L.; Wang, G.; Han, Y.; Li, Y.; Zhu, Y.; Zhou, Z.; Cao, W. Effects of planting pattern on growth and yield and economic benefits of cotton in a wheat-cotton double cropping system versus monoculture cotton. Field Crop. Res. 2017, 213, 100–108. [Google Scholar] [CrossRef]
  20. Zhang, D.; Li, W.; Xin, C.; Tang, W.; Eneji, A.E.; Dong, H. Lint yield and nitrogen use efficiency of field-grown cotton vary with soil salinity and nitrogen application rate. Field Crop. Res. 2012, 138, 63–70. [Google Scholar] [CrossRef]
  21. Bradford, M.M. A rapid and sensitive method for the quantitation of microgram quantities of protein utilizing the principle of protein-dye binding. Anal. Biochem. 1976, 72, 248–254. [Google Scholar] [CrossRef]
  22. Cerning-Beroard, J. A note on sugar determination by the anthrone method. Cereal Chem. 1975, 52, 857–860. [Google Scholar]
  23. Xu, L.; Ye, M. A measurement of peroxidase activity using continuous recording method. J. Nanjing Agricult. Univ. 1989, 12, 82–83. [Google Scholar]
  24. Dong, H.; Li, W.; Tang, W.; Li, Z.; Zhang, D.; Niu, Y. Yield, quality and leaf senescence of cotton grown at varying planting dates and plant densities in the Yellow River Valley of China. Field Crop. Res. 2006, 98, 106–115. [Google Scholar] [CrossRef]
  25. Freed, R.; Eisensmith, S.; Everson, E.; Weber, M.; Paul, E.; Isleib, E. MSTAT-C: A Microcomputer Program for the Design, Management, and Analysis of Agronomic Research Experiments; Michigan State University: East Lansing, MI, USA, 1991. [Google Scholar]
  26. Deng, G.; Liu, L.J.; Zhong, X.Y.; Lao, C.Y.; Wang, H.Y.; Wang, B.; Zhu, C.; Shah, F.; Peng, D.X. Comparative proteome analysis of the response of ramie under N, P and K deficiency. Planta 2014, 239, 1175–1186. [Google Scholar] [CrossRef] [PubMed]
  27. Usherwood, N.R.; Segars, W.I. Nitrogen interactions with phosphorus and potassium for optimum crop yield, nitrogen use effectiveness, and environmental stewardship. Sci. World J. 2001, 1, 57–60. [Google Scholar] [CrossRef] [PubMed]
  28. Jagdish, K.; Arya, K.; Sidduque, M.Z. Effect of foliar application of KNO3 on growth, yield attributes, yield and economics of hirsutum cotton. J. Cotton Res. Dev. 2011, 25, 122–123. [Google Scholar]
  29. Liu, L.-J.; Chen, H.-Q.; Dai, X.-B.; Hui, W.; Peng, D.-X. Effect of planting density and fertilizer application on fiber yield of ramie (Boehmeria nivea). J. Integr. Agric. 2012, 11, 1199–1206. [Google Scholar] [CrossRef]
  30. Tewolde, H.; Fernandez, C. Fiber quality response of Pima cotton to nitrogen and phosphorus deficiency. J. Plant Nutr. 2003, 26, 223–235. [Google Scholar] [CrossRef]
  31. Liu, L.-J.; Lao, C.-Y.; Zhang, N.; Chen, H.-Q.; Deng, G.; Zhu, C.; Peng, D.-X. The effect of new continuous harvest technology of ramie (Boehmeria nivea L. Gaud.) on fiber yield and quality. Ind. Crop. Prod. 2013, 44, 677–683. [Google Scholar] [CrossRef]
  32. Karademir, C.; Karademir, E.; Doran, I.; Altıkat, A. The effect of different nitrogen and phosphorus doses on cotton yield, yield components and some earliness criteria. J. Agric. Sci. 2006, 12, 121–129. [Google Scholar]
  33. Gormus, O.; El-Sabagh, A.; Islam, M. Optimizing yield and fiber quality of cotton under Mediterranean environment: Managing nitrogen and potassium nutrition. J. Exp. Biol. Agric. Sci. 2016, 4, 572–580. [Google Scholar]
  34. Chen, D.; Ye, G.; Yang, C.; Chen, Y.; Wu, Y. Effect of introducing Bacillus thuringiensis gene on nitrogen metabolism in cotton. Field Crop. Res. 2005, 92, 1–9. [Google Scholar] [CrossRef]
  35. Hammad, S.A.; Ali, O.A. Physiological and biochemical studies on drought tolerance of wheat plants by application of amino acids and yeast extract. Ann. Agric. Sci. 2014, 59, 133–145. [Google Scholar] [CrossRef] [Green Version]
Figure 1. Effects of nitrogen, phosphorous, and potassium application ratio on the number of bolls plant−1 and average boll weight (g) of two cotton cultivars Siza 1 and Sikang 1 DAF during 2016. Different letters on the bars in the figure indicate there was a significant difference at the 0.05 probability level by an ANOVA-protected test.
Agronomy 09 00322 g001
Table 1. Effects of the ratio of nitrogen, phosphorous, and potassium application on cotton boll length (mm) of Siza 1 and Sikang 1 during 2016 and 2017.
YearsCultivarsRatio of N, P, and KDays after Flowering
* 310172431384552
2016Siza11:0:043.2 a43.7 ab42.2 ab44.3 a42.4 a44.9 abc45.1 a47.9 ab
1:0.3:0.641.2 ab40.4 bc45.0 ab43.4 a42.7 a45.1 abc42.4 a41.0 b
1:0.6:0.936.8 bc37.4 c36.8 c45.3 a45.7 a43.4 c46.0 a49.4 ab
1:0.9:1.241.4 ab40.7 abc40.1 bc44.5 a43.0 a45.3 abc42.0 a51.0 ab
Sikang11:0:034.1 6c38.0 c45.7 a42.6 a43.4 a46.6 a44.6 a46.6 ab
1:0.3:0.640.3 ab44.4 a46.8 a44.2 a44.7 a43.7 bc38.3 a47.8 ab
1:0.6:0.937.4 abc41.1 abc44.1 ab41.1 a46.3 a44.1 abc44.1 a45.8 ab
1:0.9:1.241.8 ab42.4 ab46.0 a43.7 a44.6 a46.3 ab40.5 a57.9 a
2017Siza11:0:040.6 a42.6 a41.3 ab39.0 b36.6 ab36.1 c34.8 d43.7 abc
1:0.3:0.643.4 a43.9 a41.7 ab39.1 b37.0 ab38.4 abc38.9 b41.2 c
1:0.6:0.941.8 a43.5 a43.0 a42.7 a37.9 ab40.7 ab36.8 c43.9 abc
1:0.9:1.244.8 a45.5 a42.2 ab39.4 b36.6 ab37.8 bc39.7 ab44.2 abc
Sikang11:0:043.1 a43.4 a39.6 b40.7 ab36.1 b37.7 bc36.0 cd42.4 bc
1:0.3:0.644.5 a43.4 a40.0 b41.2 ab37.1 ab39.4 ab38.9 b41.3 c
1:0.6:0.946.9 a46.7 a40.7 ab41.3 ab39.5 a41.1 a39.7 ab45.0 ab
1:0.9:1.243.9 a42.6 a40.5 ab41.7 ab37.7 ab39.4 ab40.7 a45.7 a
* Cotton plants were sampled on the 3rd, 10th, 17th, 24th, 31st, 38th, 45th, and 52nd day after flowering in 2016 and 2017. Different letters in the same column within the same year in the table are statistically different at the 0.05 probability level by an ANOVA-protected test.
Table 2. Effects of the ratio of nitrogen, phosphorous, and potassium application on cotton fresh boll width (mm) of Siza 1 and Sikang 1 during 2016 and 2017.
YearsCultivarsRatio of N, P, and KDays after Flowering
* 310172431384552
2016Siza11:0:029.0 ab30.0 a28.0 bc30.9 a28.8 c32.5 bc35.2 a36.1 b
1:0.3:0.627.5 ab27.8 ab31.3 ab28.8 a29.6 bc32.6 bc34.5 a35.3 bc
1:0.6:0.925.6 b24.8 b24.0 d29.9 a31.6 abc31.2 c36.2 a36.7 ab
1:0.9:1.229.5 ab28.9 a26.9 cd31.8 a29.8 bc32.5 bc33.6 a35.0 bc
Sikang11:0:026.1 b26.5 ab30.9 abc30.1 a33.2 a35.3 a37.2 a35.7 bc
1:0.3:0.630.7 ab29.9 a33.5 a32.3 a30.9 abc35.7 a35.1 a36.3 b
1:0.6:0.927.9 ab30.2 a32.4 a28.3 a32.7 ab33.9 ab35.4 a34.3 c
1:0.9:1.231.8 a29.9 a33.0 a31.1 a30.1 bc34.3 ab36.8 a38.1 a
2017Siza11:0:032.6 a32.4 b33.8 a30.9 d29.9 a30.7 d34.1 c35.9 bc
1:0.3:0.632.7 a33.7 ab35.0 a31.6 cd30.8 a32.6 abc34.9 bc34.3 c
1:0.6:0.933.1 a35.2 ab35.2 a34.9 ab31.2 a33.8 ab35.8 bc36.9 abc
1:0.9:1.231.2 a34.1 ab35.7 a31.8 cd31.3 a33.3 abc36.0 bc37.8 ab
Sikang11:0:032.8 a32.9 b34.1 a32.4 bcd30.4 a32.0 cd34.6 bc35.1 c
1:0.3:0.631.5 a33.5 ab34.5 a32.8 bcd30.9 a32.8 abc35.8 bc38.2 ab
1:0.6:0.934.1 a36.4 a35.5 a35.9 a31.7 a34.1 a37.1 ab37.8 ab
1:0.9:1.232.8 a34.0 ab36.1 a34.3 abc31.2 a32.3 bcd39.0 a38.7 a
* Cotton plants were sampled on the 3rd, 10th, 17th, 24th, 31st, 38th, 45th, and 52nd day after flowering in the year of 2016 and 2017. Different letters in the same column within the same year in the table are statistically different at the 0.05 probability level by an ANOVA-protected test.
Table 3. Effects of the ratio of nitrogen, phosphorous, and potassium application on cotton fresh boll weight (g) of Siza 1 and Sikang 1 during 2016 and 2017.
YearsCultivarsRatio of N, P, and KDays after Flowering
* 310172431384552
2016Siza11:0:014.7 a19.0 ab13.4 bcd16.4 a16.2 b21.2 bcd24.3 abc27.7 ab
1:0.3:0.614.7 a20.9 ab18.4 ab14.1 a15.8 b20.1 cd25.6 ab26.6 b
1:0.6:0.911.4 a15.7 b8.6 d17.4 a19.6 ab18.2 d25.1 abc28.6 ab
1:0.9:1.214.9 a22.4 a12.7 cd17.2 a16.1 b20.2 cd22.5 c26.9 b
Sikang11:0:012.7 a18.8 ab17.5 abc15.5 a19.6 ab24.0 abc23.6 bc25.6 bc
1:0.3:0.617.7 a18.9 ab20.7 a17.4 a19.4 ab24.5 ab25.4 ab27.0 b
1:0.6:0.913.7 a15.5 b19.2 a14.8 a20.9 a21.4 abcd26.8 a23.4 c
1:0.9:1.218.9 a16.3 b20.6 a17.9 a17.1 ab25.3 a25.6 ab30.6 a
2017Siza11:0:020.5 a20.5 b23.4 ab20.1 de19.7 a19.1 b21.7 c26.3 bcd
1:0.3:0.620.6 a22.4 ab24.0 a21.1 bcd20.5 a21.8 a22.3 bc24.3 d
1:0.6:0.922.4 a22.3 ab25.0 a22.8 abc20.6 a22.2 a23.7 abc28.5 ab
1:0.9:1.221.6 a22.5 ab24.2 a18.1 e21.9 a21.6 a24.0 abc28.3 ab
Sikang11:0:019.9 a22.9 ab19.8 c23.2 ab20.6 a21.7 a22.2 bc27.8 abc
1:0.3:0.620.9 a23.1 ab20.2 c20.5 cde20.7 a22.0 a25.4 ab24.9 cd
1:0.6:0.923.3 a25.6 a21.8 bc24.3 a23.0 a23.5 a23.8 abc29.7 a
1:0.9:1.221.3 a23.6 ab21.1 c24.6 a22.6 a22.5 a26.3 a30.2 a
* Cotton plants were sampled on the 3rd, 10th, 17th, 24th, 31st, 38th, 45th, and 52nd day after flowering in the year of 2016 and 2017. Different letters in the same column within the same year in the table are statistically different at the 0.05 probability level by an ANOVA-protected test.
Table 4. Effects of the ratio of nitrogen, phosphorous, and potassium on dry lint weight (g) in 2016 and 2017 of Siza 1 and Sikang 1.
YearsCultivarsRatio of N, P, and KDays after Flowering
* 310172431384552
2016Siza11:0:00.1 a2.1 ab0.4 b1.3 a1.3 a1.2 ab0.7 a2.1 ab
1:0.3:0.60.1 a1.7 ab0.9 b1.0 a1.0 a0.8 abc0.8 a2.0 ab
1:0.6:0.90.1 a1.3 b0.4 b0.9 a1.1 a0.6 c1.3 a1.0 c
1:0.9:1.20.1 a2.5 a0.6 b1.0 a1.0 a0.7 bc0.7 a0.9 c
Sikang11:0:00.2 a1.7 ab0.8 b0.7 a1.3 a0.6 c1.1 a2.2 a
1:0.3:0.60.1 a2.2 ab1.7 a0.7 a0.8 a0.9 abc1.1 a1.1 bc
1:0.6:0.90.3 a1.4 b1.0 ab1.0 a1.0 a1.1 abc0.9 a2.0 ab
1:0.9:1.20.5 a1.3 b1.2 ab0.9 a1.1 a1.3 a1.3 a1.3 abc
2017Siza11:0:00.6 b1.3 a2.2 b1.5 d0.2 d0.3 c1.7 c1.6 bc
1:0.3:0.60.7 ab1.6 a2.5 b1.8 cd0.4 d1.7 ab1.9 bc1.3 c
1:0.6:0.91.0 ab1.9 a3.1 a3.0 ab2.0 ab1.2 bc2.3 abc2.0 abc
1:0.9:1.21.1 ab2.1 a2.5 b2.3 bcd0.6 cd1.9 ab2.7 ab2.4 a
Sikang11:0:00.8 ab1.4 a2.3 b1.8 cd1.0 cd0.4 c1.7 c1.7 bc
1:0.3:0.61.0 ab1.7 a2.4 b1.9 cd1.3 bc1.5 ab2.4 abc2.2 ab
1:0.6:0.91.2 ab2.0 a2.7 ab3.3 a2.4 a1.3 abc2.9 a2.5 a
1:0.9:1.21.3 a1.9 a2.0 b2.5 bc1.5 abc2.3 a2.9 a2.2 ab
* Cotton plants were sampled on the 3rd, 10th, 17th, 24th, 31st, 38th, 45th, and 52nd day after flowering. Different letters in the same column within the same year in the table are statistically different at the 0.05 probability level by an ANOVA-protected test.
Table 5. Effects of the ratio of nitrogen, phosphorous, and potassium application on number of seeds boll−1 of Siza 1 and Sikang 1 cotton plants in 2016 and 2017.
YearsCultivarsRatio of N, P, and KDays after Flowering
* 310172431384552
2016Siza11:0:08.2 a32.4 a12.4 ab22.6 ab21.8 ab22.4 a16.2 a30.6 a
1:0.3:0.66.0 a28.0 abc20.6 a13.2 c13.4 b12.4 b21.4 a32.0 a
1:0.6:0.95.0 a20.2 c7.2 b16.0 bc17 ab17.0 ab27.2 a32.8 a
1:0.9:1.211.4 a33.2 a13.2 ab16.2 bc14.6 ab13.2 b17.0 a28.8 a
Sikang11:0:013.2 a24.4 abc14.4 ab16.6 bc23.0 a13.6 b23.8 a33.0 a
1:0.3:0.64.6 a30.2 ab24.4 a15.4 bc16.4 ab15.4 ab22.2 a29.6 a
1:0.6:0.914.6 a22.8 bc20.4 a11.2 c13.6 b13.2 b21.2 a25.0 a
1:0.9:1.219.2 a21.4 bc22.2 a25.2 a22 ab21.2 a26.0 a31.6 a
2017Siza11:0:023.8 a23.4 a27.6 c17.2 b7.2 d10.5 e10.5 f17.0 d
1:0.3:0.624.6 a25.0 a34.2 ab23.4 ab8.4 cd25.2 ab13.5 e22.5 c
1:0.6:0.925.0 a27.0 a35.4ab25.4 ab17.6 ab16.3 de16.5 d26.2 b
1:0.9:1.226.2 a26.2 a35.6 ab22.4 ab15.2 bc26.1 ab20.7 ab29.7 a
Sikang11:0:024.4 a25.0 a32.2 b26.4 a14.8 bc20.5 bcd12.7 ef18.8 d
1:0.3:0.625.8 a26.0 a34.2 ab26.8 a16.8 b18.2 cd17.2 cd29.7 a
1:0.6:0.927.6 a30.0 a36.8 a30.2 a24.6 a24.2 abc19.7 bc24.7 bc
1:0.9:1.231.4 a27.8 a34.8 ab28.2 a16.2 b29.5 a22.6 a30.8 a
* Cotton plants were sampled on the 3rd, 10th, 17th, 24th, 31st, 38th, 45th, and 52nd day after flowering in 2016 and 2017. Different letters in the same column within the same year in the table are statistically different at the 0.05 probability level by an ANOVA-protected test.
Table 6. Effects of the ratio of nitrogen, phosphorous, and potassium application on SOD (super oxide dismutase) content SOD (µg min−1) of Siza 1 and Sikang 1 cotton plants in 2016 and 2017.
YearsCultivarsTreatDays after Flowering
* 172431384552
2016Siza1B18.3 a12.7 a13.5 a9.2 a17.4 a11.5 a
B28.4 a12.2 a13.1 a9.4 a16.8 a10.8 a
B39.7 a13.7 a15.4 a12.4 a16.8 a11.3 a
B49.7 a13.3 a13.2 a11.4 a16.5 a9.8 a
Sikang1B19.4 a9.6 a10.5 a9.4 a16.7 a10.8 a
B29.5 a13.1 a15.9 a13.3 a17.6 a10.9 a
B310.0 a12.6 a14.0 a12.6 a16.8 a7.8 a
B49.9 a13.3 a14.5 a13.5 a16.4 a7.8 a
2017Siza1B18.1 c3.3 d3.1 c2.4 f10.5 d11.9 a
B29.3 abc4.7 cd7.6 abc7.0 de11.9 cd11.9 a
B310.7 ab7.5 ab9.7 a13.7 ab15.0 abc13.2 a
B49.5 abc5.8 bcd6.7 abc9.5 cd15.7 ab11.5 a
Sikang1B18.8 bc6.1 bc3.6 bc5.2 ef10.5 d12.1 a
B210.8 ab9.0 a6.6 abc12.0 bc12.5 bcd12.0 a
B311.5 a9.0 a9.6 a15.8 a16.8 a13.5 a
B411.4 a9.1 a8.1 ab16.1 a12.1 cd12.7 a
* Cotton plants were sampled on the 3rd, 10th, 17th, 24th, 31st, 38th, 45th, and 52nd day after flowering in 2016 and 2017. Different letters in the same column within the same year in the table are statistically different at the 0.05 probability level by an ANOVA-protected test.
Table 7. Effects of the ratio of nitrogen, phosphorous, and potassium application on dry boll shell weight (g) of two cotton cultivars Siza 1 and Sikang 1 in 2016 and 2017.
YearsCultivarsRatio of N, P, and KDays after Flowering
* 310172431384552
2016Siza11:0:01.5 ab1.6 ab1.1 a1.6 a1.7 abc1.7 a1.6 c2.8 abcd
1:0.3:0.61.3 ab2.0 a1.4 a1.3 a1.3 bc1.7 a2.1 abc2.5 bcd
1:0.6:0.90.9 b1.8 ab0.5 b1.7 a1.9 abc1.7 a2.4 ab2.9 ab
1:0.9:1.21.2 ab1.9 a1.0 ab2.1 a2.1 abc1.3 a1.7 bc2.9 abc
Sikang11:0:01.3 ab1.7 ab1.4 a1.9 a1.8 abc1.5 a2.3 abc2.4 d
1:0.3:0.61.7 a1.6 ab1.5 a1.3 a1.2 c1.8 a2.2 abc2.7 abcd
1:0.6:0.91.1 ab1.5 b1.4 a2.2 a2.3 a1.3 a2.5 a2.4 cd
1:0.9:1.21.7 a1.6 ab1.4 a2.1 a2.2 ab1.3 a2.2 abc3.2 a
2017Siza11:0:01.1 d1.4 c2.1 a1.4 c1.1 c1.2 bc1.7 bc1.8 a
1:0.3:0.61.4 bcd1.8 ab2.2 a1.6 abc1.3 c0.7 c1.6 c1.9 a
1:0.6:0.91.7 abcd1.6 bc2.3 a1.8 abc1.7 ab1.3 abc1.6 c1.8 a
1:0.9:1.22.0 ab1.9 ab2.3 a1.7 abc1.7 b1.7 ab1.9 abc2.6 a
Sikang11:0:01.2 cd1.8 ab1.7 a1.5 bc1.7 b1.1 bc1.9 abc1.8 a
1:0.3:0.61.3 cd1.8 abc2.0 a1.6 bc1.8 ab1.4 ab2.3 a1.6 a
1:0.6:0.91.9 abc2.1 a2.1 a2.0 ab2.0 a1.9 a2.2 ab2.5 a
1:0.9:1.22.2 a2.2 a2.4 a2.1 a1.9 ab1.6 ab2.3 a2.3 a
* Cotton plants were sampled on the 3rd, 10th, 17th, 24th, 31st, 38th, 45th, and 52nd day after flowering in 2016 and 2017. Different letters in the same column within the same year in the table are statistically different at the 0.05 probability level by an ANOVA-protected test.
Table 8. Effects of the ratio of nitrogen, phosphorous, and potassium application on the boll volume of two cotton cultivars Siza 1 and Sikang 1.
CultivarsRatio of N, P, and KDays after Flowering
* 310172431384552
Siza11:0:015.4 bc20.0 bc16.1 b19.2 a17.1 b24.0 ab25.0 c29.2 c
1:0.3:0.616.0 b24.0 a20.0 a12.0 b17.0 b22.0 b23.0 c29.1 c
1:0.6:0.913.0 cd16.8 c8.0 c20.0 a22.0 a17.3 c39.2 a31.0 ab
1:0.9:1.215.0 bc22.0 ab9.1 c21.0 a18.0 b22.0 b23.0 c29.0 c
Sikang11:0:012.2 d21.2 ab19.0 ab18.0 a20.8 a26.0 a26.0 bc27.0 d
1:0.3:0.619.0 a19.2 bc21.1 a20.0 a21.0 a26.0 a25.1 c30.0 bc
1:0.6:0.914.6 bcd17.0 c21.0 a13.0 b22.2 a22.1 b29.0 b25.0 e
1:0.9:1.220.8 a17.0 c22.0 a19.1 a18.2 b25.0 ab26.0 bc32.4 a
* Cotton plants were sampled on the 3rd, 10th, 17th, 24th, 31st, 38th, 45th, and 52nd day after flowering. Different letters in the same column in the table are statistically different at the 0.05 probability level by an ANOVA-protected test.
Table 9. Effects of the ratio of nitrogen, phosphorous, and potassium application on seed weight (g) of Siza 1 and Sikang 1 cotton plants in 2016 and 2017.
YearsCultivarsRatio of N, P, and KDays after Flowering
* 172431384552
2016Siza11:0:00.6 cd1.6 a1.4 a1.5 abc1.0 b2.4 abc
1:0.3:0.61.1 bc1.2 a1.2 a1.2 bc1.2 ab2.7 ab
1:0.6:0.90.3 d1.6 a1.7 a1.1 c2.1 a1.9 bc
1:0.9:1.21.3 bc1.3 a1.3 a1.0 c0.9 b1.6 c
Sikang11:0:00.5 cd1.4 a1.7 a1.0 c1.5 ab3.0 a
1:0.3:0.62.4 a1.2 a1.8 a1.7 ab1.6 ab2.1 abc
1:0.6:0.91.2 bc1.7 a1.3 a1.7 ab1.7 ab2.7 ab
1:0.9:1.21.5 b2.0 a2.0 a2.0 a1.8 ab2.4 abc
2017Siza11:0:00.7 a1.0 c1.9 bc1.6 a0.2 c0.4 b
1:0.3:0.60.7 a1.5 abc2.1 abc2.0 a0.3 c0.3 b
1:0.6:0.90.8 a1.6 ab2.2 abc2.2 a1.7 ab1.5 a
1:0.9:1.21.0 a1.6 ab2.2 abc2.0 a1.8 a1.3 a
Sikang11:0:00.6 a1.1 bc1.9 bc1.5 a0.9 bc0.3 b
1:0.3:0.60.7 a1.2 abc1.7 c1.8 a1.2 ab0.2 b
1:0.6:0.90.9 a1.7 a2.4 ab2.2 a1.8 a1.4 a
1:0.9:1.21.2 a1.5 abc2.6 a2.0 a1.1 ab1.3 a
* Cotton plants were sampled on the 17th, 24th, 31st, 38th, 45th, and 52nd day after the flowering. Different letters in the same column within the same year are statistically different at the 0.05 probability level by an ANOVA-protected test.
Table 10. Effects of the ratio of nitrogen, phosphorous, and potassium application on protein content mg g−1 of Siza 1 and Sikang 1 during 2016 and 2017.
YearsCultivarsRatio of N, P, and KDays after Flowering
* 3101724313845
2016Siza11:0:031.9 ab34.7 b26.4 b25.6 a20.7 a22.3 a21.8 ef
1:0.3:0.631.7 c34.5 b26.3 b25.3 a20.7 a22.4 a21.8 f
1:0.6:0.931.7 c34.6 b26.5 ab15.6 e20.9 a22.4 a22.0 d
1:0.9:1.231.2 d34.4 b26.5 ab19.3 c20.8 a22.4 a21.5 g
Sikang11:0:031.9 ab34.4 b23.4 d17.5 d20.9 a22.6 a22.9 a
1:0.3:0.632.0 a34.3 b24.1 c21.2 b21.3 a22.3 a21.9 e
1:0.6:0.931.8 bc35.3 a26.7 a17.1 d20.8 a22.8 a22.4 c
1:0.9:1.231.7 bc34.6 b26.4 b19.4 c20.8 a22.3 a22.7 b
2017Siza11:0:018.0 e14.9 d24.3 d18.7 d27.8 d28.4 e24.1 de
1:0.3:0.622.1 c15.0 d27.5 c24.8 bcd28.6 d29.8 de23.2 e
1:0.6:0.917.4 f20.3 bcd31.7 ab27.7 abc31.6 bcd33.5 b30.7 a
1:0.9:1.217.8 e25.1 ab30.2 b30.6 ab32.8 abc32.4 bc26.3 bcd
Sikang11:0:019.5 d17.3 cd25.8 cd20.8 cd30.6 cd30.4 cde25.2 cde
1:0.3:0.623.1 b21.5 bc27.7 c24.0 bcd29.8 cd32.0 bcd27.9 b
1:0.6:0.916.0 g29.9 a33.8 a29.7 ab36.5 a36.1 a26.9 bc
1:0.9:1.224.7 a25.4 ab32.5 ab34.1 a35.0 ab32.9 bc30.7 a
* Cotton plants were sampled on the 3rd, 10th, 17th, 24th, 31st, 38th, 45th, and 52nd day after flowering. Different letters in the same column in the table are statistically different at the 0.05 probability level by an ANOVA-protected test.
Table 11. Effects of the ratio of nitrogen, phosphorous, and potassium application on sugar content mg g−1 of Siza 1 and Sikang 1.
CultivarsRatio of N, P, and KDays after Flowering
* 3101724313845
Siza11:0:032.2 a27.0 d27.1 c47.6 b52.1 d53.6 cd55.3 c
1:0.3:0.626.3 a21.0 e25.6 c47.5 b53.4 c54.1 bc53.8 d
1:0.6:0.920.3 a34.7 c18.0 d49.3 a52.9 cd53.1 d55.7 bc
1:0.9:1.234.9 a34.6 c41.0 a38.7 c54.7 b54.5 b57.3 a
Sikang11:0:028.8 a48.2 b25.2 c29.0 d52.7 cd51.7 e56.1 abc
1:0.3:0.631.8 a57.6 a38.4 a48.9 ab55.9 a56.4 a56.9 ab
1:0.6:0.921.0 a59.0 a31.8 b21.0 e53.1 cd53.1 d56.2 abc
1:0.9:1.235.2 a35.3 c37.9 a38.7 c56.5 a53.1 d55.1 c
* Cotton plants were sampled on the 3rd, 10th, 17th, 24th, 31st, 38th, and 45th day after flowering. Different letters in the same column in the table are statistically different at the 0.05 probability level by an ANOVA-protected test.

