Defining Spatial Priorities for Irrigation Development Using the Soil Conservation and Water Use Efficiency Criteria


 ,
,  , ,
, ,
Abstract
:1. Introduction
- (T1)
- By 2030, combat desertification, restore degraded land and soil, including land affected by desertification, drought and floods, and strive to achieve a land degradation-neutral world (the goal 15.3);
- (T2)
- Integrate climate change measures into national policies, strategies, and planning (the goal 13.2);
- (T3)
- By 2030, substantially increase water use efficiency across all sectors (the goal 6.4).
2. Materials and Methods
2.1. The Analytic Hierarchy Process (AHP)
2.2. The Consensus Model
3. Results
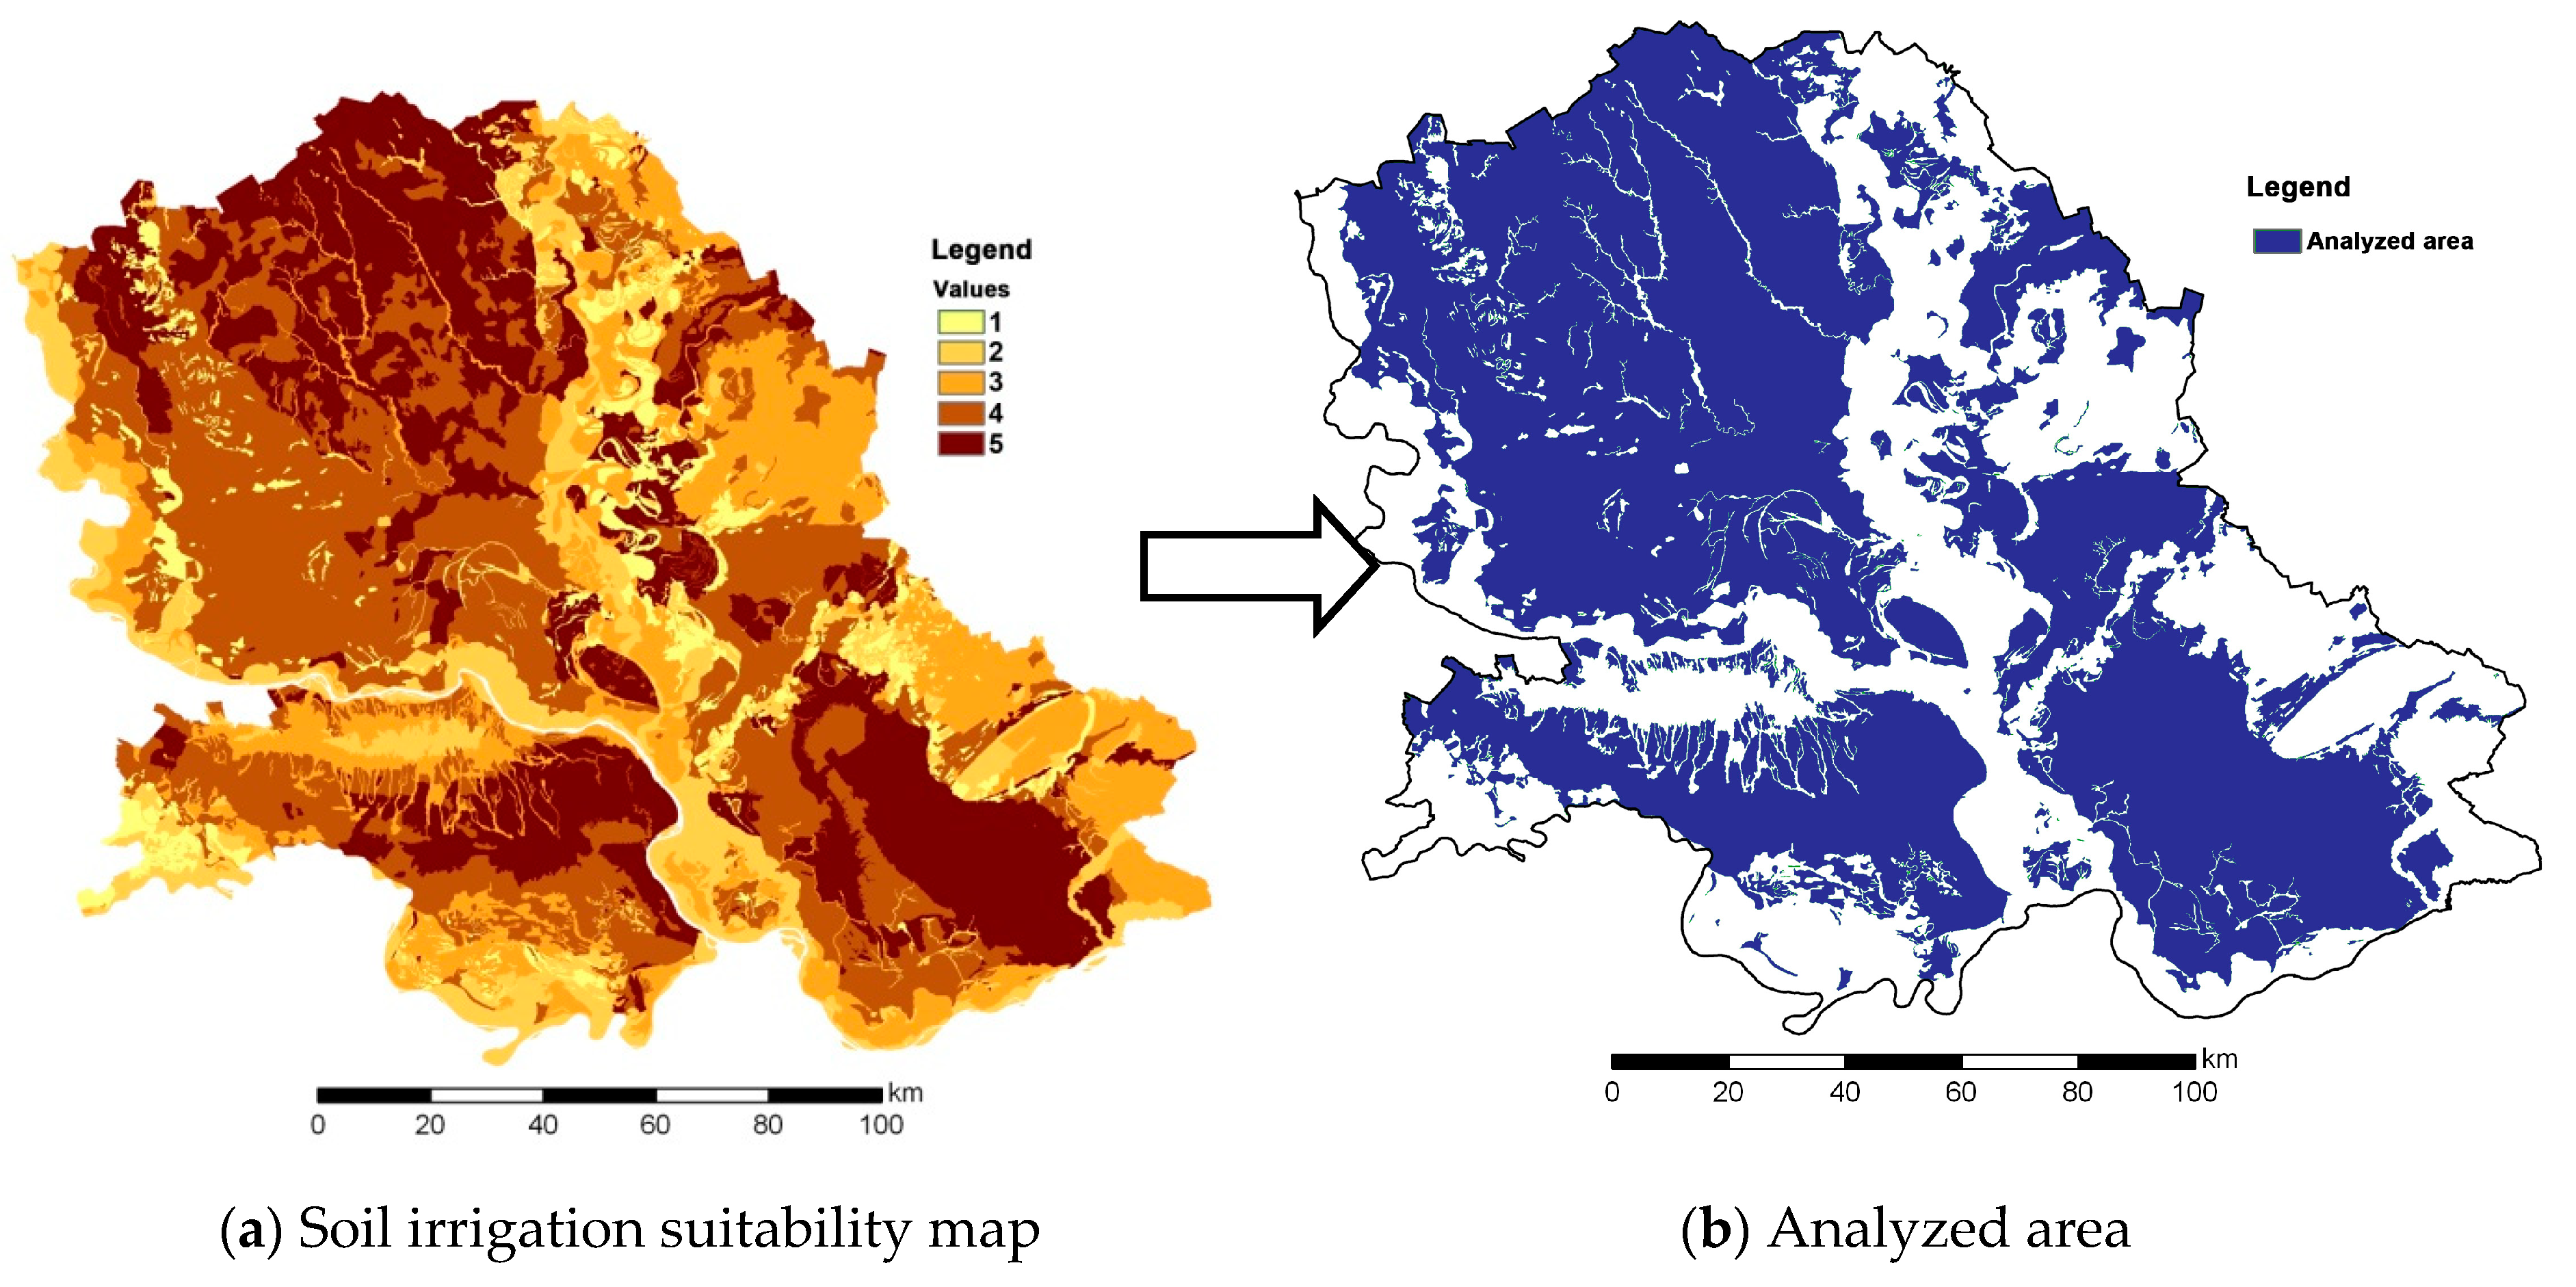
3.1. Step # 1
3.2. Steps #2–4
- The total available water in the root zone (AW) was determined as a difference between the water content at field capacity and the wilting point in the root zone. In Vojvodina (where the topsoil depth varies from 0.1 m to 1.5 m), AW ranges from 5 mm to 200 mm [22].
- The water deficit (WD) during the growing season is the most common way of elaborating the need for irrigation. Water balance represents the difference between precipitation and potential evapotranspiration (ET0). It is calculated using monthly precipitation data from nine principal meteorological stations in Vojvodina from 1971 to 2011 and ET0 using the Thornthwaite method [23].
- Drought hazard (DH): drought is usually quantified by drought indices, which enable drought characterization, including magnitude, duration, severity, and spatial extent of drought. In this step, we used the drought hazard map from our previous research [22], where drought occurrences were analysed and drought-prone areas in Vojvodina were identified using the four state first-order homogeneous Markov chain model applied to the time series of the standardized precipitation index–SPI [24] calculated on a three-month scale (SPI3) for each month.
- Distance from water bodies (DW): part of the water for irrigation is lost during transport through the water bodies because of evaporation, percolation, etc. This means that irrigation efficiency is higher when the distance from water bodies is shorter. Here, four buffer zones are drawn around water bodies, each at a distance of 2 km.
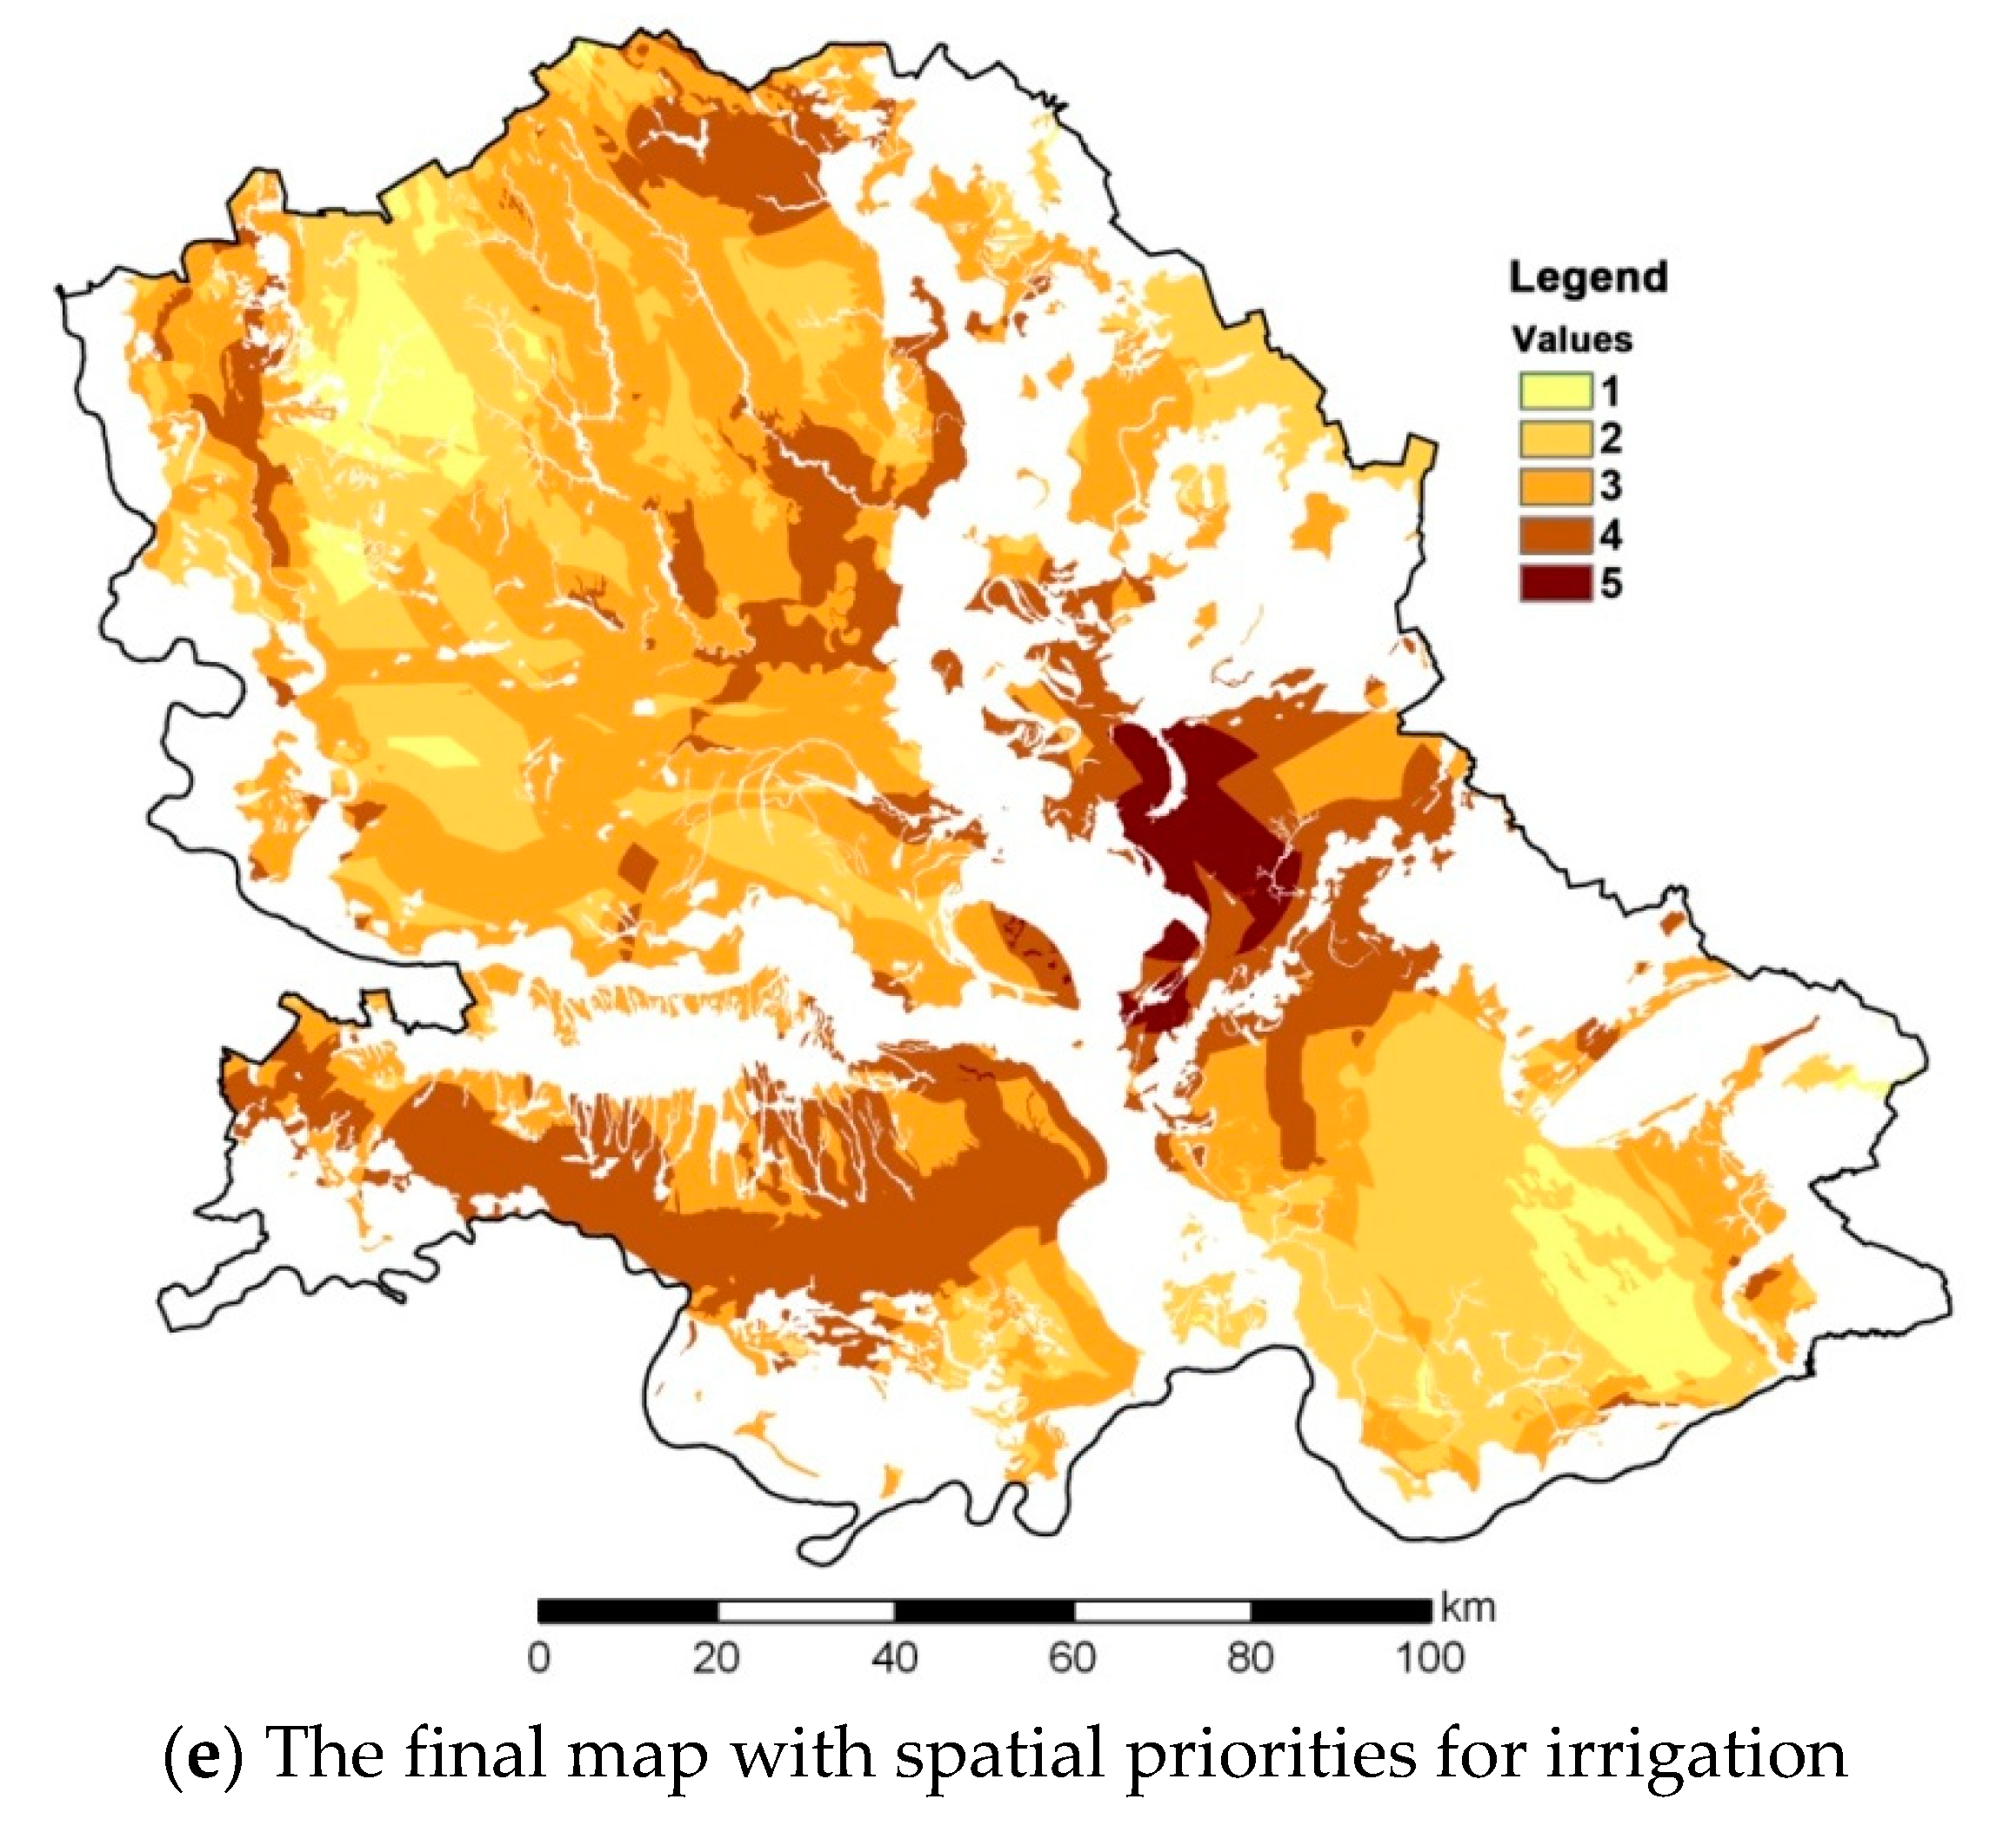
3.3. Steps # 5–7
- (a)
- The highest capacity to hold considerable amounts of water (for the AW criterion);
- (b)
- The highest water deficit (for WD criterion);
- (c)
- Very high drought hazard (for DH criterion); and
- (d)
- The smallest distance from water bodies (for DW criterion).
4. Conclusions
Author Contributions
Acknowledgments
Conflicts of Interest
References
- UN-Water. Coordinating the UN’s Work on Water and Sanitation. Available online: http://www.unwater.org (accessed on 9 December 2018).
- Rajić, M.; Bezdan, A. Contribution to research of droughts in Vojvodina Province. Carpath. J. Earth Environ. 2012, 7, 101–107. [Google Scholar]
- Srdjevic, Z.; Bezdan, A.; Blagojevic, B.; Dunkel, Z.; Srdjevic, B. Spatial multi-criteria evaluation of land suitability for irrigation in Vojvodina Province (Serbia) based on its soil and climate characteristics. Ital. J. Agrometeorol. 2015, 97–103. [Google Scholar]
- Stricevic, R.; Cosic, M.; Djurovic, N.; Pejic, B.; Maksimovic, L. Assessment of the FAO AquaCrop model in the simulation of rainfed and supplementally irrigated maize, sugar beet and sunflower. Agric. Water Manag. 2011, 98, 1615–1621. [Google Scholar] [CrossRef]
- Stricevic, R.; Djurovic, N. Determination of spatiotemporal distribution of agricultural drought in Central Serbia (Sumadija). Sci. Res. Essays 2013, 8, 438–446. [Google Scholar]
- Savić, R.; Pejić, B.; Ondrašek, G.; Vranešević, M.; Bezdan, A. Iskorišćenost prirodnih resursa Vojvodine za navodnjavanje (Utilisation of Natural Resources for Irrigation in Vojvodina). Агрoзнање 2013, 14, 133–142. [Google Scholar] [CrossRef]
- JVP “Vode Vojvodine” Novi Sad. Available online: http://www.vodevojvodine.com/ (accessed on 7 December 2018).
- Ðuričin, S.; Savic, S.; Bodroza, D.; Cvijanovic, G.; Ðorðevic, S. Climate change impacts on agricultural water management: Challenge for increasing crop productivity in Serbia. Econ. Agric. 2016, 63, 1333–1346. [Google Scholar]
- Albaji, M.; Landi, A.; Boroomand Nasab, S.; Moravej, K. Land Suitability Evaluation for Surface and Drip Irrigation in Shavoor Plain Iran. J. Appl. Sci. 2008, 8, 654–659. [Google Scholar] [CrossRef] [Green Version]
- Blagojevic, B.; Srdjevic, Z.; Bezdan, A.; Srdjevic, B. Group decision-making in land evaluation for irrigation: A case study from Serbia. J. Hydroinf. 2016, 18, 579–598. [Google Scholar] [CrossRef]
- Marchi, E.; Chung, W.; Visser, R.; Abbas, D.; Nordfjell, T.; Mederski, P.S.; McEwan, A.; Brink, M.; Laschi, A. Sustainable Forest Operations (SFO): A new paradigm in a changing world and climate. Sci. Total Environ. 2018, 634, 1385–1397. [Google Scholar] [CrossRef] [PubMed] [Green Version]
- United Nations Sustainable Development. Available online: https://www.un.org/sustainabledevelopment/ (accessed on 9 December 2018).
- Saaty, T.L. The Analytical Hierarchy Process; McGraw Hill: New York, NY, USA, 1980; p. 287. [Google Scholar]
- Huang, I.B.; Keisler, J.; Linkov, I. Multi-criteria decision analysis in environmental sciences: Ten years of applications and trends. Sci. Total Environ. 2011, 409, 3578–3594. [Google Scholar] [CrossRef] [PubMed]
- Blagojevic, B.; Jonsson, R.; Björheden, R.; Nordström, E.M.; Lindroos, O. Multi-Criteria Decision Analysis (MCDA) in Forest Operations—An Introductional Review. Croat. J. For. Eng. 2019, 40, 191–205. [Google Scholar]
- Dong, Y.C.; Zhang, G.Q.; Hong, W.C.; Xu, Y.F. Consensus models for AHP group decision making under row geometric mean prioritization method. Decis. Support Syst. 2010, 49, 281–289. [Google Scholar] [CrossRef]
- Dragincic, J.; Korac, N.; Blagojevic, B. Group multi-criteria decision making (GMCDM) approach for selecting the most suitable table grape variety intended for organic viticulture. Comput. Electron. Agric. 2015, 111, 194–202. [Google Scholar] [CrossRef]
- Crawford, G.; Williams, C. A note on the analysis of subjective judgment matrices. J. Math. Psychol. 1985, 29, 387–405. [Google Scholar] [CrossRef]
- Aguarón, J.; Moreno-Jiménez, J.M. The geometric consistency index: Approximated thresholds. Eur. J. Oper. Res. 2003, 147, 137–145. [Google Scholar] [CrossRef]
- Pedrycz, W.; Ekel, P.; Parreiras, R. Fuzzy Multicriteria Decision-Making: Models, Methods and Applications; John Wiley & Sons: Hoboken, NJ, USA, 2011; p. 360. [Google Scholar]
- Miljkovic, N. Meliorative Pedology (Meliorativna pedologija); Faculty of Agriculture, Novi Sad: Novi Sad, Serbia, 2005. [Google Scholar]
- Bezdan, A.; Benka, P.; Grabic, J.; Salvai, A. Estimation of Agricultural Drought Vulnerability Using GIS Tools: A Case Study of Vojvodina Region (Serbia). In Proceedings of the Balwois 2012, Balwois, Macedonia, 28 May–2 June 2012. [Google Scholar]
- Thornthwaite, C.W.; Mather, J.R. The Water Balance; Publications in Climatology VIII; Drexel Institute of Climatology: Centerton, NJ, USA, 1955; pp. 1–104. [Google Scholar]
- Mckee, T.B.; Doesken, N.J.; Kleist, J. The relationship of drought frequency and duration to time scales. In Proceedings of the 8th Conference on Applied Climatology; American Meteorological Society: Boston, MA, USA, 1993; pp. 17–22. [Google Scholar]


| Definition | Importance |
|---|---|
| Equal importance | 1 |
| Weak dominance | 3 |
| Strong dominance | 5 |
| Demonstrated dominance | 7 |
| Absolute dominance | 9 |
| Intermediate values | (2,4,6,8) |
| Irrigability Class | Description | Irrigation Suitability Value |
|---|---|---|
| I | No limitation for sustained use under irrigation | 5 |
| II | Slight soil limitation for sustained use under irrigation | 4 |
| IIIa | Moderate soil limitation for sustained use under irrigation | 3 |
| IIIb | Severe soil limitation for sustained use under irrigation | 2 |
| IIIc | Very severe soil limitation for sustained use under irrigation | 1 |
| AE1 | AE2 | ||||||||||
| AW | WD | DH | DW | w | AW | WD | DH | DW | w | ||
| AW | 1 | ½ | 1 | 0.194 | AW | 3 | 3 | 1 | 0.375 | ||
| WD | ½ | 2 | 0.230 | WD | 1 | 1/3 | 0.125 | ||||
| DH | 3 | 0.429 | DH | 1/3 | 0.125 | ||||||
| DW | 0.147 | DW | 0.375 | ||||||||
| GCI = 0.061 | GCI = 0.000 | ||||||||||
| AE3 | Consensus matrix | ||||||||||
| AW | WD | DH | DW | w | AW | WD | DH | DW | w(g) | ||
| AW | 4 | 1 | 3 | 0.395 | AW | 2.14 | 1 | 1.90 | 0.334 | ||
| WD | 1/3 | 1 | 0.114 | WD | 0.47 | 0.90 | 0.157 | ||||
| DH | 3 | 0.368 | DH | 1.92 | 0.335 | ||||||
| DW | 0.123 | DW | 0.175 | ||||||||
| GCI = 0.014 | Z = 49 | ||||||||||
| Suitability Rating | AW | WD | DH | DW |
|---|---|---|---|---|
| 5—the most suitable | 160–200 mm | 275–297 mm | Very high | 0–2 km |
| 4 | 120–160 mm | 254–275 mm | High | 2–4 km |
| 3 | 80–120 mm | 233–254 mm | Moderate | 4–6 km |
| 2 | 40–80 mm | 212–233 mm | Low to moderate | 6–8 km |
| 1—the least suitable | <40 mm | 191–212 mm | Low | >8 km |
© 2019 by the authors. Licensee MDPI, Basel, Switzerland. This article is an open access article distributed under the terms and conditions of the Creative Commons Attribution (CC BY) license (http://creativecommons.org/licenses/by/4.0/).
Share and Cite
Bezdan, A.; Blagojevic, B.; Vranesevic, M.; Benka, P.; Savic, R.; Bezdan, J. Defining Spatial Priorities for Irrigation Development Using the Soil Conservation and Water Use Efficiency Criteria. Agronomy 2019, 9, 324. https://0-doi-org.brum.beds.ac.uk/10.3390/agronomy9060324
Bezdan A, Blagojevic B, Vranesevic M, Benka P, Savic R, Bezdan J. Defining Spatial Priorities for Irrigation Development Using the Soil Conservation and Water Use Efficiency Criteria. Agronomy. 2019; 9(6):324. https://0-doi-org.brum.beds.ac.uk/10.3390/agronomy9060324
Chicago/Turabian StyleBezdan, Atila, Bosko Blagojevic, Milica Vranesevic, Pavel Benka, Radovan Savic, and Jovana Bezdan. 2019. "Defining Spatial Priorities for Irrigation Development Using the Soil Conservation and Water Use Efficiency Criteria" Agronomy 9, no. 6: 324. https://0-doi-org.brum.beds.ac.uk/10.3390/agronomy9060324