Article

Effect of Surface Straw Incorporation Rate on Water–Salt Balance and Maize Yield in Soil Subject to Secondary Salinization with Brackish Water Irrigation

1
College of Water Conservancy and Hydropower Engineering, Hohai University, Nanjing 210098, China
2
College of Agricultural Engineering, Hohai University, Nanjing 210098, China
3
Texas A&M AgriLife Research Center at El Paso, El Paso, TX 79927, USA
*
Author to whom correspondence should be addressed.
Submission received: 28 May 2019 / Revised: 24 June 2019 / Accepted: 25 June 2019 / Published: 27 June 2019
(This article belongs to the Special Issue Increasing Agricultural Water Productivity in a Changing Environment)

Abstract

:
Secondary salinization induced by brackish water irrigation has forced agricultural development to increasingly rely on soil management. A two-year field experiment was conducted to explore the effects of different straw incorporation rates (SIRs) within 0 to 20 cm topsoil on the soil water–salt balance, maize yield production, and water use efficiency (WUE) under brackish water irrigation in a naturally non-saline area. Air-dried wheat straw was applied at the rates of 0, 4.5, 9.0, 13.5, and 18.0 t ha−1 (R0–R4) and two salinity levels of irrigation water with the salt content of 1.92 dS m−1 (SL) and 3.20 dS m−1 (SH) were applied for simulating the scenarios of secondary salinization. Results demonstrated that straw incorporation markedly increased the soil water content during two growing seasons, and SIR was directly correlated to the deep percolation, but inversely correlated to the soil water depletion, under both the SL and SH condition. Meanwhile, straw incorporation led to the increase in salt content within the straw incorporation zone, but the total mass of salt deposited in the 0–100 cm soil profile was comparatively reduced as SIR increased due to the increased deep percolation for salt leaching, and such relative alleviation was more pronounced under the SH condition. The significantly increased maize yield and its corresponding WUE were obtained in treatments with high SIR levels. Additionally, an exponential function was used to describe the trend of the yield-increasing rate as SIR increased, and the theoretical maximum of grain and biomass yield calculated from the fitting results were 6483 in 17,282 kg ha−1 under SL, and 5440 and 14,501 kg ha−1 under SH, respectively. Results in this study would be helpful in the adoption of straw incorporation and brackish water irrigation in ways that facilitate soil water availability and reduce the risk of soil salinization.

1. Introduction

Since agricultural irrigation does not strictly rely on high-quality water, the application of some brackish water from shallow groundwater or from the mixing of seawater with fresh water in estuaries is encouraged to overcome fresh water supply shortages [1,2]. However, without adequate soil management for salt removal on naturally non-saline areas, excessive irrigation with brackish water can cause severe secondary soil salinization by depositing dissolved salts in the upper layer of the soil [3], which significantly threatens sustainable agricultural development and even causes land abandonment [4,5]. Nowadays, secondary soil salinization is not only especially problematic in arid and semi-arid areas where evaporation exceeds precipitation [6], but also increasingly common in semi-humid and humid areas, due to freshwater resources being severely challenged by the continuous development of industrialization and urbanization [7,8]. To mitigate the adverse effect of saline irrigation on crop growth and land property, previous studies have paid much attention to improving irrigation and field management. For irrigation, a micro-irrigation system (i.e., sprinkler and drip irrigation) is used to continually leach the soil volume where plants extract water by adopting deficit or alternative irrigation strategies to control water table increases and recuse the ingress of salts by irrigation water. For field management, tillage practice, surface mulching, or incorporation with organic (e.g., crop residue, biochar, and compost) or inorganic matter (e.g., plastic film, anthracite coal powder, and gravel) methods are commonly applied for reducing soil evaporation and regulating the salt vertical movement. Meanwhile, subsurface drainage or soil interlayers are reportedly useful in managing groundwater levels and reducing salt accumulation [9,10,11,12]. However, such measures are mainly conducted for soil amendment on primary salinization areas, and rarely on non-saline areas, for preventing or alleviating secondary salinization.
In China, the total output of straw resources is about 0.7 billion tons per year [13]. Owing to its low price and high availability in farmland, straw has widely served as a biodegradable and renewable agricultural engineering material [14,15]. Straw incorporation is one approach of straw field returning practice with the function of improving soil properties and thus influencing soil water transport and solute dynamics. Due to the features of the porosity and endurance of straw itself, soil incorporated with straw can maintain a high level of porosity and resistance when the soil structure is affected by the compaction of irrigation water or by aggregate degradation due to ion involvement [16,17]. Pinheiro et al. [18] reported that soil exposed with tillage and plenty of residue inputs led to increases in aggregation and organic carbon content, both of which promoted high soil water storage. Moreover, as crop residual segments cut less than 20 cm long, the hydraulic conductivity of the incorporation layer was promoted by reducing soil bulk density [19].
Straw incorporation is regarded as a useful approach in saline soil amendment. Xie et al. [5] observed that maize straw incorporation in coastal areas can prevent salt surface accumulation and led to a relatively constant salt level in the topsoil (0–20 cm). They also found that salt inhibition efficiency was much more significant in the early growth stages of wheat (seeding, jointing, and booting stage), and the sharp transient changes in salt content were significantly diminished when the straw incorporation rate was over 1 t ha−1. Zhang et al. [20] demonstrated that wheat straw incorporated in surface soil could enhance salt leaching efficiency by blocking upward movement in the salt capillary during evaporation.
Crop growth also takes advantage of the improved soil water storage and lowered salt-stress from straw incorporated soil. The crop transpiration could be indirectly improved by reducing the water consumption in non-productive soil evaporation and thus meaning more water is available for root water uptake [21,22,23]. Meanwhile, alleviated salt-affects due to enhanced soil leaching and reduced salt accumulation in the root zone are of great benefit to water and nutrition extracts during crop growth. Based on the advantages mentioned above, a trial study is valuable for straw incorporation as a practical approach to relieve repeated soil salt accumulation and preserve crop production during the secondary salinization process. However, these studies do not clarify the relationship of the straw incorporation rate on soil water transport and salt dynamics and consequently the influence on plant growth under saline water irrigation. Also, straw incorporation is not likely to be sustainable over the long-term, since the decomposition of straw could compete with crops for soil available nitrogen [24], thus diminishing the capacity of improving soil properties, and such adverse effects could be enhanced with straw incorporation at a high rate [25].
Based on these evidence from the above-mentioned literature, we established a two-year plot experiment by combining five straw incorporation rates (0, 4.5, 9, 13.5, and 18 t ha−1) with two salt levels (1.92 and 3.20 dS m−1 salt content) of irrigation water in non-saline soil filled lysimeters to simulate the condition of secondary salinization. Meanwhile, maize (Zea mays L.), classified as a moderately salt-tolerant crop [19], was planted to test the response of yield production to different experimental combinations. The main objective of this study was to measure the effects of different straw incorporation rates on soil moisture and salinity dynamics as well as on crop yield and water utilization under irrigation with brackish water of different salt levels.

2. Materials and Methods

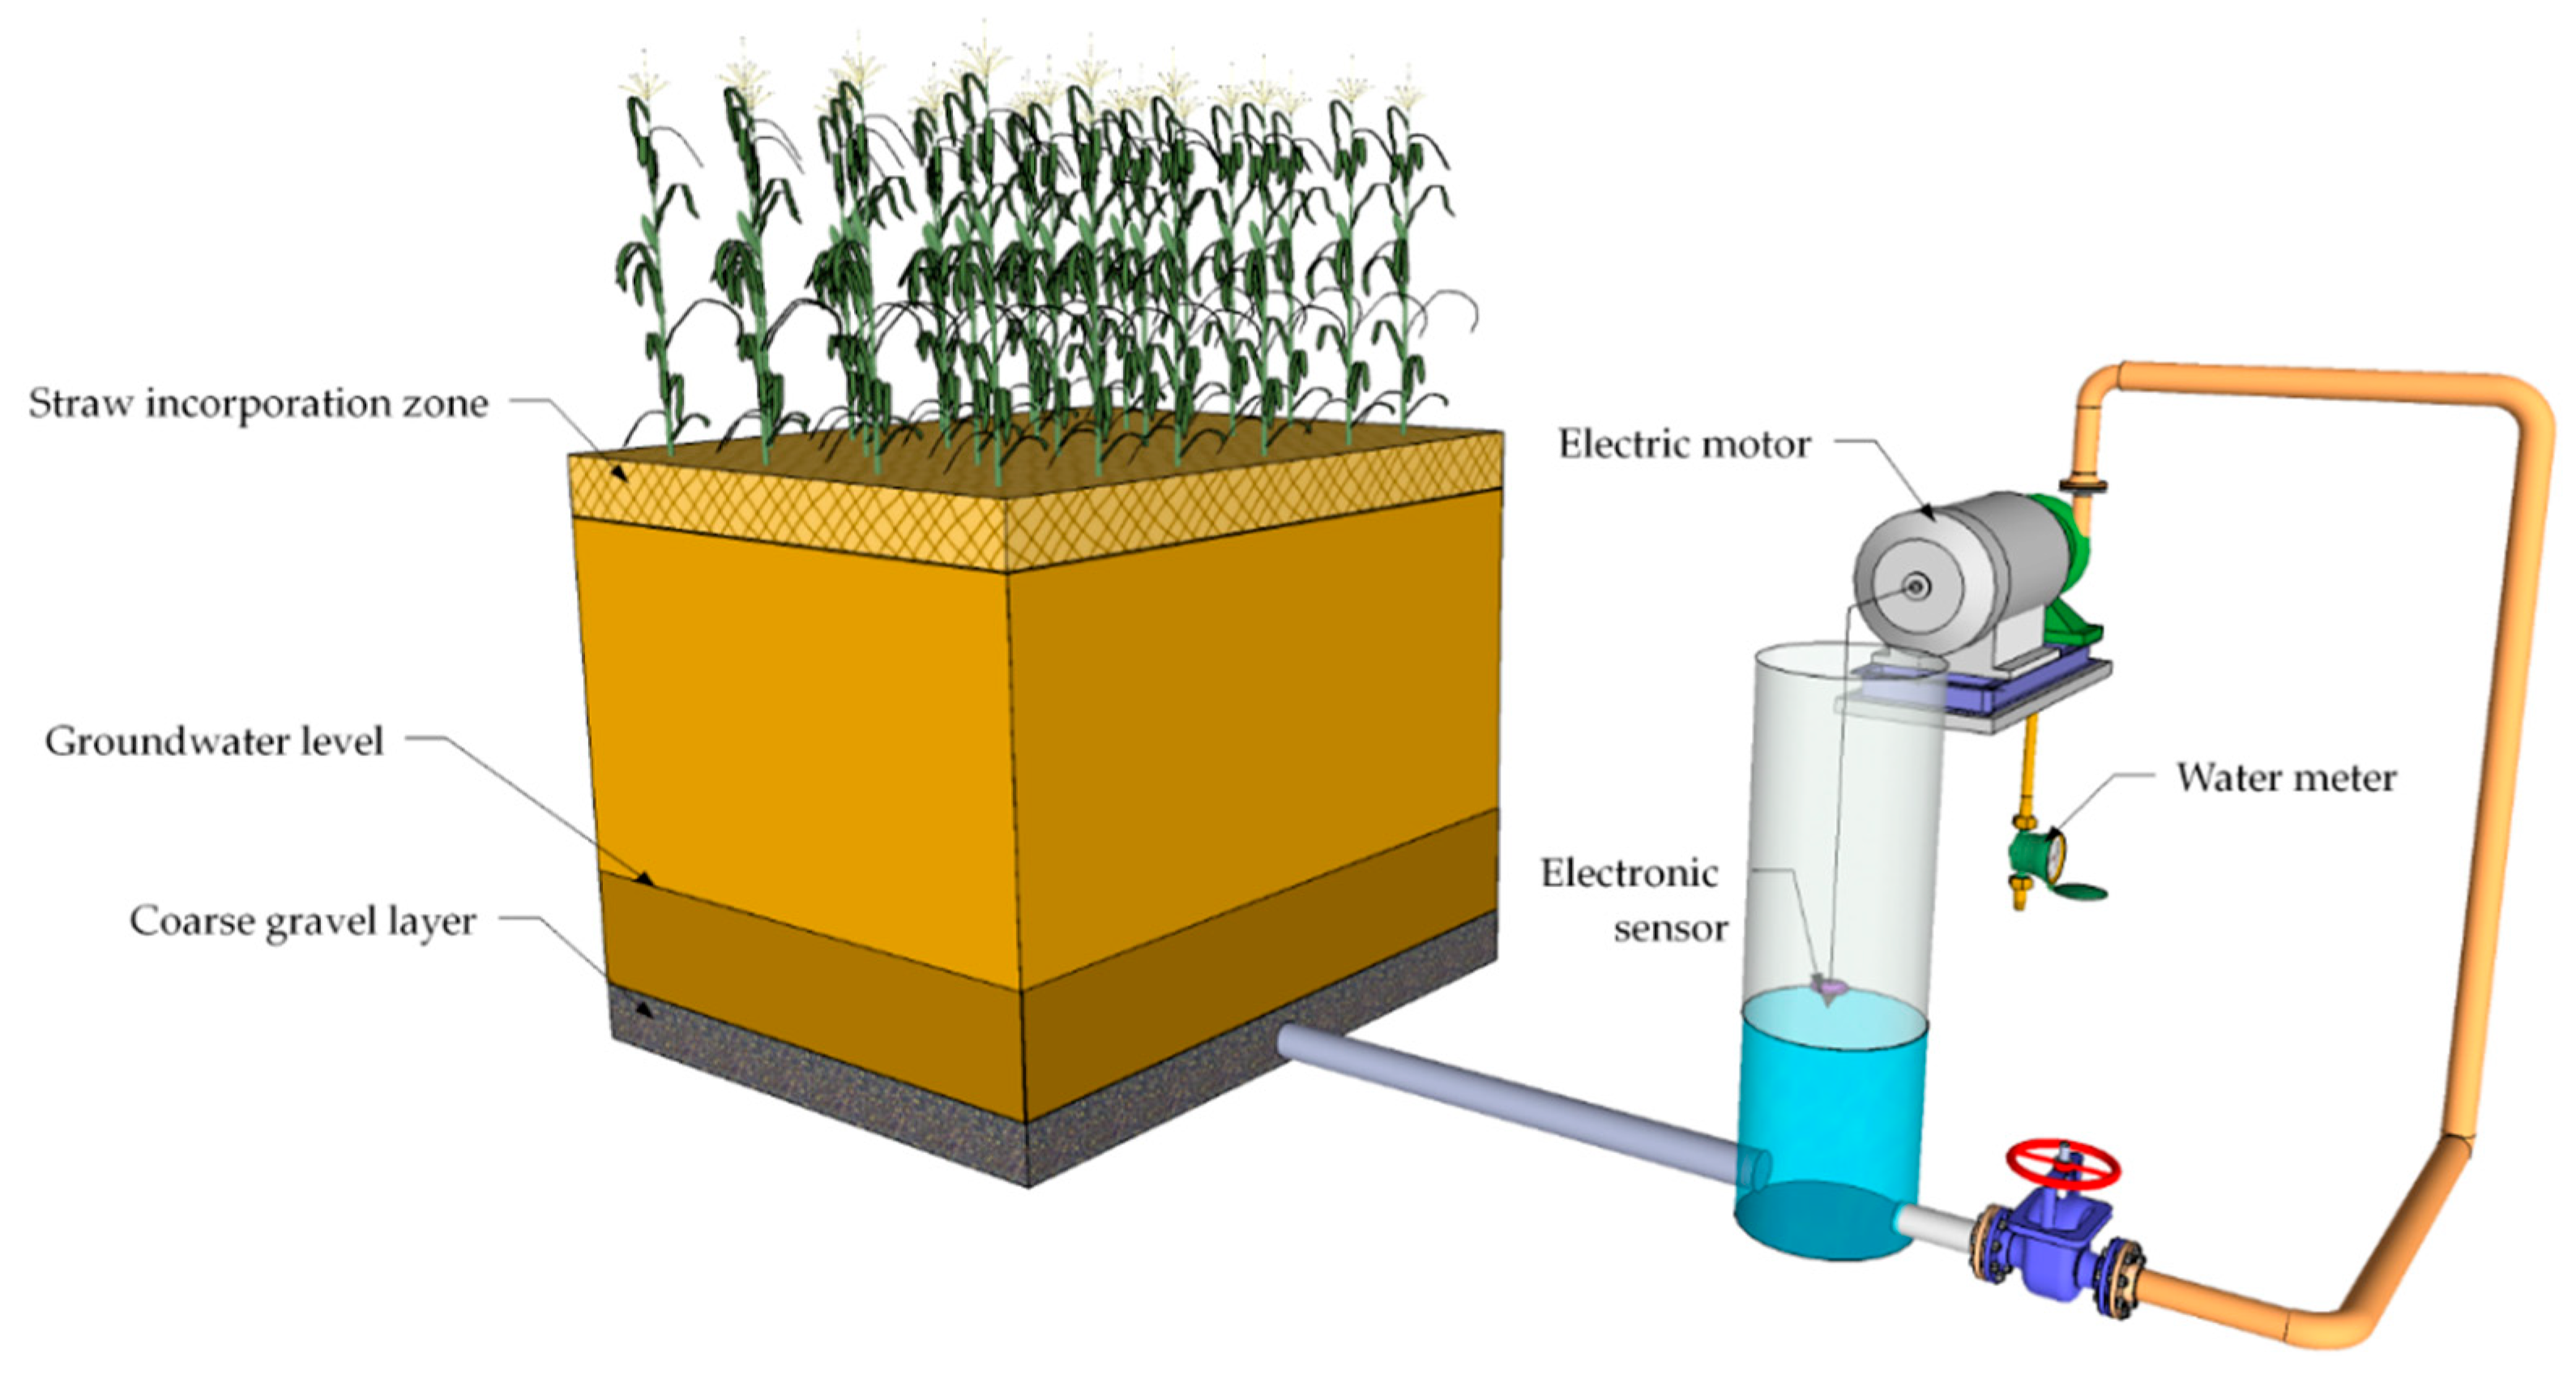
2.1. Experimental Site

Our experiment was conducted during the growing season of summer maize in 2017 and repeated in 2018 at the Key Laboratory of Efficient Irrigation-Drainage and Agricultural Soil-Water Environment in Southern China, Ministry of Education in Nanjing (118°60′ E, 31°86′ N, and 144 m above sea level). This study area experiences a subtropical humid monsoon climate, where the mean annual temperature and precipitation are 15.7 °C and 1081 mm [26], respectively. Due to prolonged exposure to sunlight and increased solar radiation in summer, the average potential evapotranspiration in summer (July to September) is 530 mm which makes up approximately 40% of the total annual amount [27]. The groundwater table of the study site tested in a borehole fluctuates in a range of 2 to 6 m below the soil surface. Before initiating the experiment, the properties and taxonomic classification of the studied soils among the 0 to 100 cm depths were determined (Table 1).

2.2. Experimental Design and Agronomic Procedures

This experiment was implemented by employing lysimeters (Key Laboratory of Efficient Irrigation-Drainage and Agricultural Soil-Water Environment in Southern China of Ministry of Education, Nanjing, China) at the same location during the 2017 and 2018 growing seasons of summer maize (June to September). Each lysimeter was 200 cm in width, 250 cm in length, and 300 cm in depth. Steel plates with a 1 cm thickness were installed to separate each lysimeter and projected 20 cm above the soil surface to prevent runoff. The bottom of each lysimeter was paved with a 20 cm layer of coarse gravel, which allowed the connection of a Marriott bottle system (Key Laboratory of Efficient Irrigation-Drainage and Agricultural Soil-Water Environment in Southern China of Ministry of Education, Nanjing, China) to maintain the groundwater table at 1.4 m during the whole experimental period. In the groundwater level control system, an electronic sensor detects the variation of the water table in the Plexiglas column (Figure 1). When the water table depth falls below 1.4 m, the electronic sensor turns on the electric motor to pump water into the system. Similarly, when the water table is above 1.4 m, the electric motor draws the water off the system. The water amounts of supply or drainage were recorded using a water meter connected to the electric motor. Furthermore, a sizeable automatic rain-shelter was used to cover all the lysimeters during the rainy days to exclude rainfall effects.
In this experiment, wheat straw was incorporated with five rates from 0 to 18 t ha−1 at the interval of 4.5 t ha−1 (0.0 t ha−1, R0; 4.5 t ha−1, R1; 9.0 t ha−1, R2; 13.5 t ha−1, R3; 18.0 t ha−1, R4). The water salinity treatments consisted of irrigation with low salinity water (1.92 dS m−1, SL) and high salinity water (3.20 dS m−1, SH). The split-plot design in randomized complete blocks was adopted, a total of 10 treatments (two water salinity levels as the main plots and five incorporation rates as the subplots) were considered, with three replications for each. Winter wheat straws were harvested and collected from a nearby farm on May 28, 2017 and June 3, 2018, and the straws were chopped into 10 to 20 cm pieces and air dried until a constant weight before being mixed manually into the top 20 cm of soil before each growing period. The low and high saline irrigation water were obtained by mixing the pure water (EC of 0.016 to 0.035 dS m−1) supplied by the laboratory with salt obtained by drying groundwater (EC from 1.7 to 11.9 dS m−1) pumped from wells near the experiment site.
The experiment involved the cultivation of the summer maize variety, SuYu29, which was seeded manually on June 20, 2017 and June 21, 2018. Soil preparation included plowing (20 cm) and harrowing with all residue of the previous crop removed from plots, and all the incorporation practices were applied prior to seeding. Maize was sown at the density of 24 plants in each lysimeter with a plant and row spacing of 40 cm and 38 cm, respectively. A total of 500 kg ha−1 compound fertilizer (N:P2O5:K2O = 30:5:5) was incorporated with the surface soil during plowing in each lysimeter as the base before sowing, and no additional fertilizer was applied after that. Weed and pest controls were performed according to local agronomic practices. During these two growing seasons, all the fertilizer and agronomic management practices were the same except an individual irrigation with 80 mm fresh water for salt leaching in each plot on June 10, 2018.

2.3. Irrigation Schedule

According to the growth characteristics and water requirement of summer maize at different growth stages [28,29], three maize growing periods—from sowing to jointing stage, from jointing to tasseling stage, and from tasseling to maturing stage—were designed with different irrigation amounts for maintenance of the water content in the root zone within the range from 50% to 90% of the field capacity [30]. In this study, the single irrigation amount was designed at 30, 40, and 60 mm for those three periods in each plot, respectively. The amount of water applied to each lysimeter was measured using a water meter, and water in different salinity levels was irrigated with separate pipes. The growth stages of maize were defined as 50% or more of the plants being at or beyond that stage. Detailed information about the irrigation amount and date is given in Table 2.

2.4. Data Collection and Measurements

2.4.1. Maize Yield and Root Mass Density

At harvest (September 27 2017 and September 30 2018), 10 plants in each treatment (3–4 plants in each lysimeter) were randomly selected for determination of the maize biomass yield. The maize biomass yield was a sum of the aboveground parts (grain, stalks, leaves, husks, and cobs), and each component was dried in an oven at 105 °C for 30 min to cease biological enzyme activity and then at 75 °C until constant mass. In terms of grain yield, another 10 maize plants in each treatment were air dried until a constant weight, and then the separated and cleaned grain was weighed. In this study, grain and biomass yield are reported on a t ha−1 basis.

2.4.2. Soil Water and Salt Content

Soil gravimetric water content was measured by using the oven-drying method, and soil samples for the moisture test were collected approximately every 10 days from sowing to harvest in each lysimeter. A 2 cm, a caliber soil auger with 110 cm in length was used to collect soil samples at the depth of 0–20 cm, 20–40 cm, 40–60 cm, 60–80 cm, and 80–100 cm at three random points in each lysimeter. After every sampling event, holes caused by soil auger were re-filled with the surrounding soil to prevent the emergence of preferential flow. For soil salt content testing, air-dried soil samples, which were collected at one day before every irrigation and at harvest, were milled and then sieved through a 1.0 mm screen, and soil particles were wetted and mixed with pure water (EC of 0.016 to 0.035 dS m−1) at a 1:5 soil:water ratio. The electrical conductivity of the extracted leachate was measured using an electrical conductivity meter (DDBJ-350, INSEA Ltd., Shanghai, China). For the analysis of the salt balance in the soil profile, measured electrical conductivity values (EC1:5) were converted to the mass of salt content in the calculated soil profile. The relationship between ECe and EC1:5 using the empirical formula developed in the same site by Lu et al. [31] is:
ECe = 9.33EC1:5 + 1.25
These ECe values were further converted to the electrical conductivity that would exist in the soil solution (ECsw) using the following equation [32]:
E C s w = S P θ E C e
where SP is the soil saturation percentage, %; θ is the volumetric soil water content (cm3 cm−3), which was converted from measured gravimetric water content by using observed average bulk density within certain depth, %.
The concentration of total dissolved salt (TDS, g L−1) in the soil extract was calculated from their ECsw values based on the following relationship [33]:
T D S = { 0.64   ×   E C   ( E C 5 dS   m 1 ) 0.80   ×   E C   ( E C > 5 dS   m 1 )
The mass of soil salt was considered in terms of the soil salt concentration and the soil depth [34]:
S S = A   ×   H   ×   T D S   ×   θ
where SS is the salt mass within the soil depth of H, kg; A is the horizontal area of each lysimeter, m2; H is the depth of the soil profile, m.

2.5. Evapotranspiration

The evapotranspiration of summer maize was calculated based on following equation [35]:
E T = P + I R D Δ W
where ET is the evapotranspiration, mm; P is the precipitation, mm; I is the irrigation amount, mm; R is the surface runoff, mm; D is the bottom water flux, mm; and △W is the soil water depletion in the 0–100 cm soil profile from sowing to harvest, mm. Since rainfall was excluded by the automatic rain shelter in this study, the value for precipitation during two growing seasons was 0 mm. Each plot was separated by iron or concrete walls, which were 20 cm above the soil surface, thus no runoff events occurred during this study. The groundwater control system was also used for estimating the deep percolation after every irrigation event by recording the discharge amount from the water meter (Figure 1).

2.6. Richards Growth Equation

A version of the exponential function known as Richards equation [36] was used to describe the relationship between SIR and the increasing rate of maize yield compared to the non-straw treatment. The increasing rate was calculated as follows:
YIR = YRi/YR0 − 1
where YIR is the yield-increasing rate, %; YR0 represents the maize yield of the non-straw treatment, kg ha−1; and YRi indicates the maize yield of the Ri treatment (I = 1, 2, 3, 4).
The form of the Richards equation in this study is:
y = ymax(1 − eax)b
where y is the yield-increasing rate (YIR), x is the SIR, ymax is the maximum value of the increasing rate, and the parameter, a, is related to the rate of change, whereas b describes the placement of the inflection point. The Richards equation produces a sigmoid curve in which there is an exponential increase until an inflection point followed by a gradual increase to an upper asymptote [37]. The upper limit described by ymax represents the maximum increasing rate, and the maximum yield can be deduced from corresponding ymax based on Equations (6) and (7).

2.7. Water Use Efficiency

Water use efficiency was defined at the grain yield level and at the biomass level, which were calculated with following equations [38]:
WUEg = Y/ET
WUEb = BY/ET
where Y is the grain yield, kg ha−1; BY is the biomass yield, kg ha−1; and ET is the evapotranspiration during the whole growing season of summer maize, mm.

2.8. Statistics Analysis

Data were analyzed by the statistical software of SPSS 20.0 (SPSS, Chicago, IL, USA). Three-way ANOVA was applied to test the effects of irrigation water salinity, straw incorporation rate, growth season (saline irrigation in the first growing season affects the soil salinity in the second growing season), and their interactions on the soil water and salt balance, as well as yield-related variables. Means effects of the above three factors were analyzed using the Duncan mean separation procedure at the 0.05 significant level. Regression analysis was conducted to quantify the relationships between the SIR and response variables (variation of soil salt content, maize yield increasing rate) by using Origin Pro 8.0 (OriginLab, Northampton, MA, USA).

3. Results

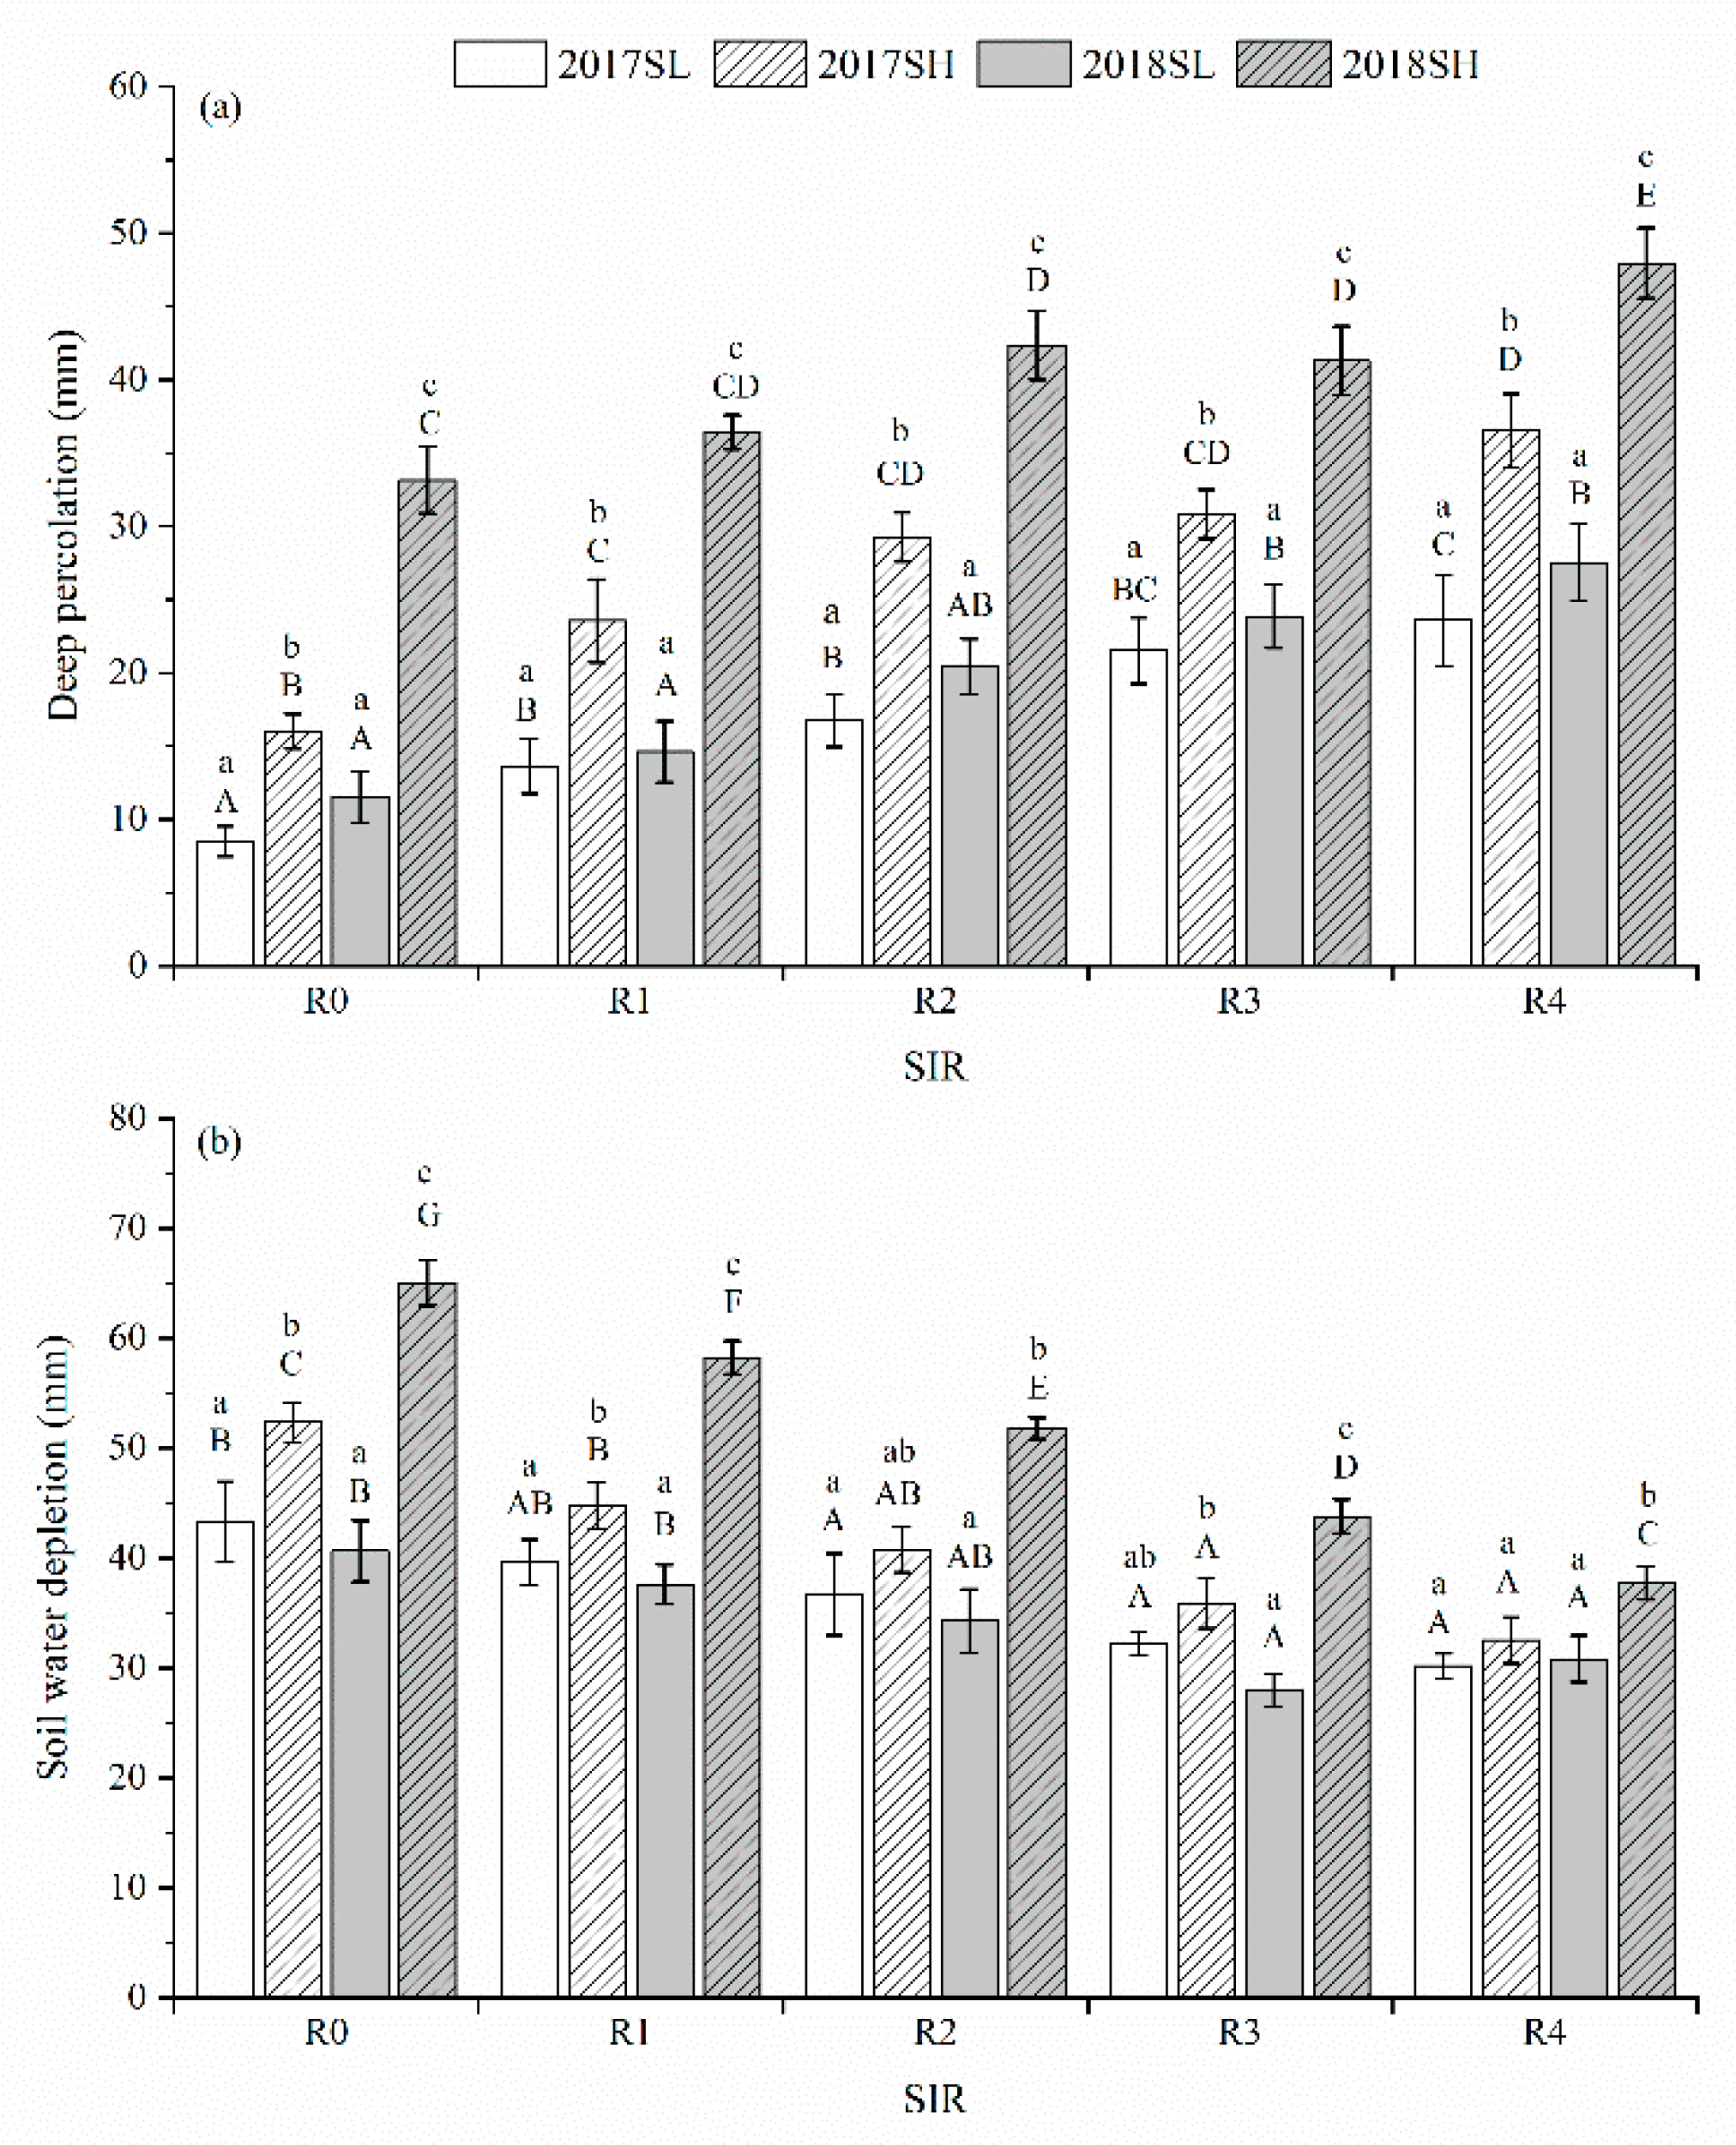
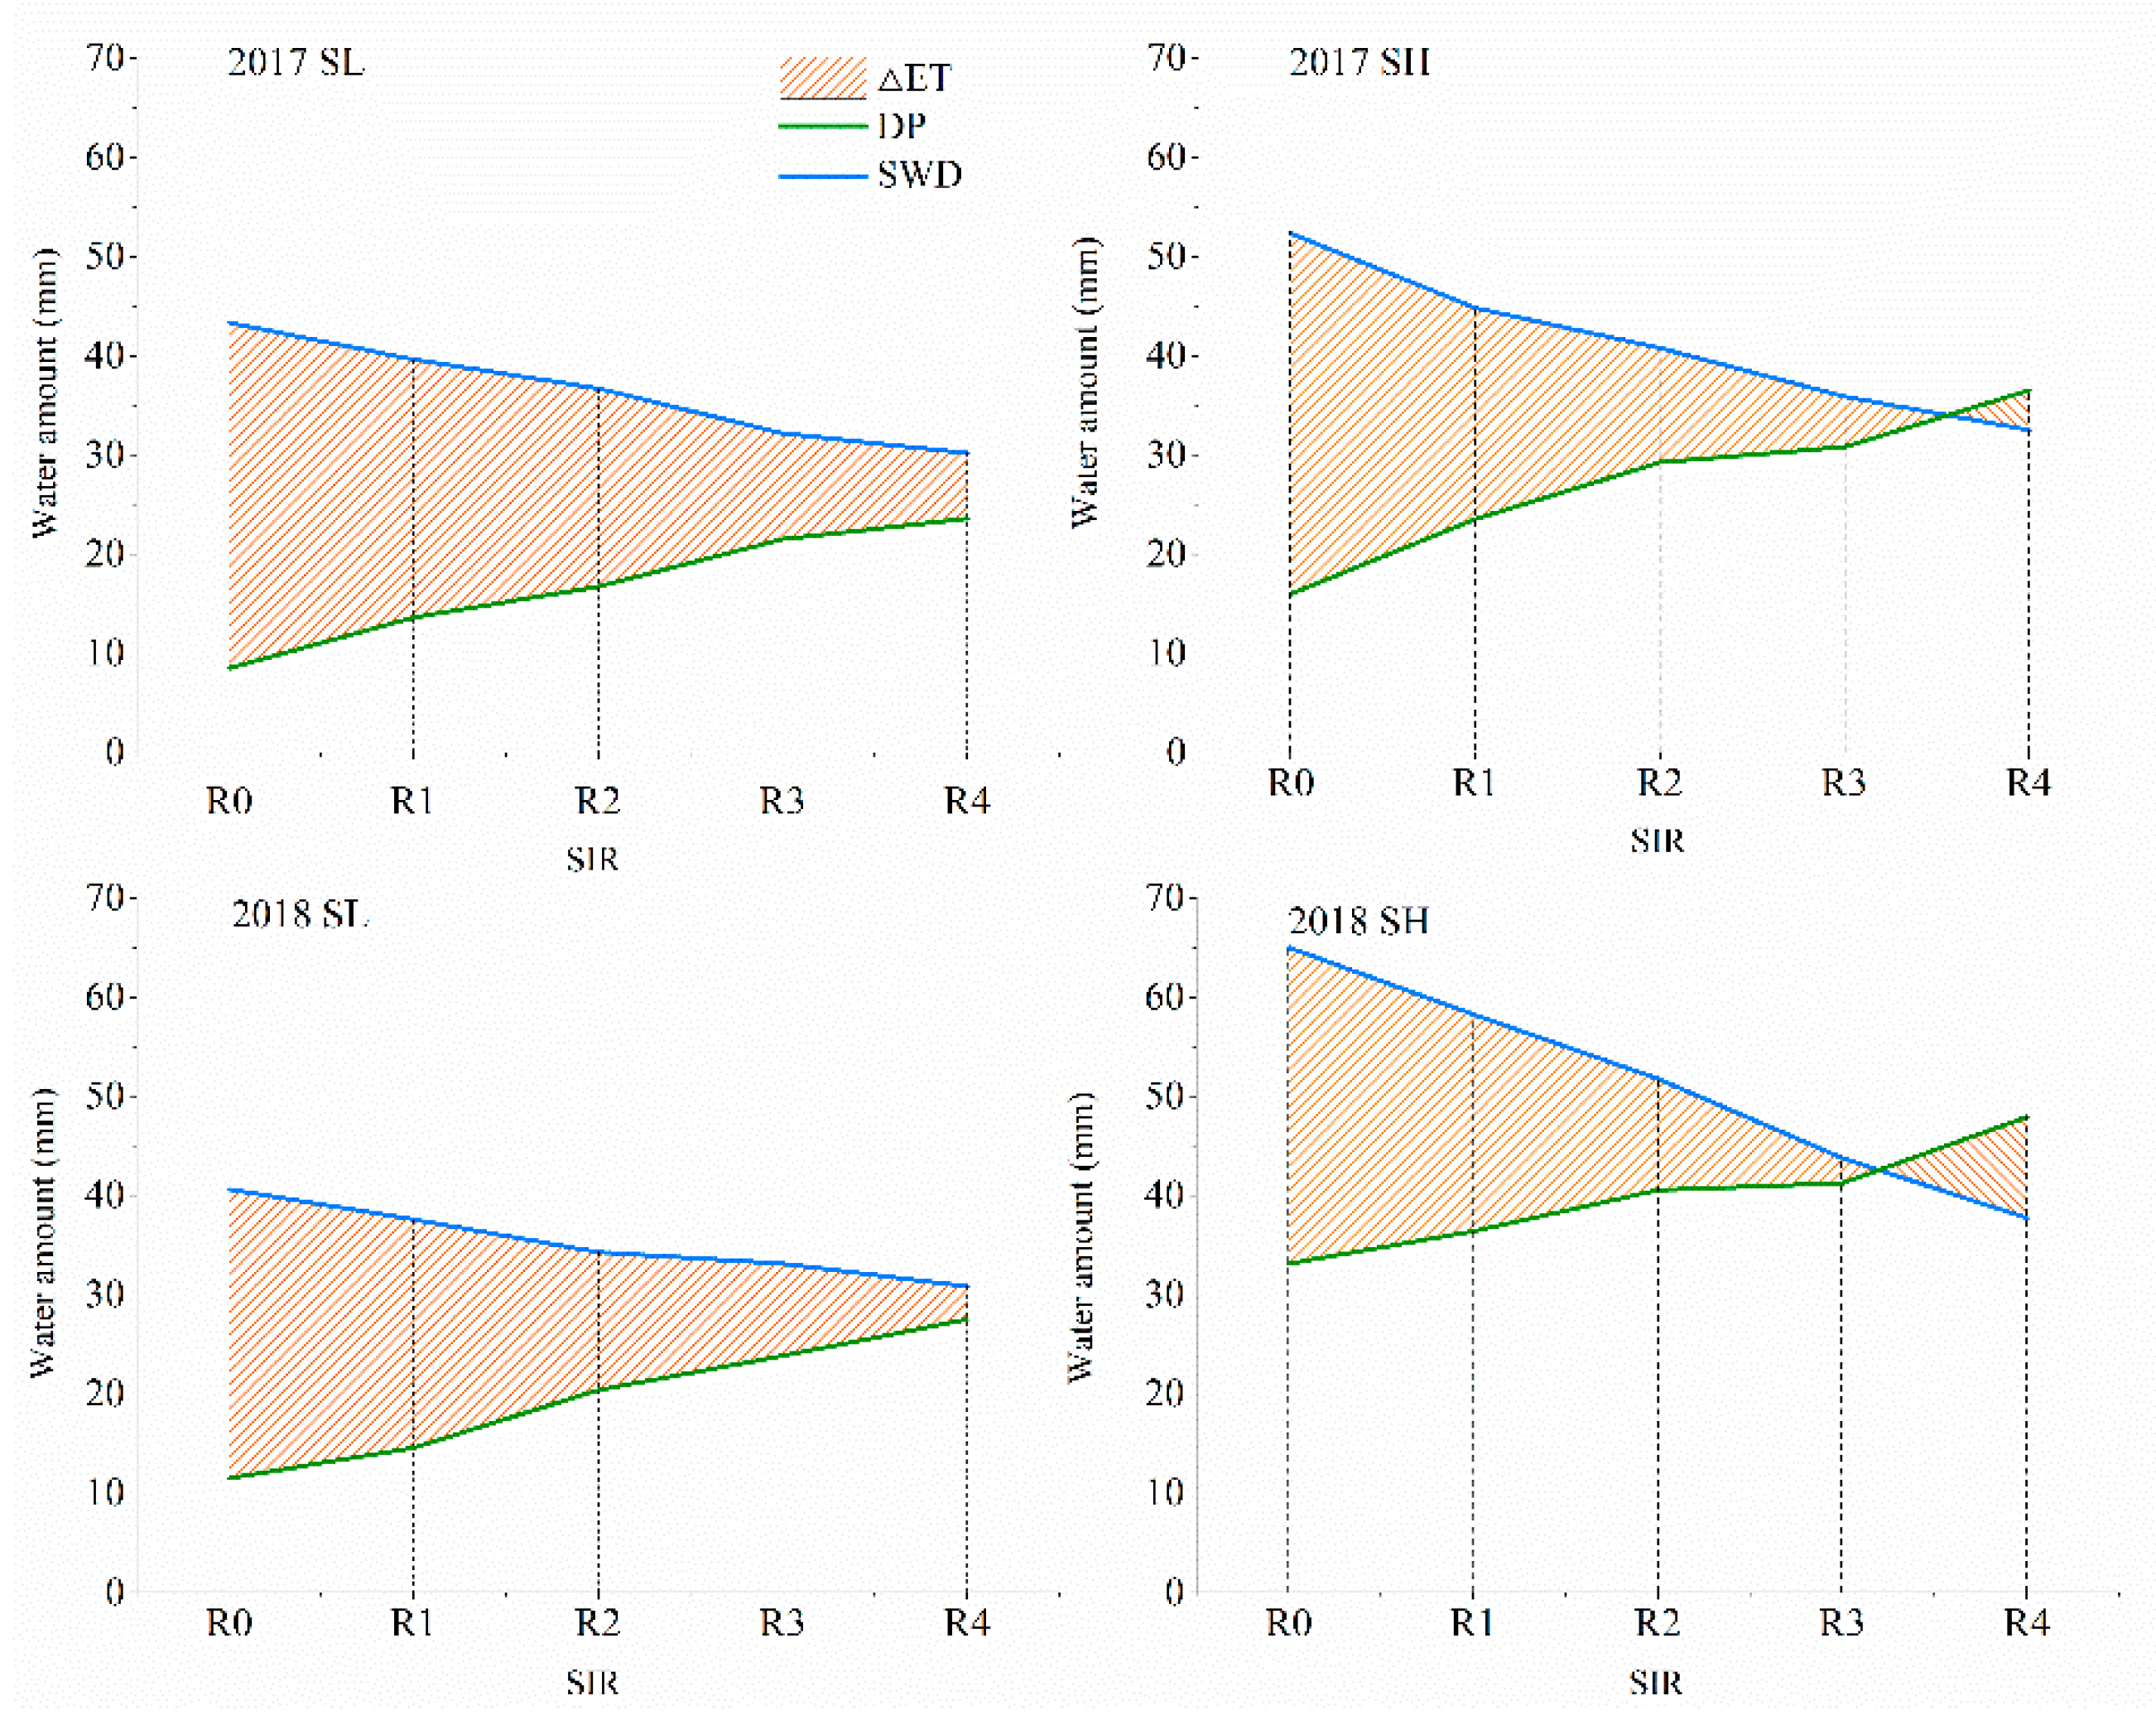
3.1. Water Balance and Soil Moisture

As shown in Table 3, the main effects of the irrigation water salinity (IWS), straw incorporation rates (SIR), and cultivation years were significant on soil water depletion (SWD), deep percolation (DP), and evapotranspiration (ET). Compared to the first growing season (2017), the average values of SWD, DP, and ET in the second growing season (2018) increased by 10.1%, increased by 35.8%, and decreased by 4.1%, respectively. For straw incorporation, a significant reduction in SWD and ET, and a significant increment in DP were observed as SIR increased. The minimum value of SWD and ET, as well as the maximum DP, were all observed in the R4 treatment. In terms of IWS, high saline water irrigation (SH) caused more SWD and DP, but less ET than low saline water irrigation (SL). The mean value of SWD, DP, and ET of all the SH treatments increased by 31.0%, increased by 85.4%, and decreased by 7.2% compared to the corresponding values under the SL condition, respectively.
It can be seen in Table 3 that the interaction effect of IWS × SIR was significant for both SWD and DP, and the interaction of IWS × YEAR only showed a significant effect on SWD. As suggested in Figure 2a,b, treatments under SL have significantly less SWD and significantly more DP than those under SH in both years, especially when the SIR was at a high level. For instance, on the two-year average basis, when compared to the non-straw incorporation treatment (R0), the values of SWD decreased with R4 by 27.3% and 40.1%, and the values of DP increased with R4 by 155.2% and 71.9% under SL and SH conditions, respectively. Besides, higher IWS values enhance the effect of straw incorporation on SWD as in the second growing year, since all the maximum SWD values were observed under the SH condition in 2018. While, in 2017, no significant changes were observed in the SWD between SL and SH in R3 and R4 treatments (Figure 2b).
Since the total irrigation amounts in different treatments were designed at the same level (320 mm) for all treatments, the variations of ET were only dominated by SWD and DP according to Equation (5). As shown in Figure 3, the deviation of ET (△ET = SWD − DP) in 2017 as affected by straw incorporation was generally higher than the corresponding values in 2018, and the average value of △ET among the five SIR levels under the SL condition was about 39.7% and 32.3% higher than it was under the SH condition in 2017 and 2018, respectively. In both years, the increase of DP was accompanied with the decrease of SWD as the SIR increased, and the minimum value of △ET under both the SL and SH condition was obtained in the R4 treatment. Notably, under the SH condition, the △ET values even became negative as the DP values were higher than SWD in the R4 treatment, and such negative values of △ET were further enlarged in 2018.
The straw incorporation rate (SIR) significantly affected the moisture content of the 0–100 cm soil layers. Except the layer of 80–100 cm, the moisture content among the 0–80 cm soil layer were significantly related to the irrigation water salinity (IWS), and a significant effect of the growing season (YEAR) on the moisture content was obtained in the soil layers of 0–20 and 20–40 cm (Table 4). Meanwhile, there was no significant two- or three-order interaction effects detected in all five soil layers. In either 2017 or 2018, the moisture contents of the soil profile were generally lower in SL than in SH, especially in the straw incorporation zone (0–20 cm), where the moisture content in SH was about 13.7% higher than that in SL. In terms of straw incorporation, increasing the SIR led to a significant increase of the soil moisture among the whole soil profile, but such increase became less pronounce and even non-significant among the 80–100 cm layer, where the effect of R2, R3, and R4 on the moisture content was at the same significance level.

3.2. Salt Balance and Salt Content

Since brackish water was irrigated in 2017, the initial values of the soil salt mass content (SSB) in 2018 were significantly increased (Table 5). The main effects of the three factors (IWS, SIR, and Year) were all significant on the soil salt mass at harvest (SSH), while the increment of the soil salt mass (SSH-SSB) was only significantly affected by IWS and SIR, and the salt storage rate (SSR) was only significantly related to the SIR. Besides, no significant interaction effect was obtained in the above soil salt related parameters. The value of SSH under SH was significantly higher than under SL, and such a significant increase was passed to the values of SSH-SSB, since the values of SSB under SL and SH in 2018 were insignificantly different. The application of straw incorporation effectively mitigated the soil salt buildup caused by saline water irrigation, and the degree of such mitigations was enhanced by increasing SIR. The minimum values of SSH, SSH-SSB, and SSR were all obtained in the R4 treatment, where the values of SSH, SSH-SSB, and SSR were about 12.9%, 20.8%, and 18.8% lower than the non-straw incorporation treatment (R0).
As present in Figure 4, in either 2017 or 2018, the salt content in both the straw incorporation layer (0–20 cm) and non-straw incorporation layer (20–100 cm) gradually increased with time due to periodical brackish water irrigation. Under both the SL and SH condition, the soil salinity was directly correlated to the SIR within he 0–20 cm soil layers and inversely correlated to the SIR within the 20–100 cm layer. At the end of each growing season, the R4 treatment presented the highest salt content within the 0–20 cm soil layers and the lowest salt content within the 20–100 cm soil profile. In addition, linear regression was applied to specify the degree of salt accumulation among those two layers. For the 0–20 cm layer, the slope of the lines progressively increased from the non-straw treatment (R0) to high-straw treatment. Conversely, the slope of the lines decreased with the increase of the SIR among the 20–100 cm soil layer where straw was not incorporated. Furthermore, such an increase or decrease in the slopes was even more evident with high salt irrigation water (SH). In consideration of the two growing seasons, although the salt content of each treatment in 2017 was lower than the corresponding values in 2018, the degree of the soil salt increase did not present a clear difference between these two years according to the slopes of those regression functions.

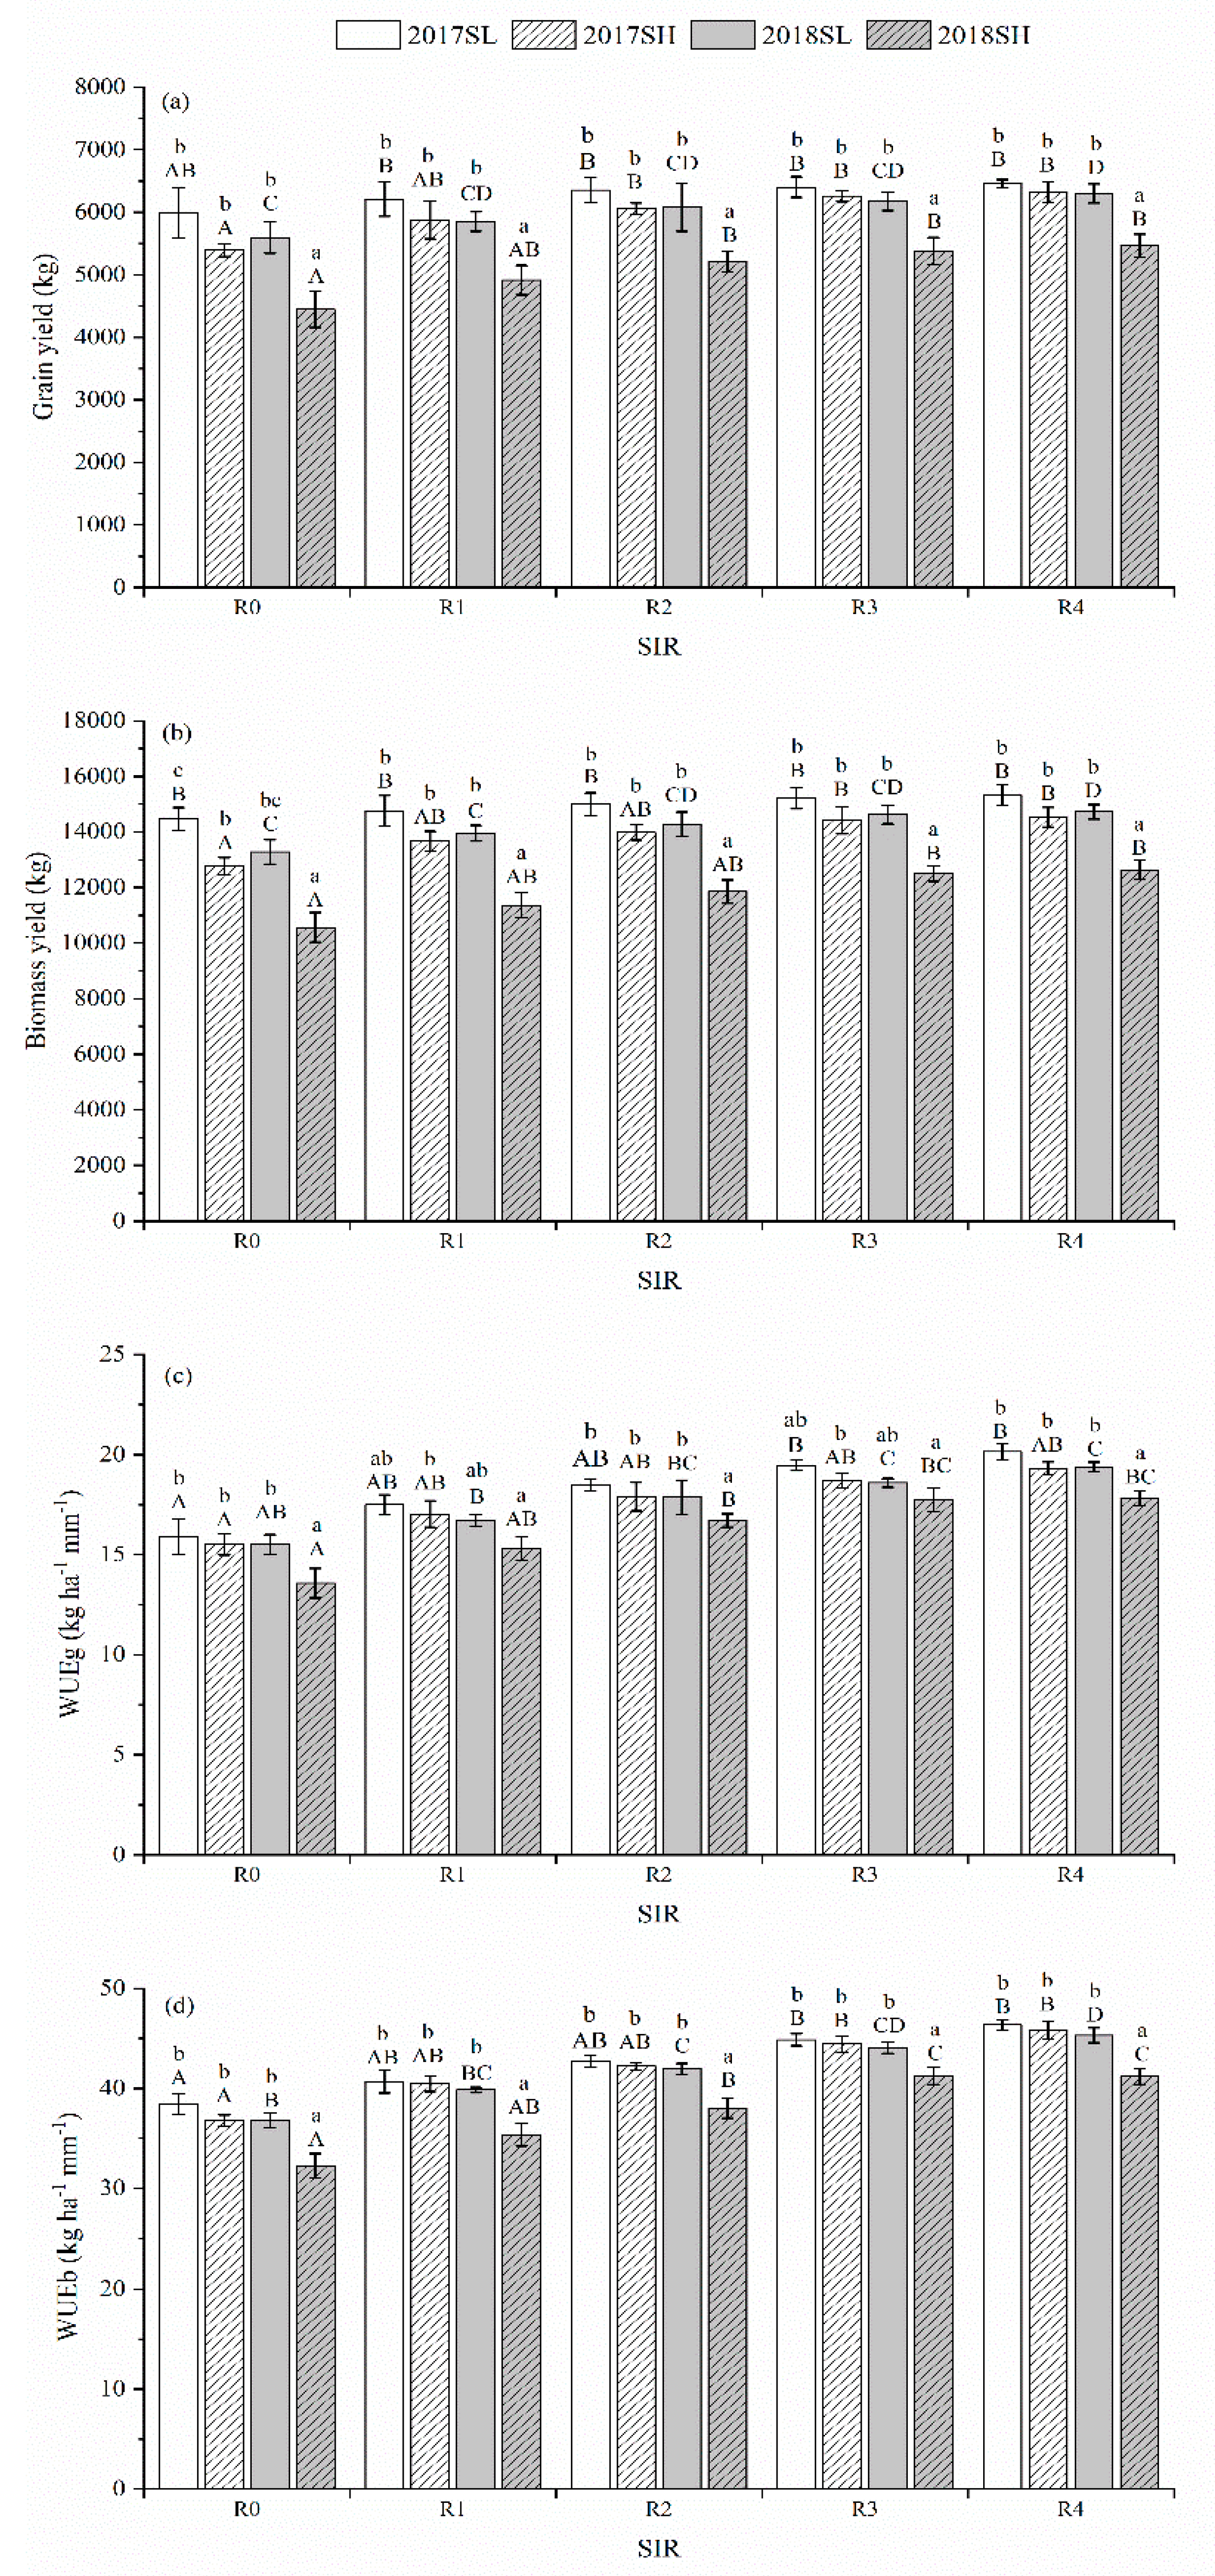
3.3. Maize Yield and Water Use Efficiency

In Table 6, significant differences between the grain yield, biomass yield, and their corresponding water use efficiencies (WUEg and WUEb) were observed as affected by IWS, SIR, and YEAR, while the variation of HI was just significantly related to the IWS. Concerning the effect of IWS, the grain yield and biomass yield under SL were higher than the corresponding values under SH by 11.0% and 13.5%, respectively. Meanwhile, water use efficiency was significantly higher under SL than under SH (by 16.15% at the grain level and 4.9% at the biomass level). Moreover, at both the grain and biomass level, the values of the yield and water use efficiency showed a positive relationship with the SIR, while such values were generally lower in 2018 than in 2017.
A significant interaction between IWS and year was observed at both the grain and biomass level for the yield and water use efficiency. Meanwhile, the significant interaction of IWS × SIR was only present in WUEg and WUEb (Table 6). As shown in Figure 5a, increasing the salt level in irrigation water caused a significant reduction in the maize yield; the average grain yield among R0 to R4 under SH were 4.8% and 1.5% lower than the corresponding values under SL in 2017 and 2018, respectively. Similarly, in Figure 5b, the relevant decrease in biomass yield were 7.2% and 16.9% in 2017 and 2018, respectively. With increasing SIR, both the grain yield and biomass yield were raised in a more significant trend under the SH condition than SL, and the maximum values of the grain yield and biomass yield were both obtained in the R4 treatment under the SL condition for both 2017 and 2018. In terms of water use efficiency, either the WUEg or WUEb was positively associated with the SIR both under SH and SL, and such a promotion effect from increasing the SIR was enhanced under the SH condition. For example, in 2017, the WUEb and WUEg under SL in the R4 treatment were 21.5% and 19.3% higher than the non-straw treatment (R0), respectively, and the relevant increases of the SH condition were raised to 29.8% and 26.0%, respectively. Notably, under the same SIR, although the values of WUEb and WUEg were generally higher in SL than in SH during this two-year experiment, such a difference was only significant in 2018 (Figure 5c,d).
Relations between the yield-increasing rate (YIR) and SIR are shown in Figure 6, and the parameters of fitting functions are presented in Table 7. With the increase of the SIR, the values of YIR at both the grain and biomass level increased sharply when the SIR was at a lower level (R1 and R2), while the degree of such increases slowed when the SIR was at a relatively higher level (R3 and R4), and this changing process was closely described by one kind of exponential function (Richards equation). Straw incorporation resulted in YIR variation, especially when the irrigation water salinity and soil salt content increased. Compared to the data in 2017, the YIRmax values for the grain yield and biomass yield in 2018 increased by 88.1% and 5.3% under SL, and 76.1% and 8.9% under SH. The corresponding maximum values of the yield calculated from YIRmax under SL and SH in 2017 were 6490 and 5819 kg ha−1 for the grain yield, and 17,928 and 15,755 kg ha−1 for the biomass yield, respectively. Accordingly, the relevant maximum yields in 2018 under SL and SH were 6476 and 5061 kg ha−1 for the grain yield, and 16,636 and 13,246 kg ha−1 for the biomass yield, respectively.

4. Discussion

The addition of crop residues tends to reduce soil bulk density and increase soil porosity [25], thereby elevating the soil saturated water content [39], which in turn increase the soil water storage in the straw incorporation zone in comparison to non-straw soil. The external surfaces of wheat straw consist of hydrophobic waxes, which could cause water repellency when applied in soil [40], and high values of water repellency can significantly modify water movement in soil aggregates, concealing the effects of matric potential and generating restrictions on water infiltration behavior [41]. Furthermore, water repellency is a soil moisture-dependent index, and a decrease in moisture content can increase the severity of water repellency. In our study, during the irrigation stage, the increased water content in the 0–20 cm soil layer could reduce the effect of water repellency, and water movement was returned to a normal pattern. However, during the evaporation stage, the water repellency becomes a more significant factor in limiting soil water dynamics as the water content decreases, which in turns maintain the water content within straw incorporation zone at a relatively high level. This is why the average water content within the 0–20 cm layer was significantly increased with an increasing SIR, but such increments gradually declined and even disappeared as the soil layer depth increased (Table 4). The deeper percolation present under a high SIR treatment could mainly be attributed to the increased water content in the soil profile. Under the same IWS, the highest amounts of deep percolation in the two experimental years were both obtained in the R4 treatment, where the maximum values of the average water content in the 0–100 cm soil profile were also observed. This finding is in agreement with what has been reported by Liu et al. [42], who pointed out that the antecedent moisture has a crucial contribution to deep percolation, especially under a high wet initial water status (around field water capacity). Under the same irrigation amount, the reduction in SWD along with the increase in DP, and the variation of ET (△ET) in our study presented in descending order with increasing SIR, especially in the SH condition, where the value of DP was even beyond the SWD value in the SIR range from R3 to R4. However, the accurate value of the equilibrium points between SWD and DP under different salt levels of irrigation water needs to be further studied through experiments with highly subdivided SIR. Furthermore, the groundwater level was constant at 1.4 m in this study, so the varied depth of the water table should also be considered as a factor to study the relationship between SWD, DP, and ET in the future.
It is well established that saline water irrigation leads to an increase in the content of exchangeable sodium, which causes the dispersion of soil stable aggregates and thus reduces hydraulic conductivity and the infiltration rate [43]. Here, we found that the values of SWD were lessened considerably under the SH condition accompanied by significant increases in deep percolation, and such a phenomenon was further enhanced in the second growing season. Meanwhile, the adverse effect of saline water irrigation on soil properties was relieved by straw incorporation, and the increased hydraulic conductivity was reflected in the increasing values of SWD as the SIR increased. Similar alleviations by crop residue application in low-permeability saline soil were reported by Mahmood et al. [44] and Zhang et al. [17]. Besides, soil water content within the straw incorporation zone (0–20 cm) was affected by the IWS, consistently showing a significant difference in both years, indicating that the positive effect of straw incorporation on the soil property was still available when the soil was subjected to secondary salinization.
Saline water irrigation is the most common human activity that results in secondary soil salinization [4]. Previous studies have proved that the soil salt accumulation caused by saline water irrigation is mainly the result of less soil leaching [20] and salt capillary upward movement due to soil evaporation [45]. In the current study, the SSR value gradually reduced with the increase of the SIR, primarily because the increased deep percolation in the higher straw incorporation treatment took away more salt from the brackish irrigation water. Additionally, using high salinity water for irrigation could reduce the soil water extraction of the crop, thereby further increasing the volume of deep percolation [46]. However, the mass of salt input was also increased, causing the factors of IWS and year to present a non-significant main effect on the SSR values (Table 5).
During the experiment, the rate of salt increase was raised with an increasing SIR at the 0–20 cm soil layer but decreased at the 20–100 cm soil layers (Figure 4). This finding can mainly be attributed to the heterogeneous and time-dependent distribution of saline soil water. On the one hand, the straw incorporation layer (0–20 cm) has an increased water-holding capacity [25], which can store more saline water and result in heavier salt accumulation during water evaporation. On the other hand, the irrigation amount increased with maize growth stages, and correspondingly increased the deep percolation, which alleviated the salt load within the soil profile below the straw incorporated zone, especially in the original no-saline soil, where the salt upward movement is negligible.
When soil was subjected to secondary salinization, straw incorporation reduced the total salt buildup caused by saline irrigation in the 0–100 cm soil profile but increased the salt content within the straw-incorporation zone (0–20 cm) compared to non-straw treatment (Figure 4). In that regard, our result is partly inconsistent with the findings of other studies describing the salt distribution in natural saline soil, in which surface soil with straw incorporated presents a capacity for salinity inhibition [5]. This inconsistency could be related to the initial soil salinity, since the interruption of the salt upper movement from straw incorporation may not show an obvious performance when the initial soil salt mass is relatively lower than the salt input by brackish water irrigation. However, in this study, we only tested two salt levels of irrigation water, but the groundwater which we used as an irrigation resource may naturally present a dynamic change in its salinity. Thus, in future study, it is necessary to design some irrigation strategies in which the irrigation water salinity is varied during the crop growing season to better simulate a real case scenario.
Commonly, high salinity in the root zone can restrict root water and nutrition uptake, and consequently reduce crop production [47,48]. However, in both years, the maximum yield and the highest salt content within the 0–20 cm layer were both obtained in the R4 treatment. This phenomenon could be the reason why the crop did not respond to the extremes of low or high salinity in the rooting depth but integrated water availability and took water from wherever salt was less accumulated. In the R4 treatment, the soil profile (20–100 cm) below the straw-incorporation layers maintained a suitable soil-water availability (73.1%–98.6% of the field capacity) and the lowest salt content during the entire experiment, which alleviated salt-stress in the high-salinity upper soil (0–20 cm) by ensuring a sufficient and low-salinity water supply for maize growth. Despite the salt stress, the degraded soil structure by salt involvement could reduce the volume of soil pores, thereby increasing the suction pressures of soil water, and making the crop exert more energy to extract the water, instead of using that energy for yield production [49].
The harvest index (HI) showed a non-significant difference among SIR treatments and less significance among IWS. This could be explained by the equal proportion variation of the grain yield and aboveground biomass yield. Moreover, the value of HI is highly dependent on the crop species and field management techniques [50,51], but such factors were controlled in the same condition for all lysimeters in our study. According to the mathematical regression results, the maximum values of the grain and biomass yield derived from the Richards function were at a reasonable level (around 6 t ha−1 for the grain yield and around 16 t ha−1 for the biomass), and the calculated yields were in an acceptable range considering the usual degree of variability of the field data [52]. It suggests that the Richard equation could be a practical way to describe the effect of the SIR on both the grain and biomass yield, since there must be an upper limit for yield production no matter how many favorable field measures are adopted. Besides, a higher value of YIRmax was obtained in SH treatments than in SL treatments, and it was higher in 2018 than in 2017 (Table 7), revealing that the effect of straw incorporation in promoting a yield increase was intensified in a higher soil salt condition.
It is well known that the ET mainly consist of soil evaporation and plant transpiration, and the transpiration amount is directly correlated to crop growth [53]. In the present study, higher yields at both the grain and biomass level were obtained in those lower ET treatments with lower IWS and higher SIR (Table 3 and Table 6), suggesting that non-productive soil evaporation occupied a higher proportion of the soil water consumption in those treatments with higher ET. The increased soil evaporation in treatments with SH and a high level of SIR could be explained by (1) the lower IWS treatments that had less salt stress on crop growth and the greater part of the soil water was supplied for transpiration, and the (2) straw incorporation block water upward movement along the soil capillary and limited evaporation from surface soil [22]. Since straw incorporation remarkably increased WUEg and WUEb compared to the non-straw condition, it is possible to improve WUE by modifying the balance between crop transpiration and soil evaporation when soil water dynamics are restricted by the salt effect [38]. Furthermore, in 2018, straw incorporation treatments showed a more significant reduction in salt accumulation, which consequently raised the ratio of transpiration to ET compared to 2017, explaining why straw incorporation had a stronger effect on reducing the loss of WUE as soil salinity increased.

5. Conclusions

Over a two-year experiment, our results suggest that increasing the straw incorporation rate in topsoil can effectively preserve crop growth as the soil is subject to secondary salinization caused by brackish water irrigation. With an increasing straw incorporation rate, (1) soil moisture among the 0–100 cm depth was increasingly raised by decreasing soil water depletion and increasing deep percolation; (2) the total mass of salt deposited in the entire soil profile (0–100 cm) was reduced, but an obvious increase of the soil salt content was present in the straw incorporated zone (0–20 cm) over time, and such variations were greater when the irrigation water salinity was increased; and (3) the reduction of the maize yield at both the grain and biomass levels caused by brackish water irrigation was significantly alleviated, and their corresponding water use efficiencies were consequently improved. However, large-scale and multi-factor field research is recommended to further optimize the application of straw incorporation for sustainable prevention and control of secondary salinization.

Author Contributions

Conceptualization, P.L. and Z.Z. (Zhanyu Zhang); methodology, P.L., Z.Z. (Zemin Zhang) and M.H.; software, P.L.; formal analysis, P.L. and Z.Z. (Zhanyu Zhang); investigation, P.L. and M.H.; data curation, P.L. and Z.Z. (Zemin Zhang); writing—original draft preparation, P.L.; writing—review and editing, P.L. and Z.S.; funding acquisition, Z.Z. (Zhanyu Zhang) and Z.S.

Funding

Funding for this research was partially supported by the Natural Science Foundation of China (no. 51579069), the Fundamental Research Funds for the Central Universities (2017B691X14), the Scientific Research Innovation Projects in Jiangsu General Universities (KYCX17-0437), and the USDA-NIFA Hatch Project (grant no. TEX0-1-9448).

Acknowledgments

We thank for the contribution of Wei Qi, Chengxin Zheng, Xufan Shi, Shimin Fan, and Richwell Mwiya in the field works about ploughing, irrigation, and harvesting.

Conflicts of Interest

The authors declare no conflict of interest.

References

  1. Liu, H.S.; Yoshikawa, N.; Tamaki, S. Effective method of removing saltwater wedge for preserving agricultural water quality. Paddy Water Environ. 2017, 15, 331–341. [Google Scholar] [CrossRef]
  2. Wang, X.P.; Yang, J.S.; Liu, G.M.; Yao, R.J.; Yu, S.P. Impact of irrigation volume and water salinity on winter wheat productivity and soil salinity distribution. Agric. Water Manag. 2015, 149, 44–54. [Google Scholar] [CrossRef]
  3. Kitamura, Y.; Yano, T.; Honna, T.; Yammoto, S.; Inosako, K. Causes of farmland salinization and remedial measures in the Aral Sea basin—Research on water management to prevent secondary salinization in rice-based cropping system in and land. Agric. Water Manag. 2006, 85, 1–14. [Google Scholar] [CrossRef]
  4. Seydehmet, J.; Lv, G.H.; Nurmemet, I.; Aishan, T.; Abliz, A.; Sawut, M.; Abliz, A.; Eziz, M. Model prediction of secondary soil salinization in the Keriya Oasis, Northwest China. Sustainability 2018, 10, 656. [Google Scholar] [CrossRef]
  5. Xie, W.; Wu, L.; Zhang, Y.; Wu, T.; Li, X.; Ouyang, Z. Effects of straw application on coastal saline topsoil salinity and wheat yield trend. Soil Tillage Res. 2017, 169, 1–6. [Google Scholar] [CrossRef]
  6. Zhang, T.T.; Zeng, S.L.; Gao, Y.; Ouyang, Z.T.; Li, B.; Fang, C.M.; Zhao, B. Assessing impact of land uses on land salinization in the Yellow River Delta, China using an integrated and spatial statistical model. Land Use Policy 2011, 28, 857–866. [Google Scholar] [CrossRef]
  7. Romic, D.; Romic, M.; Zovko, M.; Bakic, H.; Ondrasek, G. Trace metals in the coastal soils developed from estuarine floodplain sediments in the Croatian Mediterranean region. Environ. Geochem. Health 2012, 34, 399–416. [Google Scholar] [CrossRef] [PubMed]
  8. Singh, A. Alternative management options for irrigation-induced salinization and waterlogging under different climatic conditions. Ecol. Indic. 2018, 90, 184–192. [Google Scholar] [CrossRef]
  9. Luo, W.; Sands, G.R.; Youssef, M.; Strock, J.S.; Song, I.; Canelon, D. Modeling the impact of alternative drainage practices in the northern Corn-belt with DRAINMOD-NII. Agric. Water Manag. 2010, 97, 389–398. [Google Scholar] [CrossRef]
  10. Zhu, C.; Huang, M.; Zhai, Y.; Zhang, Z.; Zheng, J.; Liu, Z. Response of gas exchange and chlorophyll fluorescence of maize to alternate irrigation with fresh- and brackish water. Acta Agric. Scand. Sect. B 2017, 67, 474–484. [Google Scholar] [CrossRef]
  11. Abd El-Mageed, T.A.; Semida, W.M.; Abd El-Wahed, M.H. Effect of mulching on plant water status, soil salinity and yield of squash under summer-fall deficit irrigation in salt affected soil. Agric. Water Manag. 2016, 173, 1–12. [Google Scholar] [CrossRef]
  12. Cuevas, J.; Daliakopoulos, I.N.; Del Moral, F.; Hueso, J.J.; Tsanis, I.K. A review of soil-improving cropping systems for soil salinization. Agron. Basel 2019, 9, 295. [Google Scholar] [CrossRef]
  13. Ren, J.Q.; Yu, P.X.; Xu, X.H. Straw utilization in china-status and recommendations. Sustainability 2019, 11, 1762. [Google Scholar] [CrossRef]
  14. Cao, J.; Liu, C.; Zhang, W.; Guo, Y. Effect of integrating straw into agricultural soils on soil infiltration and evaporation. Water Sci. Technol. 2012, 65, 2213–2218. [Google Scholar] [CrossRef] [PubMed]
  15. Lu, P.R.; Zhang, Z.Y.; Feng, G.X.; Huang, M.Y.; Shi, X.F. Experimental study on the potential use of bundled crop straws as subsurface drainage material in the newly reclaimed coastal land in Eastern China. Water 2018, 10, 31. [Google Scholar] [CrossRef]
  16. Papini, R.; Valboa, G.; Favilli, F.; L’Abate, G. Influence of land use on organic carbon pool and chemical properties of Vertic Cambisols in central and southern Italy. Agric. Ecosyst. Environ. 2011, 140, 68–79. [Google Scholar] [CrossRef]
  17. Zhang, P.; Wei, T.; Jia, Z.; Han, Q.; Ren, X.; Li, Y. Effects of straw incorporation on soil organic matter and soil water-stable aggregates content in semiarid regions of Northwest China. PLoS ONE 2014, 9, e92839. [Google Scholar] [CrossRef]
  18. Pinheiro, E.F.M.; Pereira, M.G.; Anjos, L.H.C. Aggregate distribution and soil organic matter under different tillage systems for vegetable crops in a Red Latosol from Brazil. Soil Tillage Res. 2004, 77, 79–84. [Google Scholar] [CrossRef]
  19. Karami, A.; Homaee, M.; Afzalinia, S.; Ruhipour, H.; Basirat, S. Organic resource management: Impacts on soil aggregate stability and other soil physico-chemical properties. Agric. Ecosyst. Environ. 2012, 148, 22–28. [Google Scholar] [CrossRef]
  20. Zhang, K.; Miao, C.; Xu, Y.; Hua, X.; Han, H.; Yang, J.; Ren, S.; Zhang, H.; Huang, Z.; Jin, W.; et al. Process fundamentals and field demonstration of wheat straw enhanced salt leaching of petroleum contaminated farmland. Huanjing Kexue 2009, 30, 231–236. (In Chinese) [Google Scholar]
  21. Liu, D.L.; Zeleke, K.T.; Wang, B.; Macadam, I.; Scott, F.; Martin, R.J. Crop residue incorporation can mitigate negative climate change impacts on crop yield and improve water use efficiency in a semiarid environment. Eur. J. Agron. 2017, 85, 51–68. [Google Scholar] [CrossRef] [Green Version]
  22. Wang, X.; Jia, Z.; Liang, L. Effect of straw incorporation on the temporal variations of water characteristics, water—Use efficiency and maize biomass production in semi-arid China. Soil Tillage Res. 2015, 153, 36–41. [Google Scholar] [CrossRef]
  23. Balwinder, S.; Eberbach, P.L.; Humphreys, E.; Kukal, S.S. The effect of rice straw mulch on evapotranspiration, transpiration and soil evaporation of irrigated wheat in Punjab, India. Agric. Water Manag. 2011, 98, 1847–1855. [Google Scholar] [CrossRef]
  24. Cai, A.D.; Liang, G.P.; Zhang, X.B.; Zhang, W.J.; Li, L.; Rui, Y.C.; Xu, M.G.; Luo, Y.Q. Long-term straw decomposition in agro-ecosystems described by a unified three-exponentiation equation with thermal time. Sci. Total Environ. 2018, 636, 699–708. [Google Scholar] [CrossRef] [PubMed]
  25. Wang, X.; Jia, Z.; Liang, L.; Zhao, Y.; Yang, B.; Ding, R.; Wang, J.; Nie, J. Changes in soil characteristics and maize yield under straw returning system in dryland farming. Field Crops Res. 2018, 218, 11–17. [Google Scholar] [CrossRef]
  26. Mao, Y.; Wu, H.; Pei, H.; He, P.; Liu, D. Climate features of summer rainfall in Nanjing during recent 50 a. Sci. Meteorol. Sinica 2012, 32, 646–652. (In Chinese) [Google Scholar]
  27. Mai, M.; Huo, Y.; Xiang, Y.; Miao, X. Variation of evaporation and its impact factors from 1960 to 2012 in Jiangsu province. J. Meteor. Environ. 2015, 31, 134–140. (In Chinese) [Google Scholar]
  28. Gimenez, L. Corn and soybeans response to different water availability at various stages of crop development. Agrocienc. Urug. 2017, 21, 77–90. [Google Scholar]
  29. Wu, D.; Fang, S.B.; Li, X.; He, D.; Zhu, Y.C.; Yang, Z.Q.; Xu, J.X.; Wu, Y.J. Spatial-temporal variation in irrigation water requirement for the winter wheat-summer maize rotation system since the 1980s on the North China Plain. Agric. Water Manag. 2019, 214, 78–86. [Google Scholar] [CrossRef]
  30. Zhou, S.; Hu, X.; Wang, W.E.; Zhang, Y. Water-saving and stable yield effects of regulation on soil wetted depth in different growth stage of spring maize. Trans. CSAE 2016, 32, 125–132. (In Chinese) [Google Scholar]
  31. Lu, P.; Zhang, Z.; Sheng, Z.; Huang, M.; Zhang, Z. assess effectiveness of salt removal by a subsurface drainage with bundled crop straws in coastal saline soil using HYDRUS-3D. Water 2019, 11, 943. [Google Scholar] [CrossRef]
  32. Hanson, B.; Hopmans, J.W.; Simunek, J. Leaching with subsurface drip irrigation under saline, shallow groundwater conditions. Vadose Zone J. 2008, 7, 810–818. [Google Scholar] [CrossRef]
  33. Grattan, S. Irrigation Water Salinity and Crop Production, 1st ed.; UCANR Publications: Oakland, CA, USA, 2002. [Google Scholar]
  34. Feng, G.X.; Zhang, Z.Y.; Wan, C.Y.; Lu, P.R.; Bakour, A. Effects of saline water irrigation on soil salinity and yield of summer maize (Zea mays L.) in subsurface drainage system. Agric. Water Manag. 2017, 193, 205–213. [Google Scholar] [CrossRef]
  35. Li, Q.; Dong, B.; Qiao, Y.; Liu, M.; Zhang, J. Root growth, available soil water, and water-use efficiency of winter wheat under different irrigation regimes applied at different growth stages in North China. Agric. Water Manag. 2010, 97, 1676–1682. [Google Scholar] [CrossRef]
  36. Richards, F.J. A flexible growth function for empirical use. J. Exp. Bot. 1959, 10, 290–300. [Google Scholar] [CrossRef]
  37. Burger, M.; Dumlao, M.R.; Wang, J.; Moradi, B.A.; Horwath, W.R.; Silk, W.K. Cover crop development related to nitrate uptake and cumulative temperature. Crop. Sci. 2017, 57, 971–982. [Google Scholar] [CrossRef]
  38. Zhang, M.M.; Dong, B.D.; Qiao, Y.Z.; Yang, H.; Wang, Y.K.; Liu, M.Y. Effects of sub-soil plastic film mulch on soil water and salt content and water utilization by winter wheat under different soil salinities. Field Crops Res. 2018, 225, 130–140. [Google Scholar] [CrossRef]
  39. Zhao, X.L.; Yuan, G.Y.; Wang, H.Y.; Lu, D.J.; Chen, X.Q.; Zhou, J.M. Effects of full straw incorporation on soil fertility and crop yield in rice-wheat rotation for silty clay loamy cropland. Agron. Basel 2019, 9, 133. [Google Scholar] [CrossRef]
  40. De Jonge, L.W.; Moldrup, P.; Jacobsen, O.H. Soil-water content dependency of water repellency in soils: Effect of crop type, soil management, and physical-chemical parameters. Soil Sci. 2007, 172, 577–588. [Google Scholar] [CrossRef]
  41. Vogelmann, E.S.; Reichert, J.M.; Prevedello, J.; Awe, G.O.; Cerda, A. Soil moisture influences sorptivity and water repellency of topsoil aggregates in native grasslands. Geoderma 2017, 305, 374–381. [Google Scholar] [CrossRef] [Green Version]
  42. Liu, X.; Gao, W.; Sun, S.; Hu, A.; He, Y.; He, S. Responses of soil water dynamic processes and groundwater recharge to irrigation intensity and antecedent moisture in the vadose zone. Hydrol. Process. 2019, 33, 849–863. [Google Scholar] [CrossRef]
  43. Tedeschi, A.; Dell’Aquila, R. Effects of irrigation with saline waters, at different concentrations, on soil physical and chemical characteristics. Agric. Water Manag. 2005, 77, 308–322. [Google Scholar] [CrossRef]
  44. Mahmood, I.A.; Ali, A.; Aslam, M.; Shahzad, A.; Sultan, T.; Hussain, F. Phosphorus availability in different salt-affected soils as influenced by crop residue incorporation. Int. J. Agric. Biol. 2013, 15, 472–478. [Google Scholar]
  45. Zhao, Y.; Li, Y.; Wang, J.; Pang, H.; Li, Y. Buried straw layer plus plastic mulching reduces soil salinity and increases sunflower yield in saline soils. Soil Tillage Res. 2016, 155, 363–370. [Google Scholar] [CrossRef]
  46. Kan, I.; Schwabe, K.A.; Knapp, K.C. Microeconomics of irrigation with saline water. J. Agric. Resour. Econ. 2002, 27, 16–39. [Google Scholar]
  47. Ramos, T.B.; Simunek, J.; Goncalves, M.C.; Martins, J.C.; Prazeres, A.; Castanheira, N.L.; Pereira, L.S. Field evaluation of a multicomponent solute transport model in soils irrigated with saline waters. J. Hydrol. 2011, 407, 129–144. [Google Scholar] [CrossRef]
  48. Shalhevet, J.; Huck, M.G.; Schroeder, B.P. Root and shoot growth-responses to salinity in maize and soybean. Agron. J. 1995, 87, 512–516. [Google Scholar] [CrossRef]
  49. Jones, H.G. Monitoring plant and soil water status: Established and novel methods revisited and their relevance to studies of drought tolerance. J. Exp. Bot. 2007, 58, 119–130. [Google Scholar] [CrossRef] [PubMed]
  50. Prasad, P.V.V.; Boote, K.J.; Allen, L.H.; Sheehy, J.E.; Thomas, J.M.G. Species, ecotype and cultivar differences in spikelet fertility and harvest index of rice in response to high temperature stress. Field Crops Res. 2006, 95, 398–411. [Google Scholar] [CrossRef]
  51. Yang, J.C.; Zhang, J.H. Crop management techniques to enhance harvest index in rice. J. Exp. Bot. 2010, 61, 3177–3189. [Google Scholar] [CrossRef] [Green Version]
  52. Liu, Z.; Qin, A.; Zhang, J.; Sun, J.; Ning, D.; Zhao, B.; Xiao, J.; Liu, Z.; Duan, A. Maize yield as a function of water availability across precipitation years in the North China Plain. Crop. Sci. 2017, 57, 2226–2237. [Google Scholar] [CrossRef]
  53. Herbst, M.; Kappen, L.; Thamm, F.; Vanselow, R. Simultaneous measurements of transpiration, soil evaporation and total evaporation in a maize field in northern Germany. J. Exp. Bot. 1996, 47, 1957–1962. [Google Scholar] [CrossRef]
Figure 1. Sketch of the experimental lysimeter with the water level control system.
Agronomy 09 00341 g001
Figure 2. Soil water depletion (a) and deep percolation (b) response to straw incorporation rates (SIRs) and irrigation water salinity (IWS) in 2017 and 2018. Note: SL indicates the low salinity water (1.92 dS m−1); SH indicates the high salinity water (3.20 dS m−1). Lowercase letters indicate significant differences between different YEAR and IWS combinations for the same SIR treatment and uppercase letters indicate significant differences between different IWS and SIR combinations for the same YEAR. Data without the same letter differ significantly at the p = 0.05 level.
Agronomy 09 00341 g002
Figure 3. Effect of irrigation water salinity (IWS) and straw incorporation rate (SIR) on soil water depletion (SWD), deep percolation (DP), and the variation of evapotranspiration (△ET). △ET refers to the deviation of SWD and DP. Note: R0, R1, R2, R3, and R4 indicate the straw incorporation rates of 0, 4.5, 9.0, 13.5, and 18.0 t ha−1, respectively; SL indicates the low salinity water (1.92 dS m−1); SH indicates the high salinity water (3.20 dS m−1).
Agronomy 09 00341 g003
Figure 4. Soil salinity (EC1:5) variation within the straw incorporation layer (0–20 cm) and non-straw incorporation layer (20–100 cm) in 2017 (a) and 2018 (b). Note: R0, R1, R2, R3, and R4 indicate the straw incorporation rates of 0, 4.5, 9.0, 13.5, and 18.0 t ha−1, respectively; SL indicates the low salinity water (1.92 dS m−1); SH indicates the high salinity water (3.20 dS m−1).
Agronomy 09 00341 g004
Figure 5. Grain yield (a), biomass yield (b), and water use efficiency at grain (c) and biomass (d) level response to straw incorporation rates (SIR) and irrigation water salinity (IWS) in 2017 and 2018. Note: SL indicates the low salinity water (1.92 dS m−1); SH indicates the high salinity water (3.20 dS m−1). Lowercase letters indicated significant differences between different YEAR and IWS combinations for the same SIR treatment and uppercase letters indicate significant differences between different IWS and SIR combinations for the same YEAR. Data without a same letter differ significantly at the p = 0.05 level.
Agronomy 09 00341 g005
Figure 6. Relationships between the water use efficiency and straw incorporation rate in 2017 and 2018. Note: GYSL and GYSH indicates the grain yield increasing rate under the SL and SH irrigation water conditions, respectively; BYSL and BYSH indicates the biomass yield increasing rate under the SL and SH irrigation water conditions, respectively.
Agronomy 09 00341 g006
Table 1. Soil properties and taxonomic classification at different depths (0–100 cm) in May 2017. Soil texture are determined by the USDA (United States Department of Agriculture) textural soil classification system.
Depth (cm)Bulk Density (g cm−3)Field Capacity (cm3 cm−3)pHWilling Point (cm3 cm−3)Mechanical Composition (%)Soil Texture
SandSlitClay
0–201.290.396.570.1531.9244.8923.19Clay loam
20–401.380.356.770.1428.5542.6328.82Clay loam
40–601.400.356.580.1129.7837.8632.36Clay loam
60–801.450.346.820.1130.2730.1539.58Clay loam
80–1001.470.346.790.1026.7930.4442.77Clay
Table 2. Irrigation schedule for different growing periods in two growing seasons.
Year Sowing to Jointing StageJointing to Tasseling StageTasseling to Maturing StageTotal Amount
2017Date2 July11 July20 July31 July11 August27 August11 September320 mm
Amount30 mm30 mm40 mm40 mm60 mm60 mm60 mm
2018Date1 July10 July19 July29 July9 August25 August11 September320 mm
Amount30 mm30 mm40 mm40 mm60 mm60 mm60 mm
Table 3. Mean values of soil water depletion (SWD), deep percolation (DP), and evapotranspiration (ET) and results of the three-way ANOVA with irrigation water salinity (IWS), straw incorporation rates (SIR), and growing season (YEAR) as factors.
FactorsSWD (mm)DP (mm)ET (mm)
IWS
SL35.34a18.19a337.14b
SH46.29b33.73b312.56a
SIR
R050.33c17.30a353.04c
R145.08b22.06b343.02b
R240.89ab27.19bc333.70ab
R334.97a29.37bc325.59a
R432.83a33.90c318.92a
YEAR
201738.85a22.02a336.82b
201842.79b29.91b322.88a
ANOVA
IWS******
SIR******
YEAR*****
IWS × SIR***0.36
IWS × YEAR**0.310.19
SIR × YEAR0.310.260.07
IWS × SIR × YEAR0.420.510.77
Note: R0, R1, R2, R3, and R4 indicate the straw incorporation rates of 0, 4.5, 9.0, 13.5, and 18.0 t ha−1, respectively; SL indicates the low salinity water (1.92 dS m−1); SH indicates the high salinity water (3.20 dS m−1). Values are the average of three replications. Comparisons are between the means of the same column and for the same main effect. Means followed by different letters within each year in the same column at the significance level of 0.05. * and ** mean significance at the levels of p < 0.05 and p < 0.01, respectively.
Table 4. Mean values of moisture content in the 0–100 cm soil profile, and results of the three-way ANOVA with irrigation water salinity (IWS), straw incorporation rates (SIR), and growing season (YEAR) as factors.
FactorsMoisture Content (cm−3 cm−3)
0–20 cm20–40 cm40–60 cm60–80 cm80–100 cm
IWS
SL0.225b0.287b0.314b0.322b0.330a
SH0.194a0.273a0.286a0.297a0.319a
SIR
R00.239d0.262a0.279a0.288a0.307a
R10.218cd0.272ab0.297b0.303b0.321ab
R20.206c0.277ab0.305bc0.311bc0.330b
R30.197b0.287b0.304bc0.320c0.331b
R40.190a0.300c0.315c0.324c0.334b
YEAR
20170.218b0.286b0.302a0.313a0.327a
20180.204a0.275a0.300a0.307a0.322a
ANOVA
IWS********0.523
SIR**********
YEAR***0.8600.2280.104
IWS × SIR0.8910.6580.4240.2980.614
IWS × YEAR0.5360.0890.0830.1030.422
SIR × YEAR0.7870.8870.9320.4260.737
IWS × SIR × YEAR0.5440.6800.3420.9780.877
Note: R0, R1, R2, R3, and R4 indicate the straw incorporation rates of 0, 4.5, 9.0, 13.5, and 18.0 t ha−1, respectively; SL indicates the low salinity water (1.92 dS m−1); SH indicates the high salinity water (3.20 dS m−1). Values are the average of three replications. Comparisons are between the means of the same column and for the same main effect. Means followed by different letters in the same column at the significance level of 0.05. * and ** mean significance at the levels of p < 0.05 and p < 0.01, respectively.
Table 5. Main effects of straw incorporation rate (SIR), irrigation water salinity (IWS), and growing season (YEAR) on salt balance within the 0–100 cm soil profile, and results of the three-way ANOVA with irrigation water salinity (IWS), straw incorporation rates (SIR), and growing season (YEAR) as factors.
FactorsSSH (kg)SSB (kg)SSH-SSB (kg)SSR (kg)
IWS
SL6.19a1.99a4.20a0.88a
SH8.90b2.04a6.86b0.86a
SIR
R08.09c1.98ab6.11d0.96c
R17.74bc2.02ab5.73cd0.90bc
R27.52abc1.99ab5.52c0.86b
R37.34ab1.89a5.45b0.86b
R47.05a2.21b4.84a0.78a
YEAR
20177.20a1.59a5.61a0.88a
20187.90b2.44b5.45a0.86a
ANOVA
IWS**0.50**0.35
SIR*0.06****
YEAR****0.280.21
IWS × SIR0.5240.800.600.92
IWS × YEAR0.6490.110.910.92
SIR × YEAR0.6860.630.850.65
IWS × SIR × YEAR0.1630.130.470.20
Note: R0, R1, R2, R3, and R4 indicate the straw incorporation rates of 0, 4.5, 9.0, 13.5, and 18.0 t ha−1, respectively; SL indicates the low salinity water (1.92 dS m−1); SH indicates the high salinity water (3.20 dS m−1). Values are the average of three replications. SSB and SSH refer to the soil salt mass before the first irrigation and soil salt mass at harvest, respectively; SSR indicates the salt storage rate: (SSH – SSB)/SIW × 100%, where SIW refers to the salt mass of irrigation water. Comparisons are between the means of the same column and for the same main effect. Means followed by different letters in the same column indicate a significance level of 0.05. * and ** mean significance at the levels of p < 0.05 and p < 0.01, respectively.
Table 6. Mean values of grain yield, biomass yield, harvest index (HI), and water use efficiency at the grain (WUEg) and biomass (WUEb) level, and results of the three-way ANOVA with irrigation water salinity (IWS), straw incorporation rates (SIR), and growing season (YEAR) as factors.
VariationGrain Yield
(kg ha−1)
Biomass Yield
(kg ha−1)
HIWUEg
(kg ha−1 mm−1)
WUEb
(kg ha−1 mm−1)
IWS
SL6141b14,563b0.41a17.69b41.94b
SH5532a12,831a0.43b15.23a39.95a
SIR
R05355a12,772a0.42a15.13a36.07a
R15714b13,441b0.43a16.63b39.10b
R25926c13,779c0.43a17.74bc41.23c
R36053cd14,190d0.43a18.63c43.96cd
R46136d14,304d0.43a19.17c44.67d
YEAR
20176131b14,415b0.43a18.00b42.28b
20185542a12,979a0.43a16.92a39.61a
ANOVA
IWS*********
SIR****0.91****
YEAR****0.46****
IWS × SIR0.140.130.80**
IWS × YEAR****0.77****
SIR × YEAR0.910.570.950.890.39
IWS × SIR × YEAR0.980.960.930.780.46
Note: R0, R1, R2, R3, and R4 indicate the straw incorporation rates of 0, 4.5, 9.0, 13.5, and 18.0 t ha−1, respectively; SL indicates the low salinity water (1.92 dS m−1); SH indicates the high salinity water (3.20 dS m−1). Values are the average of three replications. HI indicates the harvest index: Grain yield/biomass yield. WUEg and WUEb indicate the water use efficiency at the grain yield and biomass yield level, respectively. Comparisons are between the means of the same column and for the same main effect. Means followed by different letters in the same column indicate a significance level of 0.05. * and ** mean significance at the levels of p < 0.05 and p < 0.01, respectively.
Table 7. Fitted parameters of the regression function between the yield (grain and biomass) increasing rate and straw incorporation rate.
YearYield Increasing Rate (%)Fitting FunctionBest Fit ymaxBest Fit aBest Fit b
2017grain yield level under SLy = ymax(1 − e−ax)b0.08390.14661.100
grain yield level under SH0.23960.05150.6301
biomass yield level under SL0.07940.08611.1973
biomass yield level under SH0.23330.03060.5933
2018grain yield level under SL0.15780.09221.1113
grain yield level under SH0.25220.13981.1444
biomass yield level under SL0.13820.08130.8703
biomass yield level under SH0.25400.09491.1855
Note: y, yield increasing rate (kg ha−1 mm−1); x, straw incorporation rate (%).

