Communication

The Effect of Drying Methods on Water-Soluble Carbohydrates and Crude Protein Concentrations and Their Ratio in Two Perennial Ryegrass Cultivars

by
Cristian J. Moscoso
1,*,
Sarah A. Morgan
2 and
M. Jordana Rivero
2
1
Instituto de Investigaciones Agropecuarias, INIA Remehue, Osorno Po Box 24-0, Chile
2
Rothamsted Research, North Wyke, Okehampton, Devon EX20 2SB, UK
*
Author to whom correspondence should be addressed.
Agronomy 2019, 9(7), 383; https://doi.org/10.3390/agronomy9070383
Submission received: 5 June 2019 / Revised: 12 July 2019 / Accepted: 14 July 2019 / Published: 16 July 2019
(This article belongs to the Section Grassland and Pasture Science)

Abstract

:
The objective of this study was to assess the joint effect of perennial ryegrass cultivars and drying methods on concentrations of water-soluble carbohydrates (WSC) and crude protein (CP) and WSC/CP ratio. AberMagic AR1 and Expo AR1 forage were collected in December 2016, March, June, September and November 2017 and either oven-dried at 60 °C for 48 h (OD_60), at 80 °C for 16 h (OD_80), frozen at −80 °C for 48 h then freeze-dried (−80_FD), or flash-frozen with liquid N then freeze-dried (LN_FD). Data were analyzed by ANOVA in a factorial design with cultivar and drying method as factors. AberMagic AR1 had between 9.0 to 31.5% higher WSC concentration than Expo AR1 in the four samplings. Freeze-drying preserved more WSC than oven-drying treatments (+22.7%), particularly in June. The CP concentration of Expo AR1 was higher only in December (+6.8%), and was 22.9 and 10.9% higher in OD_60 samples compared to LN_FD samples in December and November, respectively. The WSC/CP ratio varied in June, being greater in AberMagic AR1 (+36.1%). Drying method affected WSC/CP ratio in December, June and November where freeze-drying produced greater ratios. Drying techniques generated differences in WSC, CP and WSC/CP ratio, which may affect the accuracy of the estimated impacts of forages on productivity and N use efficiency.

1. Introduction

Water-soluble carbohydrates in grazing plants are important as reserve compounds to support plant growth after defoliation [1,2,3] and are valuable as a source of readily available energy for gut microbial growth in ruminant animals [4]. One of the key strategies to improve the efficiency of grassland systems is to optimize the energy to protein balance of forages [5], with the aim of balancing the supply of these nutrients in optimal proportions to satisfy the requirements of ruminal microbes and minimize the excretion of excess N via urine, limiting the associated negative environmental impacts [6]. Enhancing the WSC concentration in perennial ryegrasses, either by cultivar selection or agronomic management, is an accepted pathway to manipulating herbage nutritive quality and improving N use efficiency (NUE) [7], described here as the N excreted (either milk or urine) per unit N eaten.
Moreover, the WSC/CP ratio can be used to predict NUE [8,9]. Both studies included data from works that used either freeze-drying [10,11] or oven-drying [12,13,14,15,16,17] prior to WSC and CP determination. Yet, it is supposed that different drying methods may affect these constituents thus producing different concentration values, in the dry matter (DM), for WSC, CP and WSC/CP ratio.
Analytical procedures to quantify the chemical composition of forages have been long established [18,19] and the influence of drying methods on forage sample constituents is well documented. For example, greater drying temperatures lead to caramelization of sugars [20], Maillard products [21] or a reduced recovery of soluble sugars [22], whereas reported changes in CP level are inconsistent [23,24]. Furthermore, imcomplete drying apparently may not inactivate all the enzymes in the forage sample resulting in carbohydrate loss through respiration [25].
Given the role of WSC for plant re-growth and ruminal microbes, and that the WSC/CP ratio can be used to estimate NUE for urine and milk [8,9], it is important to avoid processes that may affect the accuracy of results. As aforementioned, past work has indicated that drying methods to preserve forage samples can sometimes alter the chemical composition (mainly WSC) [25]. The objective of this study was to test the hypothesis that cultivar and different but routinely used laboratory drying methods can change the WSC and CP concentrations and thus the WSC/CP ratio.

2. Materials and Methods

The study was conducted in Remehue Research Center (40°31′ S, 73°03′ O, 71 metres above sea level (m.a.s.l.)), at the Instituto de Investigaciones Agropecuarias, Osorno, Chile, between August 2016 and November 2017. The site has a mean annual temperature and precipitation of 10.6 °C and 1321 mm, respectively, [26] and a temperate, without dry season, warm summer (Cfb) climate classification [27]. The mean monthly temperature, rainfall and incident solar radiation for the experimental period are presented in Figure 1.
Two cultivars of perennial ryegrass (Lolium perenne L.) were used in the study, namely AberMagic AR1 (+19) developed in Wales and Expo AR1 (+21) developed in New Zealand. The cultivars were selected because both expressed higher concentrations of WSC [28], were developed in different latitudes, have similar heading dates and are both diploids. Nine 125 L (0.48 m diameter × 0.91 m height) pots were filled in March 2016 with an Andisol soil of the Osorno series (textural class: silty loam) characterized by 13%, 70% and 17% of sand, silt and clay, respectively [29]. The topsoil (0.1 m depth) had a pH of 5.6 (water, 1:2.5), 11.9% organic matter, 74 mg kg−1 N (NO3+NH4), 83.7 mg kg−1 Olsen P and 18.0 mg kg−1 S. Exchangeable cations (cmol(+) kg−1) were 9.2, 1.3, 2.3, 0.2 and 0.07 for Ca, Mg, K, Na, and Al, respectively. Each cultivar was hand sown into pots on 25 August 2016 at a seeding rate of 25 kg ha−1. Pots were fertilized with Basacote Plus 3M (Compo GmbH) in August 2016 and 2017 at a rate equivalent to 60 kg N ha−1. Weeds were pulled by hand and no herbicides were applied in any sampling period. Plants were grown outside in the field and were sustained under rainfed conditions.
Between sowing and the first sampling, plants were harvested periodically with hand scissors once they had reached the three-leaf stage, leaving 0.05 m stubble height. Samples were collected during the mornings of 5 December 2016 (late spring), and 15 March (autumn), 21 June (winter), 14 September (early spring) and 05 November 2017 (middle spring) within a one hour time window. The sampling points reflect the broad range of forage growing seasons. Pots were harvested as explained before. The harvested material of each block (i.e., three pots per cultivar) was combined together per cultivar (>0.6 kg of fresh matter) and sub-samples of 0.15 kg of fresh matter were allocated to one of the following drying procedures: oven-drying at 60 °C for 48 h (OD_60), oven-drying at 80 °C for 16 h (OD_80), freezing at −80 °C for 48 h followed freeze-drying (−80_FD) or flash freezing with liquid nitrogen at harvest followed by freeze-drying (LN_FD). For freeze-drying treatments (−80_FD and LN_FD), plant material was placed into porous plastic bags (Ziploc). For oven-drying treatments (OD_60 and OD_80), plant material was placed into Aluminum foil trays. After freeze-drying (Labconco) or oven-drying (Lab-Lines), dried samples were ground to pass a 1 mm sieve (Thomas-Wiley, Philadelphia, USA). The determination of WSC concentration was carried out using the anthrone reaction assay and absorbance of the extract was measured by a spectrophotometer [30]. Determination of CP concentration (N × 6.25) was by means of the Kjeldahl method [31].
The concentrations of WSC and CP and WSC/CP ratio were analyzed by ANOVA in a 2 × 4 factorial experiment design with cultivar (2) and drying method (4) as factors in a randomized block with three replicates. If there were differences between treatments, Tukey´s Honestly Significant Difference (HSD) test comparison was used.

3. Results

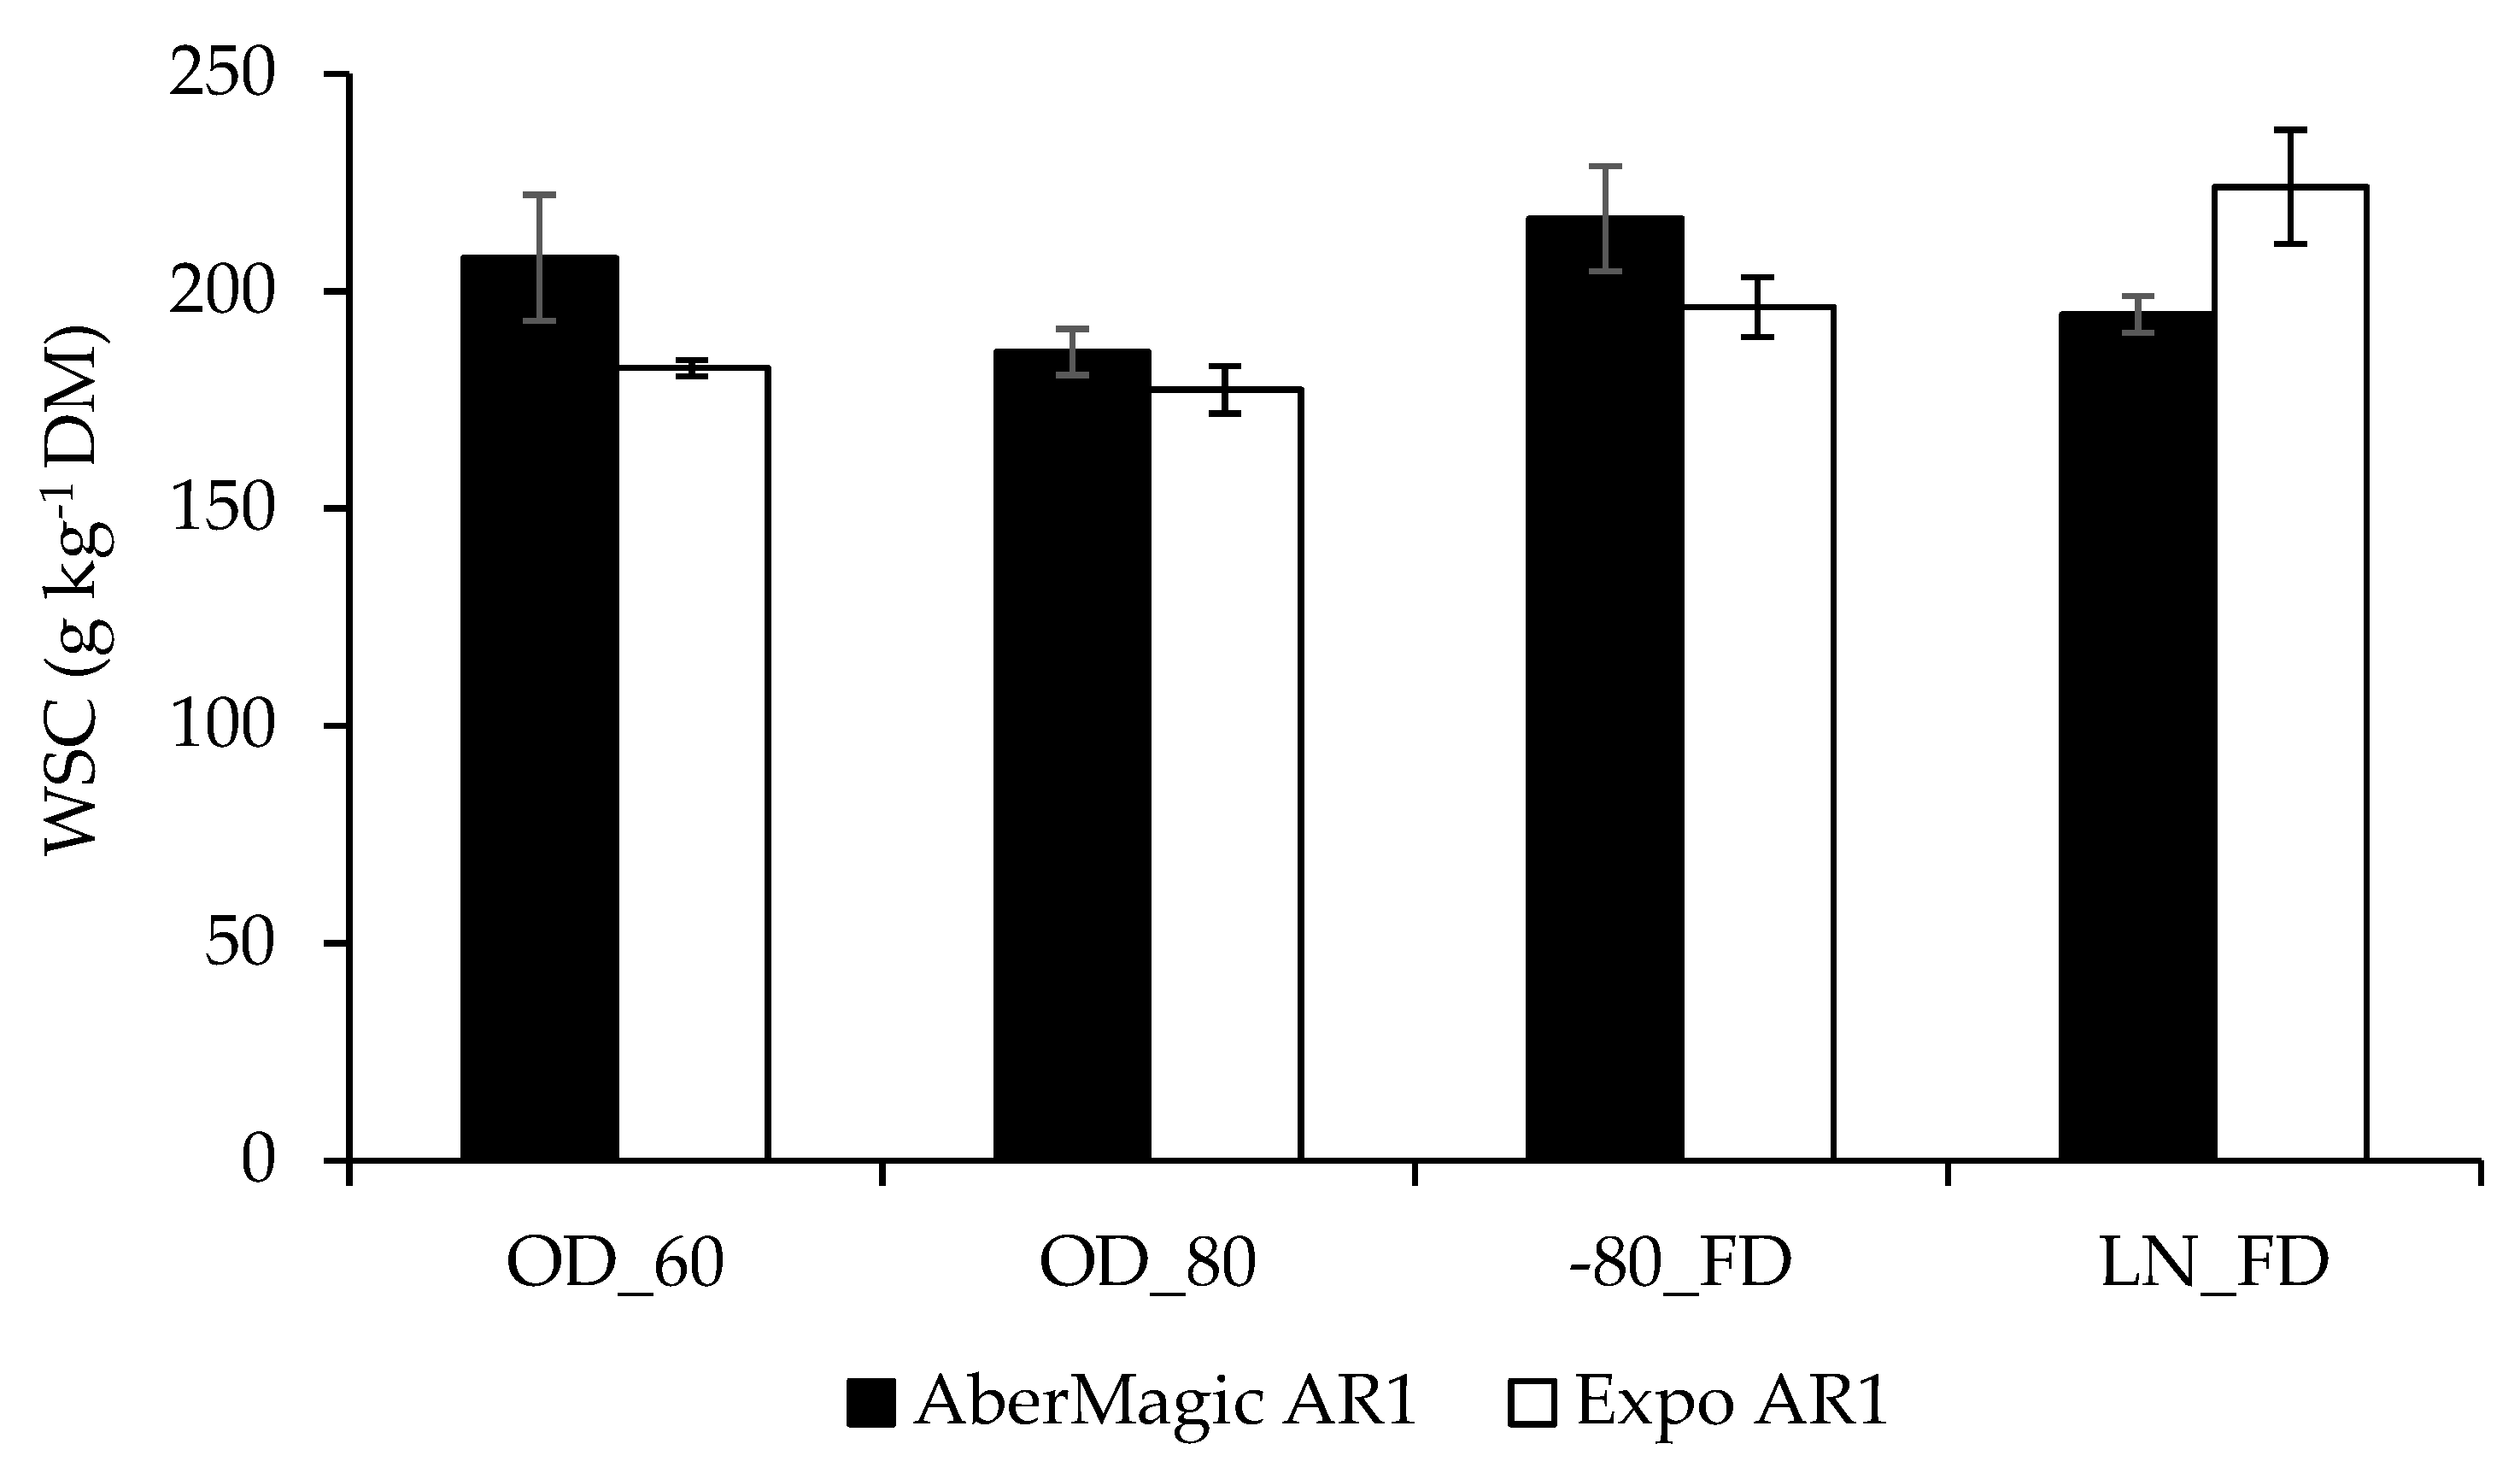
3.1. Water-Soluble Carbohydrates Concentration

Water-soluble carbohydrate concentration of forage varied between cultivars in four of the five sampling points, March (autumn), June (winter), September (early spring) and November (middle spring), where AberMagic AR1 had between 9.0 and 31.5% higher WSC than Expo AR1 (Table 1). In the first sampling (December 2016; late spring) a significant interaction was seen between cultivar and drying method, where Expo AR1 had higher WSC in the LN_FD drying treatment (224.0 g kg−1 DM) but lower for the other three drying treatments (Figure 2). No significant interaction was found for the other four sampling points. Drying technique affected WSC concentrations in June (winter) and November (middle spring) showing that, in general, freeze-drying preserves a greater amount of WSC in the samples compared with oven-drying procedures (Table 1). In June (winter), the largest difference between freeze-drying and oven-drying was 28.2% (−80_FD vs. OD_80) while in November (middle spring) the largest difference between drying treatments was 26.8% (LN_FD vs. OD_60).

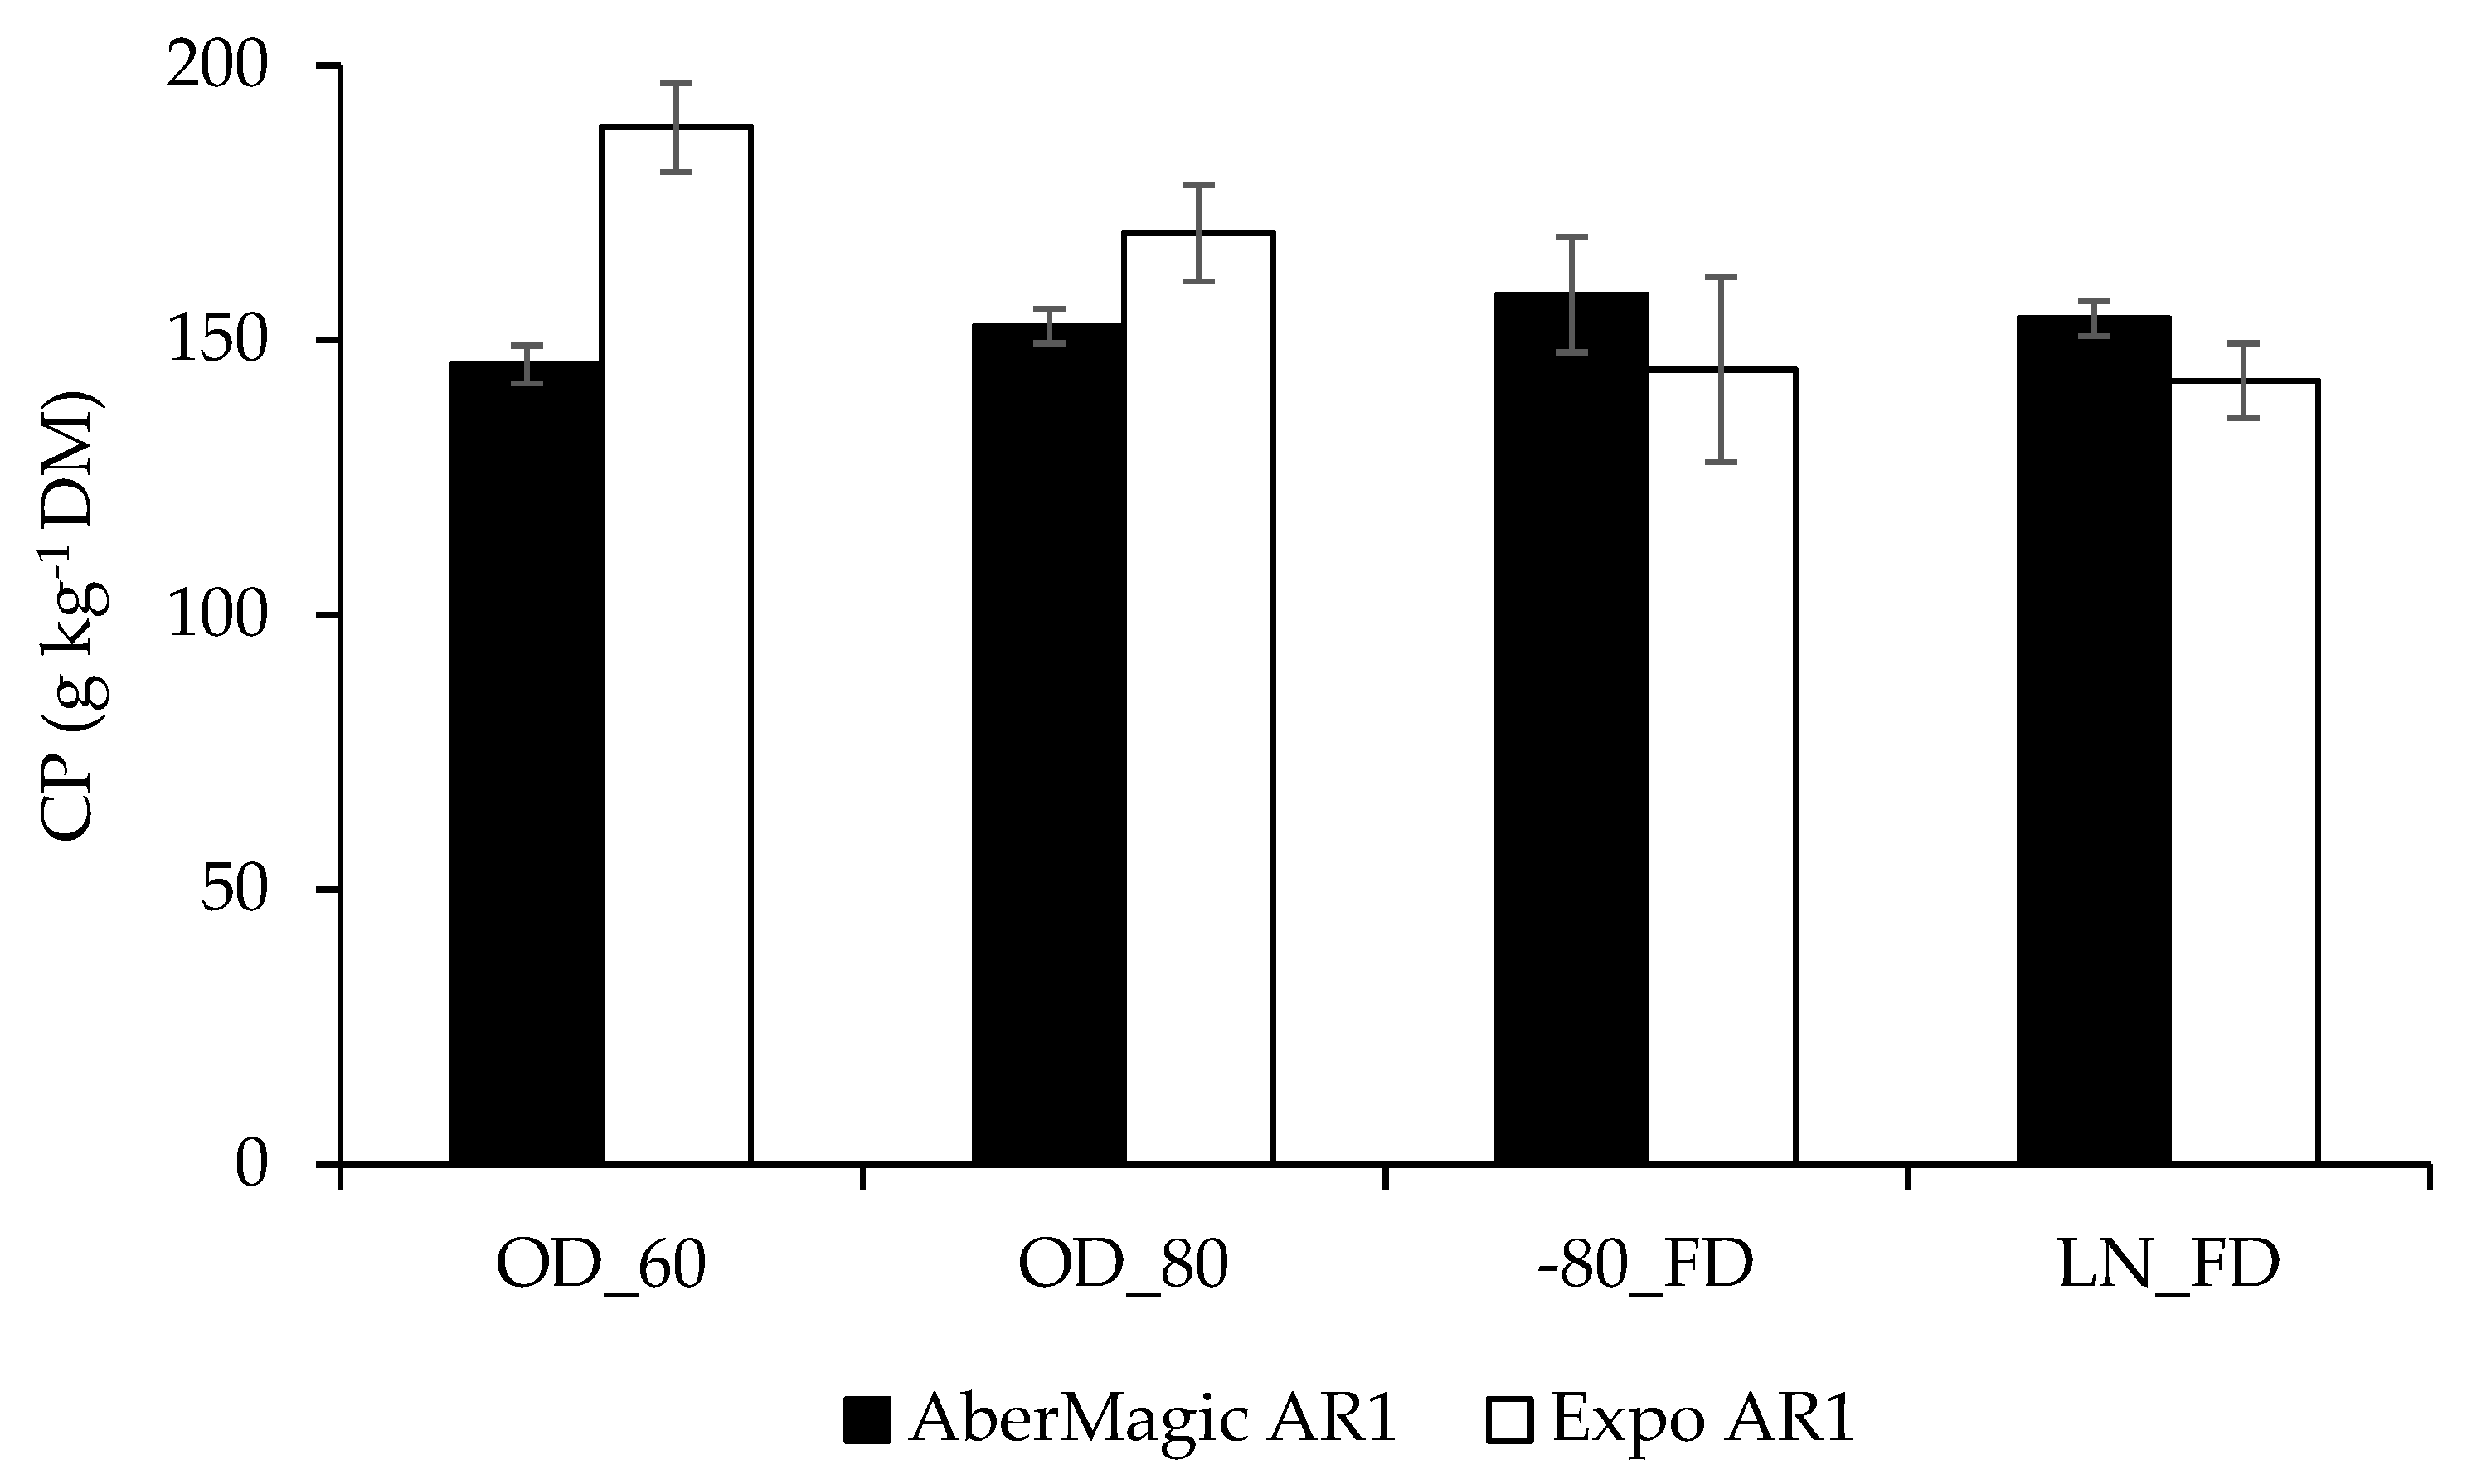
3.2. Crude Protein Concentration

Crude protein concentration varied between cultivars only in the first sampling, with cultivar Expo AR1 containing 6.8% more CP than AberMagic AR1 (Table 2). Cultivars did not differ for March (autumn), September (early spring) and November (middle spring) samplings. Mean CP concentrations were 139.2, 150.0 and 98.8 g kg−1 DM for these sampling points, respectively. A significant interaction between cultivar and drying method was found in the third sampling, where oven-drying resulted in higher CP concentration of Expo AR1 compared to AberMagic AR1, whereas freeze-drying resulted in lower CP concentration (Figure 3). Drying method significantly affected CP concentration in the first and fifth sampling points, where oven-drying generally resulted in higher CP content compared with freeze-drying. For these sampling points, OD_60 resulted in 22.9 and 10.9% more CP compared to the LN_FD procedure for December 2016 (late spring) and November 2017 (middle spring), respectively (Table 2). Drying methods did not differ for March (autumn) and September (early spring) samplings, where mean CP concentration was 139.2 and 150.1 g kg−1 DM, respectively.

3.3. Water-Soluble Carbohydrates to Crude Protein Ratio

The ratio between WSC and CP only varied between cultivars in the third sampling, being greater in AberMagic AR1 than in Expo AR1 (+36.1%) and tended to vary in the first and fifth sampling (p = 0.058 and p = 0.073, respectively; Table 3). The WSC/CP ratio means for December (late spring), March (autumn), September (early spring) and November (middle spring) samplings were 0.98, 1.43, 1.55 and 2.83, respectively. Drying method affected WSC/CP ratio in the first, third and fifth sampling points, with freeze-drying generally producing greater ratios than oven-drying procedures (Table 3). Differences in the WSC/CP ratio between drying procedures were as large as 39.1, 37.6 and 37.1% in December (late sping), June (winter) and November (middle spring), respectively. Mean WSC/CP ratios for March (autumn) and September (early spring) samplings were 1.44 and 1.55 respectively. No interaction was found between cultivar and drying method for any sampling point.

4. Discussion

The aim of the present work was to determine the effect of cultivar and drying method on the concentration of WSC, CP and its ratio given their relevance for animal nutrition and N use efficiency. More accurate estimations of these indicators would help graziers make better management decisions to improve productivity and sustainability of ruminant productions systems and would help in orienting plant breeding programmes towards including such indicators. This study evaluated two perennial ryegrass cultivars bred for enhanced WSC concentration and different drying procedures commonly used worldwide (i.e., oven-drying and freeze-drying).
A seasonal trend of greater WSC concentrations in late spring is commonly found [32,33,34], but the lower concentration of WSC in the December harvest (late spring) was not expected, possibly due to the vegetative stage of the four-month plants in the December sampling. The WSC concentrations found in this study were greater than those reported with cultivars not selected for an enhanced WSC concentration [33] under the same defoliation management and temperate climate of this study, where the highest concentration obtained was nearly 200 g kg−1 DM in the late spring (November–December) and the lowest in early spring (August–October) of approximately 130 g kg−1 DM. However, the year may have had a relevant effect in the study carried out by Loaiza et al. [33] which could explain the lower values compared with the present study. Previous results in cultivars with different genetic potential for producing WSC were not consistent, and the use of favourable management (defoliation at the three-leaf stage, and N fertilization of 83.3 kg N ha−1 year−1) improved the WSC concentration only in early spring and autumn seasons [35]. Few studies comparing high sugar cultivars with standard cultivars in temperate climate conditions have been reported [35,36], but the expression of greater WSC concentrations in AberMagic has been confirmed in other cool temperate climates [37,38].
The effect of drying method used were present in two of the five harvests for WSC concentration. It is commonly accepted that the drying procedure may affect WSC concentration [39]; losses of 9 and 14% due to oven-drying versus freeze-drying of samples have been previously reported for grass-legume crops and perennial ryegrass, respectively [22,40]. Moreover, drying forage samples for 16 h at 100 °C has been shown to underestimate the WSC concentration compared to 80 °C, without altering the ranking between cultivars of perennial ryegrass [41]. Differences between the highest and lowest WSC concentration in the present study were not as large as those obtained in the spring growth of Timothy (Phleum pratense L.), where the WSC concentration in freeze-dried samples nearly doubled that of oven-dried samples (55 °C for 48 h) [42]. Conversely, samples of perennial ryegrass that were stored at −18 °C after harvest and then processed by thermal (oven-drying at 40 °C for 48 h) or freeze-drying (−55 °C for 72 h) did not differ in WSC concentration [43]. In one study, the use of frequent turning of samples in a forced-air circulation oven (2 h) resulted in similar WSC concentrations regardless of whether samples were dried at 30 °C, 50 °C, 70 °C or 105 °C [44]. Storage of samples in a freezer before drying and the frequent turning of samples during drying were not used in the present study.
In addition to the unexpected low level of WSC in the harvest carried out in the December sampling (late spring), the cultivar × drying method interaction observed for this sampling date produced a greater WSC concentration in Expo AR1 dried by LN_FD, which contrasts with the general trend of AberMagic AR1 expressing greater WSC levels. However, it can be inferred that freeze-drying, either with or without the use of liquid N in the field, better preserves WSC in forage samples compared to oven-drying. Comparison of two freeze- and five oven-drying treatments of fodder radish, lucerne, italian ryegrass and maize silage indicated that storage at −20 °C before freeze-drying has no effect on WSC when compared with freeze-drying at 3 °C (106 and 100 g kg−1 DM respectively), however, the use of oven-drying at lower temperatures reduces WSC content, giving concentrations of 41 g kg−1 DM when drying at 30 °C and 76 g kg−1 DM when drying at 70 °C [23].
Crude protein concentration followed the seasonal pattern of greater CP concentration in the winter and lower in the spring [45,46]. Previous studies comparing perennial ryegrass found CP concentrations of between 60–61 and 340–353 g kg−1 DM, with a mean of 180–229 g kg−1 DM [47,48]. Interestingly, the CP concentration found in the present study rarely exceeded the proposed CP requirements of 200 g kg−1 DM for animals grazing temperate forages [49]. Harvesting at the three-leaf stage, as used in the present study, permits a lower CP concentration compared with more frequent defoliation management [50]. This management strategy to reduce CP concentration in forages will help to reduce some externalities of temperate grazing systems [51].
In the present study, CP concentration was affected by drying method at two of the harvest dates and a cultivar × drying method interaction was also found. The effect of drying method on CP content in December 2016 (late spring) and November 2017 (middle spring) is concurrent with drying method effects on WSC for the same sampling dates. Moreover, the lower WSC concentration observed in June (winter) oven-dried samples concurred with the interaction effect on CP concentration. Therefore, the observed effect of drying method on CP levels of forage may be explained by a “concentration effect” (i.e., the loss of WSC fraction during oven-drying causing a perceived increase in CP concentration). This potential overestimation of CP concentration in forage may contribute to qualifying several forage samples as containing excessive CP, when compared with animal requirements, which in some cases this may not be true. In other studies the use of different drying procedures (freeze-drying and five oven drying temperatures) has little effect on the CP concentration of perennial ryegrass, with the generation of a protein bound to the neutral detergent fibre only in the oven-drying procedures [44]. The lack of effects on the CP concentration when samples of pasture were first frozen at −20 °C and then freeze- or oven-dried (60 °C for 48 h) has been also reported [24].
For the cultivars used in the present study the WSC/CP ratio in four of the five harvests was close to or greater than the advised ratio of 1.5 [8]. Lower ratios were reported when perennial ryegrass cultivars not selected for greater WSC concentration were evaluated in the same temperate climate as the present study [33]. When perennial ryegrass cultivar Impact AR1 was harvested at the 3-leaf stage, the WSC/CP ratio ranged from 0.5 to 1.0 in the autumn-winter and spring-summer seasons, respectively, and when defoliation frequency was extended from one to the five leaf-stage, this ratio increased from 0.7 to 1.7 respectively in the spring–summer period [52]. Similar results were also found with cultivar Alto AR1, where the WSC/CP ratio in early (August–October) and late spring (November–December) was 0.45 and 1.11, respectively. Conversely, when assessing perennial ryegrass cultivars with different potential for producing WSC, no effect of cultivar on WSC/CP ratio was found, however one of the agronomic managements used (defoliations at three leaves per tiller and N fertilization rate of 83.3 kg N ha−1 year−1) did improve the ratio in spring, summer and autumn seasons [35].
Although AberMagic AR1 and Expo AR1 achieved the desired WSC/CP ratio in some sampling dates, some drying methods might result in underestimation of this ratio and thus alter the prediction of NUE. In this regard, the use of freeze-drying is recommended, as this method of drying better preserves WSC and thus provides results that more accurately reflect fresh tissue compared to heat-drying [25]. For example, using the linear relationship between WSC/CP and NUE proposed previously [9], the differences in WSC/CP ratio found in the present study caused by the different drying methods results in NUE estimates ranging from 3.55% (05 December 2016; late spring) to 8.68% (November 2017; middle spring). This highlights the need to accurately determine WSC and CP concentrations of forages in order to ensure effective estimation of NUE and other externalities of grazing systems.
The development of varieties with enhanced levels of WSC and lower CP concentration may contribute to reducing N emissions to the environment while maintaining a greater level of animal production per hectare [53]. However, such cultivars might not consistently express the high sugar trait under certain environments [8,35]. Furthermore, high sugar grasses may have lower DM yields than standard cultivars [54,55,56]. Therefore, in order to assess the actual environmental benefit of grazing systems that either use these improved cultivars or apply pasture management regimes aimed to enhance forage WSC concentrations, an accurate evaluation of their nutritional value is required. Although the freeze-drying process involves greater capital and running costs compared with oven-drying [57], the advantages of generating more accurate data to make better-informed management decisions and to evaluate the environmental footprint of targeted interventions on grazing systems should be emphasized.

5. Conclusions

AberMagic AR1 generally had a greater concentration of WSC than Expo AR1 cultivar. Forage samples dried using a freeze-dryer maintained greater concentrations of WSC compared to oven-dried samples. This implies that losses of WSC during the drying process were lower with freeze-drying techniques than for oven-drying. For CP concentration, the effect of the drying technique was not consistent across sampling dates however oven-drying techniques seemed to favor this component compared to freeze-drying, contrary to the drying method effects observed for WSC. The effects of drying technique on WSC and CP concentrations generated notable differences in the WSC/CP ratios between freeze- and oven-dried samples. In order to avoid inaccurate predictions of NUE of grazing animals, freeze-drying of forage samples is recommended as this drying method better preserves WSC.

Author Contributions

Conceptualization, C.J.M.; methodology, C.J.M; formal analysis, C.J.M. and M.J.R.; investigation, C.J.M.; resources, C.J.M.; data curation, C.J.M.; writing—original draft preparation, C.J.M. and M.J.R.; writing—review and editing, C.J.M., M.J.R. and S.A.M.; project administration, C.J.M.; funding acquisition, C.J.M. and M.J.R.

Funding

This research was funded by Instituto de Investigaciones Agropecuarias, grant number 502087-70. Support in writing up the work at Rothamsted Research was greatly received by the Biotechnology and Biological Sciences Research Council (BBSRC) through the strategic program Soil to Nutrition (S2N; BBS/E/C/000I0320) and the European Regional Development Fund (ERDF) through the Agri-Tech Cornwall initiative, which is a 3 year, £10m initiative to increase Research Development and Innovation in the Agri-tech sector across Cornwall and the Isles of Scilly led by Duchy College Rural Business School in partnership with the Universities of Exeter and Plymouth, Rothamsted Research and the Cornwall Development Company.

Acknowledgments

The authors thank to Rodolfo Saldaña and his team for their technical assistance in the laboratory.

Conflicts of Interest

The authors declare no conflict of interest.

References

  1. White, L.M. Carbohydrate Reserves of Grasses: A Review. J. Range Manag. 1973, 26, 13–18. [Google Scholar] [CrossRef]
  2. Fulkerson, W.J.; Donaghy, D.J. Plant-soluble carbohydrate reserves and senescence-Key criteria for developing an effective grazing management system for ryegrass-based pastures: A review. Aust. J. Exp. Agric. 2001, 41, 261–275. [Google Scholar] [CrossRef]
  3. Lee, J.M.; Donaghy, D.J.; Sathish, P.; Roche, J.R. Interaction between water-soluble carbohydrate reserves and defoliation severity on the regrowth of perennial ryegrass (Lolium perenne L.)-dominant swards. Grass Forage Sci. 2009, 64, 266–275. [Google Scholar] [CrossRef]
  4. Hoover, W.H.; Stokes, S.R. Balancing Carbohydrates and Proteins for Optimum Rumen Microbial Yield. J. Dairy Sci. 1991, 74, 3630–3644. [Google Scholar] [CrossRef]
  5. Humphreys, M.O. Genetic improvement of forage crops-Past, present and future. J. Agric. Sci. 2005, 143, 441–448. [Google Scholar] [CrossRef]
  6. Hall, M.B.; Huntington, G.B. Nutrient synchrony: Sound in theory, elusive in practice. J. Anim. Sci. 2008, 86, 287–292. [Google Scholar] [CrossRef] [PubMed]
  7. Hoekstra, N.J.; Schulte, R.P.O.; Struik, P.C.; Lantinga, E.A. Pathways to improving the N efficiency of grazing bovines. Eur. J. Agron. 2007, 26, 363–374. [Google Scholar] [CrossRef]
  8. Parsons, A.J.; Edwards, G.R.; Newton, P.C.D.; Chapman, D.F.; Caradus, J.R.; Rasmussen, S.; Rowarth, J.S. Past lessons and future prospects: Plant breeding for yield and persistence in cool-temperate pastures. Grass Forage Sci. 2011, 66, 153–172. [Google Scholar] [CrossRef]
  9. Keim, J.P.; Anrique, R. Nutritional Strategies to Improve Nitrogen use Efficiency by Grazing Dairy Cows. Chil. J. Agric. Res. 2011, 71, 623–633. [Google Scholar] [CrossRef] [Green Version]
  10. Halling, M.A.; Longland, A.C.; Martens, S.; Nesheim, L.; Kiely, P.O. Water Soluble Carbohydrate Content of Two Cultivars of Perennial Ryegrass (Lolium Perenne) at Eight European Sites; Wageningen Academic Press: Dublin, Ireland, 2005; p. 131. [Google Scholar]
  11. Moorby, J.M.; Evans, R.T.; Scollan, N.D.; MacRae, J.C.; Theodorou, M.K. Increased concentration of water-soluble carbohydrate in perennial ryegrass (Lolium perenne L.). Evaluation in dairy cows in early lactation. Grass Forage Sci. 2006, 61, 52–59. [Google Scholar] [CrossRef]
  12. Trevaskis, L.M.; Fulkerson, W.J.; Nandra, K.S. Effect of time of feeding carbohydrate supplements and pasture on production of dairy cows. Livest. Prod. Sci. 2004, 85, 275–285. [Google Scholar] [CrossRef]
  13. Tas, B.M.; Taweel, H.Z.; Smit, H.J.; Elgersma, A.; Dijkstra, J.; Tamminga, S. Effects of perennial ryegrass cultivars on intake, digestibility, and milk yield in dairy cows. J. Dairy Sci. 2005, 88, 3240–3248. [Google Scholar] [CrossRef]
  14. Tas, B.M.; Taweel, H.Z.; Smit, H.J.; Elgersma, A.; Dijkstra, J.; Tamminga, S. Effects of perennial ryegrass cultivars on milk yield and nitrogen utilization in grazing dairy cows. J. Dairy Sci. 2006, 89, 3494–3500. [Google Scholar] [CrossRef]
  15. Tas, B.M.; Taweel, H.Z.; Smit, H.J.; Elgersma, A.; Dijkstra, J.; Tamminga, S. Utilisation of N in perennial ryegrass cultivars by stall-fed lactating dairy cows. Livest. Sci. 2006, 100, 159–168. [Google Scholar] [CrossRef]
  16. Taweel, H.Z.; Tas, B.M.; Smit, H.J.; Elgersma, A.; Dijkstra, J.; Tamminga, S. Effects of feeding perennial ryegrass with an elevated concentration of water-soluble carbohydrates on intake, rumen function and performance of dairy cows. Anim. Feed Sci. Technol. 2005, 121, 243–256. [Google Scholar] [CrossRef]
  17. Taweel, H.Z.; Tas, B.M.; Smit, H.J.; Elgersma, A.; Dijkstra, J.; Tamminga, S. Grazing behaviour, intake, rumen function and milk production of dairy cows offered Lolium perenne containing different levels of water-soluble carbohydrates. Livest. Sci. 2006, 102, 33–41. [Google Scholar] [CrossRef]
  18. Waite, R.; Gorrod, A.R.N. The comprehensive analysis of grasses. J. Sci. Food Agric. 1959, 10, 317–326. [Google Scholar] [CrossRef]
  19. Van Soest, P.J. Development of a Comprehensive System of Feed Analyses and its Application to Forages. J. Anim. Sci. 1967, 26, 119–128. [Google Scholar] [CrossRef]
  20. Raessler, M. Sample preparation and current applications of liquid chromatography for the determination of non-structural carbohydrates in plants. TrAC Trends Anal. Chem. 2011, 30, 1833–1843. [Google Scholar] [CrossRef]
  21. Van Soest, P.J. Nutritional Ecology of the Ruminant, 2nd ed.; Cornell University Press: Ithaca, NY, USA, 1994; ISBN 9780801427725. [Google Scholar]
  22. Udén, P. The influence of sample preparation of forage crops and silages on recovery of soluble and non-structural carbohydrates and their predictions by Fourier transform mid-IR transmission spectroscopy. Anim. Feed Sci. Technol. 2010, 160, 49–61. [Google Scholar] [CrossRef]
  23. Deinum, B.; Maassen, A. Effects of drying temperature on chemical composition and in vitro digestibility of forages. Anim. Feed Sci. Technol. 1994, 46, 75–86. [Google Scholar] [CrossRef]
  24. Alomar, D.; Fuchslocher, R.; De Pablo, M. Effect of preparation method on composition and NIR spectra of forage samples. Anim. Feed Sci. Technol. 2003, 107, 191–200. [Google Scholar] [CrossRef]
  25. Smith, D. Influence of Drying and Storage Conditions on Nonstructural Carbohydrate Analysis of Herbage Tissue—A Review. Grass Forage Sci. 1973, 28, 129–134. [Google Scholar] [CrossRef]
  26. Stolpe, N.; Undurraga, P. Long term climatic trends in Chile and effects on soil moisture and temperature regimes. Chil. J. Agric. Res. 2016, 76, 487–496. [Google Scholar] [CrossRef] [Green Version]
  27. Peel, M.C.; Finlayson, B.L.; McMahon, T.A. Updated world map of the Köppen-Geiger climate classification. Hydrol. Earth Syst. Sci. 2007, 4, 439–473. [Google Scholar] [CrossRef]
  28. Easton, H.; Stewart, A.; Lyons, T.; Parris, M.; Charrier, S. Soluble carbohydrate content of ryegrass cultivars. Proc. N. Z. Grassl. Assoc. 2009, 71, 161–166. [Google Scholar]
  29. Valle, S.R.; Carrasco, J.; Pinochet, D.; Soto, P.; Mac Donald, R. Spatial distribution assessment of extractable Al, (NaF) pH and phosphate retention as tests to differentiate among volcanic soils. Catena 2015, 127, 17–25. [Google Scholar] [CrossRef]
  30. MAFF. The Analysis of Agricultural Materials: A Manual of the Analytical Methods Used by the Agricultural Development and Advisory Service, 3rd ed.; Ministry of Agriculture, Fisheries and Food: London, UK, 1986; ISBN 0-11-242762-6.
  31. Harris, L.E. Nutrition Research Techniques For Domestic and Wild Animals: International Record System and Procedures for Analyzing Samples; Utah State University: Logan, UT, USA, 1970. [Google Scholar]
  32. Gilliland, T.J.; Barrett, P.D.; Mann, R.L.; Agnew, R.E.; Fearon, A.M. Canopy morphology and nutritional quality traits as potential grazing value indicators for Lolium perenne varieties. J. Agric. Sci. 2002, 139, 257–273. [Google Scholar] [CrossRef]
  33. Loaiza, P.A.; Balocchi, O.; Bertrand, A. Carbohydrate and crude protein fractions in perennial ryegrass as affected by defoliation frequency and nitrogen application rate. Grass Forage Sci. 2017, 72, 556–567. [Google Scholar] [CrossRef]
  34. Jensen, K.B.; Harrison, P.; Chatterton, N.J.; Bushman, B.S.; Creech, J.E. Seasonal trends in nonstructural carbohydrates in cool and warm-season grasses. Crop Sci. 2014, 54, 2328–2340. [Google Scholar] [CrossRef]
  35. Rivero, M.J.; Balocchi, O.A.; Moscoso, C.J.; Siebald, J.A.; Neumann, F.L.; Meyer, D.; Lee, M.R.F. Does the “high sugar” trait of perennial ryegrass cultivars express under temperate climate conditions? Grass Forage Sci. 2019, 27, 12406. [Google Scholar] [CrossRef]
  36. Moscoso, C.; Balocchi, O.A. Water-soluble carbohydrate and nitrogen concentrations after defoliation in perennial ryegrasses (Lolium perenne L.) in spring. Agrosur 2016, 44, 11–17. [Google Scholar]
  37. Turner, L.R.; Donaghy, D.J.; Pembleton, K.G.; Rawnsley, R.P. Longer defoliation interval ensures expression of the “high sugar” trait in perennial ryegrass cultivars in cool temperate Tasmania, Australia. J. Agric. Sci. 2015, 153, 995–1005. [Google Scholar] [CrossRef]
  38. Hume, D.; Hickey, M.; Lyons, T.; Baird, D. Agronomic performance and water-soluble carbohydrate expression of selected ryegrasses at two locations in New Zealand. N. Z. J. Agric. Res. 2010, 53, 37–57. [Google Scholar] [CrossRef] [Green Version]
  39. Mayland, H.F. Effect of drying methods on losses of carbon, nitrogen and dry matter from alfalfa. Agron. J. 1968, 60, 658–659. [Google Scholar] [CrossRef]
  40. Fulkerson, W.J.; Slack, K.; Hennessy, D.W.; Hough, G.M. Nutrients in ryegrass (Lolium spp.), white clover (Trifolium repens) and kikuyu (Pennisetum clandestinum) pastures in relation to season and stage of regrowth in a subtropical environment. Aust. J. Exp. Agric. 1998, 38, 227–240. [Google Scholar] [CrossRef]
  41. Davies, R.W.; Wilkins, P.W. The effect of drying temperature on in vitro dry-matter digestibility and water-soluble carbohydrate content of perennial ryegrass varieties. Grass Forage Sci. 1998, 53, 296–297. [Google Scholar] [CrossRef]
  42. Pelletier, S.; Tremblay, G.F.; Bertrand, A.; Bélanger, G.; Castonguay, Y.; Michaud, R. Drying procedures affect non-structural carbohydrates and other nutritive value attributes in forage samples. Anim. Feed Sci. Technol. 2010, 157, 139–150. [Google Scholar] [CrossRef]
  43. Purcell, P.J.; O’Brien, M.; Boland, T.M.; O’Kiely, P. In vitro rumen methane output of perennial ryegrass samples prepared by freeze drying or thermal drying (40 °C). Anim. Feed Sci. Technol. 2011, 166–167, 175–182. [Google Scholar] [CrossRef]
  44. Cone, J.W.; Van Gelder, A.H.; Marvin, H.J.P. Influence of drying method and ageing on chemical and physical properties and in vitro degradation characteristics of grass and maize samples. J. Agric. Sci. 1996, 126, 7–14. [Google Scholar] [CrossRef]
  45. Demanet, R.; Mora, M.L.; Herrera, M.Á.; Miranda, H.; Barea, J.M. Seasonal variation of the productivity and quality of permanent pastures in Adisols of temperate regions. J. Soil Sci. plant Nutr. 2015, 15, 111–128. [Google Scholar] [CrossRef]
  46. Sandaña, P.; Lobos, I.A.; Pavez, P.B.; Moscoso, C.J. Validation of a critical nitrogen dilution curve for hybrid ryegrasses. Grass Forage Sci. 2019. [Google Scholar] [CrossRef]
  47. Lee, M.A. A global comparison of the nutritive values of forage plants grown in contrasting environments. J. Plant Res. 2018, 131, 641–654. [Google Scholar] [CrossRef] [PubMed]
  48. Rugoho, I.; Gourley, C.J.P.; Hannah, M.C. Nutritive characteristics, mineral concentrations and dietary cation–anion difference of feeds used within grazing-based dairy farms in Australia. Anim. Prod. Sci. 2016, 57, 858–876. [Google Scholar] [CrossRef]
  49. Pacheco, D.; Waghorn, G. Dietary nitrogen–definitions, digestion, excretion and consequences of excess for grazing ruminants. Proc. N. Z. Grassl. Assoc. 2008, 8, 107–116. [Google Scholar]
  50. Pembleton, K.G.; Rawnsley, R.P.; Turner, L.R.; Corkrey, R.; Donaghy, D.J. Quantifying the interactions between defoliation interval, defoliation intensity and nitrogen fertiliser application on the nutritive value of rainfed and irrigated perennial ryegrass. Crop Pasture Sci. 2017, 68, 1100–1111. [Google Scholar] [CrossRef]
  51. Chapman, D. Using Ecophysiology to Improve Farm Efficiency: Application in Temperate Dairy Grazing Systems. Agriculture 2016, 6, 17. [Google Scholar] [CrossRef]
  52. Loaiza, P.; Balocchi, O.; López, I.F. Changes in water-soluble carbohydrates relative to crude protein in perennial ryegrass in response to defoliation frequency. Grassl. Sci. 2017, 63, 159–168. [Google Scholar] [CrossRef]
  53. Peyraud, J.L.; Delagarde, R. Managing variations in dairy cow nutrient supply under grazing. Animal 2013, 7, 57–67. [Google Scholar] [CrossRef] [Green Version]
  54. Halling, M.A.; Longland, A.C.; Martens, S.; Nesheim, L.; O’Kiely, P. Accumulation of Water Soluble Carbohydrates in Two Perennial Ryegrass Cultivars at Nine European Sites. In Land Use Systems on Grassland Dominated Regions, Proceedings of the 20th General Meeting of the European Grassland Federation; Luscher, A., Jeangros, B., Kessler, W., Huguenin, O., Lobsiger, M., Millar, N., Suter, D., Eds.; Swiss Grassland Society: Zürich, Switzerland, 2004; pp. 954–956. [Google Scholar]
  55. Edwards, G.R.; Parsons, A.J.; Rasmussen, S. High sugar ryegrasses for dairy systems. In Proceedings of the 3rd Dairy Science Symposium, Melbourne, Australia, 18–20 September 2007; pp. 307–334. [Google Scholar]
  56. Rivero, M.J.; Balocchi, O.L.; Neumann, F.L.; Siebald, J.A. Grazing Preference of Dairy Cows and Pasture Productivity for Different Cultivars of Perennial Ryegrass under Contrasting Managements. Animals 2019, 9, 253. [Google Scholar] [CrossRef]
  57. Elavarasan, K.; Shamasundar, B.A. Effect of oven drying and freeze drying on the antioxidant and functional properties of protein hydrolysates derived from freshwater fish (Cirrhinus mrigala) using papain enzyme. J. Food Sci. Technol. 2016, 53, 1303–1311. [Google Scholar] [CrossRef] [PubMed]
Figure 1. Observed monthly mean temperatures (○), precipitation (□), and incident solar radiation (∆) during the sampling period, and historical averages (1977–2017) for mean temperature (●) and precipitation (■).
Agronomy 09 00383 g001
Figure 2. Water-soluble carbohydrate (WSC) concentration as affected by cultivar and drying procedure for the first sampling (December 2016; late spring). OD_60: oven-drying at 60 °C for 48 h, OD_80: oven-drying at 80 °C for 16 h, −80_FD: freezing at −80 °C for 48 h followed freeze-drying, LN_FD: liquid nitrogen followed freeze-drying. Vertical bars represent the standard error of the mean.
Agronomy 09 00383 g002
Figure 3. Crude protein (CP) concentration as affected by cultivar and drying procedure on the third sampling (June 2017; winter). OD_60: oven-drying at 60 °C for 48 h, OD_80: oven-drying at 80 °C for 16 h, −80_FD: freezing at −80 °C for 48 h followed freeze-drying, LN_FD: liquid nitrogen followed freeze-drying. Vertical bars represent the standard error of the mean.
Agronomy 09 00383 g003
Table 1. Water-soluble carbohydrate concentration (WSC, g kg−1 DM) in AberMagic AR1 and Expo AR1 dried under different procedures in five harvests.
VariableWSC (g kg−1 DM)
5 Dec 1615 Mar 1721 Jun 1714 Sep 175 Nov 17
Late SpringAutumnWinterEarly SpringMiddle Spring
Cultivar (C)
AberMagic AR1201215 a220 a247 a289 a
Expo AR1195180 b167 b204 b265 b
SED6.408.326.4414.3111.30
Significance0.3430.0010.0010.0090.050
Drying method (D)
OD_60195187175 b207242 b
OD_80181188173 b220263 ab
−80_FD206202221 a234296 a
LN_FD209213206 a243307 a
SED9.0511.779.1220.2315.99
Significance0.0290.1200.0010.3290.003
C × D
SED12.8116.6512.8928.6222.61
Significance0.0330.2250.1520.6280.255
OD_60: oven-drying at 60 °C for 48 h, OD_80: oven-drying at 80 °C for 16 h, −80_FD: freezing at −80 °C for 48 h followed freeze-drying, LN_FD: liquid nitrogen followed freeze-drying. Different letters within a column, cultivar, and drying method indicate significant differences according to the Tukey´s Honestly Significant Difference (HSD) test.
Table 2. Crude protein concentration (CP, g kg−1 DM) in AberMagic AR1 and Expo AR1 dried under different procedures in five harvest.
VariableCP (g kg−1 DM)
5 Dec 1715 Mar 1721 Jun 1714 Sep 175 Nov 17
Late SpringAutumnWinterEarly SpringMiddle Spring
Cultivar (C)
AberMagic AR1197 b13814915398.1
Expo AR1211 a14016314699.6
SED6.157.066.188.742.51
Significance0.0430.7440.0460.4390.556
Drying method (D)
OD_60215 a142167160105 a
OD_80223 a146158161100 ab
−80_FD199 ab13315114095.1 ab
LN_FD178 b13414813894.6 b
SED8.719.998.7512.363.55
Significance0.0010.5370.1810.1560.030
C × D
SED12.3114.1312.3717.485.02
Significance0.0840.7090.0060.9000.129
OD_60: oven-drying at 60 °C for 48 h, OD_80: oven-drying at 80 °C for 16 h, −80_FD: freezing at −80 °C for 48 h followed freeze-drying, LN_FD: liquid nitrogen followed freeze-drying. Different letters within a column, cultivar, and drying method indicate significant differences according to the Tukey´s HSD test.
Table 3. Water-soluble carbohydrate (WSC) to crude protein (CP) ratio in AberMagic AR1 and Expo AR1 cultivars dried under different procedures in five harvests.
VariableWSC/CP Ratio
5 Dec 1715 Mar 1721 Jun 1714 Sep 175 Nov 17
Late SpringAutumnWinterEarly SpringMiddle Spring
Cultivar (C)
AberMagic AR11.041.571.47 a1.653.00
Expo AR10.931.301.08 b1.462.67
SED0.0580.1000.0930.1820.170
Significance0.0580.1540.0010.3040.073
Drying method (D)
OD_600.90 b1.331.09 b1.312.33 b
OD_800.81 b1.301.12 ab1.402.63 ab
−80_FD1.04 ab1.521.50 a1.713.13 a
LN_FD1.19 a1.611.39 ab1.793.26 a
SED0.0820.1410.1320.2580.241
Significance0.0010.1200.0180.2190.004
C × D
SED0.1160.2000.1870.3650.341
Significance0.8110.3030.0790.8850.135
OD_60: oven-drying at 60 °C for 48 h, OD_80: oven-drying at 80 °C for 16 h, −80_FD: freezing at −80 °C for 48 h followed freeze-drying, LN_FD: liquid nitrogen followed freeze-drying. Different letters within a column, cultivar, and drying method indicate significant differences according to the Tukey´s HSD test.

